q3 - nordic paper
TRANSCRIPT

Nordic Paper Interim report Q3 2020 1 / 27
Interim report January – September 2020
QUARTERLY RESULTS JULY - SEPTEMBER • Net sales decreased by 19% to SEK 639m (791), excluding currency effects the decrease was 16%
• EBITDA was SEK -13m (153), corresponding to an EBITDA margin of -2.0% (19.4)
• Maintenance stop in Bäckhammar affected the result negatively by MSEK 79 (0). Corresponding cost
in 2019 of SEK 57m charged the fourth quarter.
• IPO costs in the quarter was SEK 10m (0)
• Operating result was SEK -40m (129), corresponding to an operating margin of -6.3% (16.3)
• Net result for the period amounted to SEK -32m (102)
• Cash flow from operating activities was SEK 144m (213)
• Basic and diluted earnings per share were SEK -0.49* (1.52*)
• Return on operating capital was 20.9% (35.3)
SIGNIFICANT EVENTS AFTER THE QUARTER • On extra general meeting on 1 October a split was made of the company’s share 1,400:1
• A dividend of SEK 950m was paid out to the parent company, after which the available credit facilities
amounts to SEK 800m
• The 22 October Nordic Paper’s shares were listed on Nasdaq Stockholm
KEY FIGURES
2020 2019 2020 2019 2019
SEKm Q3 Q3 Δ, % Jan-Sep Jan-Sep Δ, % R 12m Full year
Net sales 639 791 -19 2,233 2,493 -10 2,971 3,231
EBITDA -13 153 -108 314 564 -44 377 629
EBITDA margin, % -2.0 19.4 14.1 22.6 12.7 19.5
Operating result -40 129 -131 235 491 -52 272 530
Operating margin, % -6.3 16.3 10.5 19.7 9.2 16.4
Result for the period -32 102 -131 182 382 -52 212 414
Basic and diluted earnings per share, SEK* -0.49 1.52 2.73 5.71 3.17 6.19
Cash flow from operating activities 144 213 -32 334 442 -24 451
Return on operating capital 12m, % 20.9 35.3 33.7 42.3 33.7 39.4
Net debt/EBITDA 12m, ratio** -0.3 0.0 -0.3 0.0 0.0 0.0
Sales volumes, ktonnes 61 69 -12 203 211 -4 264 272
*Recalculated for the 1,400:1 split of the company’s ordinary shares, which was decided by the extraordinary general meeting on 1 October 2020.
**Negative value because of net cash.
Q3 2020

Nordic Paper Interim report Q3 2020 2 / 27
CEO COMMENT
This interim report is Nordic Paper’s first as a listed company. It is with pride
and joy I can observe that the solid and in moments intense work we have
carried out now has resulted in Nordic Paper’s listing on Nasdaq Stockholm on
22 October. A milestone has been passed and we will make the most out of the
opportunities a listing entails. We continue our efforts to create value to our
customers and from now on also including all 5,000 new shareholders.
STABLE MARKET BUT LOWER PRODUCTION
The market development in the third quarter is in line with the second quarter.
Covid-19 has mitigated demand from the market for greaseproofpaper with
end-user in the professional sector in the countries that have introduced the
hardest restrictions. The demand for kraft paper has continued to be good.
However, market prices were significantly lower than in the third quarter last
year, but stable compared to the second quarter this year.
LOWER PRODUCTION DURING RAMP-UP
In the third quarter maintenance was carried out on our four production units. On most of the mills they are carried out
in connection to the summer holiday stops, with Bäckhammar as an exception where the stop was carried out in
September. All maintenance stops were carried out with comprehensive safety measures due to the pandemic. On three
of our mills, the maintenance work and restart went entirely according to plan, but in Bäckhammar a supplementing
maintenance repairment compared to original plan was carried out. Despite the extra repairment we were able to start
the production according to plan, but initially with lower capacity.
The extended repairment in Bäckhammar meant that the negative effect on the operating result increased by SEK 28m
to SEK 88m compared to the originally estimated SEK 60m. Of the result effect of SEK 88m, 9 will charge the fourth
quarter. Last year the stop in Bäckhammar affected in its entirety the fourth quarter.
PERMIT APPLICATION SUBMITTED
In the quarter we submitted the permit application for increased production capacity in Bäckhammar. The investment of
in total approximately SEK 1,200 consists of three parts and will give opportunity to increase the pulp and paper
production by just over 20 and 10 percent respectively. The first part including a new woodroom with higher capacity is
independent of the permit and will give an increased flexibility regarding raw material supply and decrease our costs. It
will also enable a way to efficiently increase the production at a later stage. The pre-projection of the wood room has
started.
LONG-TERM POSITIVE DEVELOPMENT, BUT SHORT-TERM UNCERTAINTY
The market development we have seen so far in 2020 continues and our market segments has in general appeared
relatively stable. Covid-19 continues to impact our surrounding world and daily life and there is a continued uncertainty.
New shutdowns in several countries will mean that the trend we have seen since April, with lower demand of
greaseproofpaper with end-user in the professional sector continues. However, it is gratifying to see that the interest
from our customers to replace packaging in plastic by our material increases. We have a number of on-going interesting
projects together with our customers where we examine opportunities to new applications for our products.
It is with confidence and joy I welcome all new shareholders onboard and together with me and Nordic Paper’s
competent employees continue the journey of producing sustainable products and creating good profitability.
Anita Sjölander
CEO

Nordic Paper Interim report Q3 2020 3 / 27
GROUP PERFORMANCE
CHANGE IN NET SALES Q3 2019, SEKm 791
Sales volume and product mix -9%
Selling price -7%
Currency -3%
Q3 2020, SEKm 639
Q3 and Q4 2019 was affected by maintenance
stops normally carried out in Q3 was moved to Q4.
See information about seasonality in page 10.
JULY - SEPTEMBER
MARKET AND SALES
The market development continued in the third quarter in line with the
second quarter. Covid-19 affected primarily the professional market for
greaseproofpaper in the countries with the most extensive restrictions.
The demand in Natural Greaseproof has shifted from products in
professional businesses to products towards retail. Prices were lower, in
particular for kraft paper, compared to a very strong market situation in
the beginning of last year.
Net sales in the third quarter declined by 19% to SEK 639m (791).
Primarily lower volumes gave a negative effect by 9%. The lower
volumes are mainly due to a slower ramp-up of the production after the
annual maintenance stop in Bäckhammar, when a supplementing
maintenance repairment not included in the original plan was carried
out. The production started according to plan, but initially to a lower
capacity. The net sales have in addition been affected by lower demand
in Natural Greaseproof. Lower price levels had a negative effect of 7%.
The stronger SEK rate mainly to USD gave a negative currency effect of
3%. Middle East & Africa increased net sales, while the other
geographical areas had lower net sales compared to last year.
RESULTS
EBITDA decreased to SEK -13m (153). Lower volumes and prices gave
negative effects on the result. The lower volumes depending on the
ordinary maintenance stop and the extra repairment in Bäckhammar
affected the result negatively by SEK 79m in the quarter. Last year’s cost
of approximately SEK 57m related to the maintenance stop charged the
fourth quarter. Costs related to the listing process was SEK 10m (0).
Lower pulp prices impacted the result positively. The EBITDA margin
declined by -2.0% compared to 19.4% the same period last year.
The total negative impact on EBITDA as well as operating result due to
the ordinary maintenance stops including the additional maintenance
repairment in Bäckhammar amounted to SEK 133m. Original expected
negative effect on the result was estimated to SEK 105m. In the third
quarter the effect was SEK 124m and approximately SEK 9 million will
affect the fourth quarter. The increased negative effect on the operating
result is mainly due lower sales.
Operating result declined to SEK -40m (129) and the operating margin
was -6.3% (16.3). Net profit for the period amounted to SEK -32m (102).
0
200
400
600
800
1000
Q4 Q12019
Q2 Q3 Q4 Q12020
Q2 Q3
NET SALES, SEKm
65%
12%
15%
9%
NET SALES PER GEOGRAPHY
EuropeAmericasAsia&PacificMiddle East & Africa
-5
0
5
10
15
20
25
-50
0
50
100
150
200
250
Q4 Q12019
Q2 Q3 Q4 Q12020
Q2 Q3
EBITDA
EBITDA, SEKm EBITDA margin, %

Nordic Paper Interim report Q3 2020 4 / 27
FINANCIAL NET AND TAX
Net financial items for the third quarter was SEK 0m (1) of which
interest net was -1 (-4). Tax cost for the third quarter was SEK 8m (-29).
CHANGE IN NET SALES
Jan-Sep 2019, SEKm 2,493
Sales volume and product mix 3%
Selling price -8%
Currency 0%
Jan-Sep 2020, SEKm 2,233
JANUARY – SEPTEMBER
MARKET AND SALES
Net sales for the first nine months of this year declined by 10% to SEK
2,233m (2,493) compared to the same period last year, mainly due to
lower sales prices. The negative price effect was 8%, while volume and
product mix impacted negatively by 3%. Covid-19 has had some effect
from April and forward and has meant an impact on the product mix,
primarily within Natural Greaseproof. The prices of kraft paper has in the
period been on a significantly lower level than in the same period last
year, when the very high pulp prices pushed up the kraft paper prices.
RESULTS
EBITDA decreased by 44% to SEK 314m (564) and the EBITDA margin was
14.1% (22.6). The lower market prices in the period were partly offset by
lower pulp and energy costs, mainly affecting the margin for Natural
Greaseproof positively. Kraft Paper’s margin has decreased, mainly due to
negative price development.
The annual planned maintenance stop in Bäckhammar was carried out in
the third quarter, unlike last year when it was carried out in the fourth
quarter. It was followed by a slower ramp-up of the production than
planned. In May a comprehensive unplanned stop in the pulp production
in Bäckhammar in May. The aggregated negative effect on EBITDA as well
as the operating result was SEK 99m. Costs related to the listing process
was SEK 22m (0) in the period.
The operating result totalled SEK 235m (491). The profit for the period
was SEK 182m (382) and basic and diluted earnings per share was SEK 2.73
(5.71).
FINANCIAL NET AND TAX
Net financial items for the nine-month period was SEK -1m (-1) of which
interest net was -4(-9). Tax cost for the period totalled SEK 51m (107),
corresponding to a tax rate of 21.8% (21.8).

Nordic Paper Interim report Q3 2020 5 / 27
CASH FLOW AND FINANCIAL POSITION
CASH FLOW AND WORKING CAPITAL
Cash flow from operating activities declined to SEK 144m (213) for the
third quarter. The decrease in net working capital contributed positively to
the cash flow by SEK 184m (78) in the quarter.
Net working capital on 30 September was SEK 355m (442). Net working
capital as a percentage of net sales the last 12-month period was 16.1%
(16.0).
INVESTMENTS AND OPERATING CAPITAL
Investments in the quarter was SEK 37m (33). Operating capital on the 30
September totalled SEK 1,179m (1,289). Return on operating capital for
the last 12-month period was 20.9% (35.3).
FINANCING
At 30 September 2020, the group had an interest-bearing net cash of
SEK 114m (6). Interest-bearing debt amounted to SEK 344m (324), an
increase compared to the same date last year. Debt to parent company
regarding at the annual general meeting decided dividend of SEK 150m is
included. Of the SEK 344m are 16 attributable to IFRS 16 leasing liabilities.
The total cash position was SEK 458m (329). In addition, the company has
overdraft facilities of SEK 200m (200) available. The debt/equity ratio was
55.5% (54.0) and the net debt/EBITDA ratio was -0.3 (0.0).
In September the company entered into an agreement regarding a credit
facility that in October been partly used to finance the dividend of SEK
950m to the previous principal owner. Available for potential future
financing requirements remains SEK 800m including the undrawn
committed credit facilities.
HEDGING OF EXCHANGE RATES
The Group hedges parts of future estimated net flows in foreign currencies
according to the finance policy, approximately 50-75% for the coming 6
months period and 25-50% for the 7-12 month period. EBITDA for the
third quarter includes an earnings effect from currency hedges of SEK 10m
(-9). For the coming 12 months the hedges are described as follows.
Currency Average rate of
derivatives FX rate, 31 Sep
Total FX, m
Total, SEKm
Fair value, net, SEKm
EUR 10.62 10.56 43 451 3
USD 9.32 9.00 12 107 4
GBP 12.08 11.58 7 81 3
640 10
0
50
100
150
200
250
Q12019
Q2 Q3 Q4 Q12020
Q2 Q3
CASH FLOW FROM OPERATING ACTIVITES, SEKm
0
10
20
30
0
200
400
600
Q12019
Q2 Q3 Q4 Q12020
Q2 Q3
WORKING CAPITAL
Working capital, end of period, SEKWorking capital, % of net sales, 12m
0
10
20
30
40
50
0
300
600
900
1200
1500
Q12019
Q2 Q3 Q4 Q12020
Q2 Q3
OPERATING CAPITAL
Operating capital, SEKmReturn on operating capital 12m, %

Nordic Paper Interim report Q3 2020 6 / 27
SEGMENT KRAFT PAPER Segment Kraft Paper produces unbleached sack paper, MG paper and different kind of specialty paper of high
quality for industrial usage. Examples of applications for the MG and sack paper are sacks and bags for food
and construction materials, and masking and protection paper for different applications. The specialty papers
can be used as components in production of laminates, in stainless steel production, and in electrical transformers.
The mills in Bäckhammar and Åmotfors belongs to this segment. The segment also sells a certain amount of pulp.
2020 2019 2020 2019 2019
SEKm Q3 Q3 Δ, % Jan-Sep Jan-Sep Δ, % R 12m Full year
Net sales 361 469 -23 1,252 1471 -15 1,636 1,855
EBITDA -17 148 -111 186 484 -62 206 504
EBITDA margin, % -4.7 31.6 14.9 32.9 12.6 27.2
Operating result -31 135 -123 147 447 -67 155 455
Operating margin, % -8.6 28.8 11.7 30.4 9.5 24.5
Sales volumes, ktonnes 46 54 -14 152 160 -5 196 204
CHANGE IN NET SALES
Q3 2019, SEKm 469
Sales volume and product mix -12%
Selling price -9%
Currency -2%
Q3 2020, SEKm 361
Q3 and Q4 2019 was affected by maintenance stops
normally carried out in Q3 was moved to Q4. See
information about seasonality on page 10.
JULY - SEPTEMBER
MARKET AND SALES
Market conditions for Nordic Paper’s kraft paper continued to be healthy on
the demand side. Weaker market conditions in sack paper for the cement
and construction industry outside Europe increased the competition in
Nordic Paper’s main market Europe. All product groups, but in particular
sack paper, showed weaker price development compared to a strong
market situation in the third quarter last year. The price level of sack paper
has stabilised on corresponding level as in the second quarter 2020.
Net sales for the third quarter decreased by 23% to SEK 361m (469).
Volume and mix had a negative effect on net sales of 12%. The volume
decline is mainly related to the slower production start after the
maintenance stop in Bäckhammar. A supplementing maintenance
repairment compared to the original plan was carried out. The production
was restarted according to plan, but initially to a lower capacity. In 2019 the
maintenance stop was as carried out in the fourth quarter. The significantly
lower prices had a negative impact by 9% and currency impacted negatively
by 2%. In Middle East & Africa net sales development were positive, while
Europe and Asia saw declining net sales.
RESULTS
EBITDA decreased to SEK -17m (148), mainly due to negative price
performance, but also due to the lower volumes. The EBITDA margin
decreased to -4.7% (31.6). The operating result was SEK -31m (135) and the
operating margin was -8.6% (28.8). The total negative effect of the
operating result due to the lower production rate in the ramp-up amounted
to SEK 88m, compared to the originally expected negative result effect of
approximately SEK 60m. Of the increase, SEK 19m affected the third quarter
and SEK 9m will affect the fourth quarter. The negative effect of the
operating result is mainly related to reduced sales. Last year the stop in
Bäckhammar was carried out in the fourth quarter and affected the
operating result by SEK 57m.
0
200
400
600
Q4 Q12019
Q2 Q3 Q4 Q12020
Q2 Q3
NET SALES, SEKm
56%
SHARE OF GROUP'S NET SALES Q3 2020
-10
0
10
20
30
40
-50
0
50
100
150
200
Q4 Q12019
Q2 Q3 Q4 Q12020
Q2 Q3
EBITDA
EBITDA, SEKm EBITDA margin, %

Nordic Paper Interim report Q3 2020 7 / 27
JANUARY – SEPTEMBER Net sales for the first nine months declined by 15% to SEK 1,252m (1,471),
primarily due to a negative price development of 11%, and negative volume
and mix effect of 4%. EBITDA decreased by 62% to SEK 186m (484) and the
EBITDA margin declined to 14.9% (32.9). The operating profit was SEK 147m
(447) and the operating margin was 11.7% (30.4). .

Nordic Paper Interim report Q3 2020 8 / 27
SEGMENT NATURAL GREASEPROOF Segment Natural Greaseproof produces premium, natural greaseproof paper for the food industry.
Greaseproof paper is used in the preparation, production, packaging and storage of food, for instance in
baking cups, baking papers, food containers for ready meals, and barrier papers for wrapping meat, butter
and other fatty foods. The mills in Greåker and Säffle belongs to this segment.
2020 2019 2020 2019 2019
SEKm Q3 Q3 Δ, % Jan-Sep Jan-Sep Δ, % R 12m Full year
Net sales 286 330 -13 1,009 1,049 -4 1,377 1,412
EBITDA 2 15 -87 143 116 23 198 171
EBITDA margin, % 0.6 4.5 14.2 11.1 14.4 12.1
Operating result -7 6 -217 117 91 29 162 136
Operating margin, % -2.4 1.8 11.6 8.7 11.8 9.6
Sales volumes, ktonnes 15 16 -5 51 50 1 68 68
CHANGE IN NET SALES Q3 2019, SEKm 330
Sales volume and product mix -5%
Selling price -5%
Currency -4%
Q3 2020, SEKm 286
JULY - SEPTEMBER
MARKET AND SALES
Covid-19 har primarily affected the demand for Natural Greaseproof’s
products in countries with comprehensive shutdowns negatively. The shift
from products in professional businesses to products addressed toward
retail that started in the first quarter, has continued.
Net sales for the third quarter decreased by 13% to SEK 286m (330).
Volume and mix and price had a negative impact on net sales of 5% each.
Products from the retail sector has to a certain extent compensated the
volume decrease from the professional sector. The price decrease reflects
a strong market situation in the same period last year. Currency effects
had a negative effect of 4%. Middle East & Africa had positive sales
performance, while the other geographical areas had declining sales
compared to last year.
RESULTS
EBITDA declined to SEK 2m (15), mainly because of weaker sales and
negative price development. The EBITDA-margin decreased to 0.6% (4.5).
Operating result was SEK -7m (6) and the operating margin was -2.4%
(1.8).
JANUARY – SEPTEMBER Net sales in the first nine months was SEK 1,009m (1,049). The sales
volumes stayed at the level as last year and the decrease of 4% is due to
negative price development. EBITDA increased by 23% to SEK 143m (116),
mainly due to lower raw material costs. The EBITDA margin increased to
14.2% (11.1). The operating profit improved to SEK 117m (91) and the
operating margin to 11.6% (8.7).
0
100
200
300
400
Q4 Q12019
Q2 Q3 Q4 Q12020
Q2 Q3
NET SALES, SEKm
44%
SHARE OF GROUP'S NET SALES Q3 2020
0
5
10
15
20
25
0
25
50
75
100
Q4 Q12019
Q2 Q3 Q4 Q12020
Q2 Q3
EBITDA
EBITDA, SEKm EBITDA margin, %
Nordic Paper Interim report Q3 2020 9 / 27
SUSTAINABILITY
Nordic Paper strives to integrate sustainability as a natural part of the daily work. The company has chosen
three focus areas, sustainable work environment, responsible production and sustainable business behaviour.
Reporting related to these focus areas are included in the interim reports.
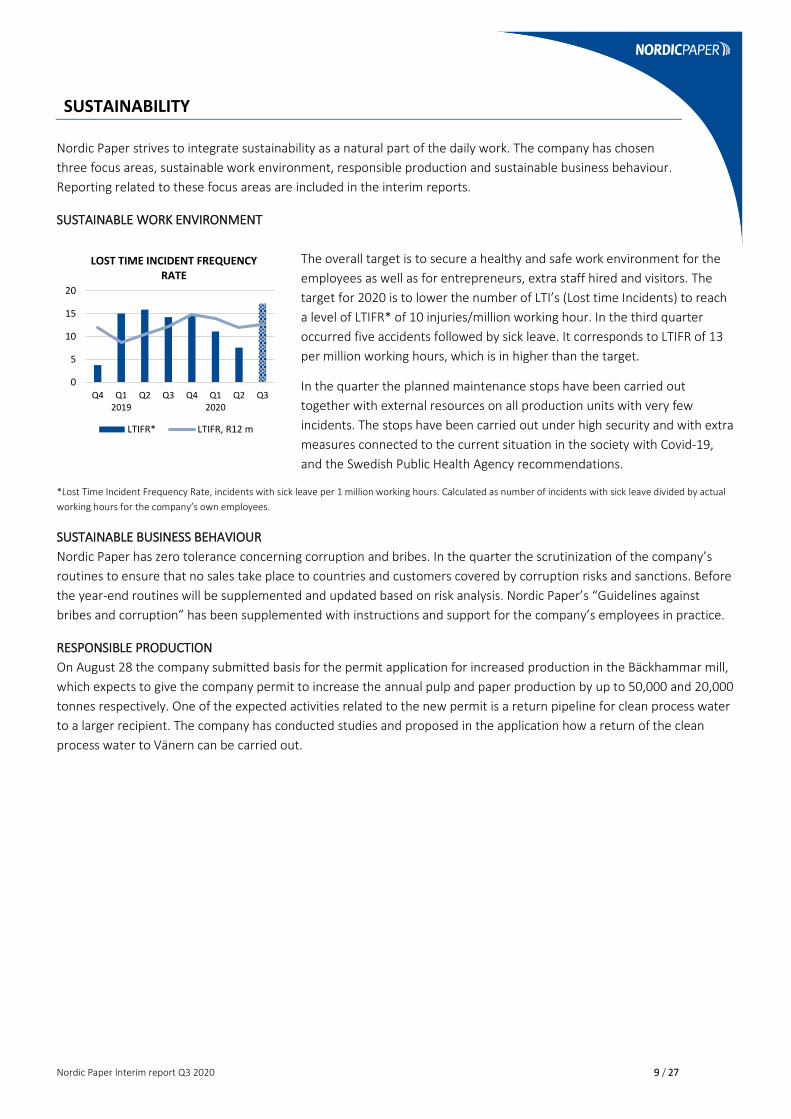
SUSTAINABLE WORK ENVIRONMENT
The overall target is to secure a healthy and safe work environment for the
employees as well as for entrepreneurs, extra staff hired and visitors. The
target for 2020 is to lower the number of LTI’s (Lost time Incidents) to reach
a level of LTIFR* of 10 injuries/million working hour. In the third quarter
occurred five accidents followed by sick leave. It corresponds to LTIFR of 13
per million working hours, which is in higher than the target.
In the quarter the planned maintenance stops have been carried out
together with external resources on all production units with very few
incidents. The stops have been carried out under high security and with extra
measures connected to the current situation in the society with Covid-19,
and the Swedish Public Health Agency recommendations.
*Lost Time Incident Frequency Rate, incidents with sick leave per 1 million working hours. Calculated as number of incidents with sick leave divided by actual
working hours for the company’s own employees.
SUSTAINABLE BUSINESS BEHAVIOUR
Nordic Paper has zero tolerance concerning corruption and bribes. In the quarter the scrutinization of the company’s
routines to ensure that no sales take place to countries and customers covered by corruption risks and sanctions. Before
the year-end routines will be supplemented and updated based on risk analysis. Nordic Paper’s “Guidelines against
bribes and corruption” has been supplemented with instructions and support for the company’s employees in practice.
RESPONSIBLE PRODUCTION
On August 28 the company submitted basis for the permit application for increased production in the Bäckhammar mill,
which expects to give the company permit to increase the annual pulp and paper production by up to 50,000 and 20,000
tonnes respectively. One of the expected activities related to the new permit is a return pipeline for clean process water
to a larger recipient. The company has conducted studies and proposed in the application how a return of the clean
process water to Vänern can be carried out.
0
5
10
15
20
Q4 Q12019
Q2 Q3 Q4 Q12020
Q2 Q3
LOST TIME INCIDENT FREQUENCY RATE
LTIFR* LTIFR, R12 m

Nordic Paper Interim report Q3 2020 10 / 27
OTHER
EVENTS AFTER THE QUARTER
At the extraordinary general meeting on 1 October 2020, it was decided to split the company’s ordinary shares by
1,400:1, and to pay an additional dividend of SEK 800 million to the parent company. A total of SEK 950 million has thus
been paid to the parent company as of the 19 October. The dividend was financed in its entirety by the financing
agreement the company has entered into. Net debt as of 30 September 2020 adjusted for paid out dividend is SEK 686m
and total available unutilised credit facilities amounts to SEK 800m.
On October 22 Nordic Paper’s shares were admitted to trading on Nasdaq Stockholm.
SEASONAL EFFECTS
Nordic Paper’s has to a certain extent seasonal variation during the financial year. The business is impacted
primarily by planned production shutdowns in the individual units when maintenance activities are carried out.
The operating profit is negatively impacted by mainly external costs, but also by somewhat lower deliveries. Normally
the inventory levels are increased in the second quarter to be able to deliver to the customers during the production
shutdowns. Estimated effect on operating profit in a quarter with a planned production shutdown is an estimated
result effect in relation to a quarter without production shutdown.
Effect on operating profit, SEKm Effects, quarter
Kraft Paper Natural Greaseproof 2020 2019 2018
Estimated Actual Estimated Actual
Bäckhammar ~60 88 3/4 4 3
Åmotfors ~10 10 3 3 3
Säffle ~25 25 3 3 3
Greåker ~10 10 3 3 3
The ramp-up of the production rate in connection to the annual maintenance stop in Bäckhammar 2020, was slower
than planned due to a supplementary maintenance repairment. The total negative impact on operating profit was SEK
88m compared to the original expected negative result effect of SEK 60m. SEK 79m affected the third quarter and
SEK 9m will affect the fourth quarter. The increased negative impact on the operating profit is mainly related to lower
sales. It means that the total negative effect on EBITDA as well as the operating result due to the ordinary maintenance
stops and the additional maintenance repairment in 2020 was SEK 133m, compared to the original expected negative
result effect of SEK 105m.
Sales in December is normally somewhat negatively affected as a consequence of lower access to transportations in
connection to Christmas and New Year holiday. The effect is increased inventory levels at year-end and a postponing of
sales to the first quarter the following year.
RISKS AND RISK MANAGEMENT
Nordic Paper is exposed to strategic, operative, financial and legal and regulatory risks that may significantly
affect the company. Awareness of risks and mitigation of risks is a part of the daily activities and is reviewed
and reported to the management, audit committee and to the Board. These risks include, inter alia, the following
industry- and business-related risks:
• Covid-19 has so far not had any effect on Nordic Paper’s production capabilities and no material effect on
Nordic Paper’s financial condition. Nordic Paper experiences that the pandemic has a negative impact on
demand in countries where lockdown is implemented or has been implemented, such as the United States,
United Kingdom and Italy, and the Company has therefore implemented certain production restrictions in the
Natural Greaseproof segment and it cannot be ruled out that such measures may also need to be taken in the
future. In regard to greaseproof paper, there has also been some shift in the demand, i.e. from the

Nordic Paper Interim report Q3 2020 11 / 27
professional food service sector to the consumer driven retail sector. When viewing the operations as
a whole, the experienced decrease in demand is limited and has thus not had a material effect on Nordic
Paper’s financial condition. However, it cannot be ruled out that Covid-19, including any potential second
wave of the pandemic, or any related measures taken to combat its spread, may in the future, have an
impact that proves to be materially adverse to Nordic Paper’s financial condition and results of operations.
• Nordic Paper operates in competitive markets and is subject to competition regarding both the pricing and
quality of its products, whereby it could fail to compete successfully.
• Macroeconomic factors and trends in various markets, such as food and industrial, could lead to
variations in demand and pricing of Nordic Paper’s products.
• Cost of input goods and services used by Nordic Paper for production vary over time and could adversely
affect Nordic Paper’s operations.
• Long term relationships with agents and customers could be impacted if such agents and/or customers face
difficulties or if such relationships deteriorate.
• Damages to production equipment and other disruptions in production could lead to temporary
cessation of one or several of Nordic Paper’s production units.
• Nordic Paper is dependent on IT systems for its ongoing operations and disruptions or errors in critical
systems could lead to disruptions in production and important business processes.
• An inefficient implementation of strategic plans, erroneous investment decisions, failure in
establishing commitment for adopted strategies and risks relating to acquisitions and integration
could adversely affect Nordic Paper’s operations.
• Nordic Paper is exposed to currency risks due to transactions performed in currencies other than SEK
and due to foreign subsidiaries in the Group.
• Nordic Paper’s operations are exposed to environmental risks and must comply with various environ-
mental regulations.
• Nordic Paper’s operations are exposed to risks related to sanctions, corruption and competition.
• Nordic Paper’s operations are exposed to health and safety risks and must comply with various work-related
health and safety regulations.
A more comprehensive description of the risks is provided in Nordic Papers’ Listing prospectus available on www.nordic-
paper.com.
TRANSACTIONS WITH RELATED PARTIES
During the quarter Nordic Paper acquired services to an amount of SEK 2m (1) from the parent company Sutriv Holding
and acquired energy to the amount of SEK 7m (9) and sold services and consumable to Åmotfors Energi AB to an amount
of SEK 1m (2). The transactions were conducted on market conditions.
28 October, 2020
Nordic Paper Holding AB
Anita Sjölander
CEO

Nordic Paper Interim report Q3 2020 12 / 27
AUDITOR’S REPORT
Nordic Paper Holding AB reg. no. 556914-1913
INTRODUCTION
We have reviewed the condensed interim financial information (interim report) of Nordic Paper Holding AB as of 30
September 2020 and the nine-month period then ended. The board of directors and the CEO are responsible for the
preparation and presentation of the interim financial information in accordance with IAS 34 and the Swedish Annual
Accounts Act. Our responsibility is to express a conclusion on this interim report based on our review.
SCOPE OF REVIEW
We conducted our review in accordance with the International Standard on Review Engagements ISRE 2410, Review of
Interim Report Performed by the Independent Auditor of the Entity. A review consists of making inquiries, primarily of
persons responsible for financial and accounting matters, and applying analytical and other review procedures. A review
is substantially less in scope than an audit conducted in accordance with International Standards on Auditing, ISA, and
other generally accepted auditing standards in Sweden. The procedures performed in a review do not enable us to
obtain assurance that we would become aware of all significant matters that might be identified in an audit.
Accordingly, we do not express an audit opinion.
CONCLUSION
Based on our review, nothing has come to our attention that causes us to believe that the interim report is not prepared,
in all material respects, in accordance with IAS 34 and the Swedish Annual Accounts Act, regarding the Group, and with
the Swedish Annual Accounts Act, regarding the Parent Company.
Stockholm, 28 October 2020
Öhrlings PricewaterhouseCoopers AB
Martin Johansson
Authorized Public Accountant

Nordic Paper Interim report Q3 2020 13 / 27
Group
CONDENSED INCOME STATEMENT
2020 2019 2020 2019 2019
SEKm Q3 Q3 Jan-Sep Jan-Sep Full year
Net sales* 639 791 2,233 2,493 3,231
Change in inventories -50 -57 -55 -50 -30
Other operating income 13 5 13 17 21
Raw materials and consumables -258 -291 -911 -1,029 -1,368
Other external costs -249 -187 -599 -500 -713
Personnel costs -107 -105 -359 -347 -477
Depreciation and amortisation -27 -24 -79 -73 -99
Other operating costs -2 -2 -7 -20 -34
Operating result -40 129 235 491 530
Financial income 2 5 5 8 3
Financial costs -2 -4 -6 -9 -14
0 1 -1 -1 -11
Result before tax -41 130 234 490 519
Tax 8 -29 -51 -107 -105
Result for the period -32 102 182 382 414
Profit attributable to:
Owners of the parent company -32 102 182 382 414
Non-controlling interests - - - - -
Net result for the period -32 102 182 382 414
Basic and diluted earnings per share, SEK** -0.49 1.52 2.73 5.71 6.19
*Net sales consist in entirety of sales of goods.
**The number of shares and the amounts for all periods are recalculated for the 1,400:1 split of the company’s ordinary shares, which was
decided by the extraordinary general meeting on 1 October 2020.

Nordic Paper Interim report Q3 2020 14 / 27
CONDENSED COMPREHENSIVE INCOME
2020 2019 2,020 2019 2019
SEKm Q3 Q3 Jan-Sep Jan-Sep Full year
Result for the period -32 102 182 382 414
Items that will be reclassified to profit or loss
Change in fair value of cash flow hedges -7 -13 -1 -22 11 Exchange differences on translation of foreign operations -3 0 -18 11 4 Tax attributable to items that have been or may be reclassified to profit or loss -2 3 0 5 -2
Items that will not be reclassified to profit or loss
Actuarial gains and losses on defined benefit plans - 0 - - 2
Other comprehensive income for the period -12 -10 -19 -7 14
Comprehensive income for the period -44 91 164 375 428
Comprehensive income attributable to:
Parent company’s shareholders -44 91 164 375 428

Nordic Paper Interim report Q3 2020 15 / 27
CONDENSED BALANCE SHEET
2020 2019 2019
SEKm 30 Sep 30 Sep 31 Dec
Goodwill 343 343 343
Other intangible assets 1 2 2
Buildings and land 58 72 68
Machinery and plant 479 477 498
Equipment, tools, fixtures and fittings 4 4 6
Right of use assets 17 14 12
Construction in progress 81 74 62
Deferred tax assets 7 4 6
Total non-current assets 990 990 998
Inventories 409 460 470
Accounts receivables 375 503 402
Income tax receivables 13 0 14
Other operating receivables 78 54 74
Derivatives 12 1 17
Prepaid expenses and acrrued revenue 9 9 15
Cash and cash equivalents 458 329 247
Total current assets 1,354 1,357 1,238
Total assets 2,344 2,347 2,236
Share capital 19 19 19
Reserves -32 -34 -13
Retained earnings including profit of the year 1,314 1,281 1,282
Total equity 1,301 1,267 1,288
Lease liabilities 8 8 7
Provisions for pension - 13 2
Deferred tax liabilities 165 143 169
Other liabilities and provisions 24 10 22
Total non-current liabilities 197 174 200
Factoring credit-line 178 222 184
Liabilities to parent 150 76 41
Accounts payables 290 308 262
Liabilities to associated companies 1 0 3
Income tax liability - 63 48
Lease liabilities 8 7 6
Derivatives 3 28 7
Other liabilities 11 10 14
Accrued expenses and deferred income 206 193 183
Total current liabilities 846 906 748
Total equity and liabilities 2,344 2,347 2,236
Nordic Paper Interim report Q3 2020 16 / 27
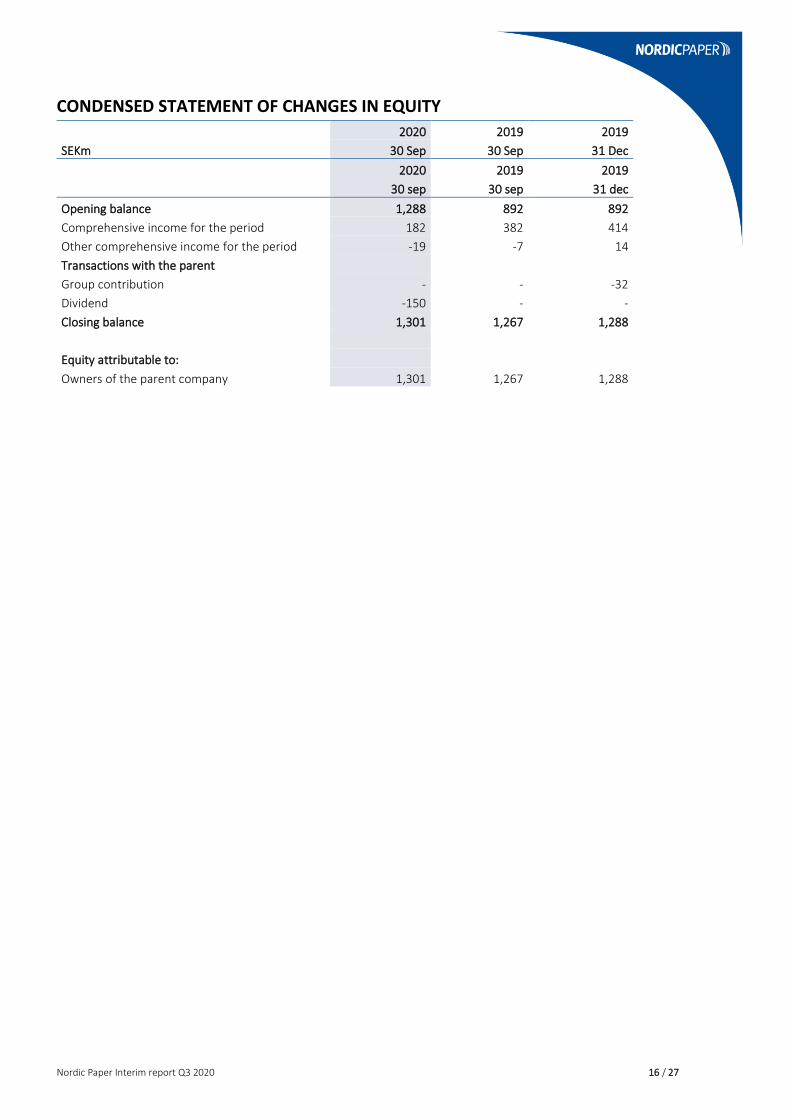
CONDENSED STATEMENT OF CHANGES IN EQUITY
2020 2019 2019
SEKm 30 Sep 30 Sep 31 Dec
2020 2019 2019
30 sep 30 sep 31 dec
Opening balance 1,288 892 892
Comprehensive income for the period 182 382 414
Other comprehensive income for the period -19 -7 14
Transactions with the parent
Group contribution - - -32
Dividend -150 - -
Closing balance 1,301 1,267 1,288
Equity attributable to:
Owners of the parent company 1,301 1,267 1,288

Nordic Paper Interim report Q3 2020 17 / 27
CONDENSED CASH FLOW
2020 2019 2020 2019 2019
SEKm Q3 Q3 Jan-Sep Jan-Sep Full year
Operating activities
Operating result -40 129 235 491 530
Interest income 0 0 0 0 1
Interest cost -1 -4 -4 -9 -12
Adjustments for non-cash items 22 30 75 67 121
Paid income tax -21 -22 -100 -103 -90
Cash flow from operating activities before changes in working capital -41 134 205 447 550
Cash flow from changes in working capital
Changes in inventories 62 54 50 14 3
Change in operating receivables 75 11 15 18 73
Change in operating liabilities 47 13 64 -38 -175
Cash flow from operating activities 144 213 334 442 451
Investing activities
Acquisitions of non-current tangible asset -37 -33 -71 -69 -100
Cash flow from investing activities -37 -33 -71 -69 -100
Financing activities
Net change in factoring credit line 29 8 -7 20 -18
Net change of credit facility - - - -65 -65
Group contribution paid out - - -41 - -11 Payment related to amortisation of lease liabilities -2 -2 -7 -6 -8
Cash flow from financing activities 26 6 -55 -52 -103
Cash flow for the period 133 186 209 321 247
Opening cash and cash equivalents 324 138 247 0 0 Currency translation in cash and cash equivalents 1 5 3 8 0
Closing cash and cash equivalents 458 329 458 329 247
Adjustments for non-cash items
Depreciations 27 22 79 73 99
Currency translation effects -9 4 -3 -8 20
Derivatives, changes in fair value 7 -13 1 16 -13
Others -4 16 -3 -14 15
Total 22 30 75 67 121
ACCOUNTING POLICIES The interim report is prepared in accordance to IAS 34 Interim Financial Reporting as well as applicable parts of the
Annual Accounts Act. The interim report for the parent company is prepared in accordance to the Annual Accounts Act
(1995:1554) and Swedish Financial Reporting Board RFR 2 Accounting rules for legal entities. The accounting principles
applied when preparing the interim report are the same for all periods and corresponds to the accounting principles and
conditions presented in Note 1 in the Annual report 2019.

Nordic Paper Interim report Q3 2020 18 / 27
QUARTERLY DATA PER SEGMENT NET SALES 2018 2019 2020
SEKm Q4 Q1 Q2 Q3 Q4 Q1 Q2 Q3
Segment Kraft Paper 386 518 484 469 383 455 436 361
Segment Natural Greaseproof 350 374 345 330 363 381 342 286
Eliminations -10 -11 -8 -8 -9 -9 -12 -8
Total Group 725 881 821 791 738 827 767 639
EBITDA 2018 2019 2020
SEKm Q4 Q1 Q2 Q3 Q4 Q1 Q2 Q3
Segment Kraft Paper 74 178 158 148 20 111 93 -17
Segment Natural Greaseproof 45 51 51 15 55 76 66 2
Parent company and not distributed items -15 -14 -17 -11 0 -59 43 -10
Eliminations etc - 2 2 2 -10 46 -48 13
EBITDA total Group 104 217 193 153 65 174 154 -13
Depreciation and amortisation -23 -24 -25 -24 -25 -26 -26 -27
Operating result 81 193 169 129 40 148 128 -40
Financial income 12 3 0 5 -8 10 0 2
Financial costs -6 -3 -2 -4 -3 -1 -10 -2
Profit before tax 87 193 167 130 29 157 118 -41
EBITDA MARGIN 2018 2019 2020
% Q4 Q1 Q2 Q3 Q4 Q1 Q2 Q3
Segment Kraft Paper 19.1 34.3 32.7 31.5 5.3 24.3 21.2 -4.8
Segment Natural Greaseproof 12.9 13.5 14.7 4.4 15.1 20.0 19.2 0.6
Group 14.3 24.6 23.6 19.4 8.8 21.1 20.1 -2.0
OPERATING RESULT 2018 2019 2020
SEKm Q4 Q1 Q2 Q3 Q4 Q1 Q2 Q3
Segment Kraft Paper 61 166 146 135 8 98 80 -31
Segment Natural Greaseproof 36 42 42 6 45 67 57 -7
Parent company and not distributed items -15 -14 -17 -11 0 -59 43 -10
Eliminations etc -2 -2 -2 -2 -14 42 -52 8
Total Group 81 193 169 129 40 148 128 -40
OPERATING MARGIN 2018 2019 2020
% Q4 Q1 Q2 Q3 Q4 Q1 Q2 Q3
Segment Kraft Paper 15.9 32 30.1 28.9 2.1 21.6 18.3 -8.6
Segment Natural Greaseproof 10.4 11.3 12.2 1.9 12.5 17.5 16.5 -2.4
Group 11.2 21.9 20.6 16.3 5.4 17.9 16.7 -6.3
SALES VOLUMES 2018 2019 2020
ktonnes Q4 Q1 Q2 Q3 Q4 Q1 Q2 Q3
Segment Kraft Paper 42 55 52 54 44 54 52 46
Segment Natural Greaseproof 17 18 16 16 17 19 17 15
Total Group 59 73 68 69 61 73 69 61

Nordic Paper Interim report Q3 2020 19 / 27
FAIR VALUES OF FINANCIAL ASSETS AND LIABILITIES
2020 2019 2019
SEKm 30 Sep 30 Sep 31 Dec
Financial assets valued at cost Carrying
value Fair value Carrying
value Fair value Carrying
value Fair value
Accounts receivables 379 379 503 503 402 402
Other receivables 78 78 54 54 74 74
Cash at bank and on hand 458 458 329 329 247 247
Total 915 915 886 886 723 723
Financial liabilities valued at cost
Factoring credit line 177 177 222 222 184 184
Lease liabilities 17 17 14 14 13 13
Liabilities to associated companies 1 1 0 0 3 3
Liabilities to parent company 150 150 76 76 41 41
Accounts payable 294 294 308 308 262 262
Used credit line - - - - - -
Other liabilities 215 215 203 203 197 197
Total 854 854 823 823 700 700
Derivatives used for hedging
Current assets
Cash flow hedges 12 12 1 1 17 17
Current liabilities
Cash flow hedges 3 3 28 28 7 7
CALCULATION OF FAIR VALUE
Nordic Paper Group has derivatives that is valued at fair value according to level 2 in the fair-value hierarchy. Other
financial instruments have short duration and fair value is assessed to be equivalent to disclosed value. For further
information, please see note 22 in the Annual report 2019.

Nordic Paper Interim report Q3 2020 20 / 27
CURRENCY EFFECTS, FINANCIAL INCOME AND COSTS
2020 2019 2020 2019 2019
SEKm Q3 Q3 Jan-Sep Jan-Sep Full year
Other operating income
Compensation for CO2 tax 0 1 1 5 6 Translation effect, net from revaluation of derivatives 10 - 1 - -
Sale of surplus energy, bi-products etc 3 3 8 11 15
Others 1 0 2 0 0
Total 13 5 13 17 21
Other operating costs
Fair value, losses from cash flow hedges - -9 3 -37 -49 Translation effect net from revaluation of operating receivables and liabilities -2 7 -10 17 15
Result from disposal of fixed assets - 0 - 0 -
Total -2 -2 -7 -20 -34
Financial income
Interest income - 0 0 0 0
Foreign realised exchange rate profits 2 - 5 0 0
Foreign unrealised exchange rate profits - 5 0 8 2
Total 2 5 5 8 3
Financial costs
Interest costs -1 -4 -4 -9 -11
Foreign unrealised exchange rate losses -1 0 -2 - -2
Total -2 -4 -6 -9 -14

Nordic Paper Interim report Q3 2020 21 / 27
KEY FIGURES
2020 2019 2020 2019 2019
SEKm Q3 Q3 Jan-Sep Jan-Sep Full year
Net sales growth, % -19 10 -10 8 6
EBITDA margin, % -2.0 19.4 14.1 22.6 19.5
Operating margin, % -6.3 16.3 10.5 19.7 16.4
Cash flow from operating activities 144 213 334 442 451
Cash conversion, % 96.6 132.5 87.6
Return on operating capital 12m, % 20.9 35.3 39.4
Return on equity 12m, % 15.9 40.9 35.8
Working capital 355 442 442
Operating capital 1,179 1,289 1,271
Interest-bearing debts 344 324 238
Net debt /equity, %* -8.8 -0.4 -0.7
Net debt / EBITDA 12m, ratio* -0.3 0.0 0.0
Equity ratio, % 55.5 54.0 -57.6
Working capital % of net sales, 12m 16.1 16.0 15.6
Investments -37 -33 -71 -69 100
Sales volumes, ktonnes 61 69 203 211 272
Average number of employees, FTE 632 618 632 618 619
Basic number of shares, end of period** 66,908,800 66,908,800 66,908,800 66,908,800 66,908,800
Basic earnings per share, SEK** -0.49 1.52 2.73 5.71 6.19
*Positive figure if net debt, negative figure if net cash.
**The number of shares and the amounts for all periods are recalculated for the 1,400:1 split of the company’s ordinary shares, which was
decided by the extraordinary general meeting on 1 October 2020.

Nordic Paper Interim report Q3 2020 22 / 27
ALTERNATIVE PERFORMANCE MEASURES References are made in the financial reports to a number of financial performance measures which are
not defined according to IFRS. These key figures provide complementary information and are used to help investors as
well as group management analyse the company’s operations. Since not all companies calculate financial performance
measures in the same manner, these are not always comparable with measures used by other companies.
EBITDA 2020 2019 2020 2019 2019
SEKm Q3 Q3 Jan-Sep Jan-Sep Full year
Operating result -40 129 235 491 530
Depreciation, amortisation and impairment 27 24 79 73 99
EBITDA, SEKm -13 154 314 564 629
EBITDA MARGIN
SEKm Q3 Q3 Jan-Sep Jan-Sep Full year
EBITDA -13 154 314 564 629
Net sales 639 791 2,233 2493 3,231
EBITDA margin, % -2.0 19.5 14.1 22.6 19.5
OPERATING MARGIN
SEKm Q3 Q3 Jan-Sep Jan-Sep Full year
Operating result -40 129 235 491 530
Net sales 639 791 2,233 2493 3,231
Operating margin, % -6.3 16.3 14.8 19.7 16.4
CASH CONVERSION
SEKm Q3 Q3 Full year
EBITDA 12m 377 668 629
Change in working capital, 12 m 88 309 22
Investments, 12 m -101 -92 -100
Cash conversion 364 885 551
EBITDA, 12m 377 668 629
Cash conversion %, 12m 96.6 132.5 87.6
WORKING CAPITAL
SEKm Q3 Q3 Full year
Inventories 409 460 470
Accounts receivables 375 503 402
Other operating receivables excl derivatives 99 63 103
Accounts payables -290 -308 -262
Other operating liabilities excl derivatives -239 -276 -270
Net working capital 355 442 442
Net working capital, 12m 477 514 506
Net sales, 12m 2,971 3,219 3,231
Working capital, % of net sales, 12m 16.1 16.0 15.6

Nordic Paper Interim report Q3 2020 23 / 27
OPERATING CAPITAL 2020 2019 2019
SEKm Q3 Q3 Full year
Net working capital 355 442 442
Intangible assets 344 345 345
Tangible assets 639 641 647
Deferred tax receivables/liabilities -158 -139 -163
Operating capital 1,179 1,289 1,271
Operating profit, 12m 272 477 530
Operating capital, 12m 1,301 1,351 1,346
Return on operating capital, % 12m 20.9 35.3 39.4
NET DEBT
SEKm Q3 Q3 Full year
Lease liabilities, long term 8 8 7
Provisions for pensions - 13 2
- Minus, not interest bearing provisions - -1 -2
Liabilities to credit institutions - - -
Factoring credit line 177 222 184
Liabilities to group company 150 76 41
Lease liabilities, short term 8 7 6
Interest-bearing debt 344 324 238
Cash and cash equivialents 458 329 247
Net debt/net cash (+/-) -114 -6 -9
EBITDA, 12m 377 668 629
Net debt/EBITDA 12m, ratio -0.3 0.0 0.0
NET DEBT/EQUITY
SEKm Q3 Q3 Full year
Net debt/net cash (+/-) -114 -6 -9
Equity 1,301 1,267 1,288
Net debt/Equity, % -8.8 -0.4 -0.7
EQUITY RATIO
SEKm Q3 Q3 Full year
Equity 1,301 1,267 1,288
Total assets 2,344 2,347 2,236
Net debt/Equity, % 55.5 54.0 57.6
RETURN ON EQUITY
SEKm Q3 Q3 2019
Equity 1,301 1,267 1,288
Equity, 12m 1,338 1,051 1,155
Profit after tax, 12m 212 430 414
Return on equity 12m, % 15.9 40.9 35.8

Nordic Paper Interim report Q3 2020 24 / 27
DEFINITIONS
Non-IFRS measures Description Reason for use
Sales volume Sales of paper and pulp from segment or the group, disclosed in ktonnes
Shows if a business is expanding or contracting.
EBITDA
EBITDA (earnings before financial income and costs, taxes, depreciation and amortisation) is the operating profit plus depreciation, impairment and amortisation.
A measurement that eliminates the effects of non-cash expenses and shows how much cash the business can generate.
EBITDA margin EBITDA as a percentage of net sales. Shows how much cash the business can generate in relation to revenue.
Operating profit Result before financial income,costs and tax. Shows the result in the company's operational business.
Operating margin Operating profit as a percentage of net sales. Shows operating profit in relation to net sales and is a measurement of the profitability in the company’s operational business
Cash flow from operating activities
Cash flow before acquisitions of intangible and tangible assets, amortisation of loans, new loans, group contribution and dividend to the owners.
Indicates the amount of cash company brings in from its ongoing, regular business activities.
Cash conversion* The sum of EBITDA less change in net working capital minus investments, divided by EBITDA, disclosed as a percentage.
Cash conversion shows how efficient a company are in generating cash flow in relation to EBITDA.
Investments Cash flow effects fråm acquisition of tangible and intangible assets.
Shows the acquisition of tangible and intangible assets, acquired to maintain and develop the business.
Net working capital Total of inventories, trade receivables, trade payables, other operating assets and liabilities, excluding derivatives
Shows the net of current assets and current liabilities utilised in operations.
Change in net working capital
Net working capital for the reported period less the net working capital for the earlier period.
Shows the development of the net working capital
Net working capital as a percentage of net sales*
Net working capital divided with net sales Indicates a company's effectiveness in using its working capital.
Operating capital Net working capital added with intangible and tangible assets and deferred tax receivables and liabilities.
Shows the capital utilised to run the operations.
Return on operating capital*
Operating profit as a percentage of operating capital
Shows how efficiently the company generates profits from the capital utilised in the operations.
Return on equity* Net profit for the period as a percentage of average equity.
Shows the return that is generated on the shareholders' capital that is invested in the company.
Interest-bearing debts Interest-bearing liabilities, short term and long term plus interest-bearing provisions
Shows the total amount of the financing of the company.
Net debt Interest-bearing liabilities, minus cash and cash equivalents
A measurement of the company's financial position. Shows how much cash would remain if all debts were paid off.
Net debt/EBITDA ratio* Net debt in relation to EBITDA. A measure of financial risk and is an indication of repayment capacity.
Debt/Equity ratio Net debt divided by equity, disclosed as a percentage
Shows the relation between externally financed capital and equity.
Equity ratio Equity divided with total assets, disclosed as a percentage.
Shows the part of the assets that is financed by equity
*Calculated based on the last 12 months value, calculated as an average of 12 months. The 12M value has not been adjusted for the effect of the transition to IFRS 16 as of January 1, 2019. The 12 months value provides comparison that reflect both current and seasonal variations, which improves the ability to make comparisons over time.

Nordic Paper Interim report Q3 2020 25 / 27
Parent company
INCOME STATEMENT
2020 2019 2020 2019 2019
SEKm Q3 Q3 Jan-Sep Jan-Sep Full year
Net sales 11 9 33 22 33
Other operating income 2 - 1 - -
Other external costs -21 -8 -54 -25 -35
Personnel costs -2 -1 -6 -3 -4
Other operating costs - -11 0 -38 -36
Operating result -10 -11 -26 -42 -42 Profit/Loss from participations in associated companies - 50 - 50 50
Financial income and similar items 7 0 19 1 5
Financial costs and similar items 0 -11 -2 -9 -2
Pofit after net financial items -3 28 -9 1 11
Appropriations - - - - 350
Result before tax -3 28 -9 1 361
Tax -1 5 1 10 -67
Result for the period and summarised comprehensive income -4 33 -8 11 294

Nordic Paper Interim report Q3 2020 26 / 27
BALANCE SHEET
2020 2019 2019
SEKm 30 Sep 30 Sep 31 Dec
Shares in group companies 896 896 896
Deferred tax - 5 1
Total non-current assets 896 901 897
Receivables from group companies - - 469
Income tax receivables 40 29 -
Derivatives 12 1 17
Other receivables 2 3 2
Prepaid expenses and accrued revenue 0 0 0
Cash and cash equivalents 579 321 227
Total current assets 634 353 715
Total assets 1,530 1,254 1,612
Share capital 19 19 19
Retained earnings 915 755 772
Result for the period -8 11 293
Total equity 926 785 1,085
Untaxed reserves 441 364 441
Provisions for pensions - - -
Total provisions - - -
Accounts payables 1 - 2
Liabilities to group companies 150 76 41
Income tax liability - - 35
Derivatives 3 28 7
Other liabilities 0 0 1
Accrued expenses and prepaid revenue 9 2 1
Total current liabilities 163 105 87
Total equity and liabilities 1,530 1,254 1,612

Nordic Paper Interim report Q3 2020 27 / 27
CONFERENCE CALL On the publication of the interim report, a telephone conference will be held Wednesday 28 October at 09:30 CET.
Anita Sjölander, CEO together with Niclas Eriksson, CFO will present and comment on the report. The presentation
will be held in English. The press and analyst conference will be audiocasted and may be followed via:
www.nordic-paper.com. You may also participate in the conference by telephone on:
Sweden 0856618430
United States 19177200181
United Kingdom 08448228902
International Dial-In Number +44 (0) 2071 928501
Pin code: 3226839#
FINANCIAL CALENDAR Full year report 2020 – 28 January 2021
Annual report 2020 – 23 April 2021
Interim report Q1 2021 – 28 April 2021
Interim report Q2 2021 – 20 July 2021
Interim report Q3 2021 – 28 October 2021
Annual general meeting
The annual general meeting 2021 will be held in Karlstad 20 May, 2021.
For further information, please contact:
Niclas Eriksson, CFO
Tel: +46 705 654 257
E-mail: [email protected]
Anita Sjölander, CEO
Tel: +46 703 097 484
E-mail: [email protected]
Ingrid Östhols, IR
Tel: +46 721 810 867
E-mail: [email protected]
The English report is only for translation purposes. The Swedish report is the valid report.
NORDIC PAPER IN BRIEF Nordic Paper is a Scandinavian specialty paper producer, manufacturing top-quality paper since the 19th century. We
are a leading supplier of kraft and natural greaseproof paper. Our products are based on renewable raw material from
local forests. From our four Scandinavian mills we supply customers in more than 70 countries. Nordic Paper had in 2019
net sales of SEK 3,200m, about 620 employees and is listed on Nasdaq Stockholm. www.nordic-paper.com