q4 2005€¢ at the end of the fourth quarter the number of subscriptions in the consolidated mobile...
TRANSCRIPT

The fourth quarter of 2005 showed a growth in revenues for the Telenor Group of 26% to NOK 19.5 billion compared to the fourth quarter of 2004. Profi t before taxes was NOK 2.7 billion.
Q4 2005

4

Tele
no
r G
rou
pP
AG
E 1
Fou
rth
qu
art
er
20
05
• Profit after taxes and minority interests was NOK 1,001 million.
Earnings per share in the fourth quarter of 2005 were NOK 0.59.
• The Board will propose a dividend of NOK 2.00 per share for 2005,
an increase from NOK 1.50 per share for 2004.
• EBITDA before other income and expenses was NOK 6,831 million.
The increased EBITDA margin was primarily due to the increased
proportion of the mobile operations.
• At the end of the fourth quarter the number of subscriptions in the
consolidated mobile operations was 42.2 million.
• Capital expenditure amounted to NOK 6,432 million and increased
due to strong customer growth in the international mobile operations
and the purchase of a UMTS license in Denmark.
• On 26 October 2005 Telenor increased its ownership/economic
exposure in Total Access Communications PCL (DTAC) by 16.6% to
56.9% for a cash consideration of NOK 1.5 billion. As of 31 December
2005, after the offers for DTAC and UCOM shares expired, Telenor’s
ownership/economic exposure in DTAC increased by a further 12.4%
to 69.3% for a total cash consideration of NOK 1.2 billion. As of 31
December 2005, net interest-bearing debt in the companies was
NOK 7.3 billion. DTAC was consolidated from
1 November 2005, while the operations in UCOM were reported
as discontinued operations in the financial statements.
• Telenor's mobile operations in Asia and Eastern/Central Europe are
becoming increasingly important to the Group and dedicated
Executive Vice Presidents have now been assigned to both regions.
In addition, Telenor has also strengthened the co-ordination of
operational and human resources across all countries in which it
has operations, and two new Executive Vice Presidents have been
appointed to the Group Management.
• On 21 December 2005 a Norwegian Court of Appeal ruled in favour
of Telenor in respect of Telenor's intra group sale of its shares in
Sonofon Holding A/S. This sale triggered a tax loss of approximately
NOK 8.6 billion, with corresponding reduced tax charges of approxi-
mately NOK 2.4 billion for the fiscal year 2001. The taxes were paid in
2003. The tax authorities have since appealed the decision to the
Norwegian Supreme Court, and Telenor has consequently not taken
the tax reduction to income.
• Vodafone Sweden was acquired for a consideration of EUR 1,035 mil-
lion (NOK 8,170 million) including debt and will be consolidated from
January 2006.
• On 12 January 2006 Telenor disposed of 4.8% of the share capital in
Inmarsat with a total sales proceeds of GBP 75.1 million (NOK 889
million) and a financial gain before taxes of GBP 74.4 million (NOK
880 million). Following the transaction, Telenor holds 4.6% of the
shares in Inmarsat.
KEY FIGURES ***)
Fourth quarter Year
(NOK in millions) 2005 2004 2005 2004
Revenues 19 474 15 512 68 927 60 591
Revenues – growth (%) 25.5 13.5 13.8 14.6
EBITDA before other income and expenses 1) 6 831 5 114 24 078 21 383
EBITDA before other income and expenses/Revenues (%) 35.1 33.0 34.9 35.3
EBITDA 6 722 5 134 23 836 21 535
EBITDA/Revenues (%) 34.5 33.1 34.6 35.5
Adjusted operating profit 1) 3 644 2 411 12 534 10 746
Adjusted operating profit/Revenues (%) 18.7 15.5 18.2 17.7
Operating profit 2 949 (1 055) 11 705 7 367
Operating profit/Revenues (%) 15.1 nm 17.0 12.2
Associated companies 65 140 1 233 986
Profit before taxes 2 666 (1 130) 12 591 9 874
Profit after taxes and minority interests 1 001 (430) 6 952 6 093
Earnings per share in NOK 0.59 (0.25) 4.06 3.49
Net interest-bearing liabilities 31 133 19 195
Investments:
– Capex 2) 6 436 4 122 16 439 12 745
– Investments in businesses 3) 2 720 1 122 8 858 5 809
KEY POINTS IN THE QUARTER *)
• Revenue growth of 26% – underlying growth of 13% **)
• EBITDA margin before other income and expenses increased from 33.0% to 35.1%
• Record high mobile subscription growth
• Ownership/economic exposure in DTAC in Thailand increased to 69.3%
• Nordic position strengthened through acquisition of Vodafone Sweden
TELENOR GROUP FOURTH QUARTER 2005
1) For reconciliation of EBITDA before other income and expenses and adjusted operating profit, see the table “Reconciliations” on page 19.2) Capex is investments in tangible and intangible assets.3) Comprises acquisitions of shares and participations, including acquisitions of subsidiaries and businesses not organised as separate companies.
*) Compared to the fourth quarter of 2004, if not otherwise stated.
**) Underlying growth is defined as revenue growth adjusted for the effects of acquisition and disposal of operations, and currency effects.
***) Telenor has changed its accounting treatment under IFRS for its Mobile Virtual Network Operator (MVNO) agreements in Norway and Sweden, both of
which were entered into with the same counterparty. The identical fixed prepayments in Norway and Sweden are now eliminated at Group level. As a result
of the change in accounting treatment, revenues, traffic costs and the provision for a loss contract has been eliminated on Group level for the full year and
the fourth quarter of 2004. This change also affected the full year and the fourth quarter of 2005.

Tele
no
r G
rou
pP
AG
E 2
Fou
rth
qu
art
er
20
05
KEY FIGURES OPERATIONS
Revenues
Fourth quarter Year
(NOK in millions) 2005 2004 Growth 2005 2004 Growth
Telenor Mobil – Norway 3 235 2 963 9.2% 12 243 11 730 4.4%
Sonofon – Denmark 1 334 1 243 7.3% 5 191 4 404 17.9%
Kyivstar – Ukraine 2 390 1 184 101.9% 7 272 4 219 72.4%
Pannon GSM – Hungary 1 565 1 510 3.6% 6 061 5 907 2.6%
DiGi.Com – Malaysia 1 452 1 004 44.6% 4 932 3 946 25.0%
GrameenPhone – Bangladesh 850 570 49.1% 2 970 2 186 35.9%
Other mobile operations 1 491 179 733.0% 2 219 423 424.6%
Fixed 5 025 4 781 5.1% 19 313 19 256 0.3%
Broadcast 1 466 1 375 6.6% 5 649 5 346 5.7%
Other operations 2 538 2 461 3.1% 9 967 9 540 4.5%
Eliminations (1 872) (1 758) nm (6 890) (6 366) nm
Total revenues 19 474 15 512 25.5% 68 927 60 591 13.8%
EBITDA
Fourth quarter Year
(NOK in millions) 2005 Margin 1) 2004 Margin 1) 2005 Margin 1) 2004 Margin 1)
Telenor Mobil – Norway 1 186 36.7% 1 119 37.8% 4 471 36.5% 4 305 36.7%
Sonofon – Denmark 308 23.1% 16 1.3% 1 176 22.7% 681 15.5%
Kyivstar – Ukraine 1 359 56.9% 712 60.1% 4 050 55.7% 2 581 61.2%
Pannon GSM – Hungary 534 34.1% 420 27.8% 2 185 36.1% 2 093 35.4%
DiGi.Com – Malaysia 632 43.5% 443 44.1% 2 142 43.4% 1 732 43.9%
GrameenPhone – Bangladesh 455 53.5% 338 59.3% 1 559 52.5% 1 313 60.1%
Other mobile operations 50 3.4% (618) nm (343) nm (712) nm
Fixed 1 543 30.7% 1 560 32.6% 5 885 30.5% 6 338 32.9%
Broadcast 331 22.6% 332 24.1% 1 516 26.8% 1 498 28.0%
Other operations 194 7.6% 221 9.0% 1 091 10.9% 1 114 11.7%
Eliminations 130 nm 591 nm 104 nm 592 nm
Total EBITDA 6 722 34.5% 5 134 33.1% 23 836 34.6% 21 535 35.5%1) EBITDA as a percentage of revenues.
Operating profit
Fourth quarter Year
(NOK in millions) 2005 Margin 1) 2004 Margin 1) 2005 Margin 1) 2004 Margin 1)
Telenor Mobil – Norway 962 29.7% 827 27.9% 3 566 29.1% 3 228 27.5%
Sonofon – Denmark 12 nm (3 551) nm (109) nm (3 799) nm
Kyivstar – Ukraine 1 019 42.6% 555 46.9% 2 826 38.9% 2 026 48.0%
Pannon GSM – Hungary 245 15.7% 87 5.8% 1 007 16.6% 777 13.2%
DiGi.Com – Malaysia 356 24.5% 228 22.7% 1 099 22.3% 831 21.1%
GrameenPhone – Bangladesh 289 34.0% 263 46.1% 1 120 37.7% 1 095 50.1%
Other mobile operations (295) nm (767) nm (954) nm (903) nm
Fixed 84 1.7% 653 13.7% 2 062 10.7% 2 725 14.2%
Broadcast 244 16.6% 118 8.6% 1 015 18.0% 750 14.0%
Other operations (79) (3.1%) (24) nm 48 0.5% 96 1.0%
Eliminations 112 nm 556 nm 25 nm 541 nm
Total operating profit 2 949 15.1% (1 055) nm 11 705 17.0% 7 367 12.2%1) Operating profit as a percentage of revenues.
As of 1 January 2005, Telenor’s unaudited interim consolidated financial
statements are prepared in accordance with International Financial
Reporting Standards (IFRS) and IAS 34 “Interim Financial Reporting”.
As a consequence of the transition to IFRS, certain of Telenor’s
accounting principles have been changed compared to Telenor's
financial statements for the year and quarters of 2004, which were
prepared according to Norwegian Generally Accepted Accounting
Principles (N GAAP). The figures for the comparable periods of 2004
have been restated to comply with IFRS. The main changes are
discussed in the first quarter report for 2005. In addition Telenor has
changed its accounting treatment under IFRS for its Mobile Virtual
Network Operator (MVNO) agreements in Norway and Sweden as
discussed above. Accounting figures and key figures for periods prior
to 2004 have not been restated to comply with IFRS. Reference is made
to Telenor’s reports for the first, second and third quarter of 2005 for
statements related to these quarters.
Tele
no
r G
rou
pP
AG
E 3
Fou
rth
qu
art
er
20
05
TELENOR’S OPERATIONS
Unless otherwise stated, the statements below are related to Telenor’s
development in the fourth quarter of 2005 compared to the fourth
quarter of 2004.
MOBILE OPERATIONS
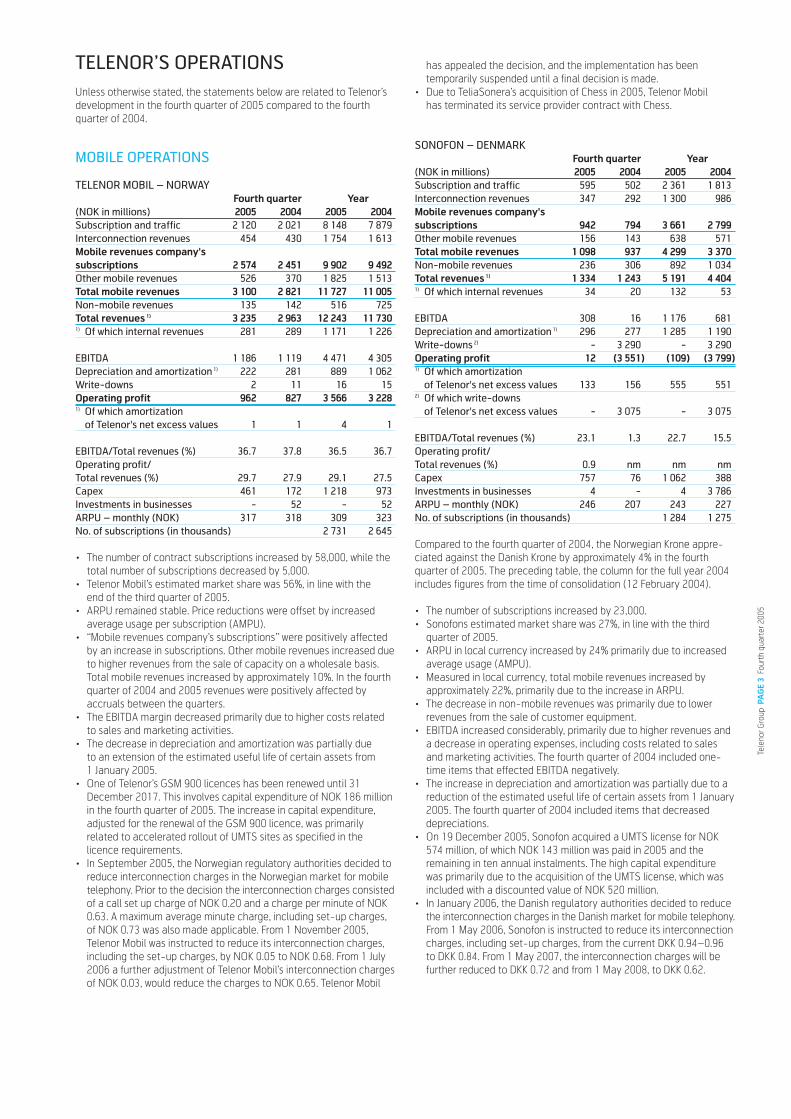
TELENOR MOBIL – NORWAY
Fourth quarter Year
(NOK in millions) 2005 2004 2005 2004
Subscription and traffic 2 120 2 021 8 148 7 879
Interconnection revenues 454 430 1 754 1 613
Mobile revenues company's
subscriptions 2 574 2 451 9 902 9 492
Other mobile revenues 526 370 1 825 1 513
Total mobile revenues 3 100 2 821 11 727 11 005
Non-mobile revenues 135 142 516 725
Total revenues 1) 3 235 2 963 12 243 11 7301) Of which internal revenues 281 289 1 171 1 226
EBITDA 1 186 1 119 4 471 4 305
Depreciation and amortization 1) 222 281 889 1 062
Write-downs 2 11 16 15
Operating profit 962 827 3 566 3 2281) Of which amortization
of Telenor's net excess values 1 1 4 1
EBITDA/Total revenues (%) 36.7 37.8 36.5 36.7
Operating profit/
Total revenues (%) 29.7 27.9 29.1 27.5
Capex 461 172 1 218 973
Investments in businesses - 52 - 52
ARPU – monthly (NOK) 317 318 309 323
No. of subscriptions (in thousands) 2 731 2 645
• The number of contract subscriptions increased by 58,000, while the
total number of subscriptions decreased by 5,000.
• Telenor Mobil’s estimated market share was 56%, in line with the
end of the third quarter of 2005.
• ARPU remained stable. Price reductions were offset by increased
average usage per subscription (AMPU).
• “Mobile revenues company’s subscriptions” were positively affected
by an increase in subscriptions. Other mobile revenues increased due
to higher revenues from the sale of capacity on a wholesale basis.
Total mobile revenues increased by approximately 10%. In the fourth
quarter of 2004 and 2005 revenues were positively affected by
accruals between the quarters.
• The EBITDA margin decreased primarily due to higher costs related
to sales and marketing activities.
• The decrease in depreciation and amortization was partially due
to an extension of the estimated useful life of certain assets from
1 January 2005.
• One of Telenor’s GSM 900 licences has been renewed until 31
December 2017. This involves capital expenditure of NOK 186 million
in the fourth quarter of 2005. The increase in capital expenditure,
adjusted for the renewal of the GSM 900 licence, was primarily
related to accelerated rollout of UMTS sites as specified in the
licence requirements.
• In September 2005, the Norwegian regulatory authorities decided to
reduce interconnection charges in the Norwegian market for mobile
telephony. Prior to the decision the interconnection charges consisted
of a call set up charge of NOK 0.20 and a charge per minute of NOK
0.63. A maximum average minute charge, including set-up charges,
of NOK 0.73 was also made applicable. From 1 November 2005,
Telenor Mobil was instructed to reduce its interconnection charges,
including the set-up charges, by NOK 0.05 to NOK 0.68. From 1 July
2006 a further adjustment of Telenor Mobil’s interconnection charges
of NOK 0.03, would reduce the charges to NOK 0.65. Telenor Mobil
has appealed the decision, and the implementation has been
temporarily suspended until a final decision is made.
• Due to TeliaSonera’s acquisition of Chess in 2005, Telenor Mobil
has terminated its service provider contract with Chess.
SONOFON – DENMARK
Fourth quarter Year
(NOK in millions) 2005 2004 2005 2004
Subscription and traffic 595 502 2 361 1 813
Interconnection revenues 347 292 1 300 986
Mobile revenues company's
subscriptions 942 794 3 661 2 799
Other mobile revenues 156 143 638 571
Total mobile revenues 1 098 937 4 299 3 370
Non-mobile revenues 236 306 892 1 034
Total revenues 1) 1 334 1 243 5 191 4 4041) Of which internal revenues 34 20 132 53
EBITDA 308 16 1 176 681
Depreciation and amortization 1) 296 277 1 285 1 190
Write-downs 2) - 3 290 - 3 290
Operating profit 12 (3 551) (109) (3 799)1) Of which amortization
of Telenor's net excess values 133 156 555 5512) Of which write-downs
of Telenor's net excess values - 3 075 - 3 075
EBITDA/Total revenues (%) 23.1 1.3 22.7 15.5
Operating profit/
Total revenues (%) 0.9 nm nm nm
Capex 757 76 1 062 388
Investments in businesses 4 - 4 3 786
ARPU – monthly (NOK) 246 207 243 227
No. of subscriptions (in thousands) 1 284 1 275
Compared to the fourth quarter of 2004, the Norwegian Krone appre-
ciated against the Danish Krone by approximately 4% in the fourth
quarter of 2005. The preceding table, the column for the full year 2004
includes figures from the time of consolidation (12 February 2004).
• The number of subscriptions increased by 23,000.
• Sonofons estimated market share was 27%, in line with the third
quarter of 2005.
• ARPU in local currency increased by 24% primarily due to increased
average usage (AMPU).
• Measured in local currency, total mobile revenues increased by
approximately 22%, primarily due to the increase in ARPU.
• The decrease in non-mobile revenues was primarily due to lower
revenues from the sale of customer equipment.
• EBITDA increased considerably, primarily due to higher revenues and
a decrease in operating expenses, including costs related to sales
and marketing activities. The fourth quarter of 2004 included one-
time items that effected EBITDA negatively.
• The increase in depreciation and amortization was partially due to a
reduction of the estimated useful life of certain assets from 1 January
2005. The fourth quarter of 2004 included items that decreased
depreciations.
• On 19 December 2005, Sonofon acquired a UMTS license for NOK
574 million, of which NOK 143 million was paid in 2005 and the
remaining in ten annual instalments. The high capital expenditure
was primarily due to the acquisition of the UMTS license, which was
included with a discounted value of NOK 520 million.
• In January 2006, the Danish regulatory authorities decided to reduce
the interconnection charges in the Danish market for mobile telephony.
From 1 May 2006, Sonofon is instructed to reduce its interconnection
charges, including set-up charges, from the current DKK 0.94–0.96
to DKK 0.84. From 1 May 2007, the interconnection charges will be
further reduced to DKK 0.72 and from 1 May 2008, to DKK 0.62.

Tele
no
r G
rou
pP
AG
E 4
Fou
rth
qu
art
er
20
05
KYIVSTAR – UKRAINE
Fourth quarter Year
(NOK in millions) 2005 2004 2005 2004
Subscription and traffic 1 720 810 5 122 2 961
Interconnection revenues 606 327 1 888 1 068
Mobile revenues company's
subscriptions 2 326 1 137 7 010 4 029
Other mobile revenues 33 25 158 122
Total mobile revenues 2 359 1 162 7 168 4 151
Non-mobile revenues 31 22 104 68
Total revenues 1) 2 390 1 184 7 272 4 2191) Of which internal revenues 1 1 6 2
EBITDA 1 359 712 4 050 2 581
Depreciation and amortization 1) 325 157 1 209 555
Write-downs 15 - 15 -
Operating profit 1 019 555 2 826 2 0261) Of which amortization
of Telenor's net excess values 24 21 93 93
EBITDA/Total revenues (%) 56.9 60.1 55.7 61.2
Operating profit/
Total revenues (%) 42.6 46.9 38.9 48.0
Capex 890 1 024 3 650 2 608
Investments in businesses - - - 35
ARPU – monthly (NOK) 64 68 61 85
No. of subscriptions
(100% in thousands) 13 925 6 252
At the end of the fourth quarter of 2005, Telenor’s ownership interest
in Kyivstar was 56.5%. Compared to the fourth quarter of 2004, the
Norwegian Krone depreciated against the Ukrainian Hryvnia by approxi-
mately 11% in the fourth quarter of 2005.
• Kyivstar had a record growth of 3 million subscriptions in the fourth
quarter of 2005. Compared to the fourth quarter of 2004, the number
of subscriptions more than doubled, with an increase of 7.7 million.
• Kyivstar defended its position as market leader with an estimated
market share of 46%.
• The decrease in ARPU was primarily due to price reductions. Despite
the strong subscription growth, AMPU increased by 13%.
• Measured in local currency, revenues increased by 85% primarily due
to the increased number of subscriptions. This was partially offset by
a reduction in ARPU. ARPU was positively affected by approximately
NOK 2 by accruals between the quarters.
• EBITDA in local currency, increased by 74%. The decrease in the
EBITDA margin was primarily due to a decrease in prices and a signif-
icant increase in costs associated with sales and marketing activities
due to strong subscription growth. The EBITDA margin was positively
affected by approximately 3 percentage points by accruals between
the quarters.
• Depreciation and amortization increased as a result of increased
capital expenditure in the intervening quarters and a reduction of
the estimated useful life of certain assets as from 1 January 2005.
• In the fourth quarter of 2004 capital expenditure was very high as
a result of Kyivstar being somewhat behind on capacity investments
due to the high customer intake. In 2005, Kyivstar has been able to
be in front of the development resulting in a more even distribution
of investments throughout the year. Capital expenditure in the fourth
quarter of 2005 therefore decreased compared to the fourth quarter
of 2004.
• Kyivstar along with other major mobile operators in Ukraine have dis-
putes with the Ukrainian Tax Authority regarding a claim for VAT on
the Pension Fund Duty charged on subscribers’ phone bills. Kyivstar
considers this an invalid tax. A lower court decision 13 February 2006
was issued invalidating the tax claim concerning the same issues
involving another mobile operator in the Ukraine. Telenor has not
made provisions for this claim.
PANNON GSM – HUNGARY
Fourth quarter Year
(NOK in millions) 2005 2004 2005 2004
Subscription and traffic 960 920 3 768 3 669
Interconnection revenues 431 442 1 735 1 731
Mobile revenues company's
subscriptions 1 391 1 362 5 503 5 400
Other mobile revenues 20 32 144 142
Total mobile revenues 1 411 1 394 5 647 5 542
Non-mobile revenues 154 116 414 365
Total revenues 1) 1 565 1 510 6 061 5 9071) Of which internal revenues 4 3 10 6
EBITDA 534 420 2 185 2 093
Depreciation and amortization 1) 285 312 1 171 1 295
Write-downs 4 21 7 21
Operating profit 245 87 1 007 7771) Of which amortization
of Telenor's net excess values 84 89 345 358
EBITDA/Total revenues (%) 34.1 27.8 36.1 35.4
Operating profit/
Total revenues (%) 15.7 5.8 16.6 13.2
Capex 261 820 763 1 166
ARPU – monthly (NOK) 162 171 162 173
No. of subscriptions (in thousands) 2 929 2 770
Compared to the fourth quarter of 2004, the Norwegian Krone appreci-
ated against the Hungarian Forint by approximately 5% in the fourth
quarter of 2005.
• The number of subscriptions increased by 73,000. Compared to the
fourth quarter of 2004, the number of contract subscriptions
increased by 246,000.
• Pannon GSM’s market share was 34%, in line with the third quarter
of 2005.
• ARPU in local currency was stable. Lower average prices were offset
by increased average usage (AMPU) of 14%.
• Measured in local currency, mobile revenues increased by 7%, prima-
rily due to an increase in the number of subscriptions. Non-mobile
revenues increased primarily due to higher revenues from the sale
of handsets.
• The improvement in the EBITDA margin was primarily due to growth
in revenues and lower costs relating to sales and marketing activities.
In addition, previously expensed Universal Service Obligations for
2004 were reversed following an authority decision. This reversal
affected the EBITDA margin positively by approximately 2 percent-
age points. EBITDA, measured in local currency, increased by 34%.
• Depreciation and amortization decreased due to certain fixed assets
being fully depreciated and due to an extension of the estimated
useful life of certain assets from 1 January 2005.
• The decrease in capital expenditure was due to the acquisition of
a UMTS license in the fourth quarter of 2004.

Tele
no
r G
rou
pP
AG
E 5
Fou
rth
qu
art
er
20
05
DIGI.COM – MALAYSIA
Fourth quarter Year
(NOK in millions) 2005 2004 2005 2004
Subscription and traffic 1 198 739 3 949 2 794
Interconnection revenues 159 143 594 571
Mobile revenues company's
subscriptions 1 357 882 4 543 3 365
Other mobile revenues 18 13 65 65
Total mobile revenues 1 375 895 4 608 3 430
Non-mobile revenues 77 109 324 516
Total revenues 1) 1 452 1 004 4 932 3 9461) Of which internal revenues 2 - 4 3
EBITDA 632 443 2 142 1 732
Depreciation and amortization 1) 273 215 1 038 901
Write-downs 3 - 5 -
Operating profit 356 228 1 099 8311) Of which amortization
of Telenor's net excess values 4 17 51 72
EBITDA/Total revenues (%) 43.5 44.1 43.4 43.9
Operating profit/
Total revenues (%) 24.5 22.7 22.3 21.1
Capex 574 427 1 170 920
ARPU – monthly (NOK) 102 98 98 107
No. of subscriptions
(100% in thousands) 4 795 3 239
At the end of the fourth quarter of 2005, Telenor's ownership interest in
DiGi was 61.0%. Compared to the fourth quarter of 2004, the Norwegian
Krone depreciated against the Malayan Ringgit by approximately 6% in
the fourth quarter of 2005.
• DiGi experienced a strong growth in subscriptions in the fourth quarter
of 2005, with a total of 608,000 net additions. The increase from the
fourth quarter of 2004 was 1.6 million.
• DiGi’s market share continued to increase and was estimated at 25%
at the end of 2005.
• ARPU in local currency decreased by 2% primarily as a result of
dilution due to strong subscription growth.
• Measured in local currency, total mobile revenues increased by 46%,
while revenues from subscription and traffic increased by 54%, pri-
marily due to the higher subscription base.
• Non-mobile revenues, mainly coming from the international carrier
business, decreased due to lower volumes and price reductions.
• The EBITDA margin decreased slightly, while EBITDA in local currency
increased by 35%.
• Depreciation and amortization increased mainly as a result of a
reduction of the estimated useful life of certain assets from 1 January
2005 and increased capital expenditure in the intervening quarters.
• Increased capital expenditure was related to investments in the net-
work due to increased usage, a higher subscription base and
improved coverage.
GRAMEENPHONE – BANGLADESH
Fourth quarter Year
(NOK in millions) 2005 2004 2005 2004
Subscription and traffic 769 529 2 741 2 064
Interconnection revenues 63 35 188 90
Mobile revenues company's
subscriptions 832 564 2 929 2 154
Other mobile revenues 6 6 22 24
Total mobile revenues 838 570 2 951 2 178
Non-mobile revenues 12 - 19 8
Total revenues 1) 850 570 2 970 2 1861) Of which internal revenues 1 - 1 -
EBITDA 455 338 1 559 1 313
Depreciation and amortization 166 72 439 215
Write-downs - 3 - 3
Operating profit 289 263 1 120 1 095
EBITDA/Total revenues (%) 53.5 59.3 52.5 60.1
Operating profit/
Total revenues (%) 34.0 46.1 37.7 50.1
Capex 1 153 482 2 596 1 318
Investments in businesses - 298 - 298
ARPU – monthly (NOK) 56 87 68 104
No. of subscriptions
(100% in thousands) 5 542 2 388
At the end of the fourth quarter of 2005, Telenor's ownership interest in
GrameenPhone was 62.0%. Compared to the fourth quarter of 2004, the
Norwegian Krone appreciated against the Bangladeshi Taka by approxi-
mately 5% in the fourth quarter of 2005.
• GrameenPhone had a record high subscription growth of 1.3 million
in the fourth quarter of 2005. Compared to the fourth quarter of
2004, the number of subscriptions more than doubled, with an
increase of 3.2 million subscriptions.
• GrameenPhone’s estimated market share was 62%, in line with the
previous quarter.
• ARPU in local currency decreased by 33%, primarily due to decrease
in average prices and dilution due to strong subscription growth.
• Measured in local currency, total revenues increased by 56%, primarily
due to the increased number of subscriptions. This was partially offset
by a reduction in ARPU.
• EBITDA in local currency increased by 13% primarily due to growth in
revenues. The decrease in the EBITDA margin was primarily a result
of increased sales and acquisition costs due to the strong subscription
growth, as well as price reductions. In 2005, GrameenPhone partially
subsidised royalty and license fees as well as a SIM-tax per new sub-
scription. In the fourth quarter of 2005, a contract for the lease of
fibre network previously recognised as an operating lease is now
being recognised as a financial lease under IFRS. The fourth quarter
includes the effect from 1 January 2005. This had a positive effect
on EBITDA of NOK 87 million and operating profit of NOK 46 million.
• Depreciation and amortization increased as a result of increased
capital expenditure in the intervening quarters, the change in the
accounting treatment of the lease mentioned above and a reduction
of the estimated useful life of certain network components.
• Increased capital expenditure was due to the extension of mobile
coverage in new regions and increased mobile network capacity due
to strong subscription growth. The reporting of the lease mentioned
above increased capital expenditure by NOK 511 million.
• In the second quarter of 2005, the Bangladeshi Telecommunication
Regulatory Commission requested that GrameenPhone pay royalty
and license fees on handsets according to the license requirements.
The legitimacy and amounts payable have not yet been clarified.
Telenor is of the opinion that necessary provisions have been made.

Tele
no
r G
rou
pP
AG
E 6
Fou
rth
qu
art
er
20
05
OTHER MOBILE OPERATIONS
Fourth quarter Year
(NOK in millions) 2005 2004 2005 2004
Revenues
DTAC – Thailand 1 191 - 1 191 -
Telenor Pakistan 140 - 265 -
ProMonte GSM – Montenegro 112 118 519 200
Telenor Mobile Sweden 48 61 244 223
Total revenues 1) 1 491 179 2 219 4231) Of which internal revenues 33 26 143 88
EBITDA
DTAC – Thailand 445 - 445 -
Telenor Pakistan (133) (45) (572) (78)
ProMonte GSM – Montenegro 47 46 260 91
Telenor Mobile Sweden (309) (619) (476) (725)
Total EBITDA 50 (618) (343) (712)
Depreciation and amortization 1) 345 74 611 116
Write-downs - 75 - 75
Operating profit (295) (767) (954) (903)
Of which:
DTAC – Thailand 225 - 225 -
Telenor Pakistan (218) (45) (798) (78)
ProMonte GSM – Montenegro 7 (2) 95 24
Telenor Mobile Sweden (309) (720) (476) (849)1) Of which amortization
of Telenor's net excess values 55 25 115 32
Capex
DTAC – Thailand 146 - 146 -
Telenor Pakistan 496 153 1 843 1 993
ProMonte GSM – Montenegro 21 13 38 16
Telenor Mobile Sweden - 6 - 17
Investments in businesses 2 664 1 2 664 541
No. of subscriptions
(in thousands)
DTAC – Thailand 8 677 -
Telenor Pakistan 1 868 -
ProMonte GSM 310 279
Telenor Mobile Sweden 95 105
Other mobile operations include DTAC (Total Access Communication
PCL), Telenor Pakistan, ProMonte GSM and Telenor Mobile Sweden.
DTAC is consolidated from 1 November 2005. The operation in Pakistan
was established in the second quarter of 2004. ProMonte GSM was an
associated company up until 12 August 2004, at which time Telenor
acquired the remaining shares. Compared to the fourth quarter of 2004,
the Norwegian Krone depreciated by approximately 6% against the
Pakistani Rupi and appreciated by approximately 4% against the Euro,
which is the functional currency of ProMonte GSM, and by approximately
8% against the Swedish Krone in the fourth quarter of 2005. The preceding
table shows figures for DTAC and ProMonte from the time of consolidation.
DTAC
• The number of subscriptions increased by 368,000 in the fourth
quarter in 2005.
• DTAC’s estimated market share was 28%, in line with the end of the
third quarter of 2005.
• Revenues and EBITDA margin for the fourth quarter of 2005 were
NOK 1.9 billion and 38%, respectively.
• Compared to the third quarter of 2005, ARPU in local currency
increased by approximately 6%.
• DTAC has a service concession arrangement whereby the
Communication Authorities of Thailand (CAT Telecom) has granted
DTAC the right to build, transfer and operate a mobile network in
Thailand. The revenue share, which DTAC is required to pay on some
of its services, to CAT Telecom, will increase from 20% to 25% in the
fourth quarter of 2006.
• Investments in businesses in the table above are related to the
increased ownership/economic exposure in DTAC to 69.3%.
• For the period from 1 November to 31 December 2005, UCOM’s profit
after taxes has been recognised in Telenor’s profit and loss statement
as Profit after taxes from discontinued operations. The corresponding
assets and liabilities have been recognised in Telenor’s balance sheet
as of 31 December 2005 as held for sale.
Telenor Pakistan
• Telenor Pakistan experienced a strong growth in the fourth quarter of
2005, with net additions of 668,000 subscriptions. Telenor Pakistan’s
estimated market share was 9%, an increase of 2 percentage points
compared to the end of the third quarter of 2005.
• Compared to the third quarter of 2005, revenues increased due to
strong subscription growth and increase in ARPU.
• Capital expenditure in the fourth quarter was mainly related to expan-
sion of the mobile network into new regions.
ProMonte GSM – Montenegro
• The number of subscriptions decreased by 84,000 during the fourth
quarter of 2005 as Montenegro entered the low season for tourism.
• ProMonte GSM’s estimated market share at the end of 2005 was 58%
compared to 59% at the end of the third quarter of 2005.
Telenor Mobile Sweden
• In the first quarter of 2006 Telenor Mobile Sweden will transfer
its mobile traffic to Vodafone Sweden’s network. This resulted in
a provision for loss on the MVNO agreement of NOK 291 million in
the fourth quarter of 2005, of which NOK 116 million were related
to prepayments.
FIXEDFourth quarter Year
(NOK in millions) 2005 2004 2005 2004
Revenues
Norway 4 186 4 353 16 867 17 545
Other operations 887 467 2 581 1 829
Eliminations (48) (39) (135) (118)
Total revenues 1) 5 025 4 781 19 313 19 2561) Of which internal revenues 602 507 2 173 1 823
EBITDA 1 543 1 560 5 885 6 338
Depreciation and amortization 1) 850 867 3 236 3 573
Write-downs 2) 609 40 587 40
Operating profit 84 653 2 062 2 7251) Of which amortization
of Telenor's net excess values (6) 6 66 72) Of which write-downs
of Telenor's net excess values 10 (22) (24) (22)
EBITDA/Total revenues (%) 30.7 32.6 30.5 32.9
Operating profit/
Total revenues (%) 1.7 13.7 10.7 14.2
Capex 1 237 609 2 776 1 791
Investments in businesses (20) 9 5 816 105
• Bredbandsbolaget and Cybercity were consolidated with effect from
8 July and 5 July 2005, respectively.
• In the fourth quarter of 2005 Fixed entered into an agreement to
dispose of its operations in the Czech Republic and Slovakia with
a loss of NOK 63 million.
• In the fourth quarter of 2005 Telenor changed its accounting
treatment under IFRS for transactions that provide the rights to use
assets, such as local loop unbundling. Such transactions are now
recognised as leases. Prepaid costs in such leases have been reclas-
sified from operating costs to depreciation and amortization.

Tele
no
r G
rou
pP
AG
E 7
Fou
rth
qu
art
er
20
05
FIXED – NORWAY
Fourth quarter Year
(NOK in millions) 2005 2004 2005 2004
Revenues
Telephony 1 751 2 009 7 232 8 268
xDSL/Internet 536 466 2 039 1 753
Data services 238 249 963 1 022
Other revenues 366 386 1 465 1 656
Total retail revenues 2 891 3 110 11 699 12 699
Wholesale revenues 1 295 1 243 5 168 4 846
Total revenues 1) 4 186 4 353 16 867 17 5451) Of which internal revenues 623 522 2 190 1 842
EBITDA 1 377 1 570 5 701 6 330
Depreciation and amortization 1) 692 774 2 707 3 251
Write-downs 2) (1) 2 (25) 2
Operating profit 686 794 3 019 3 0771) Of which amortization
of Telenor's net excess values - 1 - 22) Of which write-downs
of Telenor's net excess values (2) 2 (36) 2
EBITDA/Total revenues (%) 32.9 36.1 33.8 36.1
Operating profit/
Total revenues (%) 16.4 18.2 17.9 17.5
Capex 917 457 2 169 1 473
Investments in businesses - 1 44 2
No. of PSTN subscriptions
(in thousands) 1 089 1 182
No. of ISDN subscriptions
(lines in thousands) 1 227 1 449
No. of xDSL subscriptions
(in thousands) 475 326
• Compared to the third quarter of 2005 the trend from previous quar-
ters continued in the fourth quarter, with an increase in the number of
xDSL and broadband telephony (BBT) subscriptions and a decrease
in the number of PSTN/ISDN subscriptions.
• The number of xDSL subscriptions increased by 31,000 to 475,000
and the number of BBT subscriptions increased by 16,000 to 24,000,
while the number of PSTN/ISDN subscriptions decreased by 52,000
to 1,604,000. Compared to the fourth quarter 2004 the number of
PSTN/ISDN subscriptions decreased by 196,000.
• Telenor’s estimated market share for xDSL was 58% compared
to 59% at the end of the third quarter of 2005. Measured in traffic
minutes Telenor’s estimated market share was 66%, in line with the
end of the third quarter of 2005.
• Total revenues decreased by 3.8%. The decrease in revenues from
telephony and data services was partially offset by the increase in
revenues from xDSL/Internet and wholesale.
• Revenues from telephony decreased due to a reduction in the
number of subscriptions and reduced traffic volumes. The number of
subscriptions decreased primarily due to migration to BBT with other
fixed network operators, as well as a decrease in the total market for
fixed telephony subscriptions. The decrease in traffic volumes was
due to a decrease in the number of voice minutes per subscription
as a result of migration of voice traffic from fixed to mobile telephony.
• Revenues from xDSL/Internet increased due to growth in the number
of xDSL subscriptions. This was partially offset by reduced revenues
from Internet traffic and Internet subscriptions.
• The decrease in revenues from data services was due to price reduc-
tions and a shift towards products with lower prices.
• Other revenues were in line with the fourth quarter of 2004.
Increased revenues from sale of other retail products and sale of
services to other operations within Telenor offset the decrease in
revenues from operation of telephony solutions.
• Wholesale revenues were in line with the fourth quarter of 2004.
Increased revenues from telephony, broadband, local loop unbundled
subscriptions and contractor services, offset decreased revenues
from transit traffic.
• Adjusted for one-time items and accruals between the quarters
in 2004 and 2005 there was a reduction in the EBITDA margin of
approximately 3 percentage points due to operational challenges
mainly related to increased speed for xDSL subscriptions and
increased distribution of corporate costs.
• The change in accounting treatment of prepaid costs in leases men-
tioned above had a positive effect on EBITDA of NOK 105 million for
the full year and the fourth quarter of 2005. Operating profit was not
affected. Capital expenditure increased by NOK 463 million. The
fourth quarter of 2004 included one time items that affected the
EBITDA margin positively by approximately 3 percentage points.
• The decrease in depreciation and amortization was primarily due to
a reduction in capital expenditure in recent years.
FIXED – OTHER OPERATIONS
Fourth quarter Year
(NOK in millions) 2005 2004 2005 2004
Revenues
Fixed Sweden 676 422 2 096 1 654
Fixed Denmark 164 - 306 -
Other countries/eliminations *) 47 45 179 175
Total revenues 1) 887 467 2 581 1 8291) Of which internal revenues 27 23 118 99
EBITDA
Fixed Sweden 183 (3) 158 9
Fixed Denmark 49 - 97 -
Other countries/eliminations *) (66) (4) (70) 6
Total EBITDA 166 (7) 185 15
Depreciation and amortization 1) 158 93 528 322
Write-downs 2) 614 38 617 38
Operating profit (606) (138) (960) (345)
Of which:
Fixed Sweden (549) (110) (866) (289)
Fixed Denmark 27 - 29 -
Other countries/eliminations *) (84) (28) (123) (56)1) Of which amortization
of Telenor's net excess values (6) 5 66 52) Of which write-downs
of Telenor's net excess values 12 (24) 12 (24)
Capex
Fixed Sweden 255 134 485 279
Fixed Denmark 57 - 97 -
Other countries *) 8 18 25 39
*) Other countries include operations in the Czech Republic and Slovakia. In
the fourth quarter of 2005, Fixed entered into an agreement to dispose of
these operations.
Fixed Sweden
• Bredbandsbolaget’s revenues and EBITDA amounted to NOK 358
million and NOK 90 million, respectively. Capital expenditure amount-
ed to NOK 109 million. The number of xDSL and LAN subscriptions
increased by 18,000 to 369,000, while the number of broadband
telephony subscriptions increased by 13,000 to 104,000.
• The decrease in revenues in Telenor AB was primarily related to data
services as a result of price reductions and a shift in the product
portfolio towards products with lower prices. The fourth quarter of
2004 included items that affected revenues positively by NOK 56
million.
• The change in accounting treatment of prepaid lease payments
mentioned above, had a positive effect on EBITDA in Telenor AB of
NOK 107 million and increased amortization by NOK 29 million and
capital expenditure by NOK 80 million for the full year and the fourth
quarter of 2005.
• The write-downs are mainly related to write-downs of fixed assets
in Telenor AB due to loss of contracts and price reductions.
• On 8 February 2006 Telenor acquired 13.5% of the shareholding in
Glocalnet AB for a total consideration of SEK 136 million (NOK 118
million) to secure a 50.1% ownership interest. The acquisition triggers
a mandatory offer for all outstanding shares in Glocalnet AB.
Telenor’s ownership interest as of 14 February 2006, was 84.4%.

Tele
no
r G
rou
pP
AG
E 8
Fou
rth
qu
art
er
20
05
Fixed Denmark
• The number of xDSL subscriptions increased by 13,000 to 122,000,
and the number of broadband telephony subscriptions rose by 8,000
to 26,000.
BROADCASTFourth quarter Year
(NOK in millions) 2005 2004 2005 2004
Revenues
Distribution 1 190 1 112 4 615 4 309
Transmission 313 295 1 207 1 211
Other 109 139 355 461
Eliminations (146) (171) (528) (635)
Total revenues 1) 1 466 1 375 5 649 5 3461) Of which internal revenues 35 34 131 135
EBITDA
Distribution 147 126 818 749
Transmission 183 191 713 688
Other/Eliminations 1 15 (15) 61
Total EBITDA 331 332 1 516 1 498
Depreciation and amortization 1) 144 170 554 704
Write-downs 2) (57) 44 (53) 44
Operating profit 244 118 1 015 750
Of which:
Distribution 13 (4) 494 302
Transmission 240 118 564 409
Other/Eliminations (9) 4 (43) 391) Of which amortization
of Telenor's net excess values 14 16 56 632) Of which write-downs
of Telenor's net excess values 75 25 75 25
EBITDA/Total revenues (%) 22.6 24.1 26.8 28.0
Operating profit/
Total revenues (%) 16.6 8.6 18.0 14.0
Capex 133 71 392 880
Investments in businesses 25 - 42 -
No. of DTH pay-TV subscribers
(in thousands) 906 824
No. of Cable TV subscribers
(in thousands) 681 624
No. of households in satellite
master antenna TV-networks
(in thousands) 1 160 1 212
No. of Cable TV Internet access
(in thousands) 73 44
• The number of DTH pay-TV subscribers increased by 30,000, com-
pared to an increase of 24,000 in the fourth quarter of 2004. In the
fourth quarter of 2005, the number of Cable TV (CATV) subscribers
increased by 45,000 and the number of Cable TV Internet access
subscribers increased by 20,000. This increase was mainly due to the
acquisition of the cable TV operator OE Kabel TV in Denmark. At the
date of acquisition, OE Kabel TV had 30,000 CATV subscribers and
12,000 Internet access subscribers. The remaining growth in Cable TV
subscribers was largely a result of conversion of small antenna TV
network households.
• Total revenues increased primarily due to subscriber growth in
Distribution and higher revenues from satellite- and terrestrial dis-
tribution in Transmission. This was partially offset by the effects of
appreciation of the Norwegian Krone against the Swedish Krone and
the Danish Krone..
• The decrease in the EBITDA margin for Broadcast was primarily due
to higher costs related to personnel and operations in Transmission,
and higher content costs partially offset by lower acquisition costs
per new DTH pay-TV subscriber in Distribution.
• Depreciation and amortization decreased due to fully depreciated
DTH decoders and fully depreciated fixed assets in the cable TV
operation.
• In the fourth quarter of 2005, Broadcast reversed a previous impair-
ment loss of NOK 133 million in its satellite operation in 2001 to the
recoverable amount. This was partially offset by write-down of good-
will of NOK 75 million due to recognition of not previously recognized
deferred tax assets in a business combination. According to IFRS the
acquirer shall write down the carrying amount of goodwill with the
same amount as not previously recognised deferred tax assets are
recognised as a tax income.
• The increase in capital expenditure was mainly related to upgrades
of the cable TV network in Norway.
OTHER UNITSFourth quarter Year
(NOK in millions) 2005 2004 2005 2004
Revenues
EDB Business Partner 1 258 1 154 4 991 4 287
Satellite Services 637 573 2 428 2 385
Venture 126 226 490 901
Corporate functions
and Group activities 564 558 2 266 2 154
Other (1) 14 25 174
Eliminations (46) (64) (233) (361)
Total revenues 1) 2 538 2 461 9 967 9 5401) Of which internal revenues 669 768 2 907 2 929
EBITDA
EDB Business Partner 197 196 785 978
Satellite Services 120 97 393 409
Venture (14) 70 (2) 130
Corporate functions
and Group activities (104) (168) (77) (417)
Other/eliminations (5) 26 (8) 14
Total EBITDA 194 221 1 091 1 114
Depreciation and amortization 1) 263 243 1 033 975
Write-downs 2) 10 2 10 43
Operating profit (79) (24) 48 96
Of which:
EDB Business Partner 96 130 377 736
Satellite Services 47 25 125 133
Venture (22) 63 (23) 97
Corporate functions
and Group activities (192) (268) (420) (809)
Other/eliminations (8) 26 (11) (61)1) Of which amortization
of Telenor's net excess values 1 2 8 82) Of which write-downs
of Telenor's net excess values 5 1 5 3
Capex 321 269 832 697
Investments in businesses 47 762 332 1 329
EDB BUSINESS PARTNER
• Revenues increased by 9%. The growth was mainly related to acqui-
sitions of operations from IBM and Capgemini, made at the end of the
fourth quarter of 2004.
• The EBITDA margin adjusted for other income and expenses in the
fourth quarter of 2005 was in line with the fourth quarter of 2004.
• In 2006, up until 15 February, EDB Business Partner had entered
into agreements to acquire IT companies in Norway and Sweden
for a total consideration of approximately NOK 660 million including
interest-bearing debt assumed.
SATELLITE SERVICES
• The increase in revenues and operating profit was primarily due to growth within
satellite services and communication (VSAT) and the effect of acquired opera-
tions. Revenues and operating profit were positively affected by the stronger
US Dollar against the Norwegian Krone in the fourth quarter of 2005 compared
to the same period in 2004. Operating profit was also positively affected by a
decrease in operating expenses. The volumes and prices within the Inmarsat
division have been lower in 2005 compared to 2004. In the fourth quarter of
2004, revenues and operating profit were negatively affected by a downward
adjustment of project revenues.

Tele
no
r G
rou
pP
AG
E 9
Fou
rth
qu
art
er
20
05
VENTURE
• The decrease in revenues and operating profit was primarily due
to the effects of disposal of operations in 2004.
• In the fourth quarter of 2004, the operating profit included net gains
on disposal of operations of NOK 72 million.
CORPORATE FUNCTIONS AND GROUP ACTIVITIES
• The decrease in the EBITDA loss was mainly related to reduced pen-
sion costs due to a change in the accounting treatment of pensions
in the Group in the fourth quarter of 2004. This was partially offset
by increased costs related to international activities.
• Depreciation and amortization decreased due to the disposal of
certain buildings.
OTHER PROFIT AND LOSS ITEMS FOR THE GROUP
Depreciation, amortization and write-downs
Fourth quarter Year
(NOK in millions) 2005 2004 2005 2004
Depreciation *) 2 005 1 814 8 080 7 737
Amortization **) 1 182 889 3 464 2 900
Total depreciation
and amortization 3 187 2 703 11 544 10 637
Write-downs of tangible assets 453 274 488 282
Write-downs of goodwill 80 3 127 46 3 129
Write-downs of other
intangible assets 53 85 53 120
Total write-downs 586 3 486 587 3 531
Total depreciation, amortization
and write-downs 3 773 6 189 12 131 14 168
*) Tangible assets (property, plant and equipment).
**)Other intangible assets and prepaid lease payments.
See page 20 for more specifications.
• In general, depreciation and amortization is affected by changes
in exchange rates and investment levels in the previous quarters.
• The increase in total depreciation and amortization was primarily due
to acquired businesses and increased capital expenditure, partially
offset by fully depreciated assets.
• In the fourth quarter of 2005, Telenor changed its accounting
treatment under IFRS for transactions that provide the rights to use
assets, such as local loop unbundling. Such transactions are now
recognised as leases. Prepaid costs for such leases have been
reclassified from operating costs to depreciation and amortization.
This change increased depreciation and amortization in the fourth
quarter of 2005 by NOK 175 million.
• Write-downs of tangible and other intangible assets are mainly
related to Telenor AB, partially offset by reversal of write-downs in
the satellite operation in Broadcast. Write-downs of goodwill were
due to recognition of deferred tax assets originated prior to the
acquisition of Canal Digital.
Associated companies
Fourth quarter Year
(NOK in millions) 2005 2004 2005 2004
Telenor’s share of 1)
Profit after taxes 238 140 1 452 1 055
Amortization of Telenor's
net excess values (4) (15) (46) (101)
Write-downs of Telenor's
net excess values (172) - (172) -
Gains (losses) on disposal
of ownership interests 3 15 (1) 32
Net result from
associated companies 65 140 1 233 9861) For certain associated companies, financial statements as of the Group’s
balance sheet date are not available. In such instances, the most recent
financial statements (as of a date not more than three months prior to the
Group’s balance sheet date) are used, and estimates for the last period
are made based on publicly available information. Actual figures may
deviate from the preliminary figures. The consolidated profit and loss
statement contains only the line “Net result from associated companies”.
The preceding table includes Telenor’s share of profit after taxes from
Sonofon until 12 February 2004 and ProMonte GSM until 12 August 2004.
Thereafter, these companies are consolidated as subsidiaries. DTAC and
UCOM are included until 1 November 2005. Thereafter DTAC is consolidated,
while UCOM is treated as a discontinued operation.
• At the end of 2005, Telenor's ownership interest in VimpelCom in
Russia was 29.9%. The value of Telenor’s share of the company based
on the quoted share price as at 31 December 2005 was NOK 18.4
billion. According to telecom analysts, VimpelCom had approximately
45 million mobile subscriptions at the end of 2005. The write-downs
were related to the listed company Golden Telecom Inc. to the quoted
market price as of 31 December 2005.
Financial items
Fourth quarter Year
(NOK in millions) 2005 2004 2005 2004
Financial income 148 161 447 496
Financial expenses (566) (337) (1 639) (1 561)
Net forreign currency
gains (losses) (118) (60) 84 (87)
Change in fair value of
financial instruments *) 157 - 243 -
Net gains (losses) and write-downs 31 21 518 2 673
Net financial items (348) (215) (347) 1 521
Gross interest expenses (490) (360) (1 594) 1 665
Net interest expenses (396) (270) (1 309) 1 378
*) The comparative figures for 2004 are not restated to the principles in IAS 39.
• Increased financial expenses were primarily due to the acquisition
of DTAC.
• Net foreign currency loss was primarily due to losses on an embed-
ded derivative related to the acquisition of Vodafone Sweden.
• Change in fair value of financial instruments was primarily related to
interest rate derivatives used for economic hedge of interest-bearing
liabilities that do not fulfil the requirements for hedge accounting.
Taxes
• The nominal Norwegian corporate income tax rate is 28%. The effec-
tive tax rate for the Telenor Group for the fiscal year 2005 is estimated
at 33% of profit before taxes and minority interests. The estimated
effective tax rate is affected by taxes related to companies outside
Norway and non-deductible expenses.
• During the regular tax assessment of Dansk Mobil Holding II AS in the
fourth quarter of 2005, the tax authorities challenged the company’s
tax return for the fiscal year 2004 by disallowing a tax loss derived
from the liquidation of its wholly owned subsidiary, Dansk Mobil
Holding AS. The tax authorities disagreed with our position, that the
loss is tax deductible according to the transition rules for the exemp-
tion tax rules ("Fritaksmodellen") that were enacted in 2004. See note
13 to the annual report for 2004 for more information about this
transaction and the transition rules. Telenor is of the opinion that we
have a strong case and has appealed the decision. However, accord-
ing to our accounting policies the related tax of approximately NOK
440 million was expensed in the fourth quarter of 2005.
• Following a conversion of intercompany debt, Telenor ASA recognised
a tax loss and corresponding reduced tax charges of approximately
NOK 250 million in the fourth quarter of 2005. There are strong con-
ditions to be met for such losses to be tax deductible.
• On 21 December 2005 a Norwegian Court of Appeal ruled in favour
of Telenor in respect of Telenor's intra group sale of its shares in
Sonofon Holding A/S. This sale triggered a tax loss of approximately
NOK 8.6 billion, with corresponding reduced tax charges of approxi-
mately NOK 2.4 billion for the fiscal year 2001. The taxes were paid
in 2003. The tax authorities have appealed the decision to the
Norwegian Supreme Court, and Telenor has consequently not taken
the tax reduction to income.
• The actual effective tax rate for 2005 may deviate from the estimated
rate.

Tele
no
r G
rou
pP
AG
E 1
0Fo
urt
h q
ua
rte
r 2
00
5
Balance sheet and cash flow
• Total assets as of 31 December 2005 increased by NOK 18.5 billion
compared to 30 September 2005, primarily due to the acquisitions
of UCOM and DTAC. See “Business Combinations” on page 22 for
more information about net assets and goodwill related to these
acquisitions.
• Increased property, plant and equipment were primarily due to
capital expenditure on mobile networks.
• Net interest-bearing liabilities increased by NOK 9.3 billion in the
quarter to NOK 31.1 billion as of 31 December 2005, of which the
effect of the purchase and consolidation of UCOM and DTAC con-
tributed with NOK 10.0 billion.
• Changes in translation differences to equity in the fourth quarter of
2005 were primarily due to the depreciation of the Norwegian Krone
as of 31 December compared to 30 September 2005.
• During the fourth quarter of 2005, Telenor did not purchase any own
shares in the market. For the year 2005 Telenor purchased own
shares for NOK 2.3 billion. If Telenor’s Annual General Meeting in
2006 approves redemption of shares owned by the Kingdom of
Norway corresponding to Telenor’s repurchase of own shares in the
market in the second and third quarter of 2005, in such a way that
the Kingdom of Norway’s ownership interest remains unchanged,
shareholders equity will be reduced by an additional NOK 0.9 billion
at the time of the Annual General Meeting.
• If Telenor’s Annual General Meeting in 2006 approves the suggested
dividend of NOK 2.00 per share, shareholders equity will be reduced
by an additional NOK 3.4 billion at the time of the Annual General
Meeting.
US GAAP
• Net income and equity according to United States Generally
Accepted Accounting Principles (US GAAP) will be published in
the annual report for 2005.
OUTLOOK FOR 2006
• The strong growth in mobile subscriptions during 2005 gives Telenor
a solid foundation for further growth in revenues. We expect a growth
in reported revenues in the range of 25% to 30%, based upon the
current Group structure.
• A continued high growth in EBITDA is expected, in particular driven by
the international mobile operations. Telenor will continue previously
introduced initiatives and identify new means of improving cost effi-
ciency. Telenor expects an EBITDA margin before other income and
expenses for 2006 of around 33%.
• High capital expenditure is expected to continue, and capital expen-
diture as a proportion of revenues is expected to be above 20%.
Capital expenditure is expected to continue to be driven by high
subscription growth within Telenor’s mobile operations in emerging
markets.
• A growing share of Telenor’s revenues and profits is derived from
operations outside Norway. Currency fluctuations may to an increas-
ing extent influence the reported figures in Norwegian Krone. Political
risk, including regulatory conditions, may also influence the profits.
We expect seasonal variations between the quarters.
The accounts submitted with the report have not been audited. This
report contains statements regarding the future in connection with
Telenor's growth initiatives, profit figures, outlook, strategies and objec-
tives. In particular, the section “Outlook for 2006” contains forward-
looking statements regarding the group's expectations. All statements
regarding the future are subject to inherent risks and uncertainties, and
many factors can lead to actual profits and developments deviating
substantially from what has been expressed or implied in such state-
ments. These factors include the risk factors relating to Telenor's activi-
ties described in Telenor's 2004 Annual Report on Form 20-F filed with
the Securities and Exchange Commission in the USA under the headings
“Cautionary Statement Regarding Forward-Looking Statements” and
“Risk Factors” (available at www.telenor.com/ir/).
Oslo, 15 February 2006
The Board of Directors of Telenor ASA
Tele
no
r G
rou
pP
AG
E 1
1Fo
urt
h q
ua
rte
r 2
00
5
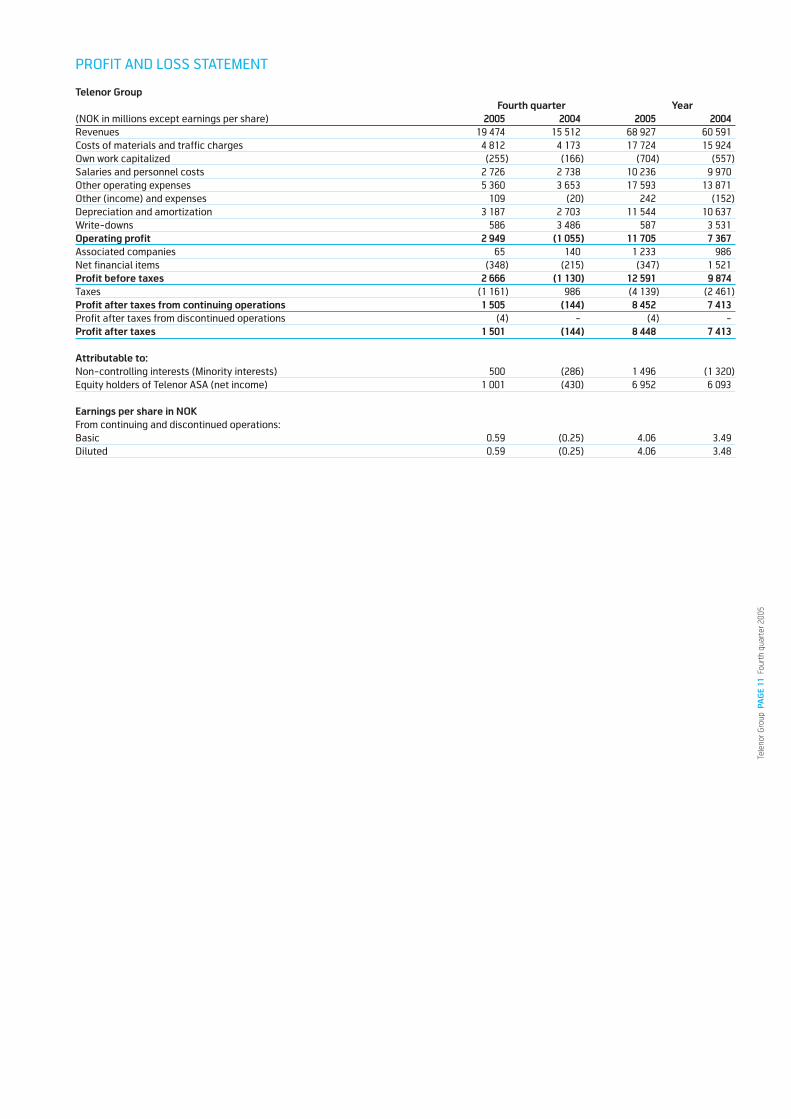
PROFIT AND LOSS STATEMENT
Telenor Group
Fourth quarter Year
(NOK in millions except earnings per share) 2005 2004 2005 2004
Revenues 19 474 15 512 68 927 60 591
Costs of materials and traffic charges 4 812 4 173 17 724 15 924
Own work capitalized (255) (166) (704) (557)
Salaries and personnel costs 2 726 2 738 10 236 9 970
Other operating expenses 5 360 3 653 17 593 13 871
Other (income) and expenses 109 (20) 242 (152)
Depreciation and amortization 3 187 2 703 11 544 10 637
Write-downs 586 3 486 587 3 531
Operating profit 2 949 (1 055) 11 705 7 367
Associated companies 65 140 1 233 986
Net financial items (348) (215) (347) 1 521
Profit before taxes 2 666 (1 130) 12 591 9 874
Taxes (1 161) 986 (4 139) (2 461)
Profit after taxes from continuing operations 1 505 (144) 8 452 7 413
Profit after taxes from discontinued operations (4) - (4) -
Profit after taxes 1 501 (144) 8 448 7 413
Attributable to:
Non-controlling interests (Minority interests) 500 (286) 1 496 (1 320)
Equity holders of Telenor ASA (net income) 1 001 (430) 6 952 6 093
Earnings per share in NOK
From continuing and discontinued operations:
Basic 0.59 (0.25) 4.06 3.49
Diluted 0.59 (0.25) 4.06 3.48

Tele
no
r G
rou
pP
AG
E 1
2Fo
urt
h q
ua
rte
r 2
00
5
BALANCE SHEET
Telenor Group
(NOK in millions) 31.12.2005 30.09.2005 31.12.2004
Deferred tax assets 2 435 1 482 3 520
Goodwill 20 722 18 273 13 355
Intangible assets 21 264 11 389 11 076
Tangible assets 43 757 40 688 37 543
Associated companies 7 424 8 320 6 602
Other financial assets 2 214 3 277 1 250
Total fixed assets 97 816 83 429 73 346
Accounts receivable 7 778 7 146 6 104
Other current assets 10 833 8 780 7 288
Assets held for sale 730
Liquid assets 7 191 6 444 5 398
Total current assets 26 532 22 370 18 790
Total assets 124 348 105 799 92 136
Shareholders equity 45 705 42 714 40 122
Minority interests 7 142 5 198 3 946
Total equity and minority interests 52 847 47 912 44 068
Pension obligations 2 440 2 403 2 297
Deferred tax liabilities 2 744 2 452 2 454
Other provisions 928 903 891
Provisions 6 112 5 758 5 642
Long-term interest-bearing liabilities 1 088 22 406 20 602
Long-term non-interest-bearing liabilities 27 471 542 573
Total long-term liabilities 28 559 22 948 21 175
Short-term interest-bearing liabilities 11 850 6 592 3 991
Accounts payable 6 214 5 402 3 806
Short-term non-interest-bearing liabilities 18 479 17 187 13 454
Short-term non interest-bearing liabilities (held for sale) 287
Total short-term liabilities 36 830 29 181 21 251
Total equity and liabilities 124 348 105 799 92 136

Tele
no
r G
rou
pP
AG
E 1
3Fo
urt
h q
ua
rte
r 2
00
5
CONSOLIDATED STATEMENT OF CHANGES IN EQUITY
Attributable to equity holders of the parent company
Cumulative
Total paid Other Retained translation Minority Total
(NOK in millions) capital reserves earnings differences Total interest equity
Balance as of 1 January 2004
– Restated according to IFRS 29 311 (732) 9 084 - 37 663 3 420 41 083
Translation differences - - - (768) (768) (419) (1 187)
Business combinations and increased
ownership interests in subsidiaries - 618 - - 618 - 618
Equity adjustments in associated companies - 62 - - 62 - 62
Tax on items taken directly to
or transferred from equity - - - 163 163 - 163
Net income (loss) recognized directly in equity - 680 - (605) 75 (419) (344)
Profit for the year 2004 - - 6 093 - 6 093 1 320 7 413
Total recognized income
and expense for the period - 680 6 093 (605) 6 168 901 7 069
Dividends - - (1 764) - (1 764) (373) (2 137)
Share buy back (2 020) - - - (2 020) - (2 020)
Sale of shares, share issue,
and share options to employees 59 16 - - 75 3 78
Transactions with shareholders in subsidiaries - - - - - (5) (5)
Balance as of 31 December 2004 27 350 (36) 13 413 (605) 40 122 3 946 44 068
Total changes in accounting policy (IAS 39) - 661 (208) - 453 8 461
Adjusted equity as of 1 January 2005 27 350 625 13 205 (605) 40 575 3 954 44 529
Translation differences - - - 547 547 441 988
Business combinations and increased
ownership interests in subsidiaries 1 477 1 477 1 477
Available-for-sale investments:
– Valuation gains (losses) taken to equity - 1 440 - - 1 440 20 1 460
– Transferred to profit or loss on sale - (388) - - (388) (24) (412)
Cash flow hedges:
– Valuation gains (losses) taken to equity - (172) - - (172) 2 (170)
– Transferred to profit or loss for the period - (13) - - (13) - (13)
– Transferred to initial carrying
amount of hedged items - 209 - - 209 - 209
Equity adjustments in associated companies - 1 - - 1 - 1
Tax on items taken directly to
or transferred from equity - (119) - (22) (141) - (141)
Net income (loss) recognized directly in equity - 2 435 - 525 2 960 439 3 399
Profit for the period - - 6 952 - 6 952 1 496 8 448
Total recognized income
and expenses for the period 27 350 3 060 20 157 (80) 50 487 5 889 56 376
Dividends - - (2 595) - (2 595) (171) (2 766)
Share buy back (2 267) - - - (2 267) - (2 267)
Sale of shares, share issue,
and share options to employees 74 6 - - 80 5 85
Transactions with shareholders in subsidiaries - - - - - 1 419 1 419
Balance as of 31 December 2005 25 157 3 066 17 562 (80) 45 705 7 142 52 847

Tele
no
r G
rou
pP
AG
E 1
4Fo
urt
h q
ua
rte
r 2
00
5
CASH FLOW STATEMENT
Telenor Group
Fourth quarter Year
(NOK in millions except earnings per share) 2005 2004 2005 2004
Profit before taxes and minority interests 2 666 (1 130) 12 591 9 874
Taxes paid (641) (274) (1 369) (1 516)
Net (gains) losses, including write-downs and change in fair value of financial items (191) (147) (929) (3 161)
Depreciation, amortization and write-downs 3 773 6 189 12 131 14 168
Associated companies (65) (140) (1 233) (986)
Difference between expensed and paid pensions 8 (82) 211 267
Currency (gains) losses not related to operating activities 185 34 (18) 57
Change in other accruals 424 542 956 288
Net cash flow from operating activities 6 159 4 992 22 340 18 991
Payments on purchase of tangible and intangible assets (5 135) (3 398) (14 213) (11 613)
Payments on purchase of subsidiaries and associated companies, net of cash received (2 475) (1 046) (8 228) (6 281)
Proceeds from sale of tangible and intangible assets and businesses,
net of cash transferred 118 395 1 279 1 112
Proceeds from sale of and payments for other investments 64 697 1 064 3 751
Net cash flow from investment activities (7 428) (3 352) (19 998) (13 031)
Proceeds from and payments of interest-bearing liabilities 1 965 (485) 4 175 (4 311)
Issuance of shares and repayment of equity 27 7 74 33
Share buy back - - (2 267) (2 020)
Dividends paid to minority interests (10) (4) (219) (193)
Dividends paid to Telenor's shareholders - - (2 595) (1 764)
Net cash flow from financing activities 1 982 (482) (832) (8 255)
Effect on cash and cash equivalents of changes in foreign exchange rates 60 (174) 215 (268)
Net change in cash and cash equivalents 773 984 1 725 (2 563)
Cash and cash equivalents at the beginning of the period 6 033 4 097 5 081 7 644
Cash and cash equivalents at the end of the period 6 806 5 081 6 806 5 081

Tele
no
r G
rou
pP
AG
E 1
5Fo
urt
h q
ua
rte
r 2
00
5
TH
E O
PE
RA
TIO
NS
FO
UR
TH
QU
AR
TE
RP
rofi
t (l
os
s)
be
fore
ta
xe
s
To
tal
Op
era
tin
g p
rofi
tA
ss
oc
iate
dN
et
fin
an
cia
la
nd
min
ori
ty
rev
en
ue
so
f w
hic
h e
xte
rna
lE
BIT
DA
(lo
ss
)c
om
pa
nie
sit
em
sin
tere
sts
(NO
K in
mil
lio
ns)
20
05
20
04
20
05
20
04
20
05
20
04
20
05
20
04
20
05
20
04
20
05
20
04
20
05
20
04
Tele
no
r M
ob
il –
No
rwa
y3
23
5
2 9
63
2
95
4
2 6
74
1
18
6
1 1
19
9
62
8
27
1
3
7
19
1
3
99
4
84
7
So
no
fon
– D
en
ma
rk1
33
4
1 2
43
1
30
0
1 2
23
3
08
1
6
12
(3
55
1)
1
-
(50
)(3
9)
(37
)(3
59
0)
Ky
ivst
ar
– U
kra
ine
2 3
90
1
18
4
2 3
89
1
18
3
1 3
59
7
12
1
01
9
55
5
-
-
(64
)(2
5)
95
5
53
0
Pa
nn
on
GS
M –
Hu
ng
ary
1 5
65
1
51
0
1 5
61
1
50
7
53
4
42
0
24
5
87
-
-
4
8
32
2
93
1
19
DiG
i.Co
m –
Ma
lay
sia
1 4
52
1
00
4
1 4
50
1
00
4
63
2
44
3
35
6
22
8
-
-
5
(19
)3
61
2
09
Gra
me
en
Ph
on
e –
Ba
ng
lad
esh
85
0
57
0
84
9
57
0
45
5
33
8
28
9
26
3
-
-
(80
)(1
)2
09
2
62
Oth
er
mo
bil
e o
pe
rati
on
s1
49
1
17
9
1 4
58
1
53
5
0
(61
8)
(29
5)
(76
7)
22
9
48
(8
4)
(22
)(1
50
)(7
41
)
Fix
ed
5 0
25
4
78
1
4 4
23
4
27
4
1 5
43
1
56
0
84
6
53
(1
67
)7
(1
54
)(4
8)
(23
7)
61
2
Bro
ad
ca
st1
46
6
1 3
75
1
43
1
1 3
41
3
31
3
32
2
44
1
18
1
3
9
(20
)(9
3)
23
7
34
Oth
er
op
era
tio
ns
2 5
38
2
46
1
1 8
69
1
69
3
19
4
22
1
(79
)(2
4)
(24
)6
9
33
5
66
(7
0)
61
1
Eli
min
ati
on
s(1
87
2)
(1 7
58
)(2
10
)(1
10
)1
30
5
91
1
12
5
56
-
-
(1
)(5
79
)1
11
(2
3)
To
tal
19
47
4
15
51
2
19
47
4
15
51
2
6 7
22
5
13
4
2 9
49
(1
05
5)
65
1
40
(3
48
)(2
15
)2
66
6
(1 1
30
)
TH
E O
PE
RA
TIO
NS
FO
R T
HE
YE
AR
Pro
fit
(lo
ss
)
be
fore
ta
xe
s
To
tal
Op
era
tin
g p
rofi
tA
ss
oc
iate
dN
et
fin
an
cia
la
nd
min
ori
ty
rev
en
ue
so
f w
hic
h e
xte
rna
lE
BIT
DA
(lo
ss
)c
om
pa
nie
sit
em
sin
tere
sts
(NO
K in
mil
lio
ns)
20
05
20
04
20
05
20
04
20
05
20
04
20
05
20
04
20
05
20
04
20
05
20
04
20
05
20
04
Tele
no
r M
ob
il –
No
rwa
y1
2 2
43
1
1 7
30
1
1 0
72
1
0 5
04
4
47
1
4 3
05
3
56
6
3 2
28
3
2
10
6
5
64
3
66
3
3 3
02
So
no
fon
– D
en
ma
rk5
19
1
4 4
04
5
05
9
4 3
51
1
17
6
68
1
(10
9)
(3 7
99
)1
-
(1
75
)(1
64
)(2
83
)(3
96
3)
Ky
ivst
ar
– U
kra
ine
7 2
72
4
21
9
7 2
66
4
21
7
4 0
50
2
58
1
2 8
26
2
02
6
-
-
(14
4)
(15
9)
2 6
82
1
86
7
Pa
nn
on
GS
M –
Hu
ng
ary
6 0
61
5
90
7
6 0
51
5
90
1
2 1
85
2
09
3
1 0
07
7
77
-
-
1
07
5
0
1 1
14
8
27
DiG
i.Co
m –
Ma
lay
sia
4 9
32
3
94
6
4 9
28
3
94
3
2 1
42
1
73
2
1 0
99
8
31
-
-
(2
4)
(11
0)
1 0
75
7
21
Gra
me
en
Ph
on
e –
Ba
ng
lad
esh
2 9
70
2
18
6
2 9
69
2
18
6
1 5
59
1
31
3
1 1
20
1
09
5
-
-
(10
9)
1
1 0
11
1
09
6
Oth
er
mo
bil
e o
pe
rati
on
s2
21
9
42
3
2 0
76
3
35
(3
43
)(7
12
)(9
54
)(9
03
)1
35
5
78
9
(68
)(6
1)
33
3
(17
5)
Fix
ed
19
31
3
19
25
6
17
14
0
17
43
3
5 8
85
6
33
8
2 0
62
2
72
5
(14
2)
69
(5
17
)(4
42
)1
40
3
2 3
52
Bro
ad
ca
st5
64
9
5 3
46
5
51
8
5 2
11
1
51
6
1 4
98
1
01
5
75
0
73
4
6
19
0
(47
5)
1 2
78
3
21
Oth
er
op
era
tio
ns
9 9
67
9
54
0
7 0
60
6
61
1
1 0
91
1
11
4
48
9
6
(87
)7
0
12
3
4 0
84
8
4
4 2
50
Eli
min
ati
on
s(6
89
0)
(6 3
66
)(2
12
)(1
01
)1
04
5
92
2
5
54
1
1
2
20
5
(1 2
67
)2
31
(7
24
)
To
tal
68
92
7
60
59
1
68
92
7
60
59
1
23
83
6
21
53
5
11
70
5
7 3
67
1
23
3
98
6
(34
7)
1 5
21
1
2 5
91
9
87
4

Tele
no
r G
rou
pP
AG
E 1
6Fo
urt
h q
ua
rte
r 2
00
5
AN
ALY
TIC
AL
IN
FO
RM
AT
ION
20
03
20
04
20
05
Q1
Q2
Q3
Q4
Q1
Q2
Q3
Q4
Q1
Q2
Q3
Q4
Re
ve
nu
es
(NO
K in
mil
lio
ns)
-
-
-
-
14
24
5
15
22
6
15
60
8
15
51
2
15
27
0
16
54
2
17
64
1
19
47
4
EB
ITD
A (
NO
K in
mil
lio
ns)
-
-
-
-
5 0
48
5
69
8
5 6
55
5
13
4
5 1
06
5
63
0
6 3
78
6
72
2
Op
era
tin
g p
rofi
t (l
oss
) (N
OK
in m
illi
on
s)-
-
-
-
2
53
7
2 9
90
2
89
5
(1 0
55
)2
42
5
2 8
59
3
47
2
2 9
49
Pro
fit
(lo
ss)
be
fore
ta
xes
(NO
K in
mil
lio
ns)
-
-
-
-
5 0
33
2
98
3
2 9
88
(1
13
0)
2 8
15
3
32
5
3 7
85
2
66
6
Eq
uit
y r
ati
o in
clu
din
g m
ino
rity
inte
rest
s (%
)-
-
-
-
4
6.8
4
6.3
4
8.8
4
7.8
4
7.2
4
4.5
4
5.3
4
2.5
Ne
t in
tere
st-
be
ari
ng
lia
bil
itie
s (N
OK
in m
illi
on
s)2
6 1
39
2
5 3
17
2
1 5
84
1
7 8
17
1
9 2
97
2
1 9
73
2
0 5
96
1
9 1
95
1
5 9
33
1
7 8
14
2
1 8
38
3
1 1
33
Ne
t in
tere
st-
be
ari
ng
lia
bil
itie
s/E
BIT
DA
be
fore
oth
er
inc
om
e a
nd
lo
sse
s la
st 1
2 m
on
ths
1.8
1
.6
1.3
1
.0
1.0
1
.1
1.0
0
.9
0.8
0
.9
1.0
1
.3
Ca
pe
x (N
OK
in m
illi
on
s)1
23
0
1 3
14
1
46
0
2 4
50
1
47
1
4 0
12
3
14
0
4 1
22
3
36
0
2 9
23
3
72
0
6 4
36
Inv
est
me
nts
in b
usi
ne
sse
s (N
OK
in m
illi
on
s)2
3
26
8
9
26
3
3 7
49
2
94
6
44
1
12
2
50
2
64
5
82
4
2 7
20
No
. of
ma
n-
ye
ars
21
20
0
21
15
0
20
30
0
19
45
0
20
60
0
20
20
0
20
70
0
20
90
0
21
90
0
22
40
0
23
40
0
27
60
0
– o
f w
hic
h o
uts
ide
No
rwa
y8
70
0
8 7
00
8
10
0
7 4
50
8
65
0
8 7
50
9
45
0
9 5
00
1
0 6
00
1
1 1
00
1
2 4
00
1
6 7
00
MO
BIL
E O
PE
RA
TIO
NS
*)
Te
len
or
Mo
bil
– N
orw
ay
No
. of
mo
bil
e s
ub
scri
pti
on
s (N
MT
+ G
SM
) (i
n t
ho
usa
nd
s)2
34
2
2 3
30
2
36
4
2 3
64
2
37
8
2 4
51
2
56
2
2 6
45
2
63
5
2 6
87
2
73
6
2 7
31
No
. of
GS
M s
ub
scri
pti
on
s (i
n t
ho
usa
nd
s)2
29
4
2 2
85
2
32
4
2 3
27
2
34
6
2 4
22
2
53
6
2 6
23
2
63
5
2 6
87
2
73
6
2 7
31
– o
f w
hic
h p
rep
aid
1 0
93
1
09
1
1 1
20
1
09
9
1 0
91
1
11
8
1 1
78
1
22
8
1 2
18
1
26
7
1 2
85
1
22
2
Av
era
ge
tra
ffic
min
ute
s p
er
sub
scri
pti
on
pe
r m
on
th (
AM
PU
) in
th
e q
ua
rte
r1
68
1
79
1
82
1
76
1
79
1
87
1
87
1
82
1
75
1
91
1
86
1
84
Av
era
ge
re
ve
nu
e p
er
sub
scri
pti
on
pe
r m
on
th (
AR
PU
) in
th
e q
ua
rte
r3
17
3
30
3
35
3
10
3
15
3
32
3
28
3
18
2
97
3
08
3
14
3
17
– o
f w
hic
h c
on
tra
ct
45
9
47
6
48
9
45
2
46
4
49
1
49
9
49
1
45
3
46
5
47
5
47
2
– o
f w
hic
h p
rep
aid
15
8
16
6
16
7
15
5
14
7
14
6
12
9
11
9
11
7
12
9
13
3
13
6
No
. of
SM
S/M
MS
an
d c
on
ten
t m
ess
ag
es
(in
mil
lio
ns)
56
6
59
4
61
9
63
0
61
1
65
6
72
6
79
2
81
8
83
8
88
1
92
2
So
no
fon
– D
en
ma
rk
No
. of
mo
bil
e s
ub
scri
pti
on
s (i
n t
ho
usa
nd
s)-
-
-
-
9
87
1
20
3
1 2
53
1
27
5
1 2
32
1
25
0
1 2
61
1
28
4
– o
f w
hic
h p
rep
aid
-
-
-
-
25
0
45
1
48
5
46
2
41
3
42
0
42
0
42
5
Av
era
ge
tra
ffic
min
ute
s p
er
sub
scri
pti
on
pe
r m
on
th (
AM
PU
) in
th
e q
ua
rte
r-
-
-
-
1
47
1
57
1
39
1
51
1
53
1
82
1
83
1
95
Av
era
ge
re
ve
nu
e p
er
sub
scri
pti
on
pe
r m
on
th (
AR
PU
) in
th
e q
ua
rte
r-
-
-
-
25
0
23
3
21
9
20
7
22
9
25
3
24
3
24
6
– o
f w
hic
h c
on
tra
ct
--
--
28
7
29
1
28
1
26
7
28
4
30
6
29
2
28
5
– o
f w
hic
h p
rep
aid
--
--
13
5
11
1
12
0
11
1
12
6
14
6
14
6
16
6
No
. of
SM
S/M
MS
an
d c
on
ten
t m
ess
ag
es
(in
mil
lio
ns)
--
--
47
9
54
5
58
8
68
7
72
2
71
6
74
7
87
5
Te
len
or
Mo
bil
e S
we
de
n
No
. of
mo
bil
e s
ub
scri
pti
on
s (i
n t
ho
usa
nd
s)5
2
59
6
5
81
8
4
92
9
6
10
5
10
7
99
9
7
95
– o
f w
hic
h p
rep
aid
26
2
3
28
4
4
48
5
5
56
5
7
56
5
1
50
4
8
Av
era
ge
tra
ffic
min
ute
s p
er
sub
scri
pti
on
pe
r m
on
th (
AM
PU
) in
th
e q
ua
rte
r2
8
38
4
9
69
7
3
96
1
04
1
08
1
13
1
41
1
44
1
29
Av
era
ge
re
ve
nu
e p
er
sub
scri
pti
on
pe
r m
on
th (
AR
PU
) in
th
e q
ua
rte
r1
20
1
55
1
72
1
75
1
69
1
81
1
82
1
69
1
64
1
67
1
64
1
36
– o
f w
hic
h c
on
tra
ct
19
5
23
9
25
2
24
8
25
2
26
2
26
5
24
1
21
5
21
6
21
5
18
3
– o
f w
hic
h p
rep
aid
45
4
9
56
1
03
1
06
1
22
1
25
1
17
1
21
1
21
1
15
9
0
Ky
ivs
tar
– U
kra
ine
No
. of
mo
bil
e s
ub
scri
pti
on
s (1
00
% in
th
ou
san
ds)
2 0
12
2
20
5
2 5
12
3
03
7
3 2
21
3
61
0
4 8
56
6
25
2
7 6
62
9
33
5
10
94
3
13
92
5
– o
f w
hic
h p
rep
aid
1 6
14
1
76
8
2 0
37
2
50
3
2 6
75
3
03
1
4 2
11
5
53
2
6 8
92
8
50
0
10
02
1
12
90
1
Av
era
ge
tra
ffic
min
ute
s p
er
sub
scri
pti
on
pe
r m
on
th (
AM
PU
) in
th
e q
ua
rte
r4
2
51
5
7
72
6
8
74
9
59
59
19
0
10
3
10
8
Av
era
ge
re
ve
nu
e p
er
sub
scri
pti
on
pe
r m
on
th (
AR
PU
) in
th
e q
ua
rte
r7
7
87
9
8
93
8
4
93
9
5
68
5
3
62
6
6
64
– o
f w
hic
h c
on
tra
ct
16
8
17
6
20
3
20
0
19
1
21
3
22
3
18
4
16
5
18
7
20
0
19
7
– o
f w
hic
h p
rep
aid
55
6
5
73
7
0
62
6
9
72
5
2
40
4
9
53
5
3
Pa
nn
on
– H
un
ga
ry
No
. of
mo
bil
e s
ub
scri
pti
on
s (i
n t
ho
usa
nd
s)2
51
4
2 5
14
2
56
4
2 6
18
2
59
6
2 5
88
2
59
5
2 7
70
2
79
2
2 8
24
2
85
6
2 9
29
– o
f w
hic
h p
rep
aid
1 9
89
1
98
1
2 0
19
2
02
3
1 9
77
1
93
5
1 8
86
1
99
1
1 9
55
1
91
5
1 8
94
1
90
4
Av
era
ge
tra
ffic
min
ute
s p
er
sub
scri
pti
on
pe
r m
on
th (
AM
PU
) in
th
e q
ua
rte
r1
04
1
10
1
13
1
16
1
11
1
21
1
27
1
31
1
25
1
43
1
45
1
49
Av
era
ge
re
ve
nu
e p
er
sub
scri
pti
on
pe
r m
on
th (
AR
PU
) in
th
e q
ua
rte
r1
51
1
61
1
65
1
70
1
65
1
70
1
84
1
71
1
57
1
62
1
66
1
62
– o
f w
hic
h c
on
tra
ct
38
8
41
4
41
6
41
2
39
9
38
9
40
0
35
6
32
7
31
6
31
4
29
9
– o
f w
hic
h p
rep
aid
86
9
2
97
9
9
92
9
6
10
3
96
8
4
89
8
9
86

20
03
20
04
20
05
Q1
Q2
Q3
Q4
Q1
Q2
Q3
Q4
Q1
Q2
Q3
Q4
DT
AC
– T
ha
ila
nd
No
. of
mo
bil
e s
ub
scri
pti
on
s (1
00
% in
th
ou
san
ds)
--
--
--
--
--
-8
67
7
– o
f w
hic
h p
rep
aid
--
--
--
--
--
-7
21
2
Av
era
ge
tra
ffic
min
ute
s p
er
sub
scri
pti
on
pe
r m
on
th (
AM
PU
) in
th
e q
ua
rte
r-
--
--
--
--
--
23
1
Av
era
ge
re
ve
nu
e p
er
sub
scri
pti
on
pe
r m
on
th (
AR
PU
) in
th
e q
ua
rte
r-
--
--
--
--
--
71
– o
f w
hic
h c
on
tra
ct
--
--
--
--
--
-1
61
– o
f w
hic
h p
rep
aid
--
--
--
--
--
-5
4
DiG
i.C
om
– M
ala
ys
ia
No
. of
mo
bil
e s
ub
scri
pti
on
s (1
00
% in
th
ou
san
ds)
1 8
02
1
94
4
2 0
53
2
20
5
2 4
13
2
58
3
2 8
04
3
23
9
3 4
61
3
76
5
4 1
87
4
79
5
– o
f w
hic
h p
rep
aid
1 7
09
1
85
0
1 9
53
2
10
1
2 3
01
2
45
3
2 6
53
3
06
7
3 2
59
3
52
5
3 8
80
4
44
1
Av
era
ge
tra
ffic
min
ute
s p
er
sub
scri
pti
on
pe
r m
on
th (
AM
PU
) in
th
e q
ua
rte
r1
74
1
73
1
77
1
75
1
67
1
64
1
70
1
65
1
63
1
70
1
75
1
69
Av
era
ge
re
ve
nu
e p
er
sub
scri
pti
on
pe
r m
on
th (
AR
PU
) in
th
e q
ua
rte
r1
21
1
10
1
15
1
15
1
13
1
07
1
10
9
8
92
9
9
10
0
10
2
– o
f w
hic
h c
on
tra
ct
29
4
30
9
32
6
31
8
31
2
31
2
29
7
23
8
23
3
21
6
19
2
17
4
– o
f w
hic
h p
rep
aid
11
1
99
1
05
1
05
1
04
9
7
10
0
90
8
4
93
9
3
97
Gra
me
en
Ph
on
e –
Ba
ng
lad
es
h
No
. of
mo
bil
e s
ub
scri
pti
on
s (1
00
% in
th
ou
san
ds)
83
5
92
8
1 0
47
1
14
1
1 5
20
1
79
5
2 0
24
2
38
8
2 9
28
3
70
4
4 2
15
5
54
2
– o
f w
hic
h p
rep
aid
63
1
72
5
82
0
89
9
1 2
58
1
50
1
1 7
30
2
09
2
2 6
25
3
37
5
3 8
60
5
15
9
Av
era
ge
tra
ffic
min
ute
s p
er
sub
scri
pti
on
pe
r m
on
th (
AM
PU
) in
th
e q
ua
rte
r2
21
2
25
2
33
2
30
2
39
2
46
2
49
2
41
2
37
2
23
2
23
2
50
Av
era
ge
re
ve
nu
e p
er
sub
scri
pti
on
pe
r m
on
th (
AR
PU
) in
th
e q
ua
rte
r1
33
1
32
1
41
1
28
1
20
1
06
1
03
8
7
81
6
9
65
5
6
– o
f w
hic
h c
on
tra
ct
27
4
28
2
33
2
31
9
33
1
28
7
30
2
25
7
28
8
28
4
28
2
25
8
– o
f w
hic
h p
rep
aid
86
8
7
88
7
6
71
6
9
67
6
0
54
4
7
45
3
9
Te
len
or
Pa
kis
tan
No
. of
mo
bil
e s
ub
scri
pti
on
s (i
n t
ho
usa
nd
s)-
--
--
--
-3
44
8
36
1
20
0
1 8
68
Pro
Mo
nte
GS
M –
Mo
nte
ne
gro
No
. of
mo
bil
e s
ub
scri
pti
on
s (i
n t
ho
usa
nd
s)-
--
--
-3
40
2
79
2
79
3
03
3
94
3
10
– o
f w
hic
h p
rep
aid
--
--
--
29
7
23
4
23
5
26
3
35
2
26
5
Av
era
ge
tra
ffic
min
ute
s p
er
sub
scri
pti
on
pe
r m
on
th (
AM
PU
) in
th
e q
ua
rte
r-
--
--
-1
13
8
7
91
1
05
1
09
9
2
Av
era
ge
re
ve
nu
e p
er
sub
scri
pti
on
pe
r m
on
th (
AR
PU
) in
th
e q
ua
rte
r-
--
--
-1
39
1
07
1
15
1
29
1
26
9
5
– o
f w
hic
h c
on
tra
ct
--
--
--
30
9
28
4
28
8
33
8
33
9
26
9
– o
f w
hic
h p
rep
aid
--
--
--
11
1
79
8
2
97
1
03
7
1
As
so
cia
ted
co
mp
an
ies
No
. of
mo
bil
e s
ub
scri
pti
on
s (1
00
% in
th
ou
san
ds)
17
15
8
15
10
5
17
03
5
19
47
8
21
02
8
24
59
4
28
66
2
33
76
3
38
64
5
42
32
8
46
61
5
40
59
3
FIX
ED
– N
orw
ay
Re
tail
ma
rke
t
No
. of
PS
TN
su
bsc
rip
tio
ns
(in
th
ou
san
ds)
1 4
49
1
42
7
1 3
81
1
30
8
1 2
48
1
21
9
1 1
96
1
18
2
1 1
65
1
13
9
1 1
18
1
08
9
No
. of
ISD
N s
ub
scri
pti
on
s (l
ine
s in
th
ou
san
ds)
1 8
16
1
80
0
1 7
55
1
68
2
1 6
00
1
54
8
1 4
98
1
44
9
1 3
94
1
33
5
1 2
76
1
22
7
PS
TN
/IS
DN
/BB
T g
en
era
ted
tra
ffic
(m
illi
on
min
ute
s)4
26
8
3 8
76
3
45
4
3 7
87
3
72
5
3 2
79
2
85
1
3 1
71
2
84
8
2 6
44
2
28
9
2 5
02
Ma
rke
t sh
are
of
PS
TN
/IS
DN
/BB
T g
en
era
ted
tra
ffic
(%
)6
8
68
6
8
68
6
7
68
6
7
67
6
7
67
6
6
66
No
. of
On
lin
e s
ub
scri
pti
on
s re
sid
en
tia
l m
ark
et
(in
th
ou
san
ds)
31
5
30
4
30
1
29
4
28
6
27
6
26
3
24
1
21
5
19
7
18
2
16
5
No
. of
xDS
L s
ub
scri
pti
on
s re
sid
en
tia
l m
ark
et
(in
th
ou
san
ds)
11
4
12
4
13
9
16
3
19
1
21
4
24
5
28
6
33
9
36
4
38
8
41
4
No
. of
xDS
L s
ub
scri
pti
on
s b
usi
ne
ss m
ark
et
No
rwa
y (
in t
ho
usa
nd
s)7
1
0
11
1
4
17
2
1
25
4
0
46
5
1
56
6
1
Wh
ole
sa
le m
ark
et
No
. of
PS
TN
su
bsc
rip
tio
ns
(in
th
ou
san
ds)
11
1
2
42
1
04
15
1
17
0
18
0
18
8
19
2
20
0
20
2
20
2
No
. of
ISD
N s
ub
scri
pti
on
s (l
ine
s in
th
ou
san
ds)
14
1
7
52
1
26
18
8
21
5
23
4
25
0
25
6
25
9
25
6
25
1
No
. of
xDS
L s
ub
scri
pti
on
s (i
n t
ho
usa
nd
s)2
1
31
4
1
56
76
8
6
90
9
1
77
8
7
97
1
09
No
. of
LL
UB
(in
th
ou
san
ds)
53
5
9
68
8
09
6
10
8
12
3
14
5
17
2
19
2
20
9
23
5
BR
OA
DC
AS
T
No
. of
tele
vis
ion
su
bsc
rib
ers
in t
he
No
rdic
re
gio
n
– D
TH
pa
y-
TV
su
bsc
rib
ers
(in
th
ou
san
ds)
7
13
7
08
7
26
7
63
7
78
7
82
8
00
8
24
8
51
8
53
8
76
9
06
– C
ab
le T
V s
ub
scri
be
rs (
in t
ho
usa
nd
s)5
75
5
90
5
94
6
04
6
05
6
11
6
14
6
24
6
16
6
19
6
36
6
81
- H
ou
seh
old
s in
sa
tell
ite
ma
ste
r a
nte
nn
a T
V-
ne
two
rks
(in
th
ou
san
ds)
1 1
30
1
04
9
1 1
00
1
09
8
1 1
32
1
16
1
1 1
90
1
21
2
1 1
97
1
20
5
1 1
84
1
16
0
– C
ab
le T
V I
nte
rne
t a
cc
ess
(in
th
ou
san
ds)
2
4
26
2
8
31
3
4
35
3
8
44
4
8
50
5
3
73
*)A
RP
U f
or
20
03
ha
s n
ot
be
en
re
sta
ted
to
co
mp
ly w
ith
IF
RS
Tele
no
r G
rou
pP
AG
E 1
7Fo
urt
h q
ua
rte
r 2
00
5

Tele
no
r G
rou
pP
AG
E 1
8Fo
urt
h q
ua
rte
r 2
00
5
SPECIAL ITEMS
Fourth quarter Year
(NOK in millions) 2005 2004 2005 2004
Gains on disposal of fixed assets and operations
Sonofon – Denmark - - 1 -
Pannon GSM – Hungary - 2 10 5
Fixed 37 9 88 10
Broadcast - 1 1 1
EDB Business Partner 6 3 31 303
Other business units 2 71 22 144
Corporate functions and Group activities 26 35 163 99
Eliminations 4 - 4 -
Total gains on disposal of fixed assets and operations 75 121 320 562
Losses on disposal of fixed assets and operations
Telenor Mobil – Norway 3 - 16 -
Sonofon – Denmark - (2) - -
Pannon GSM – Hungary (3) - 19 3
DiGi.Com – Malaysia - - 5 -
GrameenPhone – Bangladesh - 4 10 8
Other mobile operations 1 - 1 -
Fixed 65 (1) 65 25
Broadcast - 1 1 1
Other business units 1 (13) 1 21
Corporate functions and Group activities 4 5 33 31
Eliminations 1 1 1 (15)
Total losses on disposal of fixed assets and operations 72 (5) 152 74
Expenses for workforce reductions and loss contracts
Telenor Mobil – Norway (1) 24 (2) 24
Sonofon – Denmark 9 28 12 28
Pannon GSM – Hungary 10 1 10 16
Other mobile operations 291 562 414 562
Fixed 8 39 159 86
Broadcast - 3 - 5
EDB Business Partner 13 (10) 18 33
Other business units 8 11 15 28
Corporate functions and Group activities 16 10 29 116
Eliminations (242) (562) (245) (562)
Total workforce reductions and loss contracts 112 106 410 336
Total other (income) and expenses 109 (20) 242 (152)
Fourth quarter Year
(NOK in millions) 2005 2004 2005 2004
Write-downs
Telenor Mobil – Norway 2 11 16 15
Sonofon – Denmark - 3 290 - 3 290
Kyivstar – Ukraine 15 - 15 -
Pannon GSM – Hungary 4 21 7 21
DiGi.Com – Malaysia 3 - 5 -
GrameenPhone – Bangladesh - 3 - 3
Other mobile operations - 75 - 75
Fixed 609 40 587 40
Broadcast (57) 44 (53) 44
Other business units 8 2 8 41
Corporate functions and Group activities 2 - 2 2
Total write-downs 586 3 486 587 3 531
Special items associated companies
(Gains) losses on disposal of ownership interests (3) (15) 1 (32)
Write-downs associated companies 172 - 172 -
(Gains) losses on disposal and write-downs of associated companies 169 (15) 173 (32)
Net (gains) losses and write-downs financial items (31) (21) (518) (2 673)

Tele
no
r G
rou
pP
AG
E 1
9Fo
urt
h q
ua
rte
r 2
00
5
RECONCILIATIONS
Fourth quarter Year
(NOK in millions) 2005 2004 2005 2004
Net income 6 640 (430) 12 591 6 093
Minority interests 996 (286) - (1 320)
Profit before minority interests 5 644 (144) 12 591 7 413
Taxes 2 978 986 - (2 461)
Profit before taxes 2 666 (1 130) 12 591 9 874
Net financial items (348) (215) (347) 1 521
Associated companies 65 140 1 233 986
Depreciation and amortization 3 187 2 703 11 544 10 637
Write-downs 586 3 486 587 3 531
EBITDA 6 722 5 134 23 836 21 535
EBITDA 6 722 5 134 23 836 21 535
Other (income) and expenses 109 (20) 242 (152)
EBITDA before other income and expenses 6 831 5 114 24 078 21 383
Operating profit 2 949 (1 055) 11 705 7 367
Write-downs 586 3 486 587 3 531
Other (income) and expenses 109 (20) 242 (152)
Adjusted operating profit 3 644 2 411 12 534 10 746
Profit before taxes 2 666 (1 130) 12 591 9 874
Net (gains) losses and write-downs financial items (31) (21) (518) (2 673)
(Gains) losses on disposal and write downs of associated companies 169 (15) 173 (32)
Write-downs 586 3 486 587 3 531
Other (income) and expenses 109 (20) 242 (152)
Adjusted profit before taxes 3 499 2 300 13 075 10 548

Tele
no
r G
rou
p P
AG
E 2
0Fo
urt
h q
ua
rte
r 2
00
5
SPECIFICATION OF DEPRECIATION AND AMORTIZATION
Fourth quarter Year
(NOK in millions) 2005 2004 2005 2004
Depreciation of tangible assets
Telenor Mobil – Norway 159 211 661 781
Sonofon – Denmark 92 (22) 416 340
Kyivstar – Ukraine 193 92 834 301
Pannon GSM – Hungary 139 166 594 689
DiGi.Com – Malaysia 250 187 912 779
GrameenPhone – Bangladesh 158 67 410 205
DTAC – Thailand 26 - 26 -
Telenor Pakistan 52 - 117 -
ProMonte GSM – Montenegro 16 19 70 28
Telenor Mobile Sweden - 1 - 4
Fixed 589 758 2 720 3 173
Broadcast 126 142 486 605
Other operations 208 183 837 838
Eliminations (3) 10 (3) (6)
Total depreciation 2 005 1 814 8 080 7 737
Amortization of other intangible assets and prepaid lease payments
Telenor Mobil – Norway 63 71 228 282
Sonofon – Denmark 204 299 869 850
Kyivstar – Ukraine 132 66 375 255
Pannon GSM – Hungary 146 145 577 605
DiGi.Com – Malaysia 23 29 126 123
GrameenPhone – Bangladesh 8 6 29 11
DTAC – Thailand 194 - 194 -
Telenor Pakistan 33 - 109 -
ProMonte GSM – Montenegro 24 29 95 39
Telenor Mobile Sweden - 24 - 44
Fixed 261 108 516 399
Broadcast 18 28 68 99
Other operations 55 59 196 136
Eliminations 21 25 82 57
Total amortization 1 182 889 3 464 2 900

Tele
no
r G
rou
pP
AG
E 2
1Fo
urt
h q
ua
rte
r 2
00
5
DEFINITIONS
MOBILE OPERATIONS
Revenues
Subscription and traffic
– consist of subscription and connection fees, revenues from voice out-
going airtime, non-voice traffic, outbound roaming and other mobile
service revenues. Subscription and traffic includes only revenues from
the company’s own subscriptions.
Interconnection revenues
– consist of revenues from incoming traffic. Revenues from incoming
traffic related to service provider subscriptions are not included.
Other mobile revenues
– consist of inbound roaming, national roaming and revenues related
to service providers and MVNOs (Mobile Virtual Network Operators).
Non-mobile revenues
– consist of revenues from customer equipment and businesses that
are not directly related to mobile operations.
Key Figures
Subscriptions
Contract subscriptions are counted until the subscription is terminated.
Prepaid subscriptions are counted as active if there has been outgoing
or incoming traffic or if the SIM-card has been reloaded during the last
three months.
Service provider and MVNO subscriptions are not included.
Data only SIM-cards are included, but SIM-cards used for telemetric
applications are excluded. Telemetric is defined as machine-to-
machine SIM-cards (M2M), for example, vending machines and meter
readings.
Average traffic minutes per subscription per month (AMPU)
Traffic minutes per subscription per month are calculated based on
total outgoing and incoming rated minutes from the company’s own
subscriptions. This includes zero rated minutes and outgoing minutes
from own subscriptions while roaming. Outgoing and incoming minutes
related to inbound roaming, national roaming, service providers and
MVNOs are not included.
Average revenue per subscription per month (ARPU)
ARPU is calculated based on mobile revenues from the company's own
subscriptions, divided by the average number of subscriptions for the
relevant period.
”Mobile revenues company's subscriptions” consist of “Subscription and
traffic” and “Interconnection revenues” and do not include revenues
from inbound roaming, national roaming, service providers, MVNOs, sale
of customer equipment and incoming traffic related to service provider
subscriptions.
SMS/MMS and content messages
The number of messages is based on outgoing and incoming messages
from the company’s own subscriptions. Included are rated and free
messages related to SMS, MMS and content domestically and when
roaming. Outgoing and incoming messages related to inbound roaming,
national roaming, service providers and MVNOs are not included.
FIXED – NORWAY
Revenues
Telephony
– consist of subscription and connection fee, traffic (fixed-fixed, to
mobile network, to other countries, value added services, other) for
PSTN/ISDN and Broadband telephony (BBT).
xDSL/Internet
– consist of subscription fee for xDSL and Internet and traffic charges
for Internet traffic (810/815).
Data services
– consist of Nordicom, Frame relay and IP-VPN.
Other revenues
– consist of leased lines, managed services and other retail products.
Wholesale revenues
– consist of sale to service providers of telephony (PSTN/ISDN) and
xDSL, national and international interconnect, transit traffic, leased
lines, other wholesale products and contractor services.
BROADCAST
Revenues
Distribution
– consist of revenues from Pay-TV subscribers and basic tier house-
holds on DTH (direct to home), cable TV subscribers, households in
SMATV networks and DTT (Digital terrestrial TV) Pay-TV subscribers.
Transmission
– consist of revenues from satellite services from satellite position 1-
degree west and revenue from terrestrial radio and TV transmission in
Norway.
Other
– consist of revenues from conditional access systems and revenue not
directly related to Distribution and Transmission services.

Tele
no
r G
rou
pP
AG
E 2
2Fo
urt
h q
ua
rte
r 2
00
5
BUSINESS COMBINATIONS
On 26 October 2005 Telenor increased its ownership/economic expo-
sure in Total Access Communications PCL (DTAC) by 16.6% to 56.9% for
a cash consideration of NOK 1.5 billion. As of 31 December 2005, after
the tender offers for DTAC and UCOM shares expired, Telenor’s owner-
ship/economic exposure in DTAC increased by a further 12.4% to 69.3%
for a total cash consideration of NOK 1.2 billion. As of 31 December
2005 net interest-bearing debt in the companies was NOK 7.3 billion.
DTAC was consolidated from 1 November 2005, while the operations in
UCOM were reported as a discontinued operation in the financial state-
ments.
The result of operations has been included in the consolidated financial
statements from 1 November 2005. DTAC is one of the leading mobile
operators in Thailand and offers high quality GSM mobile services. The
value was set both based on a fair value after negotiations between the
parties and a mandatory offer.
The initial purchase price allocation has been determined only provi-
sionally due to not completed valuation of the fair values of assets
acquired and liabilities assumed. The preliminary net assets acquired in
the transaction, and the goodwill arising, are as follows:
DTAC’s carrying Estimated
amount before fair value Estimated
(NOK in millions) transaction adjustments fair value
Property, Plant & Equipment 740 (14) 726
Software/Other intangibl assets 10 980 (3 968) 7 012
Customer Base - 1 259 1 259
Trademarks - 1 015 1 015
Long-term financial assets 184 (39) 145
Deferred tax assets 212 575 787
Currents Assets excl. Cash 2 138 - 2 138
Bank and cash balances 197 - 197
Deferred tax liability (42) - (42)
Long-term liabilities (5 656) (10) (5 666)
Short term liabilities (3 702) - (3 702)
Net assets 5 051 (1 182) 3 869
Goodwill 2 210
Total 6 079
Total consideration, satisfied by cash 2 664
Book value as an associated company
at the date of consolidation 884
Increased excess value in business
combination recorded against equity 1 258
Minority fair values 1 273
Total 6 079
The goodwill arising on the acquisition of DTAC/UCOM is attributable to
the anticipated profitability of its operations.
DTAC/UCOM contributed NOK 1,191 million in revenues and NOK 29
million to the Telenor Group’s profit after tax and minority interest for
the period between the date of consolidation and 31 December 2005.
This includes the results from the company and amortization of fair
value adjustments, but does not include Telenor’s interest expenses
related to the financing of the acquisition.
In the period 1 January to 1 November DTAC/UCOM contributed to
a net profit after taxes from associate companies of NOK 94 million.
Vodafone, Sweden
On 5 January 2006, Telenor acquired 100% of the issued share capital of
Vodafone AB, Sweden for a cash consideration of NOK 7.5 billion. The
value was set based on fair value after negotiations between the par-
ties. The transaction is not included in the financial statement of 2005.
The transaction will be accounted for by the acquisition method of
accounting.
Vodafone offers high quality mobile services to residential and business
customers in Sweden.
The initial purchase price allocation, which is performed by independent
financial experts, has not been completed as of 15 February 2006 and it
is impracticable to provide figures of the fair values of assets acquired
and liabilities assumed.
Glocalnet, Sweden
In the period 8–14 February 2006, Telenor acquired 47.8% of the issued
share capital of Glocalnet AB, Sweden for a cash consideration of
approximately NOK 419 million. The total ownership as of 14 February
was 84.4%. Telenor has made an offer for all remaining shares in the
company. The offer will be closed 23 March 2006. The transaction is not
included in the financial statement for 2005. The transaction will be
accounted for by the acquisition method of accounting.
Glocalnet provides both fixed and mobile telephony in addition to
Internet access through both broadband and dial-up.
The purchase price allocation will be performed by independent finan-
cial experts, but has not yet started.

Tele
no
r G
rou
pP
AG
E 2
3Fo
urt
h q
ua
rte
r 2
00
5
Profit and loss 2004 First Second Third Fourth Year
(NOK in millions) quarter quarter quarter quarter 2004
Net income (loss) – NGAAP 2 801 1 410 1 399 (252) 5 358
Amortization of goodwill, negative goodwill 213 245 247 234 939
Depreciation and amortization – other 13 (7) 4 53 63
Write-down of goodwill - - - (935) (935)
Pensions 24 24 23 24 95
Asset Retirement Obligations (10) (11) (12) (13) (46)
Share-based compensation (4) (5) (5) (5) (19)
Sale of software 11 2 23 15 51
Associated companies 92 79 39 58 268
Adjusted gains 20 (6) 5 15 34
MVNO *) - - - 578 578
Tax on IFRS adjustments *) (21) (6) (20) (170) (217)
Minority interests (9) (16) (20) (32) (76)
Total adjustments 330 299 284 (178) 735
Net income (loss) – IFRS 3 131 1 709 1 683 (430) 6 093
Equity
(NOK in millions) 01.01.2004 31.03.2004 30.06.2004 30.09.2004 31.12.2004
Shareholders equity – NGAAP 37 237 40 083 40 130 41 248 37 594
Amortization of goodwill, negative goodwill 343 556 801 1 048 1 282
Depreciation and amortization – other - 13 6 10 63
Write-down of goodwill - - - - (935)
Business Combinations - 622 622 786 622
Pensions (1 809) (1 785) (1 761) (1 738) (1 714)
Asset Retirement Obligations (296) (306) (317) (329) (342)
Share-based compensation - - - - -
Sale of software (267) (256) (254) (231) (216)
Associated companies (139) (47) 32 71 129
Adjusted gains and translation differences - (57) (49) (93) (66)
MVNO *) - - - - 578
Tax on IFRS adjustments *) 592 571 565 545 375
Dividends 1 776 1 776 - - 2 602
Minority interests 226 218 202 182 150
Total adjustments *) 426 1 305 (153) 251 2 528
Shareholders equity – IFRS *) 37 663 41 388 39 977 41 499 40 122
Reconciliation of shareholders’ equity for the Telenor Group from 31 December 2004 to 1 January 2005 due to the implementation of IAS 39.
IAS 39 “Financial Instruments: Recognition and Measurement” was implemented as of 1 January 2005. Up to and including 31 December 2004,
Telenor accounted for Financial Instruments according to N GAAP.
(NOK in millions)
Shareholders’ equity 31 December 2004 *) 40 122
Derivative instruments at fair value
– cash flow hedges 13
– derivatives not qualifying as hedges (289)
Shares available-for-sale at estimated fair value **) 753
Tax on the changes (16)
Minority’s share (8)
Total adjustments 453
Shareholders’ equity 1 January 2005 **) 40 575
*) Due to new interpretation of IFRS the figures for the full year and the fourth quarter of 2004 have been restated compared to the reconciliations presented
in Telenor’s first quarter report for 2005. This resulted in eliminations on group level of prepayments in the two MVNO agreements in Norway and Sweden.
**)Estimated fair value of shares available-for-sale is increased by NOK 295 million compared to the equity reconciliation presented in Telenor’s first quarter
report for 2005 due to new information about conditions as of 1 January 2005.
IMPLEMENTATION OF INTERNATIONAL FINANCIALREPORTING STANDARDS (IFRS)
Regulations of the European Union (EU) require that publicly listed
companies within the EU prepare their consolidated financial state-
ments in accordance with “International Financial Reporting Standards”
(IFRS) by 2005. Due to the European Economic Area (EEA) agreement,
Norwegian listed companies will also be required to follow IFRS.
Telenor’s first IFRS financial statements will be for the year ending
31 December 2005 and will include the comparative period for 2004.
Starting in the first quarter of 2005, Telenor provides unaudited finan-
cial information in accordance with IFRS including comparable figures
for 2004.
Telenor has made an evaluation of the differences between Telenor’s
accounting principles according to Norwegian Generally Accepted
Accounting Principles (N GAAP) and IFRS principles based on manage-
ment’s current understanding of these standards. There is inherent
uncertainty around the interpretation and implementation of IFRS.
Accordingly, new pronouncements and interpretations may be issued
during 2005, which could affect the final IFRS figures for 2004 and the
interim figures for 2005. Consequently, changes in the company’s
understanding of IFRS may result in revisions or other differences than
those identified below. The figures are not audited. Audited figures will
be reported in the financial statements for the year ended 31
December 2005.
The tables below show the estimated effects on net income and equity
of implementing IFRS as from 1 January 2004. The accounting princi-
ples according to N GAAP are found in the annual report for 2004. The
main changes in accounting principles when preparing Telenor’s finan-
cial statements according to IFRS and Comments to the various effects
on net income and equity are provided in Telenor’s first quarter report
for 2005.


5

De
sign
: Co
bra
. Prin
t: RK
Gra
fi sk.
Fourth quarter 2005Published by Telenor ASAN-1331 Fornebu, NorwayPhone: +47 67 89 00 00
Investor Relations:Phone: +47 67 89 24 70
e-mail: [email protected]
www.telenor.com
MILJØ
ME
RK
ET
241 450
Trykksak