q4 2014 resultsiclgroupv2.s3.amazonaws.com/corporate/wp-content/uploads/sites/1… · strategic...
TRANSCRIPT

Mr. Stefan Borgas | President & CEO
February 11, 2015
Q4 2014 Results

2
Important Legal Notes
The information delivered or to be delivered to you does not constitute an offer or a recommendation to do any transaction in Israel Chemicals Ltd. (ICL) securities. Certain statements in this presentation and other oral and written statements made by ICL from time to time, are forward-looking statements, including, but not limited to, those that discuss strategies, goals, outlook or other non-historical matters; or project revenues, income, returns or other financial measures. These forward-looking statements are subject to risks and uncertainties that may cause actual results to differ materially from those contained in the statements, including, among others, the following: (a) Crisis in financial markets;(b) War or terror operations;(c) Impacts on sales of fertilizers (product prices, government policies and weather); (d) Subjection to legislative and licensing restrictions;(e) Exposure relating to environmental protection and safety;(f) Third party liability and product liability; (g) Volatility in the markets that affects the demand for some of the products; (h) Concessions and permits; (i) Natural disasters; (j) Water level in Pond 150 in Dead Sea;(k) Dependence on seaports, transportation and loading in Israel. We caution you that the above list of important factors is not comprehensive. We refer you to filings that we have made and shall make with the TASE and the U.S. SEC, including under “Risk Factors” in our prospectus. They may discuss new or different factors that may cause actual results to differ materially from this information. All information included in this document speaks only as of the date on which they are made, and we do not undertake any obligation to update such information afterwards. Some of the market and industry information is based on independent industry publications or other publicly available information, while other information is based on internal studies. Although we believe that these independent sources and our internal data are reliable as of their respective dates, the information contained in them has not been independently verified and we can not assure you as to the accuracy or completeness of this information. Readers and viewers are cautioned to consider these risks and uncertainties and to not place undue reliance on such information.

3
Highlights & Financial Results Financial results y/y impacted by potash price decline and accumulating one-time effects
Strategic milestones achieved:
Delivered efficiency improvement $100M in 2014, partially offsetting the impact of the labor interruption in Israel
Divestitures on track to achieve estimated net proceeds* of $300-500M
Growing ICL’s core: strategic alliance with Yunnan Yuntianhua, acquisition of Prolactal, EU-based functional dairy proteins leader
• Q4 2014 adjusted operating income excludes a one-time write off in the AntiGerm business ($22M), in Clearon ($40M) and in Medentech ($9M), as well as one-time income as a result of the Fosbrasil financial consolidation ($36M) and a one-time reimbursement from the Strike Fund ($9M).
• Q4 2014 adjusted net income exclude the above (net of tax effect) and a non-recurring tax expense related to investments made by a subsidiary in Europe in prior periods, at the amount of $11M. • Net income in Q4 2014 impacted by higher financial expenses and effective tax rate due to exchange rate fluctuation (mainly dollar appreciation vs. the shekel)
$ millions Q4 14 Q4 13 % change FY2014 FY2013 % change
Revenues 1,403 1,416 (0.9)% 6,111 6,272 (2.6)%
Operating Income 174 123 41.5% 758 1,101 (31.2)%
Adjusted Operating Income 200 218 (8.3)% 960 1,196 (19.7)%
Adjusted Operating margin 14.3% 15.4% 15.7% 19.1%
Net income 85 119 (28.6)% 464 819 (43.3)%
Adjusted net income 108 195 (44.6)% 695 1,012 (31.3)%
* Net proceeds: enterprise value net of taxes

Strong potash volume year negatively impacted by labor actions in Israel in Q4
Very satisfying phosphate performance supported by volumes, price increases and strong operating step-up
In Specialty Fertilizers, weak environment in Eastern Europe was strongly offset by significant efficiency gains
Continued solid demand in phosphates and operational improvements can balance short term potash and Specialty Fertilizers uncertainties
4
Business Environment & Major Developments
Stable demand for flame retardants and bromine biocides will continue whereas clear brine fluids business is expected to be negatively impacted by lower oil prices as of 2H2015
Improved operating profit supported by mix effect and efficiencies, offset by the impact of labor interruption in the inefficient compound plant in Israel
Margin expansion through implementation of cost reduction and selective price increases expected to take effect in 2015
Q4 results impacted by lower demand in Europe, increased competition in the US and the depreciation of the Euro
In the last 5 months, Food Specialties launched 30 new multi ingredient solutions demonstrating growth of the core business
Acquisitions of Fosbrasil and Prolactal will contribute to portfolio and geographic expansions
Agriculture
Engineered Materials
Engineered Materials & Processed Food

ICL’s Efficiency and Excellence Initiatives Contribution – 2014
5
Contribution by segment
Contribution by project
Total efficiency and excellence initiatives
contribution in 2014 - $100M
Total annual contribution by 2016 Year End -
$350M
Energy 9%
Procurement 14%
Production, SG&A
efficiencies 62%
Pricing 15%
ICL-PP 15%
ICL-IP 14%
ICL-F 71%
1,196 960
301
35 100
Efficiency initiatives contribution to operating income

Macro-Economic Developments Affecting ICL
6
Excess costs in shekel - $1B in USD terms ILS/$ exchange rate today 10% lower than 2014 average Negative ILS/$ exchange rate impact on net income in
2014 will turn positive in 2015
Excess revenues in Euro – $150M in USD terms €/$ exchange rate today 16% lower than 2014 average
Oil prices plunged more than 50% LTM Oil at $50/barrel to contribute $50-100M to ICL’s OP Lower transportation costs in ICL Fertilizer more than
offset negative impact on ICL Industrial Products clear brine fluids business
Ruble/$ exchange rate today 38% lower than 2014 average Mainly impacting ICL Performance Products Food business in
Russia. Moderate impact on ICL Specialty Fertilizers Significant cost advantage to Russian competitors in the potash
and magnesium markets
ILS/$
WTI Crude
€/$
Ruble/$

7
2014 – A Strong Fertilizer Year
Sources: China Fertilizer Weekly Market Report, Sindicaro Da Industria DE Adubose Corretivos Agricolas No Estado De Sao Paulo, GTIS, Fertilizer Week and Company estimates
2014 Imports to key markets - thousand tonnes
6.6
3.1
7.6
9.6
2.2
3.6
8
4.3
9.1
10.5
2.4
4
2013
2014
1 Full year phosphate fertilizers in P205 terms 2 Full year DAP imports
* Percentage may not match the numbers due to rounding

Strategic Alliance with Yunnan Yuntianhua – Supporting ICL’s
Fertilizers, Specialty Fertilizers, Food Specialties & Advanced Additives
8
50% in a fully vertically integrated phosphate business including a world scale phosphate rock mine and
downstream operations – with effective control
A 15% stake in Yunnan Yuntianhua Co. Ltd., China’s leading producer of phosphate rock and fertilizers
1
2
100.0%
Phosphate Mine Assets • World scale phosphate rock
mine with ~100mT reserves • Capacity of 2.5mT p.a. Integrated Phosphate Operations (by Production Capacity) • Fertilizers – 850kT p.a. • Phosphoric acid – 700kT
p.a. • Specialty fertilizers – 115kT
p.a. • Specialty phosphates – 65kT
p.a. • Purified phosphoric acid –
60kT p.a.
Closing is expected in Q1 2016, subject to approvals of relevant PRC government authorities

Strategic Alliance with Yunnan Yuntianhua
9
Financial Highlights Secure cost competitive resources for Asian markets
Revenues: JV sales to increase from ~$550M to ~$700M
Commodity / Specialty sales volumes ratio to improve from 90%/10% to 50%/50%
Margin expansion: expand EBITDA margins from low teens to high teens within 5 years
JV valuation reflects approximately 7.4x EV/EBITDA multiple (year 2 estimates)
Cash EPS accretive from the first full year of operations
Synergies: at least $30M per year, achieved within 5 years, with a potential to double this amount
Deal value for the JV and the listed company: $452 million
Additional CAPEX: ~$350M spread over 5 years starting from the closing

Key Milestone in ICL’s Food Strategy: Acquisition of Prolactal – A leading European Producer of Dairy Proteins
10
2014 annual revenues of approx. €100
million, 200 employees
Market growth approx. 10%/annum
Cash EPS accretive from the first year of
consolidation with an EV/EBITDA ratio of 9x
Acquisition will contribute substantial sales
and marketing synergies
Closing is expected by Q2 2015
Phosphates
Sourced ingredients
Integrated formulation of
solutions
Customers
Direct sale of ingredients
Sale of solutions
Transforming ICL Food Specialties into a global formulator of texture and stability solutions
Dairy proteins
Dairy proteins fulfills consumer needs
Essential protein source in emerging markets and important
ingredient to health, sports and infant food. Proteins are easy
to digest and are better absorbed by the human body
Deal highlights

11
Expand Footprint in Brazil: Completion of 100% Acquisition Of Fosbrasil for ~$65M
• Latin America’s main producer of purified phosphoric acid
• More than $100M in sales, 90 employees
• Benefits:
Almost 50% increase of ICL’s purified phosphoric acid volumes
ICL to become South America’s market leader in specialty products for Food, Engineered Materials and Specialty Fertilizers
Synergies utilization and improved competitiveness

Divestitures on Track to Achieve Net Proceeds $300-500M
• Proceeds to be used for growth opportunities in the Agriculture, Food and Engineered Materials
12
2014 divestitures to generate more than $300M in net proceeds*:
• Total revenues of divested businesses in 2014 - about $350M with high
single digit operating margin, lower than ICL’s average
• Additional divestiture opportunities :
* Net proceeds: enterprise value net of taxes
BKG PCG
13
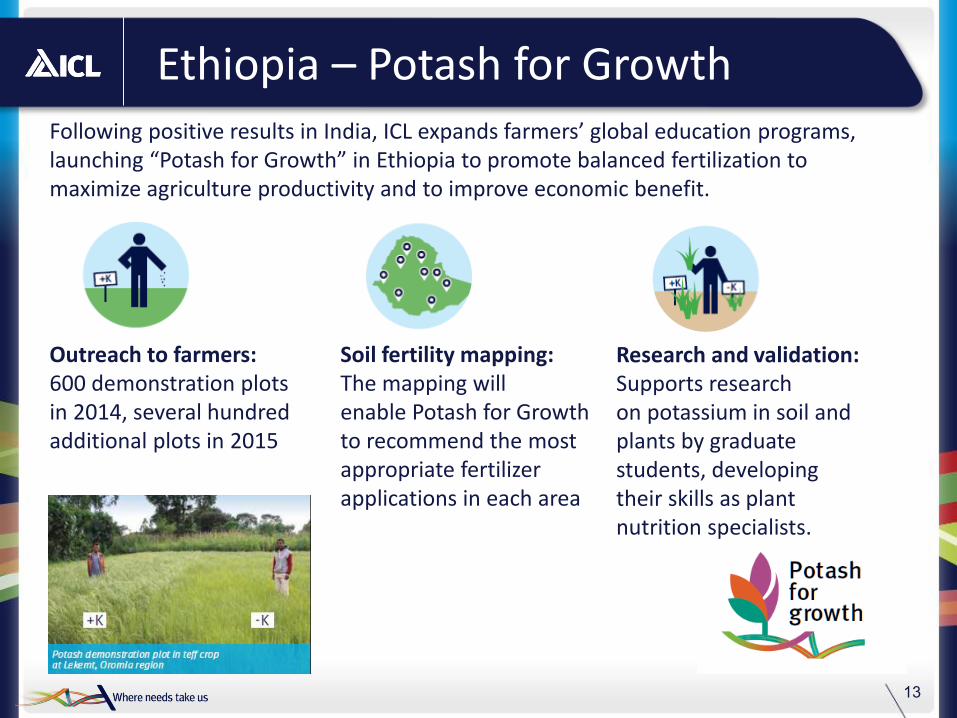
Ethiopia – Potash for Growth Following positive results in India, ICL expands farmers’ global education programs, launching “Potash for Growth” in Ethiopia to promote balanced fertilization to maximize agriculture productivity and to improve economic benefit.
Outreach to farmers: 600 demonstration plots in 2014, several hundred additional plots in 2015
Soil fertility mapping: The mapping will enable Potash for Growth to recommend the most appropriate fertilizer applications in each area
Research and validation: Supports research on potassium in soil and plants by graduate students, developing their skills as plant nutrition specialists.

14
Inauguration of ICL’s European Headquarters in Amsterdam
ICL‘s European Headquarters in Amsterdam
HR Finance Legal
IT Procurement
European leadership of ICL’s business units
Benefits:
$10-20M efficiency contribution annually
Strengthening our business activities as well as our long-standing
relationships with our European customers, suppliers and other
stakeholders
Excellent business and regulatory environment in the Netherlands
Creating attractive positions for more than 300 professionals

15
ICL Branding Website
Launched globally on Jan 27
Available in 7 languages!
Demonstrates our vision and strategy
The thinking behind the brand story The brand’s graphic and textual language
ICL new site names search engine
The website offers:
Branding examples & ICL brand book
ICL “Minute to 8” video clips
And more!
Visit the website: www.iclbranding.com

Financial Results
Mr. Avi Doitchman Executive VP, CFO & Strategy

17
Q4 2014 Results $ millions Q4 14 Q4 13 % change FY2014 FY2013 % change
Revenues 1,403 1,416 (0.9)% 6,111 6,272 (2.6)%
Operating Income 174 123 41.5% 758 1,101 (31.2)%
Adjusted Operating Income 200 218 (8.3)% 960 1,196 (19.7)%
Adjusted Operating margin 14.3% 15.4% 15.7% 19.1%
Financial Expenses, net 66 6 156 27
Net income 85 119 (28.6)% 464 819 (43.3)%
Adjusted net income 108 195 (44.6)% 695 1,012 (31.3)%
174 200
108
71 36
9
43
23 38
12 Adj. Net Income Bridge Analysis

18
Potash Bridge Analysis
Sales ($M) Operating Profit ($M)
Numbers may not add due to rounding
140 128
12 2 4
24 6
465
431
12 35
11

19
Phosphates and Fertilizers
Sales ($M) Operating Profit ($M)*
356
385
7
30 8
* Q4 2013 operating income was impacted by a provision for early retirement in Rotem, in the amount of about $60M, while Q4 2014 operating income is excluding a one-time
reimbursement of $8M from an insurance award in connection with the strike in Rotem.
9
37 9
7
5
15 8
Numbers may not add due to rounding

20
Industrial Products
Sales ($M) Operating Profit ($M)
305 313
17 8 1
25 30
14 1 4
3 2
Numbers may not add due to rounding

21
Performance Products
Sales ($M) Operating Profit ($M)
Numbers may not add due to rounding
376 363
23
4 23
17
35 26
5 13

Thank You

Appendices Financial Overview

24
Lower, Yet Strong Returns
10.9% 8.1%10.4%10.5%
22.4%31.2%
23.2%
31.4%
94.5%
29.5%
38.0%
53.1%
40.4%
28.8%
21.0%
5.5% 4.2% 5.5% 5.3%9.6%
14.4%12.9%19.1%
52.0%
19.4%21.4%
33.5%25.8%
18.2%13.6%
2000 2001 2002 2003 2004 2005 2006 2007 2008 2009 2010 2011 2012 2013* 2014
ROIC
ROE
ROE (Return on equity) = net income / shareholders' equity, average
ROIC (Return on invested capital ) = (operating income ×(1-0.20)) / ((trade receivables + inventory – trade payables) + PP&E, net), average * Operating income is after elimination of non-recurring effects: provision for early retirement at Rotem, provision for removing waste at Bromine and
impairment of assets at ICL-IP. Net income is after elimination of non recurring tax effects (mainly, tax in respect of release of trapped earnings in 2013 annual results, provision for early retirement it Rotem, provision for removing waste at Bromine and impairment of assets at ICL-IP in Q4 ‘13)
2000-2006 figures are based on Israeli GAAP, 2007-2014 are based on IFRS
Data for 2012-2013 reflect the application of 2 new IFRS accounting standards
Data is based on adjusted operating and net income

25
Sequential Improvement in Cash Flow Delivery
$ millions
2006 2007 2008 2009 2010 2011 2012 2013 2014
75 91 206 239 220 142321 192 16791 177
461 400 521
284
376425
119119147
717
242370
499
716
394
29575
150
475
319
427
344
314
116
313
Q4
Q3
Q2
Q1
* 2006 figures are based on Israeli GAAP, 2007-2014 are based on IFRS
360
565
1,200
1,727
1,127
1,269
1,538
1,859
895
Net debt to EBITDA (as of end-2014): 1.98X

26
More than a Decade of High Dividend Yields
• Calculated according to market capitalization based on average share price adjusted for dividends. Dividends attributed to profits of that year.
Year Dividend Yield*
2001 4.0%
2002 4.8%
2003 4.5%
2004 4.5%
2005 3.6%
2006 6.4%
2007 3.5%
2008 5.9%
2009 3.9%
2010 7.0%
2011 5.9%
2012 6.4%
2013 8.0%
Dividend policy: Up to 70% of net income in quarterly payments
2014 Dividend Payments *
Q1: $91.5 million announced on May 15, 2014
Q2: $47 million announced on August 7, 2014
Q3: $125 million announced on November 11, 2014
* Q4 dividend will be published with the full year reports on March 19th

27
Macroeconomic and Industry Parameters Which Affected Q4 2014 Results
(average Q4 2014 compared to average Q4 2013)
Change
8.7% Depreciation of the NIS against the Dollar
-8.3%
Depreciation of the EURO against the Dollar
(average for the period)
LIBOR Dollar interest rate (3 months) 0.2% vs. 0.2% last yr
-40% Decrease in Bulk Dry Freight Index (BDI)

28
Macroeconomic and Industry Parameters Which Affected 2014 Results
(average 2014 compared to average 2013)
Change
-0.9% Appreciation of the NIS against the Dollar
0.0%
Unchanged EURO against the Dollar
(average for the period)
LIBOR Dollar interest rate (3 months) 0.2% vs. 0.3% last yr
-9% Decrease in Bulk Dry Freight Index (BDI)

Thank You