q4 2015 financial results - roper technologies q4 2015... · q4 2015 fy 2016 results are presented...
TRANSCRIPT

Roper Technologies, Inc.
Q4 2015 Financial Results February 1, 2016

Click to edit Master title style
A Diversified Growth Company
2
Safe Harbor Statement
The information provided in this presentation contains forward-looking statements within the meaning of the
federal securities laws. These forward-looking statements include, among others, statements regarding
operating results, the success of our internal operating plans, and the prospects for newly acquired businesses
to be integrated and contribute to future growth, profit and cash flow expectations. Forward-looking statements
may be indicated by words or phrases such as "anticipate," "estimate," "plans," "expects," "projects," "should,"
"will," "believes" or "intends" and similar words and phrases. These statements reflect management's current
beliefs and are not guarantees of future performance. They involve risks and uncertainties that could cause
actual results to differ materially from those contained in any forward-looking statement. Such risks and
uncertainties include our ability to integrate our acquisitions and realize expected synergies. We also face other
general risks, including our ability to realize cost savings from our operating initiatives, general economic
conditions, unfavorable changes in foreign exchange rates, difficulties associated with exports, risks associated
with our international operations, difficulties in making and integrating acquisitions, risks associated with newly
acquired businesses, increased product liability and insurance costs, increased warranty exposure, future
competition, changes in the supply of, or price for, parts and components, environmental compliance costs and
liabilities, risks and cost associated with asbestos related litigation and potential write-offs of our substantial
intangible assets, and risks associated with obtaining governmental approvals and maintaining regulatory
compliance for new and existing products. Important risks may be discussed in current and subsequent filings
with the SEC. You should not place undue reliance on any forward-looking statements. These statements speak
only as of the date they are made, and we undertake no obligation to update publicly any of them in light of new
information or future events.
We refer to certain non-GAAP financial measures in this presentation. Reconciliations of these non-GAAP
financial measures to the most directly comparable GAAP financial measures can be found within this
presentation.

Click to edit Master title style
A Diversified Growth Company
3
Reg. G Disclosure
Today’s Conference Call Will Discuss Income Statement
Results Primarily on an Adjusted (Non-GAAP) Basis. The Q4
2015 Adjusted Results Exclude the Following Items:
(1) Gain on Sale of Abel Pumps, Offset by Impairment
Charge on Minority Investment
(2) Purchase Accounting Adjustment to Acquired Deferred
Revenue
(3) Acquisition-Related Inventory Step-Up Charge
See Appendix for Reconciliation from GAAP to Adjusted Results

Click to edit Master title style
A Diversified Growth Company
4
Roper Conference Call
» Q4 and FY Enterprise Financial Results
» Segment Detail & Outlook
» Q1 and FY 2016 Guidance
» Q&A

5
Q4 Enterprise Results

Q4 2015 Enterprise Highlights
6
Good Execution; Disciplined Capital Deployment
» Revenue: $948M, Flat to Last Year
– Organic (4%), FX Headwind (2%), Acquisitions/Divestitures +6%
– Declines in Industrial and Energy Segments
– Strong Growth in Medical and RF Technology Segments
» Gross Margin +190 Bps to 61.8%
» EBITDA Margin +60 Bps to 35.9%
» EBITDA +2% to $341M
» Free Cash Flow +3% to $261M; 140% Conversion
» Completed $900M Bond Issuance in December
» Deployed over $700M in Acquisitions; Abel Sale Completed
Results are presented on an Adjusted (Non-GAAP) basis. See appendix of this presentation for reconciliations from GAAP to Adjusted results.

Click to edit Master title style
A Diversified Growth Company
7
Q4 Income Statement
Q4’14 Q4’15
Orders $924 $924 Book-to-Bill: 0.98x
Revenue $948 $948 Flat
Gross Profit $568 $586 +3%
Gross Margin 59.9% 61.8% +190 Bps
Operating Income $286 $285
Operating Margin 30.1% 30.1% Higher Amortization (70 bps)
Interest Expense $19 $24 $900M Bond Issuance
Other Income/(Expense) $(0) $0
Earnings Before Tax $266 $261
Tax Rate 29.6% 28.8%
Net Earnings $187 $186 (1%)
DEPS $1.85 $1.82
In $ Millions
Note: Amounts may not total due to rounding
Results are presented on an Adjusted (Non-GAAP) basis. See appendix of this presentation for reconciliations from GAAP to Adjusted results.

8
Full Year Enterprise Results

2015 Enterprise Highlights
9
Nimble Execution and Capital Deployment Drove Record Year Results are presented on an Adjusted (Non-GAAP) basis. See appendix of this presentation for reconciliations from GAAP to Adjusted results.
• Achieved Record Annual Results
‒ Orders, Revenue, Margins, Net Earnings, EBITDA, Cash Flow
• Growth Led by Medical and RF Segments
• Continued Margin Improvement
– Gross Margin + 140 Bps to 60.7%
– Operating Margin + 80 Bps to 29.0%
• Strong Cash Flow Growth
‒ Operating Cash Flow +11%; 26% of Revenue
‒ Free Cash Flow +11%; 132% Conversion
• Deployed $1.8 Billion in Acquisitions
‒ Continued Focus on Software and Medical
‒ High Margin, Asset-Light, Leaders in Niche Markets with High Recurring
Revenue and Strong Management Teams
‒ Recent Acquisitions Growing 10%+
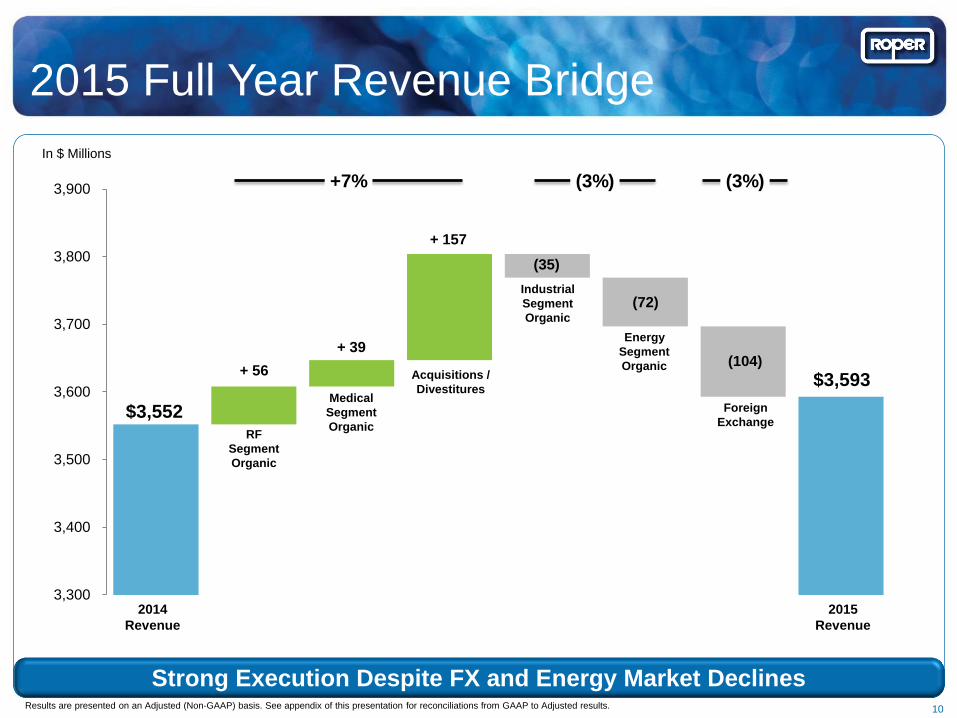
2015 Full Year Revenue Bridge
Strong Execution Despite FX and Energy Market Declines 10
In $ Millions
Results are presented on an Adjusted (Non-GAAP) basis. See appendix of this presentation for reconciliations from GAAP to Adjusted results.
3,300
3,400
3,500
3,600
3,700
3,800
3,900
$3,552
+ 56
+ 39
+ 157
(35)
(104)
(72)
$3,593
Foreign
Exchange
Industrial
Segment
Organic
Energy
Segment
Organic
RF
Segment
Organic
Medical
Segment
Organic
Acquisitions /
Divestitures
2014
Revenue
2015
Revenue
Growth
Before
Impact of
FX
+7% (3%) (3%)
Outstanding Margins
Continued Margin Expansion
Full Year Gross Margin
11
Full Year EBITDA Margin
58.6% 59.3%
60.7%
+210 Bps
2014 2015 2013
+180 Bps
32.8% 33.8%
34.6%
2013 2014 2015
In $ Millions
Results are presented on an Adjusted (Non-GAAP) basis. See appendix of this presentation for reconciliations from GAAP to Adjusted results.
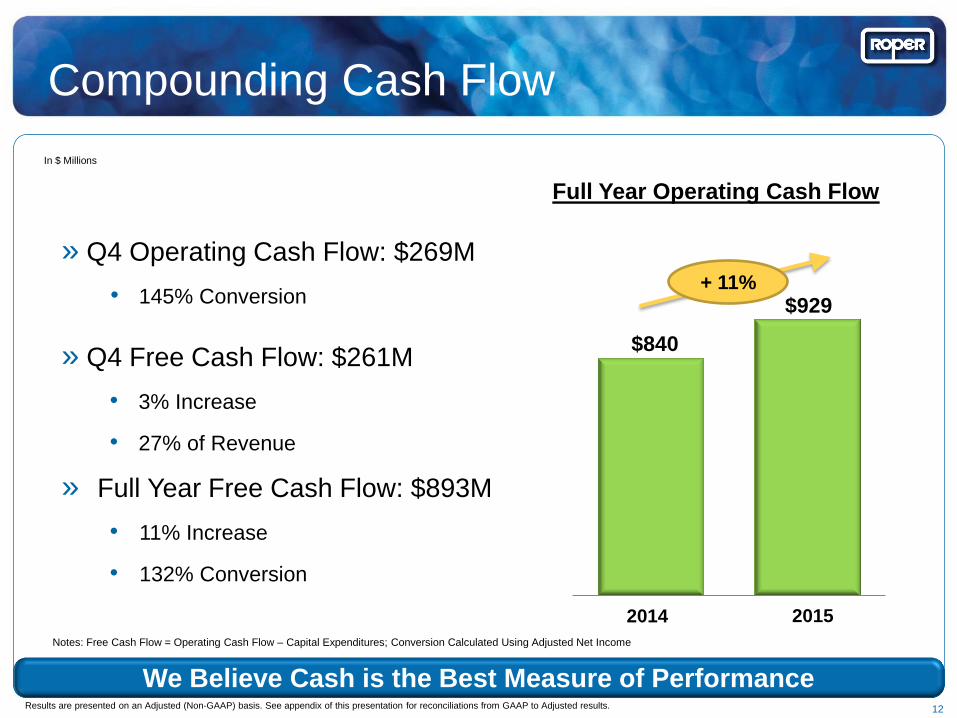
Compounding Cash Flow
We Believe Cash is the Best Measure of Performance
Full Year Operating Cash Flow
In $ Millions
$840
$929
12
2014 2015
» Q4 Operating Cash Flow: $269M
• 145% Conversion
» Q4 Free Cash Flow: $261M
• 3% Increase
• 27% of Revenue
» Full Year Free Cash Flow: $893M
• 11% Increase
• 132% Conversion
Notes: Free Cash Flow = Operating Cash Flow – Capital Expenditures; Conversion Calculated Using Adjusted Net Income
Results are presented on an Adjusted (Non-GAAP) basis. See appendix of this presentation for reconciliations from GAAP to Adjusted results.
+ 11%

Strong Financial Position
13
$900M Bond Issuance; Revolver Upsized; Ample Liquidity
12/31/14 12/31/15
Cash $610 $779
Undrawn Revolver $1,500 $1,670
Gross Debt $2,214 $3,289
Net Debt $1,604 $2,510
Shareholders’ Equity $4,755 $5,299
TTM EBITDA $1,201 $1,245
Net Debt-to-EBITDA (TTM)
1.3x
2.0x
Results are presented on an Adjusted (Non-GAAP) basis. See appendix of this presentation for reconciliations from GAAP to Adjusted results.
In $ Millions

14
Segment Detail & Outlook

Energy Ind Tech RF Medical
$183 $234
$376
$556
$588
$745
$1,037
$1,223
* Excludes
Corporate
Expenses
EBITDA
Margin 31% 31% 36% 45%
2015 Segment Results
Excellent Segment Margins; Medical and RF ~70% of EBITDA
In $ Millions
15 Results are presented on an Adjusted (Non-GAAP) basis. See appendix of this presentation for reconciliations from GAAP to Adjusted results.
Revenue
EBITDA*
Click to edit Master title style
A Diversified Growth Company
16
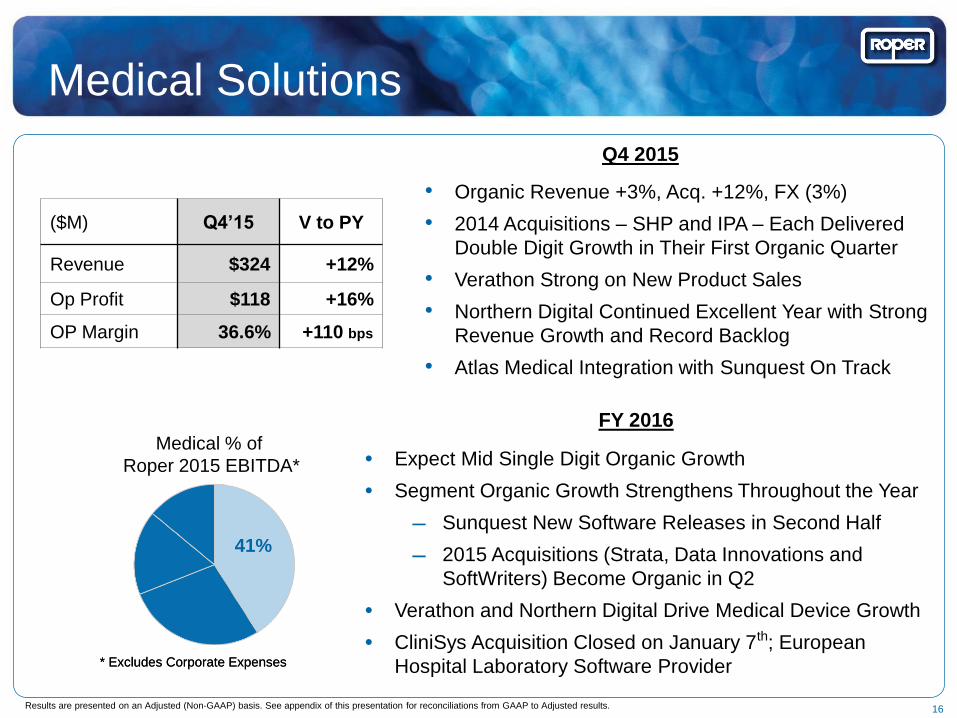
Medical Solutions
($M) Q4’15 V to PY
Revenue $324 +12%
Op Profit $118 +16%
OP Margin 36.6% +110 bps
* Excludes Corporate Expenses
Q4 2015
FY 2016
Results are presented on an Adjusted (Non-GAAP) basis. See appendix of this presentation for reconciliations from GAAP to Adjusted results.
• Organic Revenue +3%, Acq. +12%, FX (3%)
• 2014 Acquisitions – SHP and IPA – Each Delivered
Double Digit Growth in Their First Organic Quarter
• Verathon Strong on New Product Sales
• Northern Digital Continued Excellent Year with Strong
Revenue Growth and Record Backlog
• Atlas Medical Integration with Sunquest On Track
• Expect Mid Single Digit Organic Growth
• Segment Organic Growth Strengthens Throughout the Year
‒ Sunquest New Software Releases in Second Half
‒ 2015 Acquisitions (Strata, Data Innovations and
SoftWriters) Become Organic in Q2
• Verathon and Northern Digital Drive Medical Device Growth
• CliniSys Acquisition Closed on January 7th; European
Hospital Laboratory Software Provider
Medical % of
Roper 2015 EBITDA*
* Excludes Corporate Expenses
41% 41%
Click to edit Master title style
A Diversified Growth Company
17
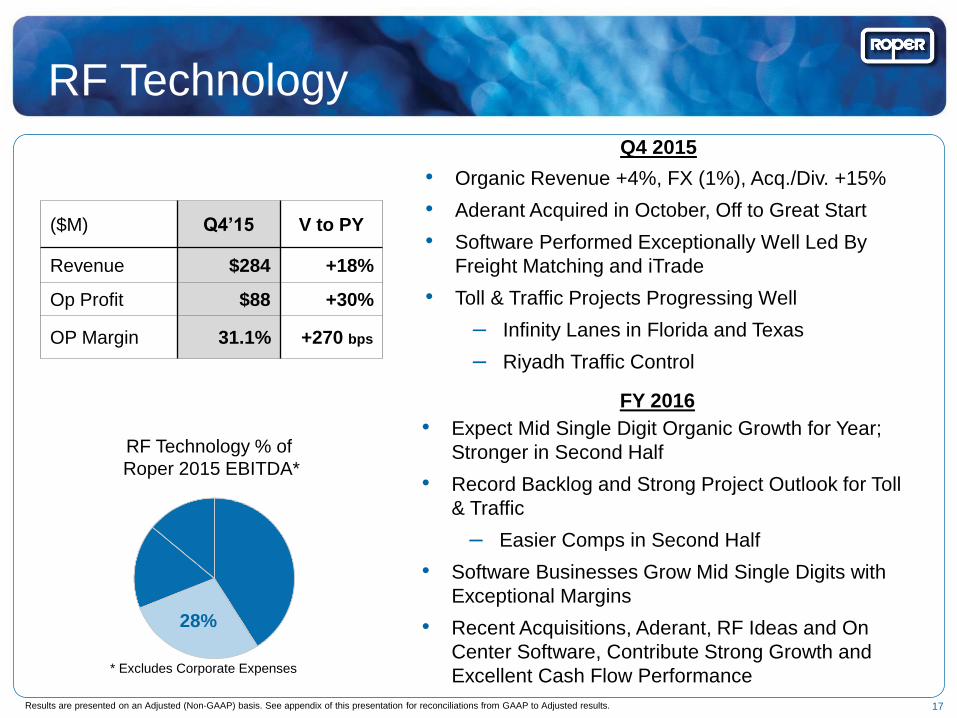
RF Technology
• Organic Revenue +4%, FX (1%), Acq./Div. +15%
• Aderant Acquired in October, Off to Great Start
• Software Performed Exceptionally Well Led By
Freight Matching and iTrade
• Toll & Traffic Projects Progressing Well
‒ Infinity Lanes in Florida and Texas
‒ Riyadh Traffic Control
($M) Q4’15 V to PY
Revenue $284 +18%
Op Profit $88 +30%
OP Margin 31.1% +270 bps
Q4 2015
FY 2016
Results are presented on an Adjusted (Non-GAAP) basis. See appendix of this presentation for reconciliations from GAAP to Adjusted results.
• Expect Mid Single Digit Organic Growth for Year;
Stronger in Second Half
• Record Backlog and Strong Project Outlook for Toll
& Traffic
‒ Easier Comps in Second Half
• Software Businesses Grow Mid Single Digits with
Exceptional Margins
• Recent Acquisitions, Aderant, RF Ideas and On
Center Software, Contribute Strong Growth and
Excellent Cash Flow Performance * Excludes Corporate Expenses
27%
RF Technology % of
Roper 2015 EBITDA*
28%

Click to edit Master title style
A Diversified Growth Company
18
Industrial Technology
• Organic Revenue (8%), FX (3%), Divest. (6%)
• Completed Abel Divestiture
• Neptune Grew Double Digits in the U.S.; Toronto
Project Completion Headwind Remains
• Continued Declines in Upstream Oil & Gas
• Expect Low Single Digit Organic Growth for Segment
‒ Upstream O&G Declines 30% (~$20M)
‒ Neptune U.S. Growth Continues and Toronto
Headwind Eases After Q1
‒ Low Single Digit Growth in Other End Markets
($M) Q4’15 V to PY
Revenue $182 (17)%
Op Profit $52 (24)%
OP Margin 28.7% (270) bps
Industrial Technology % of
Roper 2015 EBITDA*
* Excludes Corporate Expenses
20%
Q4 2015
FY 2016
Results are presented on an Adjusted (Non-GAAP) basis. See appendix of this presentation for reconciliations from GAAP to Adjusted results.
17%
17%

Click to edit Master title style
A Diversified Growth Company
• Organic Revenue (17%), FX (4%)
• Q4 Seasonal Improvement Less Than Expected
• Reduced Backlogs in Oil & Gas Project Businesses
• Strong Growth in Zetec Nuclear Business
• Operating Margin Still Impressive at 32.7%
Energy Systems & Controls
19
($M) Q4’15 V to PY
Revenue $158 (21)%
Op Profit $52 (28)%
OP Margin 32.7% (340) bps
Q4 2015
FY 2016
• Expect High Single Digit Organic Decline for Segment
‒ Oil & Gas Remains Weak, Down (~15%)
‒ Project Activity Continues to Decline; Large
Impact to Compressor Controls
‒ Modest Growth in Other Areas Led By Nuclear
and Industrial Markets
* Excludes Corporate Expenses
14%
Energy % of
Roper 2015 EBITDA*
Results are presented on an Adjusted (Non-GAAP) basis. See appendix of this presentation for reconciliations from GAAP to Adjusted results.

20
2016 Guidance

2016 Revenue Outlook
Total Revenue Up 8 - 10%; Organic Revenue Up 2 - 4% 21
In $ Millions
Results are presented on an Adjusted (Non-GAAP) basis. See appendix of this presentation for reconciliations from GAAP to Adjusted results.
$3,593
+8 - 10%
Foreign
Exchange
Industrial
Segment
Energy
Segment
RF
Segment
Medical
Segment
Completed
Acquisitions /
Divestitures
2015
Revenue
2016
Revenue
Growth
Before
Impact of
FX
+MSD
Organic
+MSD
Organic
+LSD
Organic
(HSD)
Organic
Note: Excludes Future
Acquisitions
Click to edit Master title style
A Diversified Growth Company
22
2016 Guidance Established
» Full Year Operating Cash Flow ~ $1.0B
» Full Year Adjusted DEPS: $6.85 – $7.15
• Key Assumptions:
– Revenue Growth: 8 – 10% ; Organic 2 – 4%, Comps ease after Q1
– Non-Cash Amortization +$30M to $195M
– Interest Expense +$25M to $109M
– Tax Rate 30.0% - 30.5%
– Excludes Future Acquisitions or Divestitures
» Q1 Adjusted DEPS: $1.42 – $1.47

2015 Summary / 2016 Outlook
23
Compounding Cash and Shareholder Value Results are presented on an Adjusted (Non-GAAP) basis. See appendix of this presentation for reconciliations from GAAP to Adjusted results.
Full Year 2015
• Record Annual Results: Orders, Revenue, Margins, Net Earnings, EBITDA, Cash Flow
• Operating Cash Flow +11%; Free Cash Flow +11%
• Significant Financial Achievements:
– Gross Margin + 140 Bps to 60.7%
– EBITDA Margin + 80 Bps to 34.6%
– Free Cash Flow of $893M; 25% of Revenue, 132% Conversion
• Deployed $1.8 Billion in Acquisitions
• Increased Dividend 20%
2016 Outlook
• Record Performance Expected
‒ Revenue Growth: 8 – 10%; Operating Cash Flow ~ $1 Billion
• Expect to Deploy Over $1 Billion in Acquisitions
• CliniSys Acquisition Closed in January; Pipeline Attractive

24
Appendix

Click to edit Master title style
A Diversified Growth Company
25
Reconciliations I
Q4 2015 Revenue Growth
Reconciliation
Industrial
Technology
Energy
Systems &
Controls
Medical &
Scientific
Imaging
RF
Technology Roper
Organic Growth (8)% (17)% 3% 4% (4)%
Acquisitions/Divestitures (6)% - 12% 15% 6%
Foreign Exchange (3)% (4)% (3)% (1)% (2)%
Rounding - - - - -
Total Revenue Growth (17)% (21)% 12% 18% -
Q4 2015 Orders Growth
Reconciliation
Industrial
Technology
Energy
Systems &
Controls
Medical &
Scientific
Imaging
RF
Technology Roper
Organic Growth (4)% (28)% 7% (3)% (6)%
Acquisitions/Divestitures (4)% - 15% 17% 8%
Foreign Exchange (4)% (3)% (3)% (1)% (3)%
Rounding 1% - - - 1%
Total Orders Growth (11)% (31)% 19% 13% -

Click to edit Master title style
A Diversified Growth Company
26
Reconciliations II
(in Thousands) Q4 2015
Margin Reconciliation Industrial
Technology
Energy Systems &
Controls
Medical & Scientific
Imaging RF Technology
GAAP Revenue $182,039 $157,983 $321,735 $281,883
Add: DI / SWI / Strata / Atlas Adj 0 0 1,821 0
Add: On Center / RF IDeas / Aderant Adj 0 0 0 2,170
Adjusted Revenue 182,039 157,983 323,556 284,053
GAAP Gross Profit 89,842 95,714 238,804 154,731
Add: DI / SWI / Strata / Atlas Adj 0 0 1,821 0
Add: On Center / RF IDeas / Aderant Adj 0 0 0 4,767
Adjusted Gross Profit 89,842 95,714 240,625 159,498
GAAP Operating Profit 52,155 51,704 116,492 83,591
Add: DI / SWI / Strata / Atlas Adj 0 0 1,821 0
Add: On Center / RF IDeas / Aderant Adj 0 0 0 4,767
Adjusted Operating Profit 52,155 51,704 118,313 88,358
Add Amortization 2,263 3,948 24,457 15,642
EBITA 54,418 55,652 142,770 104,000
Add Depreciation 2,577 1,480 2,945 2,683
EBITDA 56,995 57,132 145,715 106,683

Click to edit Master title style
A Diversified Growth Company
27
Reconciliations III
(in Thousands) Q4 2014
Margin Reconciliation Industrial
Technology
Energy Systems &
Controls
Medical & Scientific
Imaging RF Technology
GAAP Revenue $219,642 $200,009 $286,410 $240,084
Add: SHP Purchase Accounting
Adjustment to Acquired Deferred Revenue 0 0 1,204 0
Add: FoodLink Purchase Accounting
Adjustment to Acquired Deferred Revenue 0 0 0 180
Adjusted Revenue 219,642 200,009 287,614 240,264
GAAP Operating Profit 69,056 72,177 100,488 67,994
Add: SHP Purchase Accounting
Adjustment to Acquired Deferred Revenue 0 0 1,204 0
Add: FoodLink Purchase Accounting
Adjustment to Acquired Deferred Revenue 0 0 0 180
Add: IPA Acquisition Related Inventory
Step-up Charge 0 0 425 0
Adjusted Operating Profit 69,056 72,177 102,117 68,174
Add Amortization 2,266 4,289 21,150 11,510
EBITA 71,322 76,466 123,267 79,684
Add Depreciation 2,953 1,563 3,071 2,722
EBITDA 74,275 78,029 126,338 82,406

Click to edit Master title style
A Diversified Growth Company
28
Reconciliations IV
(in Thousands) Full Year 2015
Margin Reconciliation Industrial
Technology
Energy Systems &
Controls
Medical & Scientific
Imaging RF Technology
GAAP Revenue $745,381 $587,745 $1,215,318 $1,033,951
Add: SHP / DI / SWI / Strata / Atlas Adj 0 0 7,831 0
Add: FL / On Center / RF IDeas / Aderant Adj 0 0 0 2,786
Adjusted Revenue 745,381 587,745 1,223,149 1,036,737
GAAP Gross Profit 370,894 341,372 899,775 552,605
Add: SHP / DI / SWI / Strata / Atlas Adj 0 0 7,831 0
Add: FL / On Center / RF IDeas / Aderant Adj 0 0 0 7,346
Adjusted Gross Profit 370,894 341,372 907,606 559,951
GAAP Operating Profit 214,538 162,128 441,931 312,112
Add: SHP / DI / SWI / Strata / Atlas Adj 0 0 7,831 0
Add: FL / On Center / RF IDeas / Aderant Adj 0 0 0 7,346
Adjusted Operating Profit 214,538 162,128 449,762 319,458
Add Amortization 9,044 16,158 94,433 46,441
EBITA 223,582 178,286 544,195 365,899
Add Depreciation 10,868 5,096 11,495 10,436
EBITDA 234,450 183,382 555,690 376,335
Click to edit Master title style
A Diversified Growth Company
29
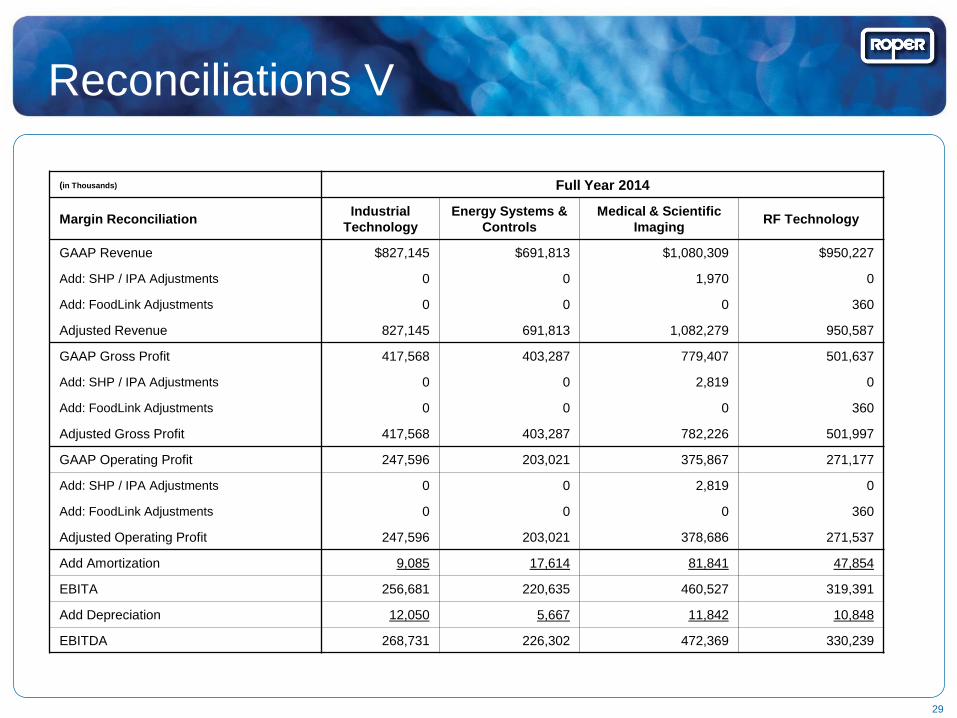
Reconciliations V
(in Thousands) Full Year 2014
Margin Reconciliation Industrial
Technology
Energy Systems &
Controls
Medical & Scientific
Imaging RF Technology
GAAP Revenue $827,145 $691,813 $1,080,309 $950,227
Add: SHP / IPA Adjustments 0 0 1,970 0
Add: FoodLink Adjustments 0 0 0 360
Adjusted Revenue 827,145 691,813 1,082,279 950,587
GAAP Gross Profit 417,568 403,287 779,407 501,637
Add: SHP / IPA Adjustments 0 0 2,819 0
Add: FoodLink Adjustments 0 0 0 360
Adjusted Gross Profit 417,568 403,287 782,226 501,997
GAAP Operating Profit 247,596 203,021 375,867 271,177
Add: SHP / IPA Adjustments 0 0 2,819 0
Add: FoodLink Adjustments 0 0 0 360
Adjusted Operating Profit 247,596 203,021 378,686 271,537
Add Amortization 9,085 17,614 81,841 47,854
EBITA 256,681 220,635 460,527 319,391
Add Depreciation 12,050 5,667 11,842 10,848
EBITDA 268,731 226,302 472,369 330,239
Click to edit Master title style
A Diversified Growth Company
30
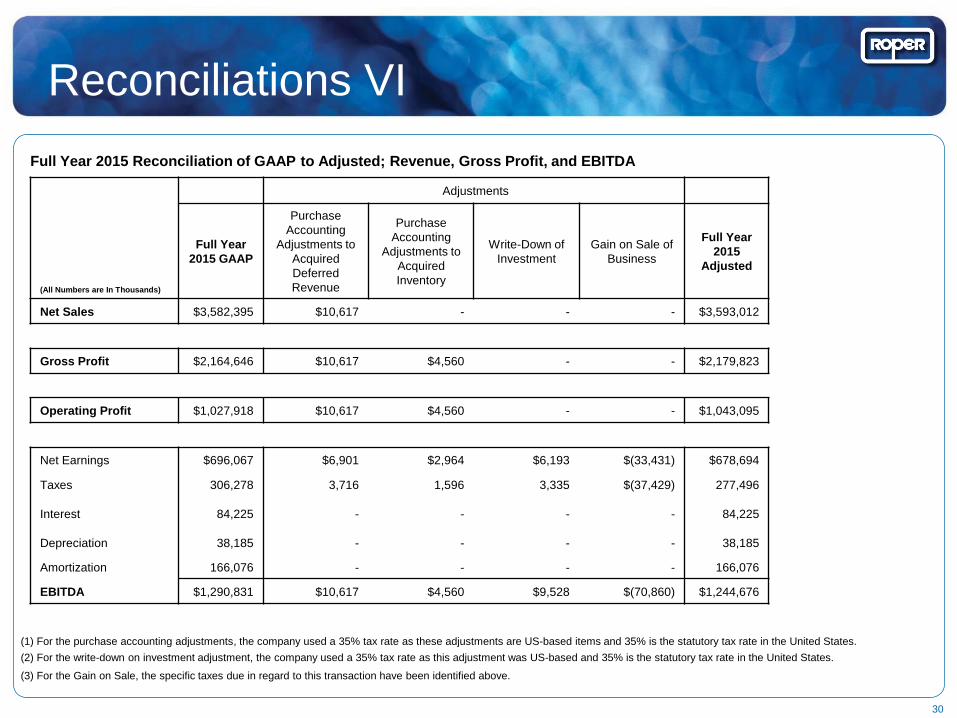
Reconciliations VI
(All Numbers are In Thousands)
Adjustments
Full Year
2015 GAAP
Purchase
Accounting
Adjustments to
Acquired
Deferred
Revenue
Purchase
Accounting
Adjustments to
Acquired
Inventory
Write-Down of
Investment
Gain on Sale of
Business
Full Year
2015
Adjusted
Net Sales $3,582,395 $10,617 - - - $3,593,012
Gross Profit $2,164,646 $10,617 $4,560 - - $2,179,823
Operating Profit $1,027,918 $10,617 $4,560 - - $1,043,095
Net Earnings $696,067 $6,901 $2,964 $6,193 $(33,431) $678,694
Taxes 306,278 3,716 1,596 3,335 $(37,429) 277,496
Interest 84,225 - - - - 84,225
Depreciation 38,185 - - - - 38,185
Amortization 166,076 - - - - 166,076
EBITDA $1,290,831 $10,617 $4,560 $9,528 $(70,860) $1,244,676
Full Year 2015 Reconciliation of GAAP to Adjusted; Revenue, Gross Profit, and EBITDA
(1) For the purchase accounting adjustments, the company used a 35% tax rate as these adjustments are US-based items and 35% is the statutory tax rate in the United States.
(2) For the write-down on investment adjustment, the company used a 35% tax rate as this adjustment was US-based and 35% is the statutory tax rate in the United States.
(3) For the Gain on Sale, the specific taxes due in regard to this transaction have been identified above.
Click to edit Master title style
A Diversified Growth Company
31
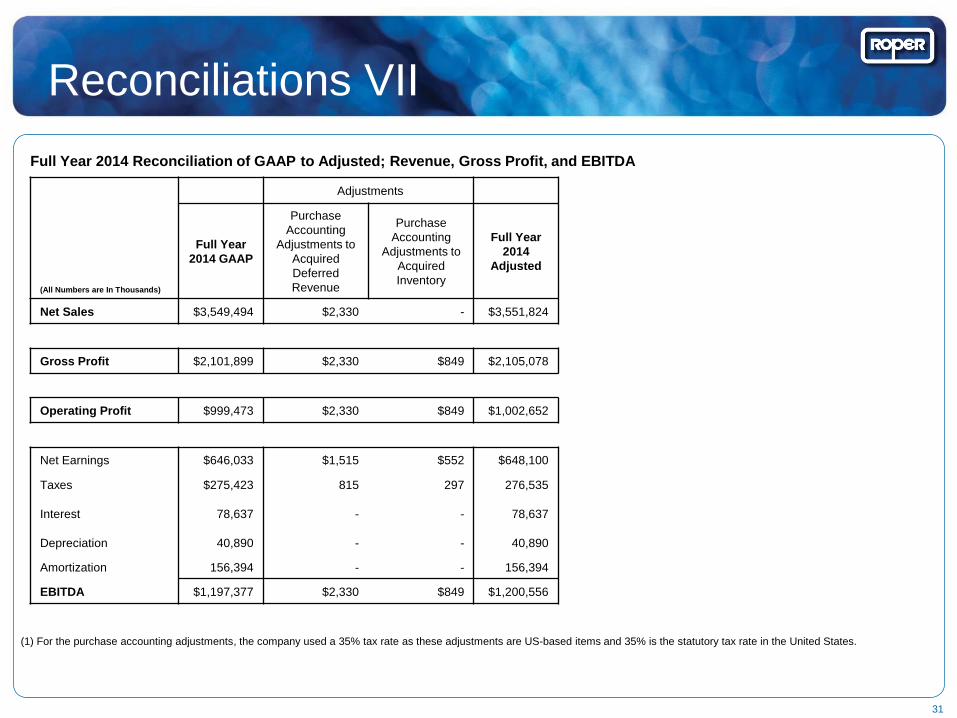
Reconciliations VII
(All Numbers are In Thousands)
Adjustments
Full Year
2014 GAAP
Purchase
Accounting
Adjustments to
Acquired
Deferred
Revenue
Purchase
Accounting
Adjustments to
Acquired
Inventory
Full Year
2014
Adjusted
Net Sales $3,549,494 $2,330 - $3,551,824
Gross Profit $2,101,899 $2,330 $849 $2,105,078
Operating Profit $999,473 $2,330 $849 $1,002,652
Net Earnings $646,033 $1,515 $552 $648,100
Taxes $275,423 815 297 276,535
Interest 78,637 - - 78,637
Depreciation 40,890 - - 40,890
Amortization 156,394 - - 156,394
EBITDA $1,197,377 $2,330 $849 $1,200,556
Full Year 2014 Reconciliation of GAAP to Adjusted; Revenue, Gross Profit, and EBITDA
(1) For the purchase accounting adjustments, the company used a 35% tax rate as these adjustments are US-based items and 35% is the statutory tax rate in the United States.

Click to edit Master title style
A Diversified Growth Company
32
Reconciliations VIII
(All Numbers are In Thousands)
Adjustments
Full Year
2013 GAAP
Purchase
Accounting
Adjustment to
Acquired
Deferred
Revenue
Purchase
Accounting
Adjustments to
Acquired
Receivables
Hansen
Special Charge
Full Year
2013
Adjusted
Net Sales $3,238,128 $6,980 $26,433 - $3,271,541
Gross Profit $1,882,928 $6,980 $26,433 - $1,916,341
Operating Profit $842,361 $6,980 $26,433 $9,100 $884,874
Net Earnings $538,293 $4,537 $17,181 $5,915 $565,926
Taxes $215,837 2,443 9,252 3,185 230,717
Interest 88,039 - - - 88,039
Depreciation 37,756 - - - 37,756
Amortization 151,434 - - - 151,434
EBITDA $1,031,359 $6,980 $26,433 $9,100 $1,073,872
Full Year 2013 Reconciliation of GAAP to Adjusted; Revenue, Gross Profit, and EBITDA
(1) For the purchase accounting adjustments, the company used a 35% tax rate as these adjustments are US-based items and 35% is the statutory tax rate in the United States.
(2) For the special charge, the company used a 35% tax rate as this adjustment was US-based and 35% is the statutory tax rate in the United States.

Click to edit Master title style
A Diversified Growth Company
33
Reconciliations IX
Cash Flow Reconciliation ($ in Thousands)
Q4 2015 FY 2015
Operating Cash Flow (A) $269,258 $928,825
Capital Expenditures (8,757) (36,260)
Free Cash Flow (B) 260,501 892,565
GAAP Net Income 208,597 696,067
Add: Purchase Accounting Adjustment to
Acquired Deferred Revenue 2,594 6,901
Add: Acquisition Related Inventory Step-
Up Charge 1,688 2,964
Add: Impairment Charge on Minority
Investment 6,193 6,193
Subtract: Gain on Sale of Abel Pumps (33,431) (33,431)
Adjusted Net Income (C) 185,642 678,694
Operating Cash Flow Conversion (A / C) 145% 137%
Free Cash Flow Conversion (B / C) 140% 132%
(1) For the purchase accounting adjustments, the company used a 35% tax rate as these adjustments are US-based items and 35% is the statutory tax rate in the United States.
(2) For the write-down on investment adjustment, the company used a 35% tax rate as this adjustment was US-based and 35% is the statutory tax rate in the United States.
(3) For the Gain on Sale, the specific taxes due in regard to this transaction have been taken out.
Roper Technologies, Inc.