q4 2015 m&a fa cover.ppt - thomson...
TRANSCRIPT

MERGERS & ACQUISITIONS REVIEWREUTERS / Rickey Rogers
MERGERS & ACQUISITIONS REVIEWFINANCIAL ADVISORS
Full Year 2015

2
11
Fairness Opinion Rankings
Worldwide Announced Fairness Opinion
11
Table of Contents
1
20
Worldwide Announced (AD1)
20
10
18
Any Japanese Involvement Announced (AD19)
2
2
11
12
11
Any Spanish Involvement Announced (AD34)3
3
6
6
19
Worldwide Completed (AF1)
Top Ten Japanese Involvement Announced Deals
19
Any French Involvement Completed (AF40)
Any Japanese Involvement Completed (AF23)
Any European Involvement Completed (AF3) 10
12
12
Any French Involvement Announced (AD33)
Global M&A
Global Deals Intelligence
Scorecard: Worldwide Announced M&A
Scorecard: Worldwide Completed M&A
Top Fifteen Worldwide Announced Deals
Any German Involvement Announced (AD35)
Americas M&A Any Spanish Involvement Completed (AF41)
Any UK Involvement Announced (AD32)
Any UK Involvement Completed (AF39)
M&A Financial Advisory ReviewFull Year 2015 | Mergers & Acquisitions | Financial Advisors
1
Japan Deals Intelligence
Any European Involvement Announced (AD21) 17
17
18
18
Any New Zealand Involvement Announced (AD39)
Any New Zealand Involvement Completed (AF46)
Japan M&A
Americas Deals Intelligence
15
Worldwide Announced Fairness Opinion
Any Americas Announced Fairness Opinion
Any USAnnounced Fairness Opinion
14
Any Nordic Involvement Completed (AF44)
16
16Any Australian Involvement Announced (AD24)
9
Top Ten European Involvement Announced Deals
Thomson Reuters Soultions for the Deal the Deal Making Community
Any Asia (ex-Japan) Involvement Announced (AD25)
20
Any Asia Pacific Announced Fairness Opinion
8
13
13
Regional Contacts
Criteria Summary
Any EMEA Announced Fairness Opinion
14
20
21
21
22
21
20Any Japanese Announced Fairness Opinion13
Asia Pacific (ex-Japan) M&A
Asia Pacific (ex-Japan) Deals Intelligence
Any Benelux Involvement Completed (AF47)
10
Any US Involvement Completed (AF48)
Top Ten Any Asia (ex-Japan) Involvement Announced Deals 15
7
8
9EMEA M&A
Any US Involvement Announced (AD41)
16
Any Canadian Involvement Completed (AF49)
Any Australian Involvement Completed (AF31)
10
9
Any Canadian Involvement Announced (AD42)
16
Any Asia (ex-Japan) Involvement Completed (AF32)
Any EMEA Involvement Completed (AF53)
15
Mergers & Acquisitions Criteria Summary
Any EMEA Involvement Announced (AD47)
European Deals Intelligence
Any Benelux Involvement Announced (AD40)
8
8
7
Any German Involvement Completed (AF42)
Any Italian Involvement Completed (AF43)
20
20
Top Ten US Announced Deals20
13
12
Any Italian Involvement Announced (AD36)
Any Nordic Involvement Announced (AD37)
Any Americas Involvement Completed (AF55)
Any Americas Involvement Announced (AD49) 7
US Target Completed (AF2)
6
US Target Announced (AD2) 7
https://www.thomsonone.com

Full Year 2015 FINANCIAL ADVISORS
MERGERS & ACQUISITIONS REVIEWWW M&A Breaks All-Time Record l Deals Over $10 billion Double l Healthcare, Energy Push US and Asia Pacific to All-Time Highs l Goldman Sachs Top Advisor
Global Deals Intelligence Worldwide Completed M&A by Region - Imputed Fees WORLDWIDE M&A UP 42%, STRONGEST YEAR FOR DEAL MAKING ON RECORD - Powered by a triple-digitpercentage increase in the number of deals over $10 billion, which account for record-breaking 41% of announcedM&A value, worldwide M&A totaled US$4.7 trillion during 2015, a 42% increase from comparable 2014 levels andthe strongest annual period for worldwide deal making since records began. Seventy-one deals with a value greaterthan $10 billion were announced during 2015, their combined value more than double the level seen during 2014.Overall, just over 42,300 worldwide deals were announced during 2015, a 0.2% increase compared to last year.
FOURTH QUARTER BREAKS ALL-TIME RECORD, THIRD CONSECUTIVE $1 TRILLION+ QUARTER - Fourthquarter 2015 M&A totaled a record-breaking US$1.6 trillion, a 50% increase by value compared to the third quarterof 2015. This quarter marks the third consecutive trillion-dollar plus quarter for worldwide M&A since records beganin 1980.
UNITED STATES & ASIA PACIFIC DEAL MAKING ACCOUNT FOR 74% OF ACTIVITY - M&A activity for UnitedStates targets totaled US$2.3 trillion during 2015, an increase of 64% compared to the level of activity seen during2014 and the strongest period for US M&A since records began in 1980. With US$1.1 trillion in announced dealsduring 2015, Asia Pacific M&A also registered the strongest period for deal making in the region since recordsbegan, topping US$1.0 trillion for the first time.
HEALTHCARE, ENERGY & POWER, AND TECH LEAD ACTIVITY - Driven by pharmaceutical M&A, deal makingin the Healthcare sector totaled US$672.9 billion during 2015, an increase of 71% compared to 2014 levels, while
$2
$3
$4
$5
Impu
ted
Fees
(US
$b)
Americas EMEA Asia Pacific Japan
Worldwide Cross Border Volume Worldwide Announced Buyside Financial Sponsor Activity
t e ea t ca e secto tota ed US$6 9 b o du g 0 5, a c ease o % co pa ed to 0 e e s, eEnergy & Power increased 1% and Technology deal making doubled compared to a year ago.
CROSS BORDER M&A UP 27% – Cross Border M&A activity totaled US$1.6 trillion during 2015, accounting forone-third of overall M&A volume and an 27% increase over 2014 levels. Cross border M&A accounted for 37% oftotal M&A activity during full year 2014.
COMPLETED M&A ADVISORY FEES UP 7% - According to estimates from Thomson Reuters/FreemanConsulting, M&A advisory fees from completed transactions totaled US$29.4 billion during 2015, a 7% increasefrom the comparable period in 2014.
$153.4$201.4
$78.7$15.9 $32.0 $65.7 $63.0
$116.5 $150.0 $165.1
$174.2
$318.2
$82.7
$24.7$60.2
$86.5 $74.9
$79.8
$118.6$135.5
$158.9
$163.3
$56.2
$36.3
$74.6
$70.5 $91.5
$82.0
$135.9
$184.2
$280.7
$113.0
$35.9
$51.6
$96.2
$106.7 $92.9
$107.7
$118.7
$222.9
21.2%19.3%
8.8%
6.5%
10.9%
13.1% 12.7%
16.5%15.7%
14.9%
0%
5%
10%
15%
20%
25%
$0
$100
$200
$300
$400
$500
$600
$700
$800
$900
2006 2007 2008 2009 2010 2011 2012 2013 2014 2015
% o
f Glo
bal M
&A
Ran
k Va
lue
(US
$b)
Q4 Volume (US$b)
Q3 Volume (US$b)
Q2 Volume (US$b)
Q1 Volume (US$b)
% of YTD Global M&A
$0
$1
4Q10 1Q11 2Q11 3Q11 4Q11 1Q12 2Q12 3Q12 4Q12 1Q13 2Q13 3Q13 4Q13 1Q14 2Q14 3Q14 4Q14 1Q15 2Q15 3Q15 4Q15
$280.8$407.9
$258.3$113.4 $175.5 $235.4 $172.4 $132.6
$240.2 $289.2
$273.9
$640.7
$363.4
$111.4$203.7
$247.6$272.1
$167.4
$382.8 $342.4
$256.2
$371.6
$326.0
$146.9
$272.0$204.3 $203.3
$177.7
$315.1$428.0
$404.9
$431.0
$154.2
$165.6
$261.2 $196.9 $250.7
$236.4
$307.0
$500.1
33.7%
44.9%
38.3%
27.0%
37.7%35.2% 35.3%
30.6%
37.3%
32.9%
0%
5%
10%
15%
20%
25%
30%
35%
40%
45%
50%
$0
$200
$400
$600
$800
$1,000
$1,200
$1,400
$1,600
$1,800
$2,000
% o
f Glo
bal M
&A
Ran
k Va
lue
(US
$b)
Q4 Volume (US$b) Q3 Volume (US$b)
Q2 Volume (US$b) Q1 Volume (US$b)
% of YTD Global M&A
Visit http://dmi.thomsonreuters.com to view archives and order custom League Tables https://www.thomsonone.com
2006 2007 2008 2009 2010 2011 2012 2013 2014 20152006 2007 2008 2009 2010 2011 2012 2013 2014 2015
1

Western Europe
13.419.015.0 ▲
▼▲
2,013▲
Worldwide Announced M&A Target Industry by ValueScorecard: Worldwide Announced M&A
1,344
1/1/2014 - 12/31/2014
1,260,784.3 ▲▲
▲▲
% Change in Rank Value
▼▲
▼
8.126.4
-15.3
155.6
-48.9
▲
30.2
▼
▲▼
45,469.977892,827.4
-16.6
40.7-68.4
448
United States 1,154,166.5
15,890.1
▼8,652
▼
-38.3▲▲
87
106,617.8
No. Deals
13,305.018,019.5
12,608.1 11,661.5
1,503,075.9
432
1,176
3,160,761.4
Rank Val US$m
% Change in Rank Value
South America
8,579
719
31.7141
Target Region/Nation
North America37.3 Mexico
1,593,364.9148
57.7 9,755▲
9,996
1,672,097.0▲
176Central America▲
10,729-
Americas
13,455.17,048.718,748.6
3,338,146.8
Rank Val US$m
13113,18742,220
No. Deals
7921.7
-1.118888
24.911,050
-44.8
31,70031,213
Caribbean0.0
▲
64.3
51.142.2
1,374,115.5
▲
126
11,82110,129
▼-17.3-68.1
▼
▲
9781,692
5,018.3530
-27.1 Canada 90,289.0▼47,407.6
Brazil 37,903.1▼
38,028.3
20,838.61,317
Chile23.0 ▲ 68,439.1-1.6
Africa/Middle East13,935.2
▼Sub-Saharan AfricaNorth Africa
49.5
382 20,584.7
338▼ 314849
669,009.4 9.641,163.5
97
7,551.3
48,635.8
114
896
4,658.5 99406
123,049.6
2,730
84.7
95,919.7
▲-35.9
▲
9,783
610,356.9
-16.8
12,441▼
2,226
12,203
77,765.9 1,338438 413 2
9,473
6 111
546,159.62,170
57 8
64,197.3
1,2245 768
2,658
691 792 1
Eastern Europe
146,399.02,440
Asia Pacific64,723.6
108,774.5France▲
627,845.9
▲Germany▼
11.3
▲
▲United Kingdom137.5
▲12.1Europe
▲
▲
453
7.4
-40.8
3,322
145
2,538
2,140
Eastern Europe
1,604
14,374
178,313.475,329.3
81,784.6
11,05211,55149,729.4
842,946.8
North AfricaMiddle East
7.714,786652
22,313.03,618.4
28,274.4 87.5
62 7
65,124.1428
Europe
163
Africa/Middle East
6,108.1613
1,253
-45.4702 449 3 11 201149,657.0
121
2,425,775.4
51,544.9
9,962
Americas18,752.5
11 250
229
11,437
Central America
South America81,369.7
3,235
2,344,405.8
966573
83,818.52,589
2,547
40,471.9
1,475
Middle East
53,015.9Sub-Saharan Africa
Canada
Western Europe55,729.3
907,480.4
80,107.2
France
North America
851,751.1
Germany
Chile 5,993.2
Asia Pacific
United Kingdom
Worldwide 42,3134,747,567.3
1,487
Rank Val US$m
111,605.7United States
Caribbean
19,791.9
Brazil
Target Region/Nation
Mexico
793,217.3423,539.5
119
21,958.2
18,806.4
1,426,675.9
93,312.4
1,538,281.5
1/1/2015 - 12/31/2015 1/1/2014 - 12/31/2014
20321,762.8
14,416.9181257
2,517,835.6
16,528.4
1,666,870.9Worldwide
12,753
No. Deals
No. Deals
Rank Val US$m
2,531,512.4
48,958.6
1 142 542 3
1/1/2015 - 12/31/2015
Mergers & Acquisitions
Jan 1 - Dec 31 Scorecard: Worldwide Completed M&A Jan 1 - Dec 31
Full Year 2015 | Mergers & Acquisitions | Financial Advisors
14.2%
12.7%
12.7%
9.9% 8.8%
8.7%
7.4%
6.8%
5.8%
4.8%
4.7%3.6%
South East Asia
Telecommunications / Telecommunications ServicesHealthcare / Pharmaceuticals
Industrials / Transportation & Infrastructure
Healthcare / PharmaceuticalsConsumer Staples / Food and Beverage
Energy and Power / Oil & Gas
36,491.335,823.6 Materials / Metals & Mining8/10/2015
PendingPending
Broadcom Corp (100%) United States / United StatesUnited States / United States
8,396.9New Zealand
Precision Castparts Corp (97.1%)5/28/2015
Target Macro / Mid Industry
▼▼▼
▼▲
-40.5
▲▼
High Technology / Semiconductors
High Technology / Internet Software & Services
Consumer Staples / Food and Beverage
High Technology / Computers & Peripherals
Healthcare / Healthcare Providers & Services (HMOs)
Media and Entertainment / Cable
Energy and Power / Oil & Gas
Materials / Chemicals
Jan 1 - Dec 31 2015
The Dow Chemical Co
Pending
12/11/2015
11/17/2015Israel / United States
Pfizer IncAcquiror / Target Nation
EMC Corp (100%)United States / United States
▲
▼
-9.59291,104 -12.7
4,063.5
438,413.291,473.8
6,111 57.8
3226,742.0
83,441.5
5,768
10
1,816
4.892.7
-9.945,656.4 1,134
2,849
Singapore7,062.9
311
341,010.6▲
83.6185,726.6
26,458.0
314
53
283,941.2
208.7-9.9
1,426
271 -23.0
317
-25.1
3,134
Australia
1,134
▲
63.9
▲73.782.9 ▲
-0.959,991.0
691,792.1958▲88,131.2
120,785.2
Central Asia59,423.8
39
Rank Value (US$m)Acquiror
79,896.5
1,15392,417.7
805
Asia-Pacific
75,517.9
▲Australasia
▲
South East Asia
37.11,49962.7
14,948.3
702,449.3 11,201
1,258
-31.6
-23.4
78,087.4
69,408.2
4,913.799,601.9Japan
67
▲
Top Fifteen Worldwide Announced Deals
6,564.6Japan
4466,964
49
45,896.0625
▲
North AsiaChina 684,289.2
940,606.2
153,831.6
2,141
30,664.6
514,245.3
1,514.7
6,752
42.9
4601,858
34,567.5
62.9190
45,656.4
▼
38,287.91,720
322
211
514 Malaysia
▲
▼
South Asia 41,134.7
-17.4
▼
North Asia
118,196.7ChinaHong Kong
20,368.9
547,134.9
41,134.7
▼
Australasia
4,650595
394,061.8
1,131
5,153.1 Papua New Guin▼
DuPont (100%)Pending
27,907.5South AsiaCentral Asia -82.0
Pending
4/8/2015
10/12/2015
▼
Kraft Foods Group Inc (100%)
Avago Technologies Ltd
191,522.1Anheuser-Busch Inbev
1,440
United States / United States
The Williams Cos Inc (100%)
Netherlands / United Kingdom
United States / United States
▼1,153
Paypal Holdings Inc (100%)
60,755.7
6/20/2015
SABMiller PLC (100%)81,009.778,376.6
United States / United States
Charter Communications IncTime Warner Cable Inc (98.5%)
46,788.8
Energy Transfer Equity LP
68,422.1
HJ Heinz Co
Belgium / United KingdomAllergan PLC (100%)
United States / United StatesCigna Corp (100%)
Hutchison Whampoa Ltd (50.04%)
55,914.1United States / United States
BG Group PLC (100%)
54,716.5
65,801.8Dell Inc
Anthem Inc
Teva Pharmaceutical IndustriesHong Kong / Hong Kong
40,500.0
Berkshire Hathaway Inc
Canadian Pacific Railway LtdPending
Cheung Kong(Holdings)Ltd
Norfolk Southern Corp (100%)Pending7/27/2015
49,383.2
Allergan PLC-Generic Drug Bus (100%)45,410.81/9/2015
United States / United StatesShareholders7/6/2015Pending United States / United States
6/22/20157/2/2015
Pending
3/25/2015
Pending
10/7/2015
5/26/2015Pending
-9.01,092235.2
Malaysia
5,137
11,250120,842.6
28,541.51,798
375
1,138
11/23/2015
Asia-Pacific
10,228.1
Pending
Australia
Hong Kong
2,271
111,574.6
53,186.0
Rank Date Date Effective
Singapore
1,357
Royal Dutch Shell PLC
Target (% Sought/Acquired)
1,142,542.3
7/20/2015
8,428.7
Canada / United States 36,607.7
6/3/2015
Healthcare Energy and Power
High Technology Industrials
Financials Real Estate
Materials Consumer Staples
Media and Entertainment Telecommunications
Consumer Products and Services Retail
Government and Agencies
https://www.thomsonone.com Visit http://dmi.thomsonreuters.com to view archives and order custom League Tables2

Centerview Partners LLC
Market
2,802.6
Change in
1.2Share Ch.Sh (%)
9.5
192257
10.1
3.0
4.4
0.66.6 1.0
1.7
# of
Worldwide Completed (AF1)
Market
▼ 6.2 ▲
# of DealsMarket Advisor
▼ ▲2.1
0.30.10.40.1
+43-29
8
11-12
-19
▼
-59▼▼
7Lazard
352,936.499-20 Barclays
▼12
226,130.510
▲
▼
146
17
UBS
+8 Centerview Partners LLC
▲Rothschild
+8
110
5
349 0.8▼0.3
-23
80.6
17829
125 0.3-9
-28 0.1
2.0
13
JP Morgan
2.6
Jan 1 - Dec 31
Worldwide Rankings
2014 RankFinancial Advisor Deals
Imputed Fees (US$m)
1 ▲Sh ($)
1,556,020.1 12.9 1.0
2015 Rank
Rank Value per Advisor (US$m)
Goldman Sachs & Co# of Deals-21
Jan 1 - Dec 31
1.0Financial Advisor
342-4.8
1
Change in
14.2
29.4
7 7
5
1.7
2 1,046,536.6
Rank Value # of
19.8
407▲
▲
▲340 0.8
1
-6
267,049.5
Market
Barclays 8
3
Citi45
Bank of America Merrill Lynch
RBC Capital Markets
UBS
Moelis & Co
654,429.28489,758.6477,386.5
Guggenheim Securities LLC
16
10.3
15.1
18
7.0
673,716.9
365,755.6
9
231,163.91611
Robey Warshaw LLP
21
▼
12BNP Paribas SA
▲
0 0
1.4
-5
49
-0.5 0.7
0.5
0.0
8.1
287
417
0.8
225
6.5
▲
233
▲256
345
▼▼
0.6 Bank of America Merrill LynchMorgan Stanley
64
US$m DealsShare Ch.37.2
Sh (%)
# of Deals per Advisor
▼
MarketMarket Rank Value Market2015 Rank
Rank Value per Advisor (US$m)
Share Ch.
2 334.3
731,647.3▲ ▲
8.223.2
Fees365
US$m
+130.90.0
▲1,085,472.6Sh (%)Sh (%)
# of Deals per Advisor
Full Year 2015 | Mergers & Acquisitions | Financial Advisors
-11
Market2014 Rank
1,306.21,926.9
225 -11
▲
▼1.1
-26285 1,810.5
0.75.7
11.5
2 627,527.8 ▼
0.8▼
19.9
16.8625,932.0
-0.70.7 ▲-1.8
1,006.50.2
15.11067 364,270.8Deutsche Bank
893.20.70.6
▲203226
2.50.6 -22
▼▼
3.0
-27 0.2477,640.03.4▲ -5532,415.3 234
▼0.0▼
10.2 175▼ Credit Suisse ▼▲ 199
321,096.1▼ 0.6
▼-1.911.2
▼
▼1.7
-13
▼▼ 0.8▲
734.2882.5 0.1802.6
0.3-8.9
▼-52 2.7
509.0145 -20
▲516.8+3+46 762.9
8.51.6
-4.8▲
0.5292
▼ ▼
211,074.711 7.2
0.7▲
2.61.83.16.7
▲
0.938
▲▲
670.1
0.4 ▼
0.40.6
-130.4
▲
275.91.3
+17-23 ▼
0.3 ▲
0.9 ▼118▲
4.9
15▼
0.20.6
114
6.4203,501.2378.5209.20.2 ▲
4.2110,859.0 3.5
16
18Evercore Partners
35131,410.6 0.214
13
▲ 15
HSBC Holdings PLC
BNP Paribas SARBC Capital Markets
▲3.017
107,785.8-1.2
China International Capital Co
▼16 3.4
79▼ 3.3 381218- Anglo Chinese Corp Finance 2.786,031.5 ▲
-36▲
▲▲
▼ 1.6
15.3
119▲ 0.1
478.2+22 0.2
▼0.30.3
0.4
-1.8
80.0 ▲0.1 0.1
527.0+150.0
▲0.5148
104,915.9
2.6171
Jefferies LLC
21
19 82,540.6Perella Weinberg Partners LP
▲▲
25▼20
+5▼-2.8
2 328 -0.5159.078,504.4 0.42.5 ▲
▲ Somerley ▲0 0+2+8
73 056 6 24 3 0 1 0 028 ▲+10 1
0.0-140.119 0.0
▼3.7
0.3
▲
2 3▲▲
800
0.2 +100.0
11
▲127
1.2
4.3
2.4
▲
1.613
-0.23
▲
1,765,136.2
17 330,553.813
1,395,858.2
722,234.6 15.29
3
Citi810,986.90.5
17.122.0
JP MorganGoldman Sachs & Co
▲
7.0
▲▲
▲32.8
9.4
7.7 ▲
Worldwide Announced (AD1)
▲5.9
▲
0.013.8
4Morgan Stanley1
+43
4.5
2
717,641.6LazardCredit Suisse 6
-50.6
+7
202
12
15
1510
10
48
50LionTree Advisors LLC
21
Deutsche Bank6
4511
19
17
RothschildEvercore Partners
7.24.0
3414
343,072.2
0.3 ▲317,619.5 6.7
2 3106 698 7
4.44.9
4.1194,898.4144,245.6
202,451.4209,144.5
3.0HSBC Holdings PLCAllen & Co Inc 20
* tie
▼
2.253
31,213
0.1
38 54.0
▼
21
51.9
-11.5%0.2%
30 32.12
52.7
1
Morgan StanleyGoldman Sachs & Co
38
6,283
3
44
39 40
43
24.4
5,751
56 27.525.3
4,756 35.525.8
55
Industry % Change from Last Quarter -2.5%
129,435.6
2,884
21
High Technology
Morgan Stanley
Industry % Change from Last Quarter
95100.0
23 1328
Bank of America Merrill Lynch
363,495.4
249,736.7
193,056.3
24
349,211.0
Rank Val US$mHealthcare
354,706.3JP Morgan
JP Morgan
36.1
1
170,852.6
2118,714.6
Financials
129,674.3
Industry % Change from Same Period Last Year
601,588.7Energy and Power
Industrials
▲
56 101,732.4 3
69 148,082.8107,909.6
JP Morgan2
41
27.6
417,748.8
1
0.0
Jan 1 - Dec 31
Goldman Sachs & CoMorgan Stanley
3
21 25 2.3▲ Somerley ▲0.0+269,474.673,056.6 -24.3 0.1
200.60.0
▼-0.22.2 0.7+3 ▲
28
0.0+2
▲+1▲
0.1
51.770.5141 0.1
100.0
0.20.7
0.2▼▼
0.40.2
▲▼
29,387.0▼
-4870.2
▲
-6 0.5-17
152.0
▼
▼ 215.4
7.2%▼
1.9 0.4 ▲-0.61.8 ▲
1.9 ▼ 0.2
-15.5%▼
0.0 -5 BMO Capital Markets 59,346.234
▲
51
-1.5%-13.2%
Nomura
▼▲
Industry % Change from Same Period Last Year
Zaoui & Co
Industry Total
Wells Fargo & Co70
22232425
672,921.8
▲
▲42,313
Share
Top Worldwide Announced M&A Advisors by Transaction Size (AD1)
No. Deals
+934,747,567.3
49.7% ▲
Rank
▲
▲
100.03,160,761.4
+15▲0.4
24.9%
61,269.368,919.9
21
23
0.1
2.3
-2.1▲▲
29
2,856
53
Top WW Announced M&A Advisors by Target Industry
42.2%
12
Mkt.
1.6
▼0.1
1156
+120.4
2.0+17
152
2022922
LionTree Advisors LLC 2.3106,698.7
1.8
92,479.2101,423.2Greenhill & Co, LLC 2.1
87,803.8Anglo Chinese Corp Finance 83,020.8
1.9Jefferies LLCChina International Capital Co
217,360.3
213,071.7
Morgan Stanley
Industry Total†25
Goldman Sachs & Co
469,942.4
JP Morgan
35.5JP Morgan41.6
Goldman Sachs & Co
3600,776.4
1
38 28.432
Goldman Sachs & Co
Jan 1 - Dec 31 2015
216,372.2 36.0
53
1,011.11 808.20 767.23
535.73 538.58 368.37 270.99 354.22 375.44
165.14 306.29
213.9
207.7 235.3
230.6 194.0
243.4 176.4
198.7 158.2
54.7
171.1
68.4
68.4
-
-
78.4
78.4
78.4 78.4 78.4
78.4
81.0
81.0
81.0
81.0
-
120.8
120.8
120.8
120.8
32.1 120.8 120.8 120.8
191.5
191.5
191.5
191.5
$0
$200
$400
$600
$800
$1,000
$1,200
$1,400
$1,600
$1,800
$2,000
Goldman Sachs & Co
Morgan Stanley
JP Morgan Bank of America
Merrill Lynch
Citi Credit Suisse Lazard Barclays Deutsche Bank
Centerview Partners LLC
UBS
Ran
k Va
lue
(US
$bil)
Allergan PLC/Pfizer Inc
SABMILLER PLC/Anheuser-Busch Inc
BG Group PLC/Royal Dutch Shell
Time Warner Cable/Charter Communications
DuPont/The Dow Chemical Co
Other Top 15 Deals
All Other Transactions
https://www.thomsonone.com Visit http://dmi.thomsonreuters.com to view archives and order custom League Tables3
11.0x
Consumer Staples
Consumer Products and Services
15.7x
Healthcare
14.9x
High Technology
12.0x
15.3x
12.6x
14.0x
11.4x
15.4x
Energy and Power
17.2x
Materials
11.8x
13.8x
14.1x
12.3x 10.7x
-15.7x
28.4x19.7x
12.5x
20.9x
9.7x
-
12.7x
19.7x10.5x9.8x 12.7x 11.8x
12.4x
14.0x
15.1x
11.1x
15.6x
14.6x 11.6x
12.7x
15.6x 16.7x
-13.0x
14.5x
15.5x
14.5x
19.3x 14.1x
11.4x8.4x
9.6x
9.8x
11.0x
12.2x 11.2x
-14.7x11.8x
18.1x 15.0x18.8x
17.2x 16.6x
18.1x
11.1x
24.4x
24.0x22.5x
11.3x15.0x
11.6x
16.7x
15.1x
9.6x14.7x
8.1x 16.2x
11.9x 12.2x
15.6x
13.8x
21.8x12.2x
6.9x22.1x
17.8x14.1x
12.0x
16.5x 18.7x14.8x
15.8x 13.3x
11.5x
11.3x
15.1x13.4x
16.2x12.9x 15.1x
11.7x
12.0x
15.4x9.0x
13.3x
12.7x12.3x
11.7x 11.7x
12.2x
15.8x
12.4x
15.6x 15.4x
14.6x14.6x17.9x
9.0x
16.1x16.1x 9.3x
13.9x
21.7x18.2x 16.0x
14.0x14.0x
16.0x18.2x 11.4x
12.4x9.8x
19.1x
9.0x
21.5x 22.3x11.4x
11.6x
12.4x
11.6x
16.7x
16.8x
8.2x
12.4x8.5x
12.7x22.4x
12.5x 12.3x
UK
15.8x
13.6x
19.1x
9.7x 16.9x
15.3x 11.5x
15.6x
13.8x
20.3x
11.7x
11.6x
18.9x
World
Industrials 13.0x13.5x
11.7x
18.5x 18.1x
3.5x
6.3x
16.3x
6.1x
17.1x
9.7x
3.5x
-
24.7x 23.2x
14.0x -
6.4x
14.4x
Telecommunications
Real Estate
Media and Entertainment
Retail
12.8x
11.6x
13.9x
14.8x
Exit Multiple Matrix - Average Rank Value / EBITDA
Canada
Full Year 2015 | Mergers & Acquisitions | Financial Advisors
12.8x
11.7x
USA
9.8x
13.2x 12.0x
17.1x
17.1x
13.0x
18.1x 24.0x
Japan
13.2x
Asia ex. JapanEurope
13.1x
8.2x
9.3x
16.7x
EMEAAmericas
Worldwide M&A Matrix
2015 UP 2015 DOWN 2015
Jan 1 - Dec 31
14.5x14.9x
22.4
27
15.8x
53.3
UK
16.9
Real Estate 13.2
34.0 34.8
- -
14.1x
28.721.9
13.1x
EMEA2014
36.6
15.7x18.0x 15.7x13.1x13.3x
18.3
17.9
14.9
22.8
25.5
50.1 24.1
17.1
31.2
31.1
24.5
22.1
36.7
48.8
31.6
16.6
-
23.3
11.427.8
-
21.3
23.0
29.0
24.5
29.0
22.6
21.6
39.1
44.735.0
20.9
25.533.4
17.5
40.7
34.6
23.0
31.8
47.3
30.7
22.3
45.0
17.5-
24.5
Europe
13.1x
17.5
34.5
31.7
28.4
26.0
44.926.1
47.4
34.1
-
25.114.4
35.0
24.5
21.0 19.6
32.223.726.427.1
26.5
17.523.9
32.0 26.520.1
25.9
24.0
29.2
84.8
19.3
37.8
33.2
Japan
15.3
Asia ex. Japan
13.3x13.1x
17.3
25.7
17.3
28.9
23.2
19.2
14.721.9
23.2
11.8x
23.2
43.520.8
39.317.9
56.1
17.9
35.4
35.1
24.0
42.1
USA
11.5x15.4x 10.1x
16.923.3
47.0
39.4
34.6
26.4
44.3
32.530.5
Americas Canada
22.5
Healthcare
Consumer Products and Services
38.0
28.0
43.829.5
22.7Energy and Power
27.6
Average Industry Total
31.4
20.8
High Technology
Industrials
24.8
29.8
25.7 34.7
Media and Entertainment
29.3
Telecommunications 25.0
Materials
25.2
45.7
27.2
Retail
28.2
50.1
22.5
22.5
17.6
27.6
27.1
36.2
20.726.8
30.8 30.636.4
27.6
41.4
33.0
28.936.8
28.6
14.2x
17.4
28.0
2015 UP 2015 DOWN
27.724.0
28.0
Financials
33.3
22.324.741.9
24.5
29.0
Average Industry Total
29.4
26.218.7
30.6
25.924.5
11.8
34.124.5 22.8
23.3
25.9 20.1
65.218.2
38.1
25.1
42.3 32.0
22.1
28.5
20.319.9
28.6
24.548.2
26.227.6
25.4 21.3
34.0
26.0
37.8
38.8
27.0
26.238.4
24.2
35.7
28.4
18.2
23.0
23.6
16.022.0
25.3
18.6
24.324.5
18.3
25.5
4.7
21.736.1 24.7
26.115.2
21.8
- -
28.328.7
35.3
World
34.242.0Consumer Staples
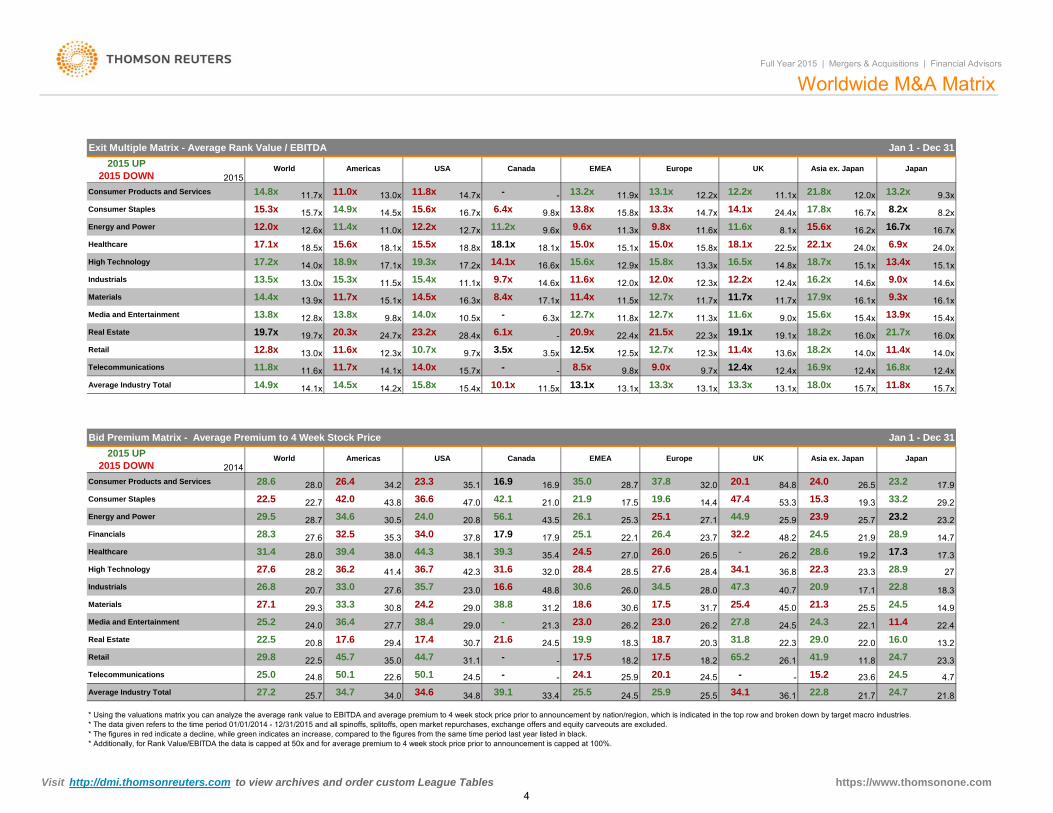
* Using the valuations matrix you can analyze the average rank value to EBITDA and average premium to 4 week stock price prior to announcement by nation/region, which is indicated in the top row and broken down by target macro industries. * The data given refers to the time period 01/01/2014 - 12/31/2015 and all spinoffs, splitoffs, open market repurchases, exchange offers and equity carveouts are excluded. * The figures in red indicate a decline, while green indicates an increase, compared to the figures from the same time period last year listed in black. * Additionally, for Rank Value/EBITDA the data is capped at 50x and for average premium to 4 week stock price prior to announcement is capped at 100%.
Bid Premium Matrix - Average Premium to 4 Week Stock Price Jan 1 - Dec 31
https://www.thomsonone.com Visit http://dmi.thomsonreuters.com to view archives and order custom League Tables4
Full Year 2015 | Mergers & Acquisitions | Financial Advisors
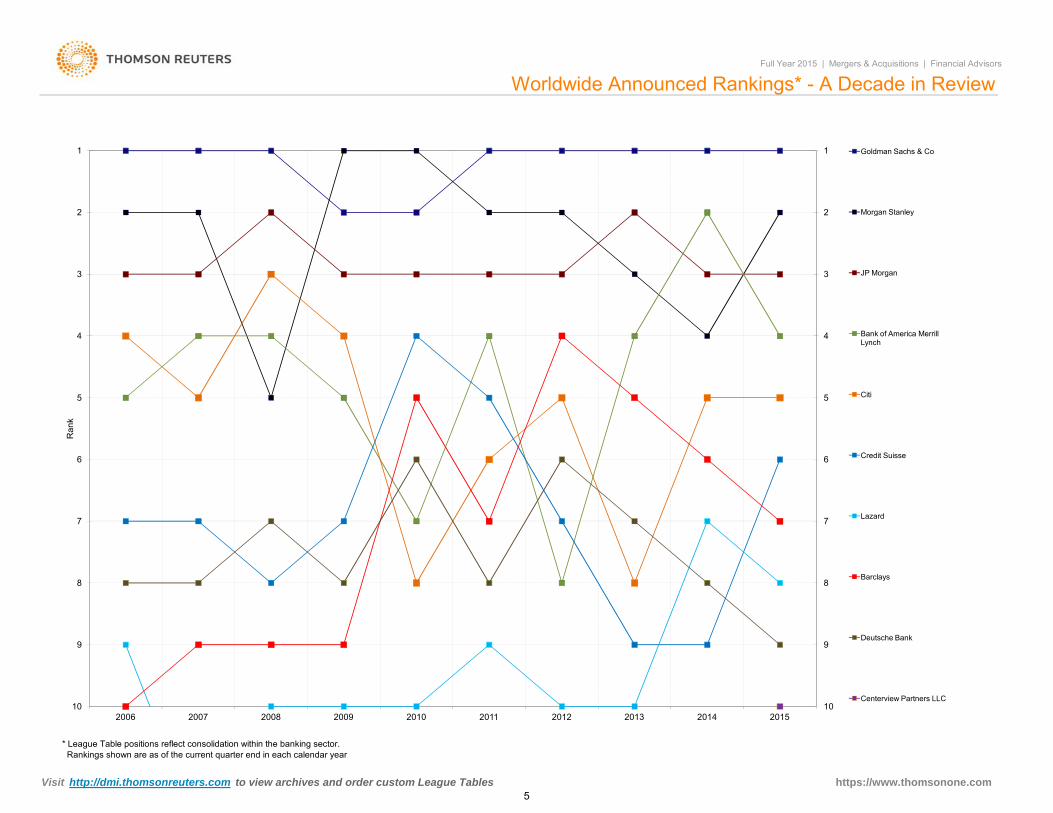
Worldwide Announced Rankings* - A Decade in Review
1
2
3
4
1
2
3
4
Goldman Sachs & Co
Morgan Stanley
JP Morgan
Bank of America Merrill Lynch
* League Table positions reflect consolidation within the banking sector. Rankings shown are as of the current quarter end in each calendar year
5
6
7
8
9
102006 2007 2008 2009 2010 2011 2012 2013 2014 2015
5
6
7
8
9
10
Ran
k
Citi
Credit Suisse
Lazard
Barclays
Deutsche Bank
Centerview Partners LLC
https://www.thomsonone.com Visit http://dmi.thomsonreuters.com to view archives and order custom League Tables5
Media and EntertainmentGoldman Sachs & Co 107,953.7 1
Guggenheim Securities LLC 100,547.9 3
177,809.9
US Announced Advisors by Target Industry Jan 1 - Dec 31 2015Americas Deals Intelligence
Healthcare
High Technology
Energy and Power
Materials
JP Morgan
Morgan StanleyLazard
Rank Val (US$m)558,347.9 361,881.7337,204.5Morgan Stanley
Goldman Sachs & Co
BarclaysMorgan Stanley
Goldman Sachs & CoJP MorganBank of America Merrill Lynch
Citi
320,290.0387,176.9 226,563.3177,740.2159,763.3
267,807.9 135,743.2111,779.8105,127.0
12
1
Rank
123
Mkt.
1,021
No. Deals
60.422 15
24
654 41.33
224
15 23
60.514
18
52.9
523 14
Share
64.8
39.3341.7
57.4
183,458.5 111,013.097,085.882,063.6
23
1Goldman Sachs & Co
28
1,73758.5
Americas M&AFull Year 2015 | Mergers & Acquisitions | Financial Advisors
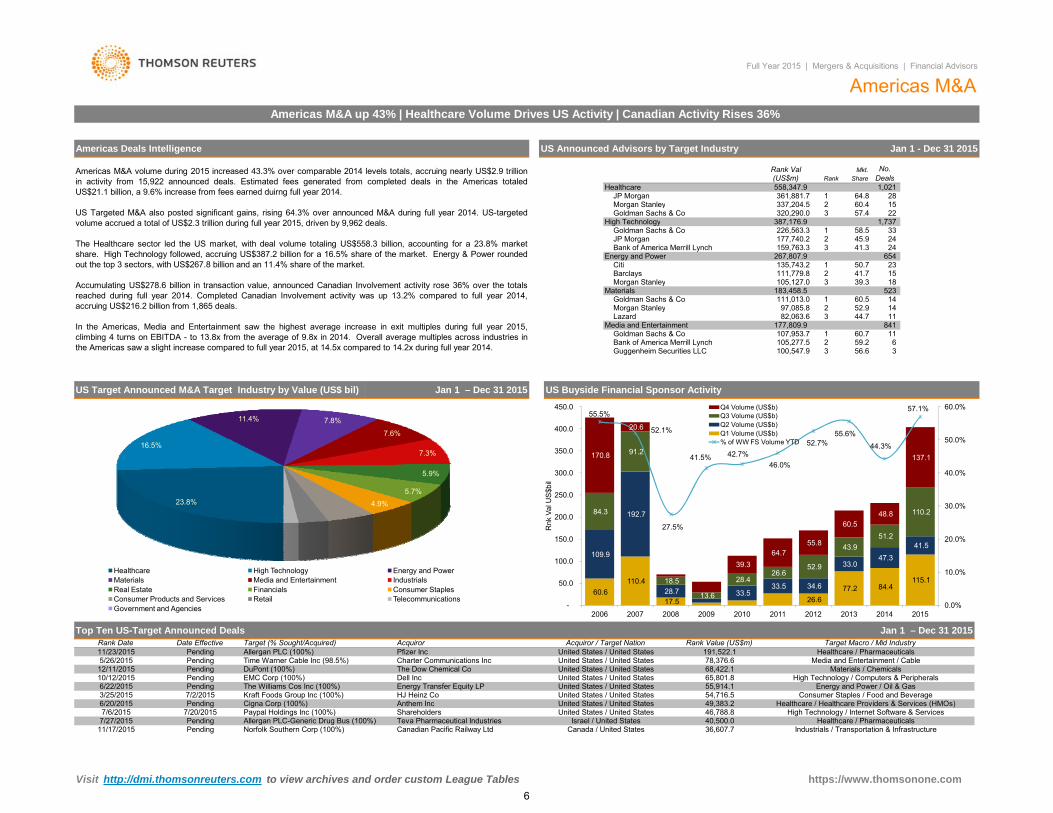
Americas M&A up 43% | Healthcare Volume Drives US Activity | Canadian Activity Rises 36%
33 45.9
Americas M&A volume during 2015 increased 43.3% over comparable 2014 levels totals, accruing nearly US$2.9 trillionin activity from 15,922 announced deals. Estimated fees generated from completed deals in the Americas totaledUS$21.1 billion, a 9.6% increase from fees earned duirng full year 2014.
US Targeted M&A also posted significant gains, rising 64.3% over announced M&A during full year 2014. US-targetedvolume accrued a total of US$2.3 trillion during full year 2015, driven by 9,962 deals.
The Healthcare sector led the US market, with deal volume totaling US$558.3 billion, accounting for a 23.8% marketshare. High Technology followed, accruing US$387.2 billion for a 16.5% share of the market. Energy & Power roundedout the top 3 sectors, with US$267.8 billion and an 11.4% share of the market.
Accumulating US$278.6 billion in transaction value, announced Canadian Involvement activity rose 36% over the totalsreached during full year 2014. Completed Canadian Involvement activity was up 13.2% compared to full year 2014,accruing US$216.2 billion from 1,865 deals.
In the Americas, Media and Entertainment saw the highest average increase in exit multiples during full year 2015,climbing 4 turns on EBITDA - to 13.8x from the average of 9.8x in 2014. Overall average multiples across industries inthe Americas saw a slight increase compared to full year 2015, at 14.5x compared to 14.2x during full year 2014.
50.7
3 56.6
11 44.7
60.7 11 Bank of America Merrill Lynch 105,277.5 2 59.2 6
841
US Target Announced M&A Target Industry by Value (US$ bil) Jan 1 – Dec 31 2015
Acquiror / Target NationTop Ten US-Target Announced Deals Jan 1 – Dec 31 2015
Target Macro / Mid IndustryTarget (% Sought/Acquired) Acquiror Rank Value (US$m)
Pending191,522.1
The Dow Chemical CoUnited States / United StatesUnited States / United States
7/27/2015
PendingEMC Corp (100%)Pending
6/20/2015
The Williams Cos Inc (100%)
Shareholders
Charter Communications Inc
Date Effective
12/11/2015 DuPont (100%)
Pending Allergan PLC (100%)11/23/2015Rank Date
5/26/2015 Time Warner Cable Inc (98.5%)
54,716.5
Pending Allergan PLC-Generic Drug Bus (100%)
10/12/2015Pending
Pending
Energy Transfer Equity LP6/22/2015
Cigna Corp (100%)
United States / United StatesDell IncUnited States / United States
United States / United States40,500.0
55,914.1 Energy and Power / Oil & Gas
United States / United StatesAnthem Inc
Israel / United States46,788.8
Teva Pharmaceutical Industries
49,383.27/2/2015
Paypal Holdings Inc (100%)
Canadian Pacific Railway Ltd
United States / United States
Pending Norfolk Southern Corp (100%)
US Buyside Financial Sponsor Activity
7/6/2015
36,607.7
7/20/2015
11/17/2015 Canada / United States
3/25/2015
Pfizer Inc
HJ Heinz CoKraft Foods Group Inc (100%)
Healthcare / PharmaceuticalsMedia and Entertainment / Cable
Consumer Staples / Food and BeverageUnited States / United States
Materials / ChemicalsHigh Technology / Computers & Peripherals
78,376.668,422.165,801.8
Industrials / Transportation & Infrastructure
Healthcare / Healthcare Providers & Services (HMOs)High Technology / Internet Software & Services
Healthcare / Pharmaceuticals
23.8%
16.5%
11.4% 7.8%
7.6%
7.3%
5.9%
5.7%4.9%
Healthcare High Technology Energy and PowerMaterials Media and Entertainment IndustrialsReal Estate Financials Consumer StaplesConsumer Products and Services Retail TelecommunicationsGovernment and Agencies
60.6 110.4
17.5 26.6 77.2 84.4
115.1
109.9
192.7
28.7 33.5 33.5 34.6
33.0 47.3
41.5
84.3
91.2
18.5
13.6
28.4 26.6
52.9
43.9 51.2
110.2
170.8
20.6
5.0 39.3
64.7 55.8
60.5 48.8
137.1
55.5%
52.1%
27.5%
41.5% 42.7%46.0%
52.7%55.6%
44.3%
57.1%
0.0%
10.0%
20.0%
30.0%
40.0%
50.0%
60.0%
-
50.0
100.0
150.0
200.0
250.0
300.0
350.0
400.0
450.0
2006 2007 2008 2009 2010 2011 2012 2013 2014 2015
Rnk
Val
US$
bil
Q4 Volume (US$b)Q3 Volume (US$b)Q2 Volume (US$b)Q1 Volume (US$b)% of WW FS Volume YTD
https://www.thomsonone.com Visit http://dmi.thomsonreuters.com to view archives and order custom League Tables6
Deutsche Bank Centerview Partners LLC
# of Deals per Advisor
Any Americas Involvement Completed (AF55)
Full Year 2015 | Mergers & Acquisitions | Financial Advisors
DealsMarketMarket
Imputed Fees (US$m)
US$mMarket Change in
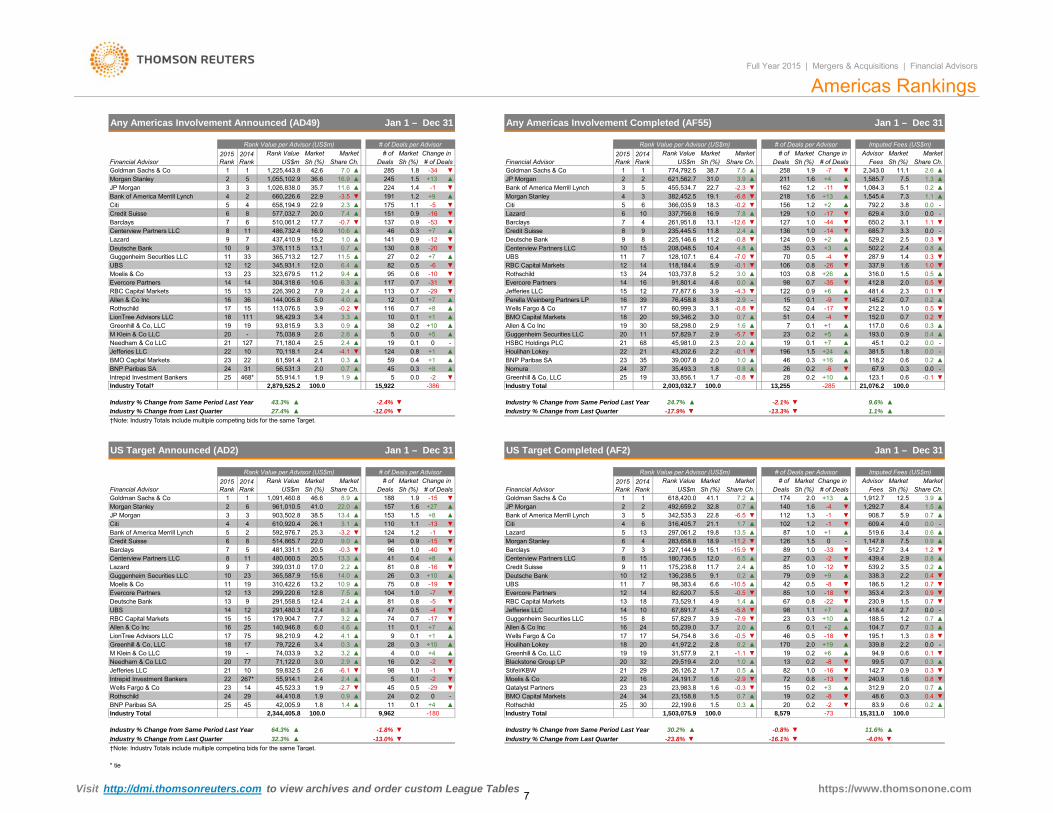
Americas Rankings
Rank Value per Advisor (US$m)2014 Rank
# ofRank Value Market2015 RankFinancial Advisor
# of Deals per Advisor
Share Ch.▲2.6
Sh (%)AdvisorRank Value
Share Ch. DealsUS$m
1,055,102.9 ▲42.61,225,443.8 7.0
Sh (%)▲
Market
Jan 1 – Dec 31Any Americas Involvement Announced (AD49) Jan 1 – Dec 31
Rank Value per Advisor (US$m)
258
# ofFinancial Advisor
Market
-34 ▼
MarketSh (%) Sh (%)Sh (%) # of Deals Fees
Market
2,343.0 11.1Share Ch.
1.9 -7
1,084.37.5▲
1.2
1 ▲38.7 7.51 774,792.5# of Deals
2015 Rank
2014 Rank
Change in
36.6 16.9Goldman Sachs & Co▼285 1.81
Morgan Stanley3 3 1,026,838.0
Goldman Sachs & Co 11.52 +13 ▲ ▲1,585.7 1.3▲ 2115
▼31.0 3.9
Bank of America Merrill Lynch 455,534.7JP Morgan
52
+922.9
1.611.6
1.2▲
Morgan Stanley22.735.7 162
+4245-1 ▼
2224 1.4 -2.33
621,562.7
Bank of America Merrill Lynch 4 2 660,226.6JP Morgan
▲1.1-11
19.1 -6.8▲▼ 5.1
▼5 4 658,194.9
0.2
22.9 2.3 ▲▼ 191 ▲ 3-3.5
▼ Citi 54 7.31.6 +13 ▲ 1,545.4382,452.5 218
0.06 366,035.9 18.3 -0.2 1.2 +2 ▲156▼Credit Suisse 6 8 577,032.7 20.0
1757.4 ▲ 151
Citi0.9
792.2 -1.1 -5 3.8-16 ▼ ▲7.8Lazard 6 10 0.0▼ 629.4
4 261,951.8 ▼ 650.2▼337,756.8
7Barclays 7 6 510,061.2-129 1.0 -17 3.0
▲-0.7 ▼17.7
16.9-53 ▼137 0.9 Barclays ▼
Centerview Partners LLC 8 11 486,732.4 16.9 3.3 0.0▼10.6 685.713.1 -12.6 3.1 1.11.0 -44127
9 235,445.5 11.8 2.4 1.0 -14▼0.9
▲ 13646 0.3 +7 ▲ Credit Suisse 8
10 9 376,111.5 13.1
-Lazard 9 7 437,410.9 15.2
0.7 ▲ 130141
10-20 ▼Deutsche Bank1.0 ▲ 9
0.8-12 ▼ ▲ 529.2
15 208,048.58 225,146.6 0.9 +2
10.4 4.8▼ 12411.2 -0.8 2.5 0.3▲ 35 ▲
Guggenheim Securities LLC 11 33 365,713.2 12.7 UBS 112.4 0.80.3 +3 ▲ 502.2
▼ 70 1.4 0.37 128,107.1 6.4 -7.0 0.5 -4 ▼ 287.9 ▼UBS 12 12 345,931.1 12.0
27 0.2 +7 ▲6.4 ▲ 82 0.5
11.5 ▲RBC Capital Markets 12-6 ▼ 14 118,184.4 1.6 1.0▼ 337.9▼ 106 0.8 -26 ▼
Moelis & Co 13 23 323,679.5 11.25.9 -0.1
-10 ▼95 0.6 24 103,737.8Rothschild 13 ▲Evercore Partners 14 14 304,318.6 10.6 6.3 ▲
9.4 ▲ 5.2 3.0 1.5 0.50.8 +26 ▲ 316.0▲ 1030.7 -35 2.0 0.5▼ 412.8
Jefferies LLC 15Evercore Partners 14
▼ 1223.9 -4.316 91,801.4117 0.7 -31 ▼ ▲ 984.6 0.0 ▼
RBC Capital Markets 15 13 226,390.2 7.9 2.4 ▲ ▼481.412 0.1
113 0.7Allen & Co Inc 16 36 144,005.8
0.9 +63.8 2.95.0
▲4.0 ▲
-29 ▼+7 ▲ Perella Weinberg Partners LP 16
2.3 0.139 76,458.812 77,877.6
▲Rothschild 17 15 113,076.5 3.9 -0.2 ▼
- 15Wells Fargo & Co 17
0.7 0.20.1 -9 ▼ 145.2▼ 52 1.0 0.517 60,999.3 3.1 -0.8 0.4 -17 ▼ 212.2 ▼
LionTree Advisors LLC 18 111 98,429.3 3.4116 0.7 +8 ▲
3.3 ▲ 10 0.1 BMO Capital Markets 18+1 ▲ 20 59,346.2 0.7 0.2▼ 152.0▲ 51 0.4 -4 ▼Greenhill & Co, LLC 19 19 93,815.9 3.3
3.0 0.7+10 ▲38 0.2 30 58,298.0Allen & Co Inc 19 ▲
M Klein & Co LLC 20 - 75,038.9 2.6 2.6 ▲0.9 ▲ 2.9 1.6 0.6 0.30.1 +1 ▲ 117.0▲ 7
0.2 +5 0.9 0.4▲ 193.0HSBC Holdings PLC 21Guggenheim Securities LLC 20
▲ 192.3 2.011 57,829.75 0.0 +5 ▲ ▼ 232.9 -5.7 ▲
Needham & Co LLC 21 127 71,180.4 2.5 2.4 ▲ -45.1124 0.819 0.1
Jefferies LLC 22 10 70,118.10.1 +7
2.2 -0.12.4▲
-4.1 ▼0 -
+1 ▲ Houlihan Lokey 220.2 0.0
21 43,202.668 45,981.0
-BMO Capital Markets 23 22 61,591.4 2.1 0.3 ▲
▼ 196BNP Paribas SA 23
1.8 0.01.5 +24 ▲ 381.5▲ 46 0.6 0.235 39,007.8 2.0 1.0 0.3 +16 ▲ 118.2 ▲
BNP Paribas SA 24 31 56,531.3 2.059 0.4 +1 ▲
0.7 ▲ 45 0.3 Nomura 24+8 ▲ 37 35,493.3 0.3 0.0▼ 67.9▲ 26 0.2 -6 -Intrepid Investment Bankers 25 468* 55,914.1 1.9
1.8 0.8-2 ▼ ▼1.9 ▲ 5 0.0 19 33,856.1Greenhill & Co, LLC 25 281.7 -0.8 0.6 -0.10.2 +10 ▲ 123.1▼
†Note: Industry Totals include multiple competing bids for the same Target.
Guggenheim Securities LLC Deutsche Bank
†Note: Industry Totals include multiple competing bids for the same Target.
6
1.8
96
7.7
Industry % Change from Same Period Last Year ▼
+10
16▲
Rothschild
17+7
Wells Fargo & Co
13.32.2
44,410.8
+8
4
▼Allen & Co Inc
▲
74 -17-4
9,962100.01.4 11 +4
▲ 0.10.1
▲ 104
4.6 11
▲▲
9
2
▼
Houlihan Lokey
55,239.0
1,503,075.9
▲
Barclays
342,535.3
4.118
Industry % Change from Last Quarter
Greenhill & Co, LLC▲75
3.417 79,722.6
2.4 2.4
28
▲
▲
77 71,122.0
5
0.3 41,972.2+10
Blackstone Group LP
0.3
▼0.2▲
-180
1.0▲26,126.2Jefferies LLC 21 -6.113
0.3
▲
Goldman Sachs & Co 1
Market # ofFinancial Advisor US$m Sh (%) Share Ch.
JP Morgan 3
Allen & Co Inc 16
18
Morgan Stanley 2 6 961,010.5
Citi 4 4 610,920.4
LionTree Advisors LLC25
98,210.9 +1
Needham & Co LLC 20
941.0 -40
0.5
▼-1.8%
-29
0.8
0.2
-13.0%
2.0
p , ,,Industry Total100.0 -38615,922 100.0Industry Total† -2852,003,032.7 13,2552,879,525.2
▲ -12.0%Industry % Change from Same Period Last Year 43.3% ▲ -2.4% ▼
Rank Value per Advisor (US$m) # of Deals per Advisor
▼ 1.1%
Rank Value per Advisor (US$m) # of Deals per Advisor
Industry % Change from Last Quarter 27.4%▲
100.0
-13.3% ▼▼
Imputed Fees (US$m)
▲
21,076.2
Industry % Change from Same Period Last Year 24.7%
US Target Completed (AF2) Jan 1 – Dec 31
-2.1% ▼ 9.6% ▲Industry % Change from Last Quarter -17.9%
Sh (%)2014 Rank
Market
US Target Announced (AD2) Jan 1 – Dec 31
MarketRank Value Market2015 Rank Fees
# of Change in 2015 Rank
2014 Rank
Rank Value Market Change in Market# of Deals
Market
46.6 8.9 ▲US$mDeals Sh (%) Share Ch.Sh (%)
Advisor
1,912.71.9 -15 ▼ Goldman Sachs & Co
MarketShare Ch. Deals Sh (%) # of DealsFinancial Advisor
1 1,091,460.8 3.912.5174 2.01 1188 ▲41.0 22.0
+13 ▲618,420.0 41.1 7.2 ▲▲+27▲
+83 903,502.8 38.5 13.41.6157
153 5.9▼ 112-6.55▲1,292.7 8.4▲
1.50.7908.7
1.632.8 1402 0.7 ▲492,659.2 ▼-422.8
▼▲ 1.5
▲1.3 -13
JP Morgan▼Bank of America Merrill Lynch
3.1 ▲ 1.1 -13110 1.2 -1 ▼26.1 Citi 316,405.7 21.1 1.7 1024 6 609.413.519.8Bank of America Merrill Lynch 5 2 592,976.7 297,061.25 13
-4.0 0.03.4 0.6 ▲519.6▼ 1.2 Lazard-1124 ▲87 1.0 +1▲
0.9Credit Suisse 6 8 514,865.7 22.0 9.025.3 -3.2
0.94 283,658.8 18.9 -11.2 - 1,147.8▼ 1.5 0 ▲Barclays 7 5 481,331.1 20.5 -0.3 ▼
▲ 7.5-15 ▼ 1263▼
Morgan Stanley 6227,144.9 1.21.0 -3315.1 -15.9 ▼ 512.789 3.4 ▼
Centerview Partners LLC 8 11 480,060.5 20.5▼7
12.0 6.5 ▲0.8▲ 27 ▼ 439.40.3 -2 2.9Lazard 9 7 399,031.0
1081
▲
180,736.511.7
▲0.317.0 Credit Suisse-16
10 12119
Centerview Partners LLC 8 15▲▲
41 0.4▼
▲175,238.8 -12 ▼1.085
0.99.1 ▲2.4 ▲ ▲539.2 3.5
▼0.42.2338.3 ▼0.2
-10.5 ▲ 0.742 0.5 -8 186.5 1.2▼136,238.523 +90.2 ▲ 79365,587.9 15.6 14.0 26
11 19 310,422.6 -19 ▼ UBS▲ 0.8 6.62.312 14
13.2 10.9 75 98,383.41.0
11 7299,220.6 -77.5 ▼82,620.7 5.5 -0.5 ▼ 1.0
2.413 12.8
12.4
Moelis & Co0.9▼ Evercore PartnersEvercore Partners 12
Deutsche Bank 13 9 291,558.5 81 1.4▼0.8 -5▲ -2267353.4230.94.9RBC Capital Markets
-1818
85 ▼
RBC Capital Markets 15 15 179,904.7-47 0.0▼ 14 10
1.52.7
0.8▲4.5Jefferies LLC
13 73,529.1 ▲+7
▼UBS 14 12 291,480.3 12.4 -5.8 ▼
0.7▼
23 ▲3.26.3
-7.9 ▼Guggenheim Securities LLC 150.767,891.7
▼24
-0.554,754.8
418.4980.3 +10 188.51.1
▲0.78 57,829.7 3.9▲▲3.7 0.1
1.2
-0.00.2 ▲ ▲▼ 1.30.5▼ 46
140,946.8 6.0
2.22.8195.1
20 170 339.8-184.2+2 ▲
▲0.3104.7 0.70.817 3.617
2.0 +1919 19 31,577.9 2.1 +6 ▼-1.1▲19 - 94.9▲74,033.9 3.2 Greenhill & Co, LLCM Klein & Co LLC ▼ 19 0.23.2 0.1▲ 0.0 +4 0.6
2.0 1.0 0.23.0 2.9 -216 32 29,519.420 -8 ▲▼ 0.3 ▼142.7
99.5▼0.90.7 0.3
1.7▼ -198 1.0 21▼ 29Stifel/KBW10 59,832.5 2.6240.9
820.5267* 55,914.1
-161.6
1.9 -2.7-2.9 ▼
2322
Qatalyst Partners 23▼
14 45,523.3-13Intrepid Investment Bankers 22 Moelis & Co0.1 -2 0.8
0.3▼1.923,983.80.523,158.8 1.5
450.9
▼15 0.2 +3 ▲ 0.7 ▲2.0
0.8312.9-0.3 ▼
▼ 7224,191.7 1.6▼
161.6
34Rothschild
24BMO Capital Markets24▲ 0 -▲ 0.1
0.4 ▼0.7 ▲ 48.619 0.2 -8▲▼ 0.6 0.283.9
15,311.0 100.0-2▲1.5-73
30.2% ▼
25 0.2
Industry % Change from Same Period Last Year▼
22,199.6 20
-0.8%
30100.0
▲11.6%▲-4.0%▼-16.1%
8,579
-23.8% ▼
Industry Total
Industry % Change from Last Quarter64.3%
2,344,405.8▲
24 29
▲
45
32.3%
Industry TotalBNP Paribas SA 25
▼
▲
42,005.9
Wells Fargo & Co 23
https://www.thomsonone.com Visit http://dmi.thomsonreuters.com to view archives and order custom League Tables
* tie
7

Guggenheim Securities LLC Deutsche Bank
Industry TotalBNP Paribas SA
100 0 1321 785 171 5 11 177▲ 34 0.5 0.5 ▲
18 740 9 100 025 45 28,005.9 1.6 1.1
1.50.3 +16 ▲ 90.3
▲85 0.8 -11 ▼ 288.0 1.50.6 0.6 ▲
Moelis & Co 24 18 29,571.5 1.7 -2.2 ▼34 30,866.0 0.2 -10 ▼ 108.21.7 0.7 ▲ 17
-1.0 ▼ 0.6 ▲26 0.2 +9 ▲ 120.5 0.60.20.1 +4 0.2 ▲
Greenhill & Co, LLC 22 19 33,749.4 1.9
1.942,589.5 2.41.9
0.2▲ 29.11.6 ▲ 12
▲ 193.023 0.2 +621 ▲
1.01.9 ▲186 1.7 +19 ▲ 363.11.0 ▲
0.6 0.6 ▲Guggenheim Securities LLC 19 10 57,829.7 3.2 -6.5 ▼
-1.0 ▼0.1 +1 ▲ 117.01.9 ▲ 7
1.1 ▲52 0.5 -17 ▼ 212.2 1.11.3 ▲77 0.7 +22 ▲
▲Rothschild 16 24 63,656.0 3.6 1.9 ▲ 247.2 1.3
2.512 71,724.1 4.0 -5.2 2.5461.4▼0.7 0.70.1 -9 ▼ 135.8
1.3 ▲16 74,420.1 0.6 -30 ▼ 237.14.2 -0.4 ▼ 702.0
▲114 1.0 +3 ▲1.3
▲92 0.8 -25 ▼ 2.0380.51.4 1.4 ▲
Evercore Partners 12 15 83,940.4 4.7 -0.5 ▼▼ 261.36.5 -8.1 ▼ 607 115,105.4
472.1 2.5169,990.7 9.5 -2.3 ▼0.5 -7
2.5 ▲112 1.0 +3 ▲3.4 ▲114 1.0 -9 ▼
▲Credit Suisse 9 13 205,146.8 11.5 3.0 ▲ 631.6 3.4
▲5.4 ▲ 34 0.3 +3 ▲ 495.5 2.6 2.6
4 -42▲9 327,809.2
▼13.6 -14.3 ▼241,939.5 1.0 610.6 3.3116 3.3▲118 1.1 -18 ▼ 614.1 3.3 3.3
189+5
1,409.6 ▲5 3 334,877.3 18.8 7.5
7.9▲ 11.7
3.9-9.2 1.7 +7 7.5▲
732.0
▼
# of
11.7231 2,200.12.1
141 1.30.4 ▲
1.77.31.2
-1.5
Sh (%) # of Deals Fees Sh (%)Market
Share Ch.MarketChange in Advisor
236-28
+130.4
BNP Paribas SA 0.31.4
0
Wells Fargo & Co
Intrepid Investment Bankers 23 385*37 53,500.114
55,914.1
343,164.7▼
1 722,301.1 -9551,276.9
2.02.1 2.1
149 1.3
▼36
Market
▲
Share Ch.
+1Goldman Sachs & Co
▲ 189
68
▼Morgan Stanley4 6
18.4Lazard 6 8.6
▲
20HSBC Holdings PLC 21
23
▲36
▲
▲M Klein & Co LLC 20
1082.42.7
Jefferies LLC 22 10
74,033.971,180.4
-5.063,079.0
1.319 1917
21-
Evercore Partners 15 303,584.5RBC Capital Markets 15
17 98,210.993,709.318
10.0
5.513
14
144,005.8180,353.2
7.011.56.8
4.4
128
13.9
507,445.3
329,353.8 6.4332,737.6
45
113
16.3
611.3
12.6269
12.51.6Deutsche Bank
Moelis & Co 13 21 315,970.6 12.0UBS
1112 12
60.4
21.323.7
8
▲▲
▲
▲
19.2
0.9
2.83.5
2.6
3.63.63.7
16LionTree Advisors LLC
91Rothschild
Allen & Co Inc10028
Needham & Co LLC
91,345.4▲Greenhill & Co, LLC
▲
2.8 ▲0.1
1.8
0.3
51▲
▼
19.21.35.5
1,474.4
▲ 3.9▲1,030.2- 5.5▲
▲
2.5▲9.5
▼▲
-1135 1.0
211
150
0.178
Houlihan Lokey
Blackstone Group LP5
▼
-3
7
# of Deals per Advisor
4
115
-12-16
+90.7 +170.0
0.1
0.7
14.5
+7
171
DealsRank Value
260
-13-23
-24
Change in
+13
-14
Market
2.0Sh (%) # of Deals
▲▲
+20
+8
0.5
-44 ▼
1.1
1.0
2
Citi
Jan 1 – Dec 31Any US Involvement Announced (AD41)
# of
-3.74
19.5 ▲
Market
1,000,857.424.5646,955.1
2
2
Financial AdvisorGoldman Sachs & Co 1
39.0
2014 Rank
37.9Morgan StanleyJP Morgan 3 3
US$m2015 Rank
1 1,193,729.35 1,028,610.6
Rank Value per Advisor (US$m)
45.2
Bank of America Merrill Lynch
220
MarketSh (%)
▲8.7 ▲7.9JP Morgan
Rank Value MarketImputed Fees (US$m)
2014 Rank
▲
MarketDeals
-
0.0
Any US Involvement Completed (AF48)
+4
1.7
12
▲
Industry Total 2 640 336 5
24
13 0662.0 -2.651,767.825
100 0
3.9
17
▼
Wells Fargo & Co▲
Allen & Co Inc
61 34,267.4
17
14
27 58,298.0▲▲
3.3
33 69,250.5 ▲
18
27Lazard 9
10125 1.07
365,713.2429,485.9
Citi
Barclays 7
625,901.0
118
561,575.0
Centerview Partners LLC 485,934.5
5
▲1.1
UBS
Centerview Partners LLC▼-17
▼
0.3
+8▲
60,999.3 3.4
2.9
▼
▲
Perella Weinberg Partners LP
-2
2
▼▼
15
▲
▲
▼
+1
RBC Capital Markets
▼Financial Advisor
1US$m
Jan 1 – Dec 31
8
8
207,250.6
11
Americas Rankings
Share Ch.
0
+7
11.6
▼
3
10
14
Barclays
40.5
Jefferies LLC
# of Deals per Advisor
Sh (%)
437,796.1 24.5
Rank Value per Advisor (US$m)
530.9
1.6 Bank of America Merrill Lynch
2015 Rank
-26
Full Year 2015 | Mergers & Acquisitions | Financial Advisors
14▲
13▼
9
0.2
90
19
▲12.5
0.9▼
0.6
▲
18.4
113
0.9
0.9
▲
▲
Credit Suisse4
CIBC World Markets Inc CIBC World Markets Inc
▲
Lenner & PartnersDanske Bank
13.2%
Jefferies LLC13.72
0.6▲
▲+5
14-
Industry Total
1 +1▲
0.0
5
9,306.6 3.3 3.3
▲0.01
2.52.5INFOR Financial Inc
2,412
▼
0.5+226
+426.4
1,865Industry Total278,637.1
2.3
-1 ▼
▲ 102.0 ▲
0.0 +10.02.2
2.3▲
▲ 1.812.20.1
46.0▲ 3.5 0.1
1.8
-21.5%▼▼
-9.6%▼
-197 2,605.8
▼ -2.4%-13.9%-38.0%
Industry % Change from Same Period Last Year
1.2 0.37
-10.3%
▲
100.0
2 +2▲4,674.024*▲ ▲
Union Square Advisors LLC-
100.0
2.22.2
▲0.5▼
0.02.5▼▲ 0.50.0 -2 1.084,990.3
▲0.5
3.22.55,441.0
+10.0
▲0.4
1
▲1
20* ▲- 6,954.1-
5 0.2 4,674.0
Sandler O'Neill Partners
24*
22 -
+5 -
▲
+13.23.2
6,954.1 ▲15.00.0 ▲
0.50.5
▲
12.70.6▲
19 ▲ 10.15 0.40.40.0▲INFOR Financial Inc
20* - 6,954.1 2.5 ▲+13.2
▼0.0 -44 0.8▼ 21.8 0.49,051.2 3.319 - 7,274.3 2.6
12
▲0.22.6 +5
▼-13
-
6 8,718.5▲ 18▲
BNP Paribas SA3.4
1727
4.044.6▲▲ 41.2
0.0 1.7 ▼0.0 0.30.0 0.9 0.2 ▲
1.6▲ 23.7+4
+3
US$mAdvisor# of
▲Fees149.4▲0.122 +3
▼
52,497.5
▲
# of Deals per Advisor
-17.5%
Share Ch.
-6.6
▼
▼18.9
100.0
▼9.6% ▲
-15.1% -0.1%
-1321,785,171.5
▼
11,177
Industry % Change from Same Period Last Year 26.2% -1.2%
18,740.9 100.0
Industry % Change from Same Period Last Year 49.1% ▲
-236
12
-0.6
25
10
-13.7%
7.1
135
▲22
22
26.7
9.5
-
1.9
Lenner & Partners
Rothschild 18 24
-11.6
Industry % Change from Last Quarter
* tie
20* - 6,954.1
47
25Ernst & Young LLP▲
1.9Jefferies LLC
4,886.3 1.85,596.1
▼▲Industry % Change from Same Period Last Year 36.0% -9.1%
82.7%
23 9,167.7Rothschild
▲
16▲ 29▲
TD Securities Inc
Sh (%)
▼
Qatalyst Partners
▼
▼▼
-7
0.4
-1.8%
MarketFinancial Advisor
216,204.8
2.8
0.1▼
24.3
23
1.7
+4 4.2Scotiabank
7,274.3
20*
▼-11.3
3.4
Macquarie Group
▲
-1.515
▲4.03.4
14
7,301.8
15
-1.6+9
Industry % Change from Last Quarter
Sh (%)
0.9
▼
Barclays
Rank Value
9,085.1
1.6
RBC Capital Markets
38▼
52,757.1
Share Ch.Sh (%)+4
Market
-52.2Morgan Stanley
3
Goldman Sachs & Co
11.2 1852
▲
1 43,571.2
63,428.7
Citi
10
52
967
Deutsche Bank
5BMO Capital MarketsBank of America Merrill Lynch
2
18.922.8
74,400.522.963,868.0
JP Morgan 107,683.81
4RBC Capital Markets
▲11.7▼
3 38.7# of Deals
1.015.4US$m
# of 2014 Rank
▲
Rank Value per Advisor (US$m)
Any Canadian Involvement Announced (AD42) Any Canadian Involvement Completed (AF49)
2015 Rank
Jan 1 – Dec 31
Rank ValueDealsFinancial Advisor
Industry Total 2,640,336.5 13,066
25.3%
2014 Rank
Market
100.0
Industry % Change from Last Quarter ▲
Sh (%) Share Ch.
▲▼ 136.2
2.75.7
116.4 0.5
2015 Rank
5.2
Market# of Deals
Change in MarketImputed Fees (US$m)
3.7
Market
-234.6
0.2
Sh (%)
▼▲
DealsMarket
47
Industry % Change from Last Quarter
-35 74,720.0
24.4
Jan 1 – Dec 31
+4 23.6
JP Morgan
34
▼1
0.85.7Goldman Sachs & Co11.7
34,468.1 15.9
2BMO Capital Markets
391
▲
2.6-0.0
▲2110
0.14.5
-836 +2
67.86.5 ▲▲6.6 148.9
0.1
+3▲
4.7+1 ▲0
▼-12
8Morgan Stanley 0.10.0
12.213.0
▼
915
815.6
34,252.5 12.333,293.7 24,716.1▲ 19Credit Suisse
7 26,324.5
16 32
HSBC Holdings PLC
Citi0.7
7
UBS
5.32.4
10
15▼
UBS
▲
19,657.22
3.6
0.363.5▲168
8 2.69
68.824,077.1
22,529.4
9Credit Suisse 2010
26,360.4
Macquarie Group 11
6Bank of America Merrill Lynch▲ Deutsche Bank▼
115
▼
-3.2
▼▼0.1
0.5180.9
▲
▲1.2
▲
▲
0.9
▲▲
123.54.2
▼
-3.611.4
-2.1
0.0
▼
▼
15
0.2-5
28,181.3 110.4▼
4
52,730.5
50,931.1
2.111.1
▲ ▲
+2▲9.1▼
14 40
▼
78.20.1
0.7-9 ▼ 92.515,459.61.00.117 3.08.3
136.9-3
17,977.7 -12.4 ▼12
-5
+46.6
▼
▼0.8-12 ▲5.9Nomura
12
-94.9
▼ 32
10,477.81.6 ▲
1
4.2
7.2
90.4
0.0 0.9▼ 15 0.0 ▼ 41.7 1.6
0 ▲13 12,797.747 -5.6 23.40.615,071.5
▲
10,501.4
0.5+1
▲
▲
2.0
2.7 ▲
-7.5
0.03.8 0.4
30
11
22+2
Industry Total
-20-3.70.6▼
1+2
6,435.5 0.22.3
0.4
2.5 ▲
-241
Sandler O'Neill Partners 2438
6,292.823 46
100.0
Danske Bank
15,534.9
13
18,886.0
25,173.6 1.6
▲8.19.0
6.0
6.8
# of Deals per Advisor
0.112.0
+7+9
▼
-0.7
0.7▲
18▲
0.9
-3 ▼
0.7
-117
▲17-14
Change in
0.7▲
3.4
▲
13,107.54
6.7
1.2
61.2▼
▼
0.5
5.44.7 -17.0
TD Securities IncBarclays
14 11
19
Gresham Partners 17
Rank Value per Advisor (US$m)Market
Moelis & Co
15
5.6
38
▼68
Scotiabank
7
1312
8
Visit http://dmi.thomsonreuters.com to view archives and order custom League Tables https://www.thomsonone.com 8

Jan 1 - Dec 31 2015
68.9
22
172,012.7
2
51,725.0
1
1
31.5
46.9
30.4
75.5
Mkt.
Consumer Staples
2
190,447.5
73.1139,120.5 1
Rank Val US$m
143,865.9
Rank
Lazard
3
52,345.3
163,624.2
136,704.6
Rothschild
3 UBS 3
11 35.8
14,277.8
Primary Listing of Most Acquisitive EMEA Companies - Top 10 (US$b) Jan 1 - Dec 31 2015
221,013.3
76,741.3
1,977 6
58,507.3
15,038.6
Full Year 2015 | Mergers & Acquisitions | Financial Advisors
EMEA M&AEMEA Announced M&A Up 13.9% | Consumer Staples Highest Valued Sector | Financial Sponsor Activity drops
EMEA Deals Intelligence
13 9
71.8
EMEA Involvement Announced Advisors by Target Industry
174,694.7
5
1,324 Share
8
No. Deals
1,248
79,635.4
Goldman Sachs & Co158,364.1
93,361.3
26 54,136.5
17
2,834 53.4Lazard
Announced M&A activity with EMEA involvement totaled US$1.45 trillion in the full year of 2015, up 13.9% compared to theUS$1.26 trillion reached last year.
Estimated fees accumulated on EMEA deals completed in the full year of 2015 were up 3.7% from last year, totaling US$11.7billion, according to estimates from Thomson Reuters/Freeman Consulting.
The Consumer Staples sector led the EMEA marketplace, with 1,324 deals totaling a combined US$190.4 billion, including theSABmiller PlC and Anheuser-Busch Inbev deal, which was the largest European deal of the year, valued at US$120.8 billion.Energy and Power accrued US$174.7 billion, and Industrials totaled US$172.0 billion of activity.
Financial sponsors were less active this year so far compared to full year of 2014. EMEA-targeted buyside financial sponsoractivity reached US$130.2 billion in the full year of 2015, down 21.5% from the US$165.8 billion reported for the same period lastyear.
Acquirors listed on the Euronext Brussels Exchange were EMEA's most acquisitive companies for the full year of 2015, with acombined total of US$130.7 billion in offers.
Bank of America Merrill Lynch
Morgan Stanley
Goldman Sachs & Co
Healthcare
Goldman Sachs & Co
Financials
Bank of America Merrill Lynch
Morgan Stanley
Energy and Power
Industrials
Bank of America Merrill Lynch
Citi
94,105.2
3
50
3
46.8
53.9
2
12
16 13
48.7
1
30.11,070
8 Barclays
EMEA Targeted Financial Sponsor Investments (Buyside Sponsor Activity)
49.3
Consumer Staples / Food and Beverage
Visa Inc
Coty Inc Consumer Products and Services / Other Consumer Products17,911.216,917.8
Industrials / Transportation & InfrastructureKansai AirportsProcter & Gamble Co-Beauty (100%)
New Kansai Intl-Op Concession (100%)
Consumer Products and Services / Home Furnishings23,964.4
Jan 1 – Dec 31 2015
7/9/2015France / Japan
40,500.0
Financials / Insurance
Top Ten EMEA Involvement Announced Deals
y g q p p ( $ )
Rank Value (US$m)
18,108.5
33,741.4Ireland-Rep / United States Healthcare / Pharmaceuticals
Financials / Other Financials
Baxalta Inc (100%)
Media and Entertainment / CableNetherlands / South Africa
Pending
Steinhoff International (100%)
Switzerland / United StatesPending
Chubb Corp (100%)
United States / United StatesPending* Undisclosed
Shire PLC
SABMiller PLC (100%)
28,533.6
BG Group PLC (100%)120,785.2
Acquiror / Target Nation
Royal Dutch Shell PLC
Target (% Sought/Acquired)StatusRank Date
22,671.4Pending Cablevision Systems Corp (100%) Investor Group
11/10/2015
Completed
7/1/2015
Anheuser-Busch Inbev
Genesis Intl Hldg NV9/17/2015
4/8/201510/7/2015
Teva Pharmaceutical Industries
11/2/2015
Pending
Visa Europe Ltd (100%) United States / United Kingdom
Pending
Allergan PLC-Generic Drug Bus (100%)7/27/20158/4/2015
Pending
12/7/2015
Netherlands / United Kingdom
Pending ACE Ltd
Pending
Target Macro / Mid Industry
Netherlands / United States
Healthcare / PharmaceuticalsIsrael / United States
g p ( y p y)
Belgium / United KingdomAcquiror
81,009.7 Energy and Power / Oil & Gas
$75.9 $74.8
$27.4 $15.6 $21.9 $18.5 $25.8$47.7
$30.2
$46.1$85.6
$44.3
$9.0$16.6
$37.7$19.3
$33.3
$43.2$41.0
$60.4
$54.2
$28.2
$14.6
$37.2
$23.9
$18.6
$24.2
$29.8
$27.5
$90.8
$68.0
$24.9
$18.5
$24.9$22.3
$24.0
$31.6
$45.1
$31.5
19.7%
17.1%
10.2%
7.5%
13.2% 14.1%
9.4%
18.3% 18.3%
13.2%
0%
5%
10%
15%
20%
25%
$0
$50
$100
$150
$200
$250
$300
2006 2007 2008 2009 2010 2011 2012 2013 2014 2015
% o
f EM
EA
Ran
k Va
lue
(US
$b)
Q4 Volume (US$b)
Q3 Volume (US$b)
Q2 Volume (US$b)
Q1 Volume (US$b)
% of YTD EMEA M&A
$130.7
$113.6
$82.1
$64.0
$57.9
$45.6
$44.7$16.8 $16.6 $15.9
Euronext Brussels
London
Amsterdam
Swiss Stock Exchange
New York
Zurich
Nasdaq
Madrid
OMX Stockholm
BMFBOVESPA
https://www.thomsonone.com Visit http://dmi.thomsonreuters.com to view archives and order custom League Tables9

BNP Paribas SA
32 27,463.1 1.9
33,532.02.129,739.7
1 445 267 3
0.5
47,530.547,031.7
1331
34,809.734,917.3
0.7
54,640.715
22
49,575.7 3.4
4.176,049.859,249.034
3.819
+5
0.0
0.1
-40.1
18 210+2
0.1▼
+224
0.0
30
▲45
0.0
-5
0
0.10.1 -6
0.0
0.1
▲4824
22
▲▲
25
20Natixis
RBC Capital Markets
Mediobanca
0.92.2
23
38
▼
35▲
42.7
127.3
94.1 0.2
▲0.8
0.50.3
▲
39.6
▼
1.1131.7
2.0
2.5
0.6
0.4
0.9
313.2
0.50.1
▼
67.7
0.3
0.00.5
0.7▼
+16
▲
▼ 71
5.1
10.3-0.7
139,314.3 ▲13.9Barclays
12 10.4
0.9 0.3
0.4
-34 Lazard
114,951.1
▼0.2
37.8
339,047.123.631.8
23.5
546,742.7
341,458.1▼
5Bank of America Merrill Lynch 201,923.4
▲
19.4-3-24
▼ Deutsche Bank 7 194,780.0
20.720.1
-1.56 -9.5
-
7
3.6
3.1
3.3
3.3
▲ 0.0▼
1.1 ▼▼
83.6
287.4
0.2
52.6
110.0
235.2
0.8
▲
0.9
0.6
-14
▼▼
▼
0.4
▼
-12
51.7
▼
▲
▼
86.6+3
▲
-14
0.6
-150.3
0.3
+290.2
-1
0.30.3
▼▲
▼
▲ 0.1
0.2
▼0.1-8 ▼
0.1-2
11 654 8
▲-9
0.1 0.1
0.3
0.7100 0
0.1 0.3-5
+116
89.4
1.124,295.5 2.4
1 005 646 02.1
37
1.0 ▲2.40.71.1
▲
43
▼
44▲
0.3
+70.112
45
29
Industry Total21
38
▼▼
5634
+1123,982.0
2521,451.221,792.0 ▲
▲0.3
14 999
5.2
▲112
3
6.7
▼
▲Citi
100 0
▼
6.2
-8
0.1
7
384.7
0.110
49
0.5
▲
+9
▲▼
195.4
2.70.4
▼0.3
▲
▼
1.2
▲
▲▼
▲
0.1
▼0.6
0.2
0.3
Change in
-16
Fees
1.7
8.3
▲
0.80.6
Sh (%) # of Deals
Any EMEA Involvement Completed (AF53)
Share Ch.Market
Imputed Fees (US$m)
Full Year 2015 | Mergers & Acquisitions | Financial Advisors
# of Deals per Advisor# of
EMEA Rankings
Sh (%)# of2014
Rank
Rank Value per Advisor (US$m)Change in Market
DealsShare Ch.Rank Value AdvisorMarketMarket
▼354,510.1 ▼ 1.0-0.9 154 -2
2015 Rank
23.8-5.1
214,720.3
Sh (%)US$m
0.3 21.4
5.8675.2-7.8
▲
418.8
+1721.8144
138
0.7
2▲
Sh (%)Deals
▲
98▲ 4
3963.0
1.00.9▼155 -140.4
+10.4▼
170 Goldman Sachs & Co
▼262,905.5 26.1
▲
0.4
1JP Morgan
35.3
239,196.82+8
Morgan Stanley
207,900.1
605.4
-23
+66.9 ▲
365.3▲
-200 384.0
+40▼
▼-
0.7103
0.90.7
104▼
68,919.9
94
140
0.6
▲
1347
4 ▼
76247
0.511
103,181.2104,942.6
5
6
1.6▲
9.0UBS
90,195.4-2.6
-2190
- BNP Paribas SA▼
-11.727-18
12
▲8.3
138149
10
78,253.9
11.57784166,048.5
57119,448.3
▲
-12.8
7.3+12
Rothschild
▼Credit Suisse
11.4
+38 17.6176,902.2
12.3
5.4
▲-5.6
+7
▼▲
0.3
0.1
295
▲ 49
▲▼
0.3
0.2▼
5.3 3.1
2024Mediobanca 25Nomura
Industry Total
21
Jefferies LLC 23 27
Zaoui & Co20
48
3.3Guggenheim Securities LLC16
Moelis & Co 22
▼-1.4
100 0
2.9-2.8
1.9-5.6-0.6
292.4
2.32.4
0.1 +8
▲▼▲▼
6+16
▼
▲0.1
-3
Evercore Partners▲ ▼
62 +17
▼Nomura-7
-911
1.6-3.2
Macquarie Group
▲▼
▼
5325
10▼
Centerview Partners LLC 19
6.363,307.2
1626
5.0
17
0.20.4
Credit Agricole CIB
0.0
3.3
24,364.4 2.4
46,067.71851
4.6
21
▲ 16
▼-0.9
Jefferies LLC▲
3.637,542.1 3.7
2.9 ▲35,913.636
Perella Weinberg Partners LP 19
1718
0.3
14
5.453,843.450,062.3
15Zaoui & Co
17
6.9
Societe Generale
▲▼
6.0▲2.4▲
2.7
14.8
4
10
459,873.55
333,957.117.1
5
6
4
2
8
Barclays 6Lazard
JP MorganMorgan Stanley
Deutsche BankBank of America Merrill Lynch
7
202,451.4206,664.6
▼▼
14.3 112
-14314.0
-711
-10
97
2.6
-1.3HSBC Holdings PLC
0.7
2.5139
0.2
19
17
12
9
10
Perella Weinberg Partners LP
HSBC Holdings PLC
12
14
Citi
16Greenhill & Co, LLC
UBS 13
15
7Rothschild
911
Robey Warshaw LLP
18Societe Generale
Credit Suisse
213,463.6
33
8
29
Centerview Partners LLC
Evercore Partners
5.0
14910.3
8.2161
129112
12.5▲
▲
246,859.6
Rank Value Market
583,918.1 8.5
▲
MarketShare Ch.
▲
23.1
2015 Rank
1
2014 Rank US$m
# of Deals per Advisor
Jan 1 – Dec 31
Market
37.91Goldman Sachs & Co
547,755.8 11.9240.4
Financial Advisor# of DealsSh (%)
Any EMEA Involvement Announced (AD47)
Market
7.1
-0.8
Financial Advisor
Jan 1 – Dec 31
Rank Value per Advisor (US$m)
▲
1
▲
BNP Paribas SA Barclays
11▼
7-5.9
18
Deutsche Bank6
13
Lazard
Citi
Barclays 7
9
12Credit Suisse
42.4
1,445,267.3
2.8235,450.69
15.9%
563,258.4
8
17
166,048.5202,451.4
1277,672.6
208,956.3
-1.6
53▼
-4.915.7
-2.2
3.4%
3
119,207.3
44
0.34415
2.1
14 5.8
47,031.7
4.12215
3.716
75,310.3
49,575.718
21
2.0 ▲
2060
31
-3.334,630.1
19
▲
▲
-0.5
26,906.4
54,640.7 -2.8
26,498.8
45,610.3
15.615.212.5 -0.9
3.3206,664.6
52.6-8
5.7 3.4
9.0
▲
▼0.6
3.4+1
2.7%
11,125.2 100.0
0.8
0.0-5
+291
20
0.8100.0 +143
32
3.5
2.6
48
16 34,917.3
2.1
▼ 613
0.7
0.9
+4
53,843.4
▼
▼-15
0.3
▼
▼
1.00.2
▲
▲
▲0.10.51.2
▲
▼0.2
▲
0.5 ▲
0.1 ▲
▲
83.6
▲
85.8 ▲
0.3▼0.4
▼
Change in
▼
Sh (%)Market
18,210 +224
Deals
+8
1.2%
# of
▲
Jan 1 – Dec 31
# of Deals per Advisor
0.7
109
▼
▼
90157
+10
27-3
0.5
-10
1.7
-4▼
▼
0
Societe Generale▼▼
▼
▲▼
1
4
13
Mediobanca
17
Centerview Partners LLCNatixis
UBS
10
6
Goldman Sachs & Co
15Zaoui & Co
Citi
16
Industry % Change from Same Period Last Year
12
33▼
# of Deals Financial Advisor
2-2 ▼
Rank Value per Advisor (US$m)2015 Rank
2014 Rank
1-19-12
0.0
-7
143
-15
0.8
-33
▲
▼
-0.1%
6Credit Agricole CIB
Perella Weinberg Partners LP
JP MorganMorgan Stanley
17.4%
227.0
0.1132.2
.2
3.7%4.0%
+6
-21
-19
0.30.3
+8
0.3 +29-1
+11
-13
0.3
Market
▼
▼
-1
▼
▼
▲
▲▼
-14
▲-4
▼
▼▼
-10.2
1.1 ▲▲0.5
12
▲ 8
43
44
▼▼
92
37
1.3
14.6
1.0
5.7
-11.6
-13.7
9.1
2.5
2.52.6
3.0
205,363.8
10.8
21.5
▲
8511.3
8.0
▼
43
-7.421.7
6.7
139137105
▼
Deals# of
▼243
97
▼
▼
▲
▲
45
▲
▼
▼
18.5
Market
▲
▼
-0.3
▲
19.320.3
7.3238,425.5
-1.027.025.0
-5.4
-9.9-2.3
Sh (%)1.01470.9
MarketShare Ch.
1331.0
0.5
0.0
1.0
0.60.574
69
1.7
0.7
0.1
0.6
0.70.7
-1
0.337
5228
-9
0.1
7
99
▲▲ 0.2
0.1
32
▲
14,210
1.0%
0.4
21
▼-17.7%Industry % Change from Last Quarter▼
0.1
▲
▼
-21
7.0%
-8+3
▲
+39
▲
-4
▼
Jan 1 – Dec 31
▲▲
11,654.8
Share Ch.
0.1
0.3
Market
▼3.2
0.86.4 ▲3.7
▲0.6
1.3
2.7
5.43.2 1.1
0.6
0.7
8.3
0.4
▼0.5
-▼
0.0
▲▼0.2
0.3106.5
▼
1.7 0.2
0.60.1
▼0.32.0
39.6 0.20.4
▼
▼
0.5
599.0
298.4
94.1
0.4
▲
MarketImputed Fees (US$m)
100.0+116
▲
1,005,646.0Industry Total
# of Deals per Advisor
▼
67.7
Any European Involvement Completed (AF3)
-16.9%▲
2
-3.9%
-7
-120.3
+10+2
+9
▲ 290
0.345
75
0.8
0.3
0.0
▲ 52
▼10
111130▼
8313.4
▲29 3
Nomura
1,329,096.0
38.3%
* tie
Industry % Change from Last Quarter ▲
Sumitomo Mitsui Finl Grp Inc
Industry Total 17,053
2423
1.914
▲
▼
-0.9
0.7
3.918
2.321,451.2
29
35,913.6
2.3
19
100.0953,926.8
3.8
14,999
Sh (%)
43,234.5
2.5
40
0.8%
193,893.6
207,055.1
▼
36.7349,726.8
Rank Value
257,055.0
US$m
14.5%
37,542.1
23,882.0
Industry % Change from Last Quarter
100.0
6
Industry % Change from Same Period Last Year
Mediobanca
17
15
7
111110
Rothschild 8
22 27,463.12122
Jefferies LLC
51
2425
-5.1%
RBC Capital Markets28 21,792.0
23,720.8
24,364.4
▲Industry % Change from Same Period Last Year
Industry Total
Centerview Partners LLC
0.32.6
Evercore Partners360.2 ▼35▲0.8
Robey Warshaw LLP
Moelis & Co
Perella Weinberg Partners LP
HSBC Holdings PLCEvercore PartnersSociete Generale
UBS
Zaoui & Co
Guggenheim Securities LLC
2
Rank Value per Advisor (US$m)
▲Share Ch.
Goldman Sachs & Co 1
Industry % Change from Same Period Last Year
Financial Advisor2015 Rank
Industry Total
Rank Value
▲
1
13.9%Industry % Change from Last Quarter
Market
8.9
2014 Rank
2
100.0
▲
501,298.5
MarketUS$m
535,902.5 ▲
Sh (%)
Morgan Stanley
4 11.611.313.2
37.7Bank of America Merrill Lynch 5JP Morgan
451,843.63
▲5 4
▲
293,907.4 22.1
337,915.9▲▲2.3
6.6 ▲6.2333,112.1
▼
0.60.9
34.0 0.7 Lazard▲5 8▼
▼
9
Bank of America Merrill Lynch 4184,194.9
▲ 14
7176,627.28
Deutsche Bank
9
▼
139,314.313▲
Credit Suisse
7
0.1▲ Nomura
Rothschild
-3
BNP Paribas SA
0.4-9
-3
HSBC Holdings PLC
11108,055.9
40.3
25.4
Any European Involvement Announced (AD21)
-
▲
▲
0.3
▲7.1
2.56.2
5.3
1968,919.9
17
18
102,940.186,648.0
-0.75.6
4.5
14
50,062.3
62,316.447 7.2
15
6.5
147
+8123
0.9
-14.3%
+40-20
162
0.5
0.9
17.7
25.1
51.7
191.1
42.7
▼
▲
5.7
AdvisorSh (%)# of Deals
921.4-7
Change in
411.6
Fees
1.0
632.1
360.5
705.9▲
3.3362.1
▲2.4
350.6
20186 2.0 ▲
25
▲2.0 0.12.0
0.0
75.2
266.7
113.4
▼
▲ Macquarie Group
▼▼
▲
▼
25 24,547.9
1.9%
-5.2Credit Agricole CIB
▼ 230.3
▲
27
104,822.6125
611.0
+5
-15
https://www.thomsonone.com Visit http://dmi.thomsonreuters.com to view archives and order custom League Tables
t e
10

BNP Paribas SA Credit Suisse
Robey Warshaw LLP
0.1 +8 ▲21.9 0.61.7 ▲ 25119 5,525.1 1.80.0
8,881.9
16
6.87.0
8,877.91.5
▲
▼1.5
-0.3
3.5
151,523.5
2.9
4.8
12.810.7 ▲
-14.9
3.9 ▲-1.1
4.11.3
-3.6
-2.3
2.431
235*Ernst & Young LLP
Altium Capital Limited 25
0.32.2
1
0.1▲
▲1.8
▲ 89
0.0
0.12
22
▲ +15
▼0
0.0
4.0
▲
+3
▼ 0.0
-1018+14
0.138
2.4 ▲
5.82115▲
▲6.2
5.6
06.5
0.60.1
Macquarie Group
1333391.0 -
212512 -40.68.2
26 -+7
▲7.68.3
4020,340.7-2
Zaoui & Co25,802.7
5 Nomura
+90.730 ▲
223
▼▲7.4
14▼▲
9.911 41
31,181.2▲77,383.8 30 HSBC Holdings PLC-1 ▼
▲ 6+22
0.7
3.0+40.624▲
29.912225.1
35▲
20.4 15.5
Morgan Stanley
▼50
0.8
3+1
-0▲
▲+4
-7▲
▲0.11.354
47.241.9
20.8
▲0.833
1.5▲
6315.4
186,620.5
12.710.9
56.0338,271.5
9180,686.7
30.9
285,258.66
5 833.5202,451.4
241,988.9 40.0
3
UBS 11
LazardRobey Warshaw LLP
10
Morgan Stanley
Rothschild
76
Deutsche Bank
307,868.113
8
2
Bank of America Merrill Lynch 4
Barclays 4
9
13
57
▲
50.9
27.9
21.018.9
▲
1.4
10
6.07
Market
16
▲
242
38
87
5.3
22.3
2.1
1.2
▲1.5▼
6.2
-1.1 ▼
1.5
2.82.5
8,348.1100 0
8,928.12.517
1.4604 416 8
-
37,357.4
Qatalyst Partners
Greenhill & Co, LLC
Moelis & Co 16
26
540
15,358.9
1528,725.4
17,751.4
18
2215
20Nomura
Macquarie Group
Evercore Partners
Jefferies LLC
141314
42,509.612
Perella Weinberg Partners LP 41,282.6Citi
64,366.0
1124
Credit SuisseHSBC Holdings PLC
RBC Capital Markets 23108LionTree Advisors LLC
Industry Total
24Ernst & Young LLP
3
4 129▼
4.7
29
64
-2.1
0.0
17
16,856.8
21
2118
19
2319
28,530.4
253,345.3
123,151.3
Fees2014 Rank Share Ch.Sh (%)
Imputed Fees (US$m)Market
10
910
22
34
9
3
15
5
4
6
18
UBS
13
28
VTB Capital
7Deutsche BankBarclays
20
24
8
19Centerview Partners LLCEvercore Partners
PricewaterhouseCoopersBNP Paribas SA
23
Bank of America Merrill Lynch
2.814
219,366.2
3230
6,840.1
11,871.5 3.8
17
7,615.6
1.8
Jefferies LLC
Industry Total
16
3 976 0
10.3-0
+7
-14
88▲
▼
81.3
2.6
12.5
137.7
132.86.5
1.80.7
0.3
62.3
▼106.4
73.3
▲
▼
▼
▲▲
71.0
▲2
135.8
Change in Advisor
385.1-8
+2 1.37.0
256.7 0.4
Jan 1 – Dec 31
Share Ch.9.7
▲1.8▲3.3
0.8
0.73.5
▼4.9
0.0 ▼0.9
0.4
2.9 ▼
▲
▲
15.20.2
2.00.9
1.8
0.3
-
0.2
1.6 ▲
▲0.20.2 ▲
0.3
0.4
▲
▲ 1.5▲▲
0.959.068.7 1.7
▲
-
▲
38.2
▲0.0
20.5
14.1
-
6.1
▲
0.1
0.0▲+9
+11
+5
+2 ▲
0.9
▲0.7 ▲
0.6
▲-13
+13 ▲▼
-7 ▼
▼
+2
13
Deals
+11
0.6
1.6
0.4
▼▲
16▼▲
▼
Market
▲
▲
# of
5
Any UK Involvement Completed (AF39)
▲11.4
# of
100 0
▲
+1▲
▲▼
70.7
+8
-5
61.9
1.10.3
194.5
279.4
44.3
3.4
Full Year 2015 | Mergers & Acquisitions | Financial Advisors
+5
▲▲
+6
▲-46
0.3 +32▲
0
0.1
# of Deals per Advisor
▲+22
+9
-17+3
+60.1
+120.1
32 0.1+60.143-4
27
21.5
0.1
-0.3
103
-31.1
25▼▲
▼
5.4
4.5
10.3
23,101.6
-1.1
-
12.4
-0.4-28.1
▼
0.145
▼
0.1
0.1
▲
0.1
0.0
17.9
-15.7-16.7
20.5
3.0
2015 RankFinancial Advisor
EMEA Rankings
Market MarketMarket
108,708.3Sh (%)
▼ 0.2DealsShare Ch.Sh (%)# of DealsUS$m
Rank Value# of Deals per Advisor
Change in US$mFinancial Advisor
0.2 ▲39
# of Deals
▲5974
0.1 +9▼
14.3
1.2
7.4
5.3
7.9
19,351.518,142.3
8,650.4
4.0
-29.6
0.2▼ 62
3 449 100 0
▲
0.40.3
▲
0.2
0.40.5
0.2
-0.0
1.8
0.0
1.0
1.6
Jan 1 – Dec 31
Market
▼
▲
0.5
▲
▼
▲
12
Rank Value per Advisor (US$m)
▼-21
2.6
56,129.4
20.363,818.417.9
32.8
260
0.3
0.4
2015 Rank
41
+1
Rank Value2014 Rank
▲
25
15,034.9
1.4 ▲▲
Sh (%)
Any UK Involvement Announced (AD32)
JP Morgan1Goldman Sachs & Co
44,969.8
29RBC Capital Markets
84,459.6
34.6
56,267.7
32,192.9
26,059.0
5,704.9
12,428.2
26.923
RothschildCiti
Goldman Sachs & Co
64,269.9
2
11
102,980.8
4
1
MarketSh (%)
Rank Value per Advisor (US$m)
16
1JP Morgan
Lazard
17,673.2
314 026 2
-1.4
* tie
Credit Suisse UBS
Goodbody Stockbrokers
Market
▲
18.6%
0.2+491
6
5.0
▲
179,798.9
4.1
4.3
2
+15
3,132
▲
15.0
5.8
25.6
35,913.6
28.726.0
42,956.823.2
36,616.436,823.5
-7.1%
Share Ch.
2-7.2 50
2420.9▼
7 46.3
Industry % Change from Last Quarter-17.9%
Rank Value per Advisor (US$m)
Any French Involvement Completed (AF40)
2014 Rank Sh (%)
10,839.7
1
21*
0.1
0.11.2
Goldman Sachs & Co
Goodbody Stockbrokers 21*
2.24371
3,625.1
82*33
148
1312
1117
0.411▼
16
Davy201918
Barclays
6
15
Citi
Societe Generale8
14
Deutsche Bank
Credit Agricole CIB19
▼JP Morgan
-8
Morgan Stanley
Centerview Partners LLC
Bank of America Merrill Lynch
Itau Unibanco
14
▲
100.0604,416.8
2014 Rank
Industry % Change from Last Quarter
2
Industry Total
Financial Advisor
-28.8%
0.4+2
Morgan StanleyBNP Paribas SA
38.6
-1.0%
Rank Value per Advisor (US$m)
3
Share Ch.
54,094.4
Rank Value
Any French Involvement Announced (AD33)
▼1
▲
Bank of America Merrill Lynch
Market
323
▲▲ 18
22
▼
22
15
3 118
▼
-17.9%
9
17.7Deals
Industry % Change from Same Period Last Year 58.9%
5.9
4,251.8
7,369.64.1-
▲▲
Industry % Change from Last Quarter
▲Zaoui & Co
▲
-▼
+3 ▲
-2
Market
42
59
0.0
# of
4,129
-13.3-9.9
▲-16.7 ▼
Industry % Change from Same Period Last Year
Industry Total
43.1
-41.5%
84,281.1Sh (%)
46.9
▼
83,244.2
Market
45.9
US$m
-15.4
14.8
7.0
13
-3.7 17▲
2▼
16
▲
625
23 2.7
1.5
.3 0.0
▲
▲0.20.2-
0.50.4
0.4
▲0.4
0.5
▼0.00.1
0.20.4
▲▲
▲
▼
1.3
0.8
▲3.5
▲
1.3
1.5
▼▲0.6
3.7 ▼0.5
▲0.12.5
▼
▲
▲1.82.3
0.81.8
▲
3,976.0
Change in
-88
1.60.8
-12
1.0150.8 7.3127.3
▲▲
▲+22
273.1970.9
+1
7.913.6
▲23.1 ▲
+13
+3
▲ 0.9-6
+1
28
-15▼1140
▲37▲
0.50.1
-3.7
6.70.5
-2.2 ▼
16
17▲
7.012,510.6
4.1
20.017
6.912,415.96.0
7,369.6
24
Industry % Change from Same Period Last Year
▼-2-11
Santander
▼
0▼▲+4
-1
1.2
+31
# of Deals
1.7 ▼
3.50.6
MarketSh (%)
0.4
0.6
▼▼
0.5
▼▼▲
-15
15
▲
▼▼
17
1
12▼48
242
1
11.0
2.1
▼
4.5
▲
8
5
▲▲
35▲
▲
▼
24,036.415
17,902.5
925,195.1
▲
1.3
6
21
47,952.58
Credit Agricole CIBSumitomo Mitsui Finl Grp Inc
12
37,778.0
17
10
Barclays
8
10Deutsche Bank
HSBC Holdings PLC 15
Industry % Change from Same Period Last Year
Societe Generale
JP Morgan
11
18
Zaoui & Co
164,071.3
▼
Industry Total
23
25
Duff & Phelps
CallistoDC Advisory
2.4Canaccord Genuity
16Natixis
4.5
76
24
224739
19*
UBS
7,369.63,943.3
--19*Davy
46
11Sycomore Corporate Finance SAS
16,852.0
-20.07
21
21614-
174.9
22-
0.6
Lazard
13
10.3 -37.0
1421,211.018,065.2
4
0.7 +5-8
▼7
-3 HSBC Holdings PLC0.4 ▼
28.7
Rothschild
65,901.8 36.7
9 3
5
51,633.212
Lazard
-2Financial Advisor
# of Deals per Advisor
10.1Credit Suisse
4▲76,588.32
Deals Fees
100.0
12.0%
AdvisorImputed Fees (US$m)
Market
-15.8%
-13.5
2.7▼
BNP Paribas SA
5
2015 Rank
628.8
32.0
29.2
1
50,065.5Rothschild
47
48,735.44
15.428,569.4
Citi
33.052,439.5
30.5
12
5 29.7
Goldman Sachs & Co
10.9
1.37,369.6
47,247.423.017.4
-2.8
0.8
-22.4-8.5
14.722,167.1
1.8
3,583.2
-14.3
11.0
7.57,959.4
-9.1
4.5
▼
1.73,305.8 2.02.2
13.5
2.0
1.4
12.9
12,290.1
5 0.1▲
44+1
-1.4
-17.2
1.0
+26
4.5
0.1
2.4Canaccord Genuity
▲
▼ ▲+15
2.0
28Callisto
3
▼
3,413▲
100.0
-7.9%
▲
16.9%
* tie▲
3,219.6
Industry Total
2.02,932.3
▲
▼ ▼Industry % Change from Last Quarter -4.4%▲
-4
Sycomore Corporate Finance SAS
-1
19.3%
24
-50.2%
▲
100.0
130.7%
Rank Value # of
▼-1.5%
3,449
▼
Jan 1 – Dec 31
Market
▲
0.41.3
1.2
40 1.3
0.4
21.2
▼5
1620.5
22.2▲
-7.920.4
Natixis0 9
0.1+10.0
-
0.00.2
1.40.5
0
+1+3
+494
▼
100.0
-25.7%
9.6▲0.0 0.3
0.1
10,701.74.16.0
-▲▲
4,900.8
0.0
0.9▲
39.1+1
+1 ▲
1.0
0.2
-
▲
▼
▼
▲
16.7
.0▲
7.8
5.13.5
▼
▲
2.173.0▲
▲2.1
0.3
10.044.2
0.3
2.61.5
2,060.8
1.9
0.0
▼
1.251.3
75.6
▲44.339.4
2.21.9
24.2
▼▲
▼31.0
▲
▲
119.6
103.354.2
▼▼
+4▼
5.8224.7
0.4
2.4
▼-3
Sh (%)
5.4
6.2
100.0
▼
▲
# of Deals per Advisor
-5 110.75.0
▲2.4
10.9▲
▼
Share Ch.# of Deals1 13
2015 Rank
115.2%
US$m
Jan 1 – Dec 31
-41
63,278.6 ▼Sh (%)
Change in
-3+2
7.8%▲▼▲
+5+29
▲
-0
0.2▲
-2
1.4
50.2
1115
0.0
23.9
+2
0.0
0.7-2
+1
21
440.5
+1
▲
▼
0.5
3 10
51,561.1
39,919.0
82,506.6
42.6
▼
10 13
38,088.1
77,447.7
41,748.0
46,698.6
314,026.2
Market
-2
Visit http://dmi.thomsonreuters.com to view archives and order custom League Tables https://www.thomsonone.com 11

Bank of America Merrill Lynch Societe Generale
▲0 1 3 ▼ 4 9 0 6 0 141 882 8 1 2 0 8 ▲ 133 ▼-2
M&A International 25*1,198.9 1.01.5 2▲
0.99-6
0.7
3 0.3
0.1
BNP Paribas SA
421
▼
-22.4
2.7-17.0
▼1.7
▼
▼
N+1
2 ▼▼
-6
0.2-117 0.6
21-0.3
2823
2,162.68 2.82,791.720
0.4
17
-11.6 ▼
5.4
293.9
-
4.619
▼4.7
+21211
4,060.84,526.0 1.2
▲3,881.2
▼
▲
44
2.1▲
5.5▼
16.81.6
5.854
▼
+4
▼ 0 -14.2
-4 13.2
15.57.9
6.3
15
1.01.94.8
23.5
2.2
2.2
18.2
38.5
▲
▲+111.2
11.4-44
0.8
1.50.4
1.4▼
6▼
22Mediobanca
16
BNP Paribas SA
5.6
27
34
129
5.4
3,304.8 1.2
43
-0.4-1.0
4.1-17.7 ▼
-9.9
-16.117.4
▲
-10.717.7
-6.2
▼
US$m
+2-5
0.5-4
5.7
7.8
75
2,218.0
5,624.6
-3
▼
95
▲
▼
2,950.12,747.9
3.8
-13.6
0.5
13 1.3
-5
▼
▲
▲
-12.3
-22.3
0.4
▼
0.4
▼
115
▼
▼
3.83.526
12.29.5
BBVA
3,357.7
2,486.2
18
▼
11Santander
0.1
Bank of America Merrill Lynch
13
+4
8
10
-
▲
Rank Value per Advisor (US$m)
29.7 1-5Share Ch.
-10
Any Spanish Involvement Completed (AF41)
Goldman Sachs & Co-1.42
Rank Value
25,061.9
Sh (%)
23.914,324.9
34.717,269.6
8
6Deutsche Bank
2015 Rank
53
1
7
Nomura
1.7
14 1.2
Lazard 23
2
4
6
5
20
-13.1▼13.9
-23.3
11
-31.2
-24.3
1467
▲
PricewaterhouseCoopers19
1
10.4
6 0.5
-0.4
29-34.4
▲
-15.7-0.1
Citi
▼▼
▲
5.7
13.3▼
44
5.3
5
6,127.76,018.9 7.8
15
9.3
▼
-4.4
-1.9
232,800.0 3.6
▲
-17.2
204,083.5
193.6
3.718
Mediobanca 22 2,106.6
BBVARBC Capital MarketsErnst & Young LLP
Industry Total
2.6KPMG1,340.72,026.8
Banca IMI (Intesa Sanpaolo)100 077 611 8
2425
Santander
4
+5
7▲
▼
9 16
JP Morgan
+13
Morgan Stanley
▲
Jan 1 – Dec 31
10.2
Market
▲
+2
2014 Rank
16,505.317
2
1.1
3.3
15,709.36
141▲
▼
▲21.3
113
11
0.3
373.3
7
74
1
Barclays
0.4
20
▲
-18 ▼
10.0
0.1 0
-4
▼ 21
-140.2
56
▼▼
-4-3
Morgan Stanley
12,446.6
8,105.9
10Deloitte
-3.4
-
Goldman Sachs & Co
-4
6.6
1.0
1 126
8 10,901.4
15.8
57 15,381.2
12,279.612,122.0
14.1
16.0
3HSBC Holdings PLC
23,080.6
2015 Rank
Lazard
9131
Rank ValueFinancial Advisor
Any Spanish Involvement Announced (AD34)
US$mMarket
7Sh (%) Deals
UBS
Rank Value per Advisor (US$m)# of Deals per AdvisorMarket
20.3
19.719.813
20.2 ▲13.9Moelis & Co
6
4
7Rothschild
27
5182
Macquarie Group14
JP Morgan
Citi 910111213
PricewaterhouseCoopers
0.6
Credit Suisse3Deutsche Bank
Ernst & Young LLP
7
2,893.3
4.9
0.412
512
163,830.0
3,348.3 ▼-7.7
4.7
▼
▼Rothschild
Societe Generale 17 6Nomura
315
4.3▼3,655.3 Evercore Partners
+9-9
15▲
Deloitte
▼14
Macquarie Group
# of Deals Financial Advisor
0.5
UBS 12▼
+14
01.2
-
-2
-3
10
# of
12,763.0
0.610.8
Change in Market
-54
10
0.47,230.7
7.9
0.9-74
▼▼
▼
▲
▼
10,754.80
6.01.2
15.6
▲
Sh (%)▼
2014 Rank
31,105.2
# of Deals per Advisor
Share Ch.43.1
Market
▼6
# of
-0.6
▲
▼ 9▼ 3
Deals
15.7
▼
19.9
6,823.8
12,559.0
▲9,123.4
▼
13,500.7 18.7
22
9.5 -10.7
3
8,814.3
4,610.9 6.4
12.7
-0.7
0.9
-2
38
5.3
0.9 ▼
3.1 ▼-1
▼-6
6,876.0
14.421.9
-1
5.2
22.9
7.99.6
▼
▲▲
+1 ▲
9.90.5 ▼
2.7
▼1.00.2
▼
▲0.6
0.2 ▲
▲0.50.3
1.8
0.00.7 -
2.9
▲
0.4▼0.7
▼
▼0.4
1.6
5.9
10.6
4.9
26.0 3.247.8
21.40.1
FeesMarket
Jan 1 – Dec 31
EMEA Rankings
2.12.8
1.5
1.2
▲
▲
1.8
▼
39.8▲
2.6
▼
0.1
0.2
5.040.5
1.7
▲
▼
▼
-21.10.9
12 ▼▲▼
0.3
11
0
▼-1
14-8
0.6 ▲+10.61.5
MarketSh (%)
▲▼
86.02.2
▲3.4▼
2.366.2
Advisor
- 8.2 2.8
Imputed Fees (US$m)
# of Deals▲
MarketSh (%)
0.3Share Ch.
Change in
▼
Full Year 2015 | Mergers & Acquisitions | Financial Advisors
1913
0.2
1.2 0.2 ▲0.97.3
1.61.2 1.2 ▲
77 7.6 +14 0.4 +21
2.9 -5.6 ▼2.7 -9.8 ▼
KPMGHSBC Holdings PLCLXG Capital -
2,092.11,922.0
882.8
232425*
Puhl GmbH & Co KG UBS
Ernst & Young LLP
Industry % Change from Same Period Last Year
▲0.1 -3 ▼ 4.9 0.6 0.141 882.8 1.2 0.8 ▲ 1M&A International 25
-3
▼
0.30.5
3.3
0.9
0.1
11.20.86.3
# of Deals per Advisor
-28.7%
28
▼
Sh (%)Market
1,010
+1
0.9
1.61729
0.1
0.1
916 -7
2
0.51
0.4
1.0
220.9
8
100.0
▲
▼
▼
31.6
Any German Involvement Announced (AD35)
▼
61
5
▼-25.5%-4.6%
4
3.0▼7 0.4
0.20.3
24 -19+4
▼-0.2
2.618
▼0.4
▲
▼▲
37
12,563.3
3,872.4
▼3,983.3 2.7
-22.0
▲
1.4▼
▲1.5
▲1.5
2.22.6
2.2▲
3.311
94.1
6
92
-1.53.0
-7.0
▲3.6
5.24.4
5,327.73.3
273.8
62019
Evercore Partners
UniCredit
6,180.4
29
23
▲ 19
Mizuho Financial Group 100
10.1
+10.1
8
6▲
12
▲
-20.0
▲
▼
5.917.227,787.5
22.9
44,024.9
▲
1.5
▼
▼38,638.8
-6.510
▲18.6
25,740.8
25.834Morgan Stanley
8-11.1
-7.5
34,328.0
Sh (%)2015 Rank
37.5
Market
Goldman Sachs & CoJP Morgan
29.4
Financial Advisor
-
4,930.7
2014 Rank
▼-10.3
1.2
Change in # of DealsShare Ch.
0.5
Market
-6
-7
▼
▼
▼▼
17
1.5
-
-
-2
123.2
68.3▼
+2 23.9▲
-11-3
0.9
0.2
0
21.6
-8
-+1
0▼
▼1.4
6.3
22.343.5
0.2
14.512.9 0.8
0.1
0.7
30.6
1.5
1.9
28.8
8.7
100.7
59.3
146.5
-89
1.0
▼ 1.83.7
1.4
23.3
2.7
1.516.6
+60
-9
0.2
0.80.7
▲
3.0
11.0
▲
▲
▼
-22.2%
3
Industry Total
-42.6%
2015 Rank
MarketUS$m
2 23.5
100.077,611.8
Rank Value
▼Industry % Change from Last Quarter
42,969.61
Financial AdvisorJP Morgan
Sh (%)43,701.9
2014 Rank
Morgan Stanley23.6Goldman Sachs & Co
2
Rank Value per Advisor (US$m)
Industry % Change from Same Period Last Year
4
2.5Citi
1Deutsche Bank
5
31.132,616.6
43
▼513.2 4.7
26,827.4
-13.217.9
18,317.2
-1.719.4
11
▼Lazard
-7 4
67
7
Bank of America Merrill Lynch▲
16 -437
▼ 0.7+2
▲
1.11,852
▼
82.9Jefferies LLC
2.2
1.33,102.1
51 1.9
▲
▲▲
11.2
BNP Paribas SA
18,874.5
▼
8.07.010,431.4
Change in
-13 21 1
-3-10
▼▼
Deutsche Bank
Citi
-0.8
11.9
5,608.3
8.4
11.6
6,598.0
235
0.6
17,839.617,292.7
18
▼
-3.8
Market
▼-4# of DealsDeals
-11.1 ▼0.81.4
0.90.4
PricewaterhouseCoopers
17,727.1
7.9 ▲2.3
▼
0.9
11
Industry % Change from Last Quarter
1299
8,141.312.8
13
15Lazard 11 -9.6
3.1-1.7
7.9
2.9
10
Bank of America Merrill Lynch
3.6
15.97
UBS 1298
4.3
Rothschild
Credit Suisse
▲669 24,827.0
12.6▼
▲
5
1332,498.9
▲
5.98
Rothschild
▲
0.40.4 ▲
1.5
0.50.26.60.1
▼+1 ▲
7.8UniCreditMizuho Financial Group
1432
▲7.05.2
3.6
0.12.9
Evercore PartnersChina International Capital Co
-2
ING 174050 4,238.1
4,324.0
3.6
ABN AMRO Bank 18 4,065.0
Ernst & Young LLP
Deloitte 1615Nomura
36
10
1920
2.3
▲
-9.625
▼
4.73,193.8
▼
3,155.5
2.9
▲
-1123025
2,389.024
2.2
1.6101.0138,367.3
-18.8%
2828Mediobanca
Barclays
▼
Centerview Partners LLC 2,599.32322
Centerview Partners LLC3,102.1
Altium Capital Limited 21
2,229.6Industry Total
-9.6
-9.65,011.1
64
5,005.6
7
3,961.7-
2.5
-27.3%
2.9
31
3.1
3.6
-13.2
25,521.7
▼▼
▼
4,942.7
5,900.6
▼
18.4
22,014.1
-11.7
Jan 1 – Dec 31
-13
▼
1331
-4.7%
-56
5
0.1
61
0.2
0.4
2
0.6
# of
11.9 9
Sh (%)
▲
MarketShare Ch.
17
-16.3 ▼
2,262
3
21
▼-4.7%
2
3
0.43.6
Industry % Change from Last Quarter ▼▼-38.2%
1.7▲2.9
61.5%Industry % Change from Same Period Last Year -4.9%
7.1%
100.0
11.7
1,602.8
13.5+12
-2
1.0
▲0.60.1
0.7▼
▲
0.3
▲
▼0.1
0.5
17.5
0.5 ▲
▲-0.0▲
▼
0.2
1.4
▼
▼
▲
▼
0.2 31 2.1Macquarie Group
149,683.225024
-20.5%-1.8%
92 3,328.63,281.9▲ ▲
-1123,202.1
26-5
+12
Industry Total
+5
▼-6▲
▲
Jefferies LLC
+1
-
0.2 +2
▲
▼▲
+5
+2
+1
13▲
-3
5
0.212
▲0-5
▲▲
60.5
# of Deals per Advisor
▼
15
11-
910
Barclays
12Guggenheim Securities LLCPuhl GmbH & Co KG
17
▼
21
Credit Suisse
1.6370.5
0.6
▼
1,126
▼-4.3% ▼
-45 810.9
-10.2%
▲
140.01.1
▼-
▼0.42.4
107.3
0.1 ▲
▼▼0.1
1.7
-9
▼
2.2
0
-19.0%
FeesAdvisor Market
9.1
2.9Sh (%)
Market
▼▲
▼
4.3
7.7
▼
0.6
100.0
▲
▲4.3
Imputed Fees (US$m)
6.7Share Ch.
-25.0%
100.0
Industry % Change from Last Quarter
Jan 1 – Dec 31
72,138.9
▼-23.4%Industry % Change from Same Period Last Year
Industry Total
▼
# ofDeals
Any German Involvement Completed (AF42)
US$m
1854,097.8
Rank ValueRank Value per Advisor (US$m)
-▼
▲
0.056,115.6
36.1
16 0.7
0.342-82.7
+1
▼
39
Altium Capital Limited
9
17
▲Nomura
▲ 14
0.1
-
5,005.6
▲0
16
-40.0
16,729.2
7,730.2Kempen and Co NVZaoui & Co
5
2122
13
8
80
* tie
Visit http://dmi.thomsonreuters.com to view archives and order custom League Tables https://www.thomsonone.com 12
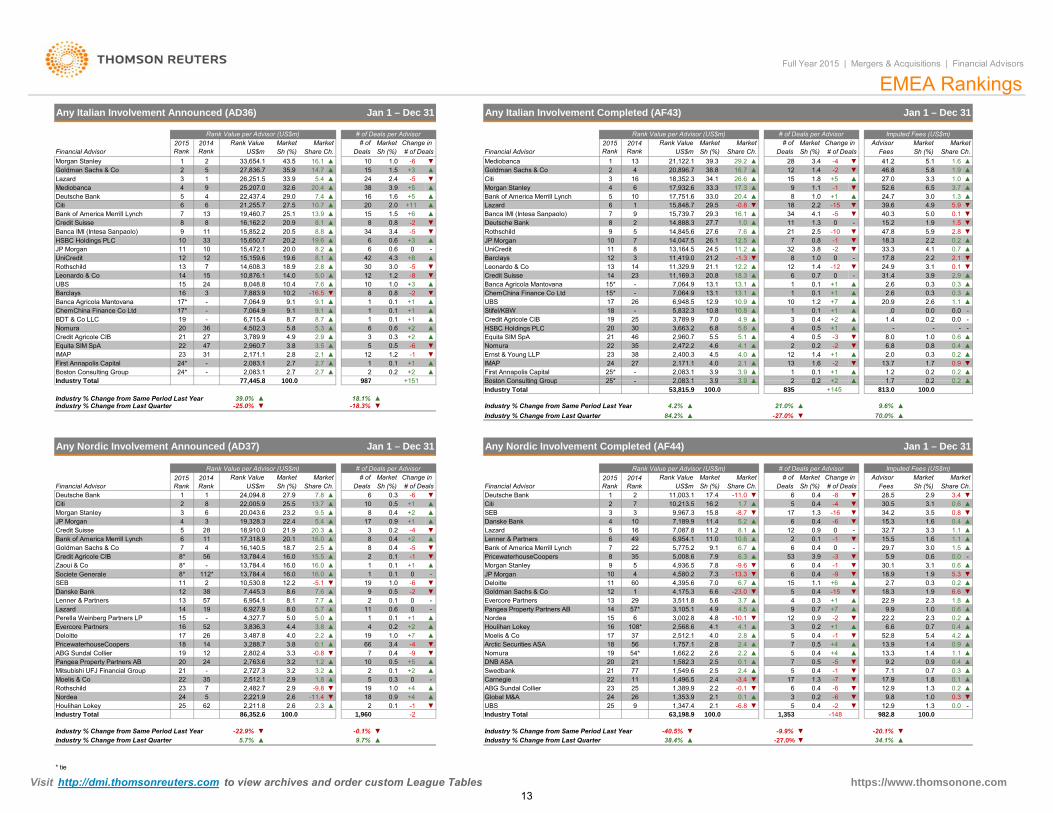
HSBC Holdings PLC JP Morgan
HSBC Holdings PLC
Boston Consulting Group 25* 2 083 1 3 9 3 9 ▲ 2 0 2 +2 ▲ 1 7 0 2 0 2 ▲
-21.4
1▼
+1▼▲
▲▲0.2
0.22.0
13.70.3
0.20.1-2
+14.0
4.02.1
▲4.1
3.9
▲▲
9
Banca IMI (Intesa Sanpaolo)8▼
UniCredit
27.5
▲
0.620.5
▼
▲
▼
+2+1
-1
▲▲
+3
▲
Change in
Bank of America Merrill LynchMorgan Stanley
Credit Suisse
3
15,848.7
EMEA Rankings
▲7.6▲14,888.3
15,739.7
35.9
32.6
14.716.1
▲
7
19.6 8.1-5
3.434
42 ▲
RothschildDeutsche Bank
▲▼
-21.5
0+3
4.9
21.1
Ernst & Young LLP
-
14
26
13Leonardo & Co
224.5
Banca Agricola MantovanaChemChina Finance Co Ltd 15*
11,329.911,419.0
UBS
14
3
23
12
Citi
18.313.1
10.917
7
5.60.5
▲-3
▲10
1.6
21213
+2+1
▲0.1
6
4.6
3.9
7,064.9▲
3,663.2
2,472.2
▲
1.2
0.5
▲+7+10.1
▲▲
11,169.3
6,948.5
15* ▲ 11
7,064.9
6
0 -▼
20.812
0.7
13,164.5-Barclays
29.0 7.4 1.6▲
0.64.3
2.0
0.88.8
▲
20.2 19.6
20.9▲
815
8.1
611
-5
▲+54
▲6
10-5
+6
Market
9
MarketDeals
3.4
# of
18,352.3
# of
34.1
8
US$m Sh (%)Market
0.7 ▲
47.80.2
▼
▼
2.2 2.1
18.32.8
Sh (%)
Imputed Fees (US$m)
# of DealsAdvisor
3.92.6
31.4
1.4
1.0
20.9
▲0.4
▲0.91.7
▲
0.86.8
-0.2
▲
0.00.0
-0.0▲
▼
2.6
2.2
6.5▲
24.7
15.2
▲2.9
+1
-12
1.1
-
▼
1.2
.0
--
-
▲4.1
▲0.3
0.2
▲
0.3
▼
2.6
0.6
0.3
▼
0.13.1
8.0
24.9
0.3
5.1
▼
17.833.3
+1
27.0
▼1.3
-1
▲1.6Deals
0.4
4
4.1
1.4
-15
2.5
1.4
Jan 1 – Dec 31
1
5
13.1
1
▼27,836.7
21,122.1Financial Advisor
2015 Rank
Full Year 2015 | Mergers & Acquisitions | Financial Advisors
▲
8.2
5.4
20
33.9
▲
Jan 1 – Dec 31
12
2 0.2
19,460.7
5
▲▲▲
20.0
22,437.4
136Citi
9Deutsche Bank
21,255.7
4
US$m
3 26,251.5LazardGoldman Sachs & Co
Financial Advisor
5Morgan Stanley
Any Italian Involvement Announced (AD36)
33,654.1
Rank Value per Advisor (US$m)Market2015
RankMarket2014
Rank Sh (%)43.5 ▲2
15,852.2Credit Suisse
Mediobanca
2
Rank Value
6
12
7
UniCredit
16,162.2
3310
8 8
15,472.1
Bank of America Merrill Lynch
13
Banca IMI (Intesa Sanpaolo)
12
14Rothschild
JP Morgan
9 111011
7,883.9168,048.815 24
15 10,876.1
15,159.67
Banca Agricola Mantovana 7,064.917*ChemChina Finance Co Ltd 7,064.917*
-
Leonardo & Co10.414.0
9.1
3,789.9 4.9
- 9.1Barclays
19NomuraCredit Agricole CIB
47IMAP
3620
2223
Equita SIM SpA
2.7
8.7
1.2
18.9
10.29.1
14,608.3
3
6,715.4-
Industry Total
0.12.72.7
24* ▲+2
3.8
5.0
2.7-Boston Consulting Group-24*First Annapolis Capital +1
25,207.0
21 27
BDT & Co LLC
31
2.8
25.1
4,502.3
2,960.7
1
15,650.7
7.6-16.5
13.910.7
▲▲
164
▼ 8
▲
▲
▲
0.1
▲
63
▲0.6
+2-6
1
0.30.55
▲
▼▲ ▲
27
2,960.7Equita SIM SpA
2,171.1
▲204630
2,400.3
6.85.1
23 3835
25*
21
-24
2,083.1
Credit Agricole CIB
IMAPFirst Annapolis Capital
5.5
25
Nomura
3,789.91Stifel/KBW 5,832.318 - 10.8
7.019
217
4
987
▲
12.9
12.2
▲
-
▲11.226.1
16.1
▲
14,047.5
10.8
14,845.627.7
3
32
27.6
21.224.5
▲
13.113.1
▼
2.2
+1
1.8
01.0
8
1.3
3.8
0.1
▼1.9
-5
1.93.3 1.05.8▼
3.7
1.50.1
39.65.04.93.0
10
-▼
8-1.3
12.5 ▲
0-10
▲
▼40.3
5.9
▲
▲9.1
+8
5.38.7
+1
+15177 445 8 100 0
5.8
2,083.12,083.1
2.82,171.1 2.13.52.9
▲
▲▲
▲
3.030
1
12
0.11
▼
-8
0.81.0
▼
0.1 +1-2
1.2▲
▼5.933.0
2
+1117,751.6
▲ 29.5Lazard
11
▲▲
▲
▼
46.8
Share Ch.
# of Deals per Advisor
52.6
29.3
▼6
▲
16
110
9
17,932.6
▼
MarketMarket
-2
-2
Fees41.2-4
Any Italian Involvement Completed (AF43)
1.1
-
29.2 ▲38.8
+515
-1▼▼0.8
▲20.4
1.0
181.0
▲26.6
34-0.8
16.7239.3
Goldman Sachs & Co1 28
12
Share Ch.Sh (%)
5+5
▲Mediobanca
▲17.3
4 20,896.7▲
Sh (%)
33.3
Rank Value
-6
3.9▲
Change in Share Ch.
20.4
10
2.4
1.0
▲
# of Deals
+3152438
1.5
Market# of Deals per Advisor Rank Value per Advisor (US$m)
UBS
2014 Rank
13
Societe Generale JP Morgan
Boston Consulting Group 25 - 2,083.1 3.9 3.9 ▲ 2 0.2 +2 ▲ 1.7 0.2 0.2 ▲
▲
▼
-0.1%
16
16.2
8.1
Sh (%)
100.0
# of
835
▲
3.8
7,189.9
11
2
4
Danske Bank
▲
-5▲
1
3.2
▲
-0.8
▲▲
-5.116.016.0
3.8
▼6.6
70.0%
4
11.4
▲
-8.730.5▼
▼
▼
▲
▼
1.8
3.1
1.6
-4
4.0 2.2
5.0
22,005.920,043.6
3,487.8
4,327.7
2,727.3
Zaoui & Co
46
Credit Agricole CIB
Credit Suisse 28
16,140.58*
5
3
1718
522614
4.4
1,960
Industry % Change from Same Period Last Year
Lazard
Danske Bank
2,763.6-
19
3,836.3
19-
14
SEB
16
12
2
11
3813
8*
Lenner & Partners
15
Deutsche Bank
7Bank of America Merrill Lynch
Morgan StanleyJP Morgan 3
Goldman Sachs & Co
Citi1 1
8
13,784.456
18,910.0
18.7
7,445.3
-
19,328.323.2
10,530.8
6,927.9
8.66,954.1
ABG Sundal Collier
11
3,288.72,802.4
57
2
Evercore Partners
12
21
23
Perella Weinberg Partners LP
PricewaterhouseCoopers
357
22
Deloitte
Industry Total
Industry % Change from Last Quarter
Mitsubishi UFJ Financial Group20 24
RothschildMoelis & Co
Nordea
Pangea Property Partners AB
524
-22.9%
Houlihan Lokey
▼
25 2,211.886,352.6
▲
0.1▲ 2
9.7%▼
2,512.1
2,221.91.0 +4
51918
2,482.7
-2-1
-11.4
▲
5▲9,967.3 17
53,815.9
15.8
3.428.5
Advisor
Jan 1 – Dec 31
Market
-
▲
Share Ch.▼
0.6
▲
▼0.80.4
1.5
0.7
▲
6.61.8
1.9
0.0
1.90.6
0.6
▼
▲
▲0.61.0
▲1.4
0.4
0.91.1
0.2
34.1%
0.1
1.4
0.9
▲
0.3▲
▲
▲
0.0
▲
Sh (%)
0.7
-27.0%9.6%
# of Deals
17.9
2.9
▲
100.0
Imputed Fees (US$m)
▲
# of Deals per Advisor
+145
-16
2
813.0
Market
▼17.4
4.2%Industry % Change from Same Period Last Year
Deutsche Bank 110,213.5
60
Industry % Change from Last Quarter
Financial Advisor
84.2%
Bank of America Merrill Lynch
SEB 37
Rank Value
-8
53
▼
Sh (%) # of Deals2
12
▲
11.26,954.1
4,395.64,580.24,936.55,008.6
6
▲
0.4
0.10
0.4-9-1
3.9 -3
-1 ▼-
1.6 ▲3.3
1.13.0
▲1.1
30.1
0.9
3.5-60
15.334.2
▼29.7
-
22.918.3 ▼
3.1
2.718.9
▲
2.3
0.25.3
0.3
▲5.2
-13.3
6▲ 5.9
32.715.5
▲
156.7
▲
▼
▲
▲+1-150.4+6
▼1.3-2 12.9
100.0982.8
0.3-
1.012.9
▼
9.81.3
2
-9.81.8
2.6
3.2
0.1
▲
▲
0.92.9
3.2
2.3
▲
▼
1.2
1.0
2.9
3.47
5.0
PricewaterhouseCoopers
20.4
Citi
▲
0.5
+1
+1
▼
11,003.1Sh (%)
10
▲
80.4
0.50.3
▲
3.3
20.1
9
▲▼
▲
▼19
1
▲
▼ 0.4
19 1.066
16.0
▲5.78.0
▲7.7 ▲7.6
8.1
12.28* 13,784.4112*
16.0
17,318.94
13,784.4 16.0
621.9
# of Deals per Advisor
▲
6
2.5
▲
16.0 ▲
▲-4
▲9.5
15.5
13.7
20.3 317
Deals
22.4
25.5
Sh (%)7.8 ▲
5.4
27.9Share Ch.
2015 Rank
Any Nordic Involvement Announced (AD37)
US$mRank Value2014
RankFinancial Advisor24,094.8
Market
Jan 1 – Dec 31
0.4
-2
+2
▼
Rank Value per Advisor (US$m)
0.3
▲0.1
62
-20.1%
100.0
7711
510
▲
2.6
5.7%
▲5
8
1
0.20.9
8
-60
-1
DNB ASA
▲
0.5▲
0.1
211
0.1
0.10.1
3
7,087.86
4
5,775.2
105
3,511.8
35
49227
7.0
8
7.37.8
9.1
5617
57*
37
1429
16 108*15
20
9
13
+5
10
+7
▼
18▼
+2
5
0.1
Deloitte-
+2
▲
00.6
LazardLenner & Partners
Evercore Partners
Moelis & Co
-0 -
+1
Pangea Property Partners AB+1
▲
Morgan Stanley
Industry % Change from Same Period Last Year
Industry Total
Industry % Change from Last Quarter
Market
▼
▼▲
-6▲
FeesDealsChange in 2015
RankMarket
Industry Total
MarketMarket
▼
Share Ch.
Rank Value per Advisor (US$m)
Any Nordic Involvement Completed (AF44)
21.0%
US$m2014 Rank
▲▲
987
Change in
+151
39.0% 18.1%
Market
77,445.8 100.0
-18.3%-25.0%
# of
▲▼
1,582.3
2.8
1,549.6
9
1,757.1
212.5
2625
1.7
0.4
▼0.40.4
▲1.3
6
▼6
2,512.14.1
+4
▲-2
-23.0 ▼▲
4.5 ▲
2.4 7
3
0.5 ▲
0.9▲
▼
▼0.44.1 +1
5
▲+70.7-10.1
4.0 ▲2.8
9.9
▲4.26.6 0.4
5.4
22.2 0.2
52.8
2.3
2.6
Houlihan Lokey 0.23,002.86
19 54* 1,662.2 2.2
2,568.6
13.35▲
0.4 +4▲ ▲13.9
-5▲ 0.4 7.1▲ 7 9.2
-1▼▼
-3.41,496.5 2.42.4
31,353.9 2.1-0.1 61,389.9
▼
2.5
▼▼
0.5
▼
2.2
0.40.1
0.1
▼-7
-6-6
▼1.30.40.2 ▼
-148
-9.9%-27.0%
2.1 -6.8
-40.5%▲
1,353100.0
▼▼
38.4%
▼
-9
0+2
+4
-4▼
Global M&AUBS
Arctic Securities ASA
Industry Total
17
25
Industry % Change from Same Period Last YearIndustry % Change from Last Quarter
ABG Sundal Collier
Nomura
222324
1,347.463,198.9
4,175.3
7.9
Nordea3,105.1
12 1
0.2
▲-
Swedbank 21Carnegie
Goldman Sachs & Co
11.0
6.36.7
3.7
-11.0
▼
▼-9.6 ▼
10.60.4
1.1
4.8
6
0.354
▲
4.95.6
▼ 129
-1
Visit http://dmi.thomsonreuters.com to view archives and order custom League Tables* tie
https://www.thomsonone.com 13

Rothschild Barclays▲
20▲
# of
3728
30
93.1115.7
7,057.8
148,206.4
2.63.0
2.41.9
-7
UBS
0.91.5
+9
▲2
▼0.1
1.8
7.75.0
▲
▼
1.3
21.2 8.5
32
▼ 15
5.0
2.6
3.6 -2.23.9
1.4
4.4
-16.0
35.6
14.5
2.0
21,006.3
8,952.3
18,854.9
12,283.7
32,078.1
27
UBS
2.49,838.6
43
0.8
-13.0
2625
-
37
22
1819
162.2
1818,175.9
30
12
PJT Partners LP
ING
Centerview Partners LLC
10,880.8
15,037.1
Zaoui & Co
16
ABN AMRO Bank
24
Guggenheim Securities LLC
HSBC Holdings PLC
Industry Total
23 14
20
Societe Generale
2122
Rabobank NVMediobanca
Credit Suisse
8
17
Jefferies LLC
15
11 9
13 --18.7
60,289.1Perella Weinberg Partners LP
14
88,435.311
12 7
Citi 4.5
45.9
+3
BNP Paribas SA9
151,680.0
Barclays
Lazard
+4
2.0 +80Deutsche Bank
10
6 2
18.4 1533
5
27-
Bank of America Merrill Lynch283,512.7
Morgan Stanley
Robey Warshaw LLP
4273,013.5
Goldman Sachs & Co
6
35
2015 Rank
285,752.0
8 10 151,253.1
201,794.9
252,985.03
41
1
-7.6
2014 Rank
18.136.3
13
1.6+101.6
229,336.830
▲ 1.7
Change in
+5+17
Market
▲
+11+3
▲
▲
+2▼-7
▲ Bank of America Merrill Lynch6
Credit Suisse 30,623.89
4Goldman Sachs & Co
Lazard
11
4
30,940.3
21,591.77
5
8
▲
BNP Paribas SA
▲
Rothschild▲
12
10
3
2
▲ 1.047.0 0.1
0.0
Jan 1 – Dec 31
3.4
Full Year 2015 | Mergers & Acquisitions | Financial Advisors
0.3 ▲
15.51.3
6.0
Share Ch.
0.9▲
▼▼
▲
+6
▼
13.7 0.7▲
-2
10.7
1.6
0.6
2.4▲
0.6-
▼
0.3
▲
31.9
42.4
0.5
▲3.8
0.7
0.8▼▼
▲1.2
0.8
▲
▲
0.4
▲
-0.7
26.1
4.8
Sh (%)4.8
AdvisorFees
Market
93.5
3 43,836.21.625.2
21-15.242,359.4
40,692.0
1.4
-2.2
14
▲18.4
0.5
▲
▼ ▲
▲
0.2
5.7
1210
6.2
-1
1608,629.9
0.1 10,855.1
▲▲
▼
0.13.4
0.1
1.4
0.0
▼
▲
65.7▲
100.9 5.2
▼
▲
0.2
72.8
0.1
2▲
▲0.1
1.70.2▼
27.3
▲ 41.4
-4+10.1 1.3
▼▲
0.8
9.42.10.3
2.2
0.3▲
-7,208.3 4.38,362.5▼
5,462.2
1.6▲
41▲
2
▼
▲
-10.0▼
91.4 ▼5,912.0
▼1.7
6,002.0 11
1.32.1
416 652 3
5,537.510
▲1 842
1.3 0.9
5 -5+20.1
15
-3+4
-20.6
112.2
+2
▲
▲
0.5+60.5
▲0.6
▼▼
Industry Total25
HSBC Holdings PLCBDT & Co LLC
-1322
2.0
+17
3,550.1Credit Agricole CIB
24 2923
72
13
Leonardo & Co-6.22.821
20
Industrial & Comm Bank ChinaRBC Capital Markets
4,923.0
4,212.9-
2.9
6.210,431.4
5,107.8
18
195,618.418
23
4,632.8
5.10.8
10
15 5
+7
▼2.8
3.0▲
ING
15
0.8
+2▼
35-
13
+2 Perella Weinberg Partners LP
2
0.8▲
0.1
▲ 33 1.81.1
DealsSh (%) Share Ch.
▲
48.455.0
▼
60.727.6
48.436.4
29.1
-3.3
▲65.516.1
68.6
▲
# of Deals per Advisor
Jan 1 – Dec 31
Market
7Financial Advisor
1.5# of Deals
▲
Rank ValueUS$m
EMEA Rankings
Sh (%)
Any Benelux Involvement Announced (AD40)
JP Morgan2
31.9
Rank Value per Advisor (US$m)
68.1
Financial AdvisorMarket
37.2
▼39
-0.5
Market
0.37.8▲
Market# of Deals per Advisor
# of DealsChange in
1.4
▲ 117.8 6.1
Imputed Fees (US$m)
Deals
150.7▲
▼▲
Share Ch. Sh (%)
Rank Value per Advisor (US$m)2014 Rank
Rank Value MarketSh (%)Market
0.4
0.0
22-17.6
24.2
12.8
26.0
18.2
28.9
12.0
0.70.5
11 +58 +3
▼
-24.1
16.4 ▼
0.3
+40.1
+3 23.9
▲
▲
0 0.51 0.12.5
0.30.4
2.1 0.7
60.1
▲0.7 0.7
0.3 ▲0.6
0.41.2
▼-15.5
42.0
2.3▲2.2
▼ -168 418 3120
+4▲1 556 +55100 0 100 01 941 6
0.8
Citi0.1
Mediobanca3.3
▲ 7.0
▲-1.1
▲ 2
-5.2
3
Centerview Partners LLC-5 ▼
Banco BTG Pactual SA
Puhl GmbH & Co KG
171726
14,713.0 8.77.58
6
10,736.2 6.4
100 0
5.0
6.5Kempen and Co NV
14
20,144.8
11 12,678.9
▼
+4
JP Morgan▲ Morgan Stanley 1
12 31
2
▲ 169
-4
+1 ▲
+12
▲
Any Benelux Involvement Completed (AF47)
2015 Rank
148,701.450,967.8
US$m30.3Deutsche Bank
-20.2▼
3.2
▼
-2.7
▼
▼
-10.129
+3
▲
-1.3 ▼
3▼
40.1
+2
24
25+2
0.9
29
14
+35.3
# of
▲
+4
+3
-5.9
-22.6
▲▲65
-▲ +1 ▲
31
1.9-16.8
0.6
▼
22
0.8
1
▲
2.5
3,321.4
3,617.8
14.1
-14.2
-6.5▲
▲1
1.828
-31.8 ▼
EMEA Inv. Announced M&A Target Sector by Value ($bil)
Industry Total 416,652.3 1,842 Industry Total
* tie
Industry % Change from Same Period Last Year ▲132.9%195.3% -14.8%▲
▲7.8%Industry % Change from Last Quarter
121.3%
Jan 1 – Dec 31 2015
▼ Industry % Change from Last QuarterIndustry % Change from Same Period Last Year 12.9%
168,418.3-120 1,556
▲▲▲
+55100.0
12.3%▲ -16.8%
100.0
16.5%▼
1,941.6
27.7%▲
100.0
Quarterly EMEA Cross Border Volume
$190.4
$174.7
$172.0
$163.6$158.4
$120.7
$88.5
$84.5
$83.9
$81.7$73.9 $52.9
Consumer Staples Energy and Power Industrials
Healthcare Financials Real Estate
Consumer Products and Services Telecommunications Media and Entertainment
Materials High Technology Retail
Government and Agencies
`
0
500
1,000
1,500
2,000
2,500
$0
$100
$200
$300
$400
$500
$600
4 1 2 3 4 1 2 3 4 1 2 3 4 1 2 3 4 1 2 3 4 1 2 3 4 1 2 3 4 1 2 3 4
2007 2008 2009 2010 2011 2012 2013 2014 2015
# of
Dea
ls
Ran
k Va
lue
(US
$b)
Inbound (US$b) Outbound (US$b) Number of deals
Visit http://dmi.thomsonreuters.com to view archives and order custom League Tables https://www.thomsonone.com 14

Full Year 2015 | Mergers & Acquisitions | Financial Advisors
Asia Pacific (ex-Japan) M&AAsian M&A Hits Record High I Imputed Fees Up 11% I Australian M&A Up 24%
25,973.5
7
58.6HSBC Holdings PLC
China International Capital Co
1
50,041.6 3
28.8
213
China International Capital Co
14,844.1
Huatai Securities Co Ltd
144,718.8 Financials3
Morgan Stanley 1JP Morgan
Southwest Securities Co Ltd
Mkt.Rank
25.62
Share
162,478.9 20,828.9 32,063.7 Morgan Stanley
Goldman Sachs & CoIndustrials
Rank Val US$m163,677.9
High Technology
54,262.3 39.4
Asia Pacific (ex-Japan) Deals Intelligence
Real Estate
41,949.7
139,421.4
13,586.1
1,604 1
19.6
Announced Mergers & Acquisitions activity with Asian involvement in 2015 hit the trillion dollar mark for the first time in history, with US$1.165 trillion, a59% increase over the US$731.3 billion recorded last year. The majority of activity involving Asian companies targeted the Industrials sector, followedby High Technology and Financials.
The top deal with Asian involvement in the region was Cheung Kong's purchase of the remaining 50.035% interest in Hutchison Whampoa Ltd forUS$45.4 billion, the biggest-ever acquisition involving Asia Pacific (excluding Japan) deals. This surpassed the prior record holder from 2014 – CITICPacific’s acquisition of its state-owned parent, CITIC Group, valued at US$42.2 billion. Asian buy-side financial sponsor M&A activities reached US$133.2 billion last year, a 76% increase over US$75.6 billion last year. Companies in theHigh Technology sector were the most targeted, followed by Retail and Financials.
According to estimates from Thomson Reuters/ Freeman Consulting Co., M&A advisory fees from completed transactions in the region totaled US$3.1billion in 2015, an 11% increase from the US$2.8 billion recorded last year. The top earner was Morgan Stanley, with US$208.1 million, followed byGoldman Sachs & Co., with US$161.6 million and Citi, with US$140.2 million.
China cross-border activity accrued US$161.9 billion in 2015, a 61% increase from the US$100.8 billion accumulated last year. Outbound investmentvolume reached US$112.7 billion, where companies in the Financials sector were the most targeted.
Announced M&A activity with Australian involvement grossed US$144.2 billion, a 24.4% increase over the US$115.9 billion recorded last year;Australia’s cross border activity recorded US$81.3 billion, while outbound activity amounted to US$24.7 billion.
14,585.3
1,870 1
14
9
210.1
19
Goldman Sachs & CoTelecommunications
2
3
12
2
3
1,383
3
218.7
Jan 1 - Dec 31 2015
11
8.4
12
12.716
12
No. Deals
Asia (ex-Japan) Involvement Announced Advisors by Target Industry
20,206.7 12.4
18.0
JP Morgan14,077.2
10.3
2
Morgan StanleyGoldman Sachs & Co
342.7
26.036,183.6 3
1 474,430.2 127,087.3
5Bank of America Merrill Lynch
47,290.0 40,182.4
HSBC Holdings PLC 33.9723
2
Cheil Industries Inc12/24/2015
9/1/2015 South Korea / South Korea 11,238.8Pending PetroChina United Pipelines (100%) PetroChina Pipelines Co Ltd China / China 10,873.3
Samsung C&T Corp (100%)5/26/2015
Energy and Power / Power
Shareholders
14,006.3
35,632.4
China Resources (Hldg) Co LtdChina / China
Hong Kong / Hong Kong
China Tower Corp LtdSK C&C Co Ltd
15,381.2Hutchison Whampoa Ltd
45,410.8Date Effective Target (% Sought/Acquired) Target Macro / Mid IndustryRank Value (US$m)
1/9/2015
China Cross Border Announced M&A
Cheung Kong(Holdings)LtdRank Date Acquiror / Target Nation
Hong Kong / Hong Kong Telecommunications / Telecommunications ServicesAcquiror
Cheung Kong (Hldg) Ltd- Ppty (100%) Hong Kong / Hong Kong6/3/20156/3/2015
O2 PLC (100%)10/14/2015 China-Telecommun tower asts (100%)10/31/20154/20/2015 8/1/2015
Pending Tongfang Guoxin Electn Co Ltd (79.2%) Investor Group High Technology / ElectronicsChina / China 12,039.3
Telecommunications / WirelessChina / China
6/3/2015
Asian Completed M&A by Region - Imputed Fees
18,349.3Hong Kong / United Kingdom
South Korea / South Korea 23,059.6Telecommunications / Telecommunications Services
SK Holdings Co Ltd (58.23%)
Pending
11/6/2015
4/21/2015
Energy and Power / Oil & Gas
Jan 1 - Dec 31 2015
Hutchison Whampoa Ltd (50.04%)
Retail / Food & Beverage Retailing9/1/2015 Ondereel Ltd,Best-Growth es (100%)11/7/2015
14,027.7Pending Sanxia Jinsha River Chuanyun (100%) China Yangtze Power Co Ltd
1/23/2015
Industrials / Building/Construction & EngineeringIndustrials / Building/Construction & Engineering
Real Estate / Other Real Estate
Top Ten Any Asia (ex-Japan) Involvement Announced Deals
0%
20%
40%
60%
80%
100%
$0
$10
$20
$30
$40
$50
$60
3Q09
4Q09
1Q10
2Q10
3Q10
4Q10
1Q11
2Q11
3Q11
4Q11
1Q12
2Q12
3Q12
4Q12
1Q13
2Q13
3Q13
4Q13
1Q14
2Q14
3Q14
4Q14
1Q15
2Q15
3Q15
4Q15
% O
utbo
und
Ran
k Va
lue
(US
$b)
Outbound (US$b)
Inbound (US$b)
% of Cross Border is Outbound
$0.0
$0.1
$0.1
$0.2
$0.2
$0.3
$0.3
$0.4
$0.4
$0.5
3Q11 4Q11 1Q12 2Q12 3Q12 4Q12 1Q13 2Q13 3Q13 4Q13 1Q14 2Q14 3Q14 4Q14 1Q15 2Q15 3Q15 4Q15
Impu
ted
Fees
(US
$b)
North Asia South Asia Southeast Asia Australasia
Visit http://dmi.thomsonreuters.com to view archives and order custom League Tables https://www.thomsonone.com 15

JP Morgan UBS
100 0Industry Total 5 555 3 070 310 990
45 0.39.1
▲3.0
22
712 373 9
16,498.2
26,694.9
4.5
21
15
2223 21,501.9
▼
2021
▲
▲
-49
6.7
▼
▼-4.2
▼
▼
0.9
6.1
+241 165 836 5
▲
2.0
▲
11
21 147
62
24,157.9 2.1 2.1 ▲
0.2
47
▼1.8 -2.81.4
0.2
0.4▲
0.5
-1.1
+15China International Capital CoHSBC Holdings PLC▲
+6-16
Bank of America Merrill Lynch
-7
52 0.5NH Investment & Securities Co 0.0Southwest Securities Co Ltd 20
93
▼25
-7.2
33
3.7+24
▼ 3.20.35
26,016.6
Any Asia (ex-Japan) Involvement Completed (AF32) Jan 1 - Dec 31
# of Deals per Advisor
37
Bank of America Merrill Lynch 4 6
2
Credit Suisse +14.9▲
Anglo Chinese Corp Finance7Somerley 46 0.1
7.9
-0.4
0.5
82,333.1 7.1
▼-0.6▼
53
0.391,889.5
69,441.4
Rank Value per Advisor (US$m)2015 Rank
2014 Rank
Rank Value
▲
-10.8
Change in Imputed Fees (US$m)
Sh (%)▼
HSBC Holdings PLC 3 26 140,971.5
▲175,559.4 +30
98
86
0.6 14Huatai Securities Co LtdRothschild
0.556
▲+34 4.9
91
7.1-3.0 71
-1.3 ▼
34,636.6
6.3 ▲
# of Deals# of
31,743.5
65
70
31,410.5PricewaterhouseCoopers▲
3215.1 ▼
Rank Value per Advisor (US$m)Market
Share Ch.
Morgan Stanley16.6Goldman Sachs & Co
1
MarketFinancial Advisor
1 5 194,035.0US$m
-4Share Ch.Sh (%)Financial Advisor
0.9▲5US$m
Goldman Sachs & Co 52
MarketMarket Market# of Deals FeesDeals Sh (%)
66▼
MarketChange in Advisor
▼5.3 1.2161.6
Market
23.5167,112.51
# ofRank ValueShare Ch.
2014 Rank Sh (%)
6.8 0.6661
12.6▲ 2Morgan Stanley 20.8 -0.2
16.4148,230.6
0.5 4.430116,867.3 8.0▼
133.5▲ 0.9▲0.31.2 +6 ▲ 208.1 6.8
▲13.0 1.7▼ 14.7▲▲
2.680.0+2
▲▲712.1 ▲
2310.3-1.8 4
3
China International Capital Co 5 7 87,803.8 7.5+2238 0.726 104,915.9
5 103,548.4 14.5Citi 6
1890,956.06
+27▼83,020.8
▼12.8
▲0.4 +54.4 0.32.8 1.5
▼-1312.1
▼▲2.1 134.386.121 ▲▲11.1
11.7 ▲44 0.8
0.21286,031.5Anglo Chinese Corp Finance 78
0.680.6 -14 ▼
54 ▲+5 ▲ 15.3 0.30.5
▼0.7 +6 ▲ 140.2
0.3▲3.5 ▲ 41 4.6 1.3
28▼-5.111.078,118.6
▲66 2+28+5
3 77,922.771,295.1
0.6-2.9
60,151.4▲ 10 8.4 3.210.373,056.6 0.80.5 +1 ▲
▲ 0.5▼
25 -524.3
11Credit Suisse6.0 ▲ ▲ 0.6 -4
10 10 69,570.7 6.0 -1.20.552 33Deutsche Bank 11 0.7109 7.911+8 56,077.9 125.8
▲3.1▼ 94.04.1
0.6
▼-14 ▼ 82.0▼
-27 ▼2.7
0.7 ▲
88.7▼
5.00.645-2.4
35,674.73112 8 59,992.5
0.1 ▲121313 ▲20 41,333.6
▼14 57,017.0
3.6 1.4
5.20.9
UBS▲ 44 0.4 94 1.7
0.4 +5 ▲ JP Morgan
Huatai Securities Co Ltd 140.2 ▲
12 9 43,556.7 6.1 -1.32.9
PricewaterhouseCoopers 15 24 37,282.5 1.4 ▲3.2▲28
8.1+330.1 ▲
58▼
▲-2.5 ▲ 94.600.5 3.1
Rothschild 16 19 35,758.1 3.1 2916 ▼▼3377
19.9-20.9 31
30.3 -8.4▲
0.5▼▲
4.44.4 1.8
0.7▼ 11.8 0.10.41.4+29▼▼ 10
17 -3431,314.9▲ 18
China Securities Co Ltd 1726.8-1218Guotai Junan Securities
30,001.6 2.6 -4.217
▲4.9 0.1▼0.20.6 13
1.5▼+31 4.028,798.4 -0.7
Guotai Junan Securities 23-61 3.8192.50.9
0.2+1619 1229,107.0 Lazard2.5 -0.2
28 24,953.4 2.10.8Industrial & Comm Bank China 28,966.4 ▼2.5 -3.6
0.229▲ 39▼ 0.5
0.7 ▲-4▲ China Securities Co Ltd▲
Haitong Securities Co Ltd4
▲25,551.0+4 ▲ 3.6▲7.2
3.1 ▲▲ 23 0.4 +7▼
0.2▲ 0.1
37▲+3 ▲ 11.5 0.45 0.2
+20.7Lazard 23 13 0.0▲ 4.1Moelis & Co 24
28+3 ▲56 20,477.9 24-118
15 23,784.5
0.120,798.7 Southwest Securities Co Ltd22
+4 NH Investment & Securities Co
▼1.31.8 Barclays▲
24,157.9 3.41.5 -0.1
2.4▲2.0▼
0.519 -1.0
+21250.2
5 789100 0▼0.1 -0.1▲15,636.7
+133100 0
▼ 9 -172.32.2
Jan 1 - Dec 31Any Asia (ex-Japan) Involvement Announced (AD25)
25GF Securities 1.7
Haitong Securities Co Ltd 22
65 19,818.9
Somerley
-0.81.4
▲
38.5
1.0
0.1
Asia (ex-Japan) Rankings
88
Sh (%)Market
1.6
Full Year 2015 | Mergers & Acquisitions | Financial Advisors
0.6
0.21.3
0.3
Industry TotalGreat Wall Securities Co Ltd
3.2
Citi 8CITIC 9
CITIC
Industrial & Comm Bank China
2015 RankDeals
2
-512
# of Deals per Advisor
9Deutsche Bank63
Morgan Stanley Lazard
▼
Hartleys Ltd 0.846*
0
8,556.8 -4.35.0
-2
-7▼5.9
Morgan Stanley
100.0
2.5+6
Industry Total
8,462.1 0.6 ▲
▼1.8
-13.8%Industry % Change from Same Period Last Year
Hartleys LtdIndustry Total-141
▼
25 1.4 ▲1,089
60
+2 ▲
+1
Azure Capital
1,390.6--
-163
4.5%
5,555 3,070.3
▲
4.8
▲
▲
19.6▼
▼-2▲+2 13.6
8.6
+2 9.8
2
-13.0%
0.2
+1
-19.7%▼
52
1,082.7▲
▼
4.80.2
99,762.5▲
22
0 24CIBC World Markets Inc 1,422.2 0.2
▲
100.0
▼-8.1% ▼
▼
100.0
0.12
0.1
8
4
16
2 0.9
▼▲▼
0.0
4.8
2.5
0.7 0.3
▲
▲
▲
0.6
0.50.8
-
+2
▲
1.1
0.70.91.3
▲
0.1
0.3
1.8▲
-30.50.6
1.1▲ 0.1 -06
Gresham Partners7 12Mizuho Financial Group 13
▲-1.9
0.4
0.5-14.0
-3Grant Samuel
Greenhill & Co, LLC23
▼▲
+2 20Barclays
Flagstaff Partners Pty Ltd
-3
▲▲▲ 0.2
1+3
0.121,592
▲▲
▲ 190.5
572120
1.1 0.2 Santander3SantanderFlagstaff Partners Pty Ltd
▲1.7
0.1▲
22
3819
18
1.5-
0.8
1.6
-0.21.71.7
1,618.8 1.1
21
62*
25
-
2,421.02,375.62,254.8
6,143.04,728.2
4.3 0.1
Evercore PartnersFort Street AdvisersRothschild 3.3
4.3-1516 10
16 -0.1▲ 15+2
14▼6,502.0 ▼▲
0.34,081.5 2.8
9
-5
4
4.55.9
161.8
▲
▼
8
▲710
2,479.6-
3,451.6Rothschild
2,375.618
▲1.6▲
2.2
1.6
17 -
16
0.3 11▼-
2.2-3.7
▼ 2,214.9
- 6.2
1,486.2
-1,732.6 1.7
53
1.2▼
▼ 16
▲
2.4
0.2
5.55,436.76.2
11
2.4
7,222.3
2,201.52.1
▼
6,143.06,456.9
▼▲
6.5
▼-19.1
▼ 38.6
3.5
0
2.5
7.27,159.1
910
-3 ▼ 28.6
10,990
3.8 ▲-10.7-12.2
1 38,190.0 38.31
15,102.5
2 30,861.3 30.9622,619.73
-7.95
9
2
11,299.0 11.35
-11.910.1
4
67 8,698.2
8,653.5Credit Suisse 8
10,096.429
JP MorganMoelis & Co
1.4
0.521 1,618.8
1,520.81.51.4
1.52622
62.7%-8.3% Industry % Change from Last Quarter
▲
1.0
+1
0.9
1.0 +1
▼
▲
-9
▼
27.5▼
2.5
-7
0.2-30.4
3.6
0.4
▲ 27.4
-5
▼
▲ 5▼▲
-1
7 -7
1.4
10
▲
15
11
8.7 -19.6
▼
5
110.5 -10
0.20.6
+2▲▼
72
2.4
0.9
1.0
35.91.4
11.3
16.0 1.50.8
1.5-1
20.21.3
3.7
▼
-1▼▼
1.1▼
▼
0.1
▼
0.90.8
▼
0.81.1
▲
0.3
▼
0.0▲
▼-
23.6
97.0
▼
▼
9.0
3.3
2.2
15.1
13.746.5
26.3▼
21
-50.8
▼
-13
4.3▼
2.2
2.6
▼50.5
1.9
0.6%
712,373.9
▲+9▲▼
# of DealsDeals▼
10 ▼▲
-5
19
UBS
Bank of America Merrill Lynch
Macquarie Group
+1
1.2
0.6▲16
-3 ▼▼
481.6 -12
11.116
30
+3
-3
-15.3
1.0
26
1.010
9,697.5
15,514.70.6
24.445,318.7
10.8
11.6
-1.64.8
13.2
31.4
-7.4
▼
7.8
-0.9
▲
▲
11,233.4
▲
35,246.7
19,081.334,335.8
6.7
▲▼
8
9,118.98
Credit Suisse
29
6
RBC Capital Markets 11
Citi
3.3
23.8
15,953.8
177
4JP Morgan
Market
Industry % Change from Same Period Last Year
1,165,836.5
Market
▼
# of Deals per AdvisorChange in 2015
Rank2014 Rank
Market # ofShare Ch.
Any Australian Involvement Announced (AD24)
Rank Value per Advisor (US$m)
US$m15.433.3
2.1 ▲1.93.0
1.2%
231,479.9
100.0
CIBC World Markets Inc -
1,372.4
1.0
144,192.0
87.1%
17
Evercore Partners
13
24Euroz Securities Ltd
▲
14Fort Street AdvisersMoelis & Co
Azure Capital
Mizuho Financial Group
BarclaysGreenhill & Co, LLC
8,679.1
20.1
6.0 5
1,422.2
25
24.4%Industry % Change from Last Quarter
Industry Total
▲
0.61.0 ▲1.0
1.0
1.0
Industry % Change from Same Period Last Year
1,390.6
Sh (%)
Jan 1 - Dec 31
61.1% -4.0%
-5,789100.0
11.5
Market
▲11.2%▼
Imputed Fees (US$m)
▼Industry % Change from Last Quarter
▼ ▲2.3▼1.5
Jan 1 - Dec 31
-12.7%▼
Any Australian Involvement Completed (AF31)
▲
Share Ch.Financial Advisor DealsMarketSh (%)
2015 Rank
Change in AdvisorSh (%)
-14 7.2
Market# of Deals per Advisor
-19.8%
8
▼Fees# of Deals Sh (%)77.8
-13 124.33.2▼
8
0.6
2.1
0.7
9
35
0.8
1.9
23
9
0.5 7.18,539.6RBC Capital Markets▼+3 7.2-4
4.56.3
▼19
Citi▼
-2
1.0▲▼
0.5
82
-4.8
Macquarie Group 2
9
2
5
17
3
-5.5
12
Goldman Sachs & Co4
Gresham Partners
9
14
23Lazard
10Bank of America Merrill Lynch
Financial Advisor
40.3% ▲▲
+133
-12.1%
100.0
Sh (%)
Industry % Change from Last Quarter▲
UBS 1 3US$m
Rank Value
6
Deutsche Bank5
+8
▲59.4%
-447,958.5
0.3
39.8
0.5
14
21
62*
18
0.3
1.3▲
1.2
2014 Rank
4 -20.3
7.9
Share Ch.
Goldman Sachs & CoDeutsche Bank
▼
Rank Value # ofMarketMarket
▲
▲
-6.4%
0.50.4
8.7
Rank Value per Advisor (US$m)
22-6.0
▼22.715.1
4.8
▼8
Industry % Change from Same Period Last Year
Industry Total
https://www.thomsonone.com * tie
Visit http://dmi.thomsonreuters.com to view archives and order custom League Tables16
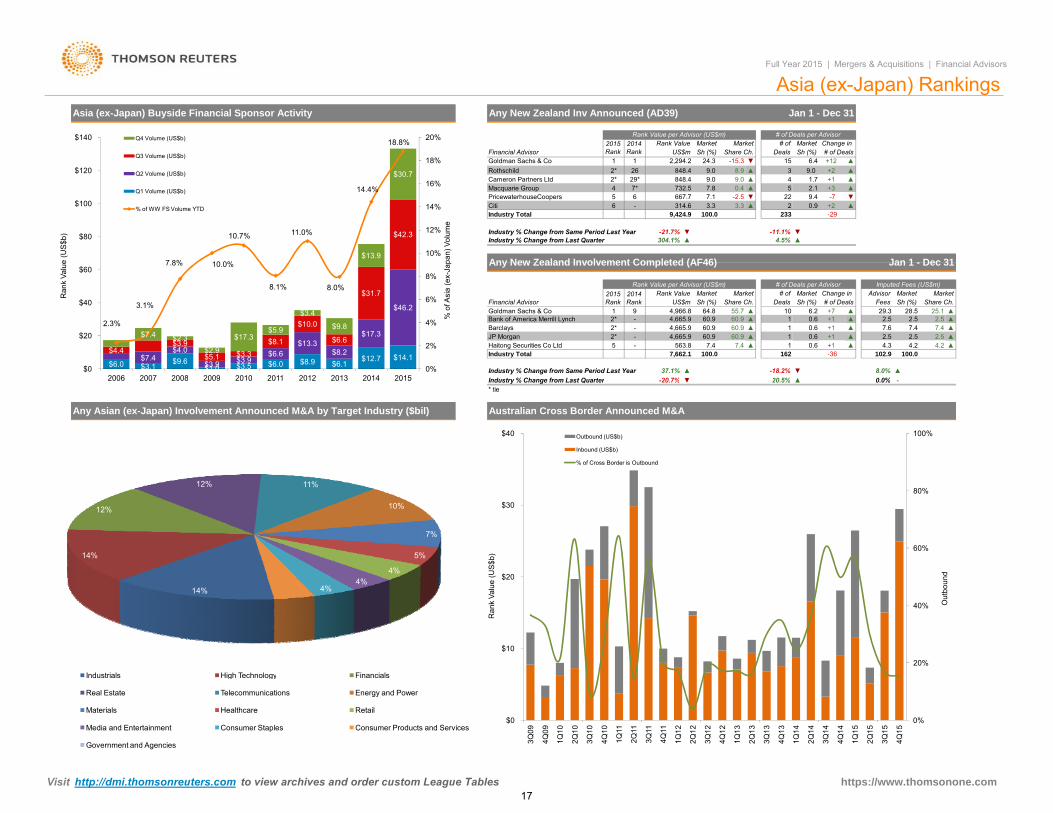
▲
7,662.1
4,966.8
▲
Rank Value
100.09,424.9
MarketSh (%)US$m
2*
Market
2,294.2
29*
0.6
▼
2.5
▲▲
▲102.9
▲4.3
▲
100.0
# of Deals per Advisor
6.4
162
▼
-36
8.0%0 0%
9.0
▲60.9
Sh (%)
20 5%-18.2%
+20.9
+12
+1
Asia (ex-Japan) Rankings
-
MarketShare Ch. Sh (%)
-21.7%
4,665.9
Market
9.026
9-
Imputed Fees (US$m)
-7▲
Change in
▲
▲
1 +1 7.47.6+11 2.5
0.6
7.4
7.4
60.9 ▲▲
▲4.2
60.9
+1▲▲
55.7Fees# of Deals
▲
+110.6
10 +7Share Ch.
▲6.2
MarketAdvisor
29.3
Market
28.5 25.1
848.4Goldman Sachs & Co
9.0 ▲Rothschild
Financial Advisor
Full Year 2015 | Mergers & Acquisitions | Financial Advisors
▲
Jan 1 - Dec 31
Rank Value per Advisor (US$m)
60.9 0.6
Sh (%)Sh (%) Share Ch.
Industry % Change from Last Quarter
JP Morgan
Industry Total
2014 Rank
Any New Zealand Inv Announced (AD39)
2015 Rank # of Deals
Any New Zealand Involvement Completed (AF46)
0.4
Deals
# of Deals per Advisor
2233 -29
Rank Value Market # of
▲
▲
4.22.5
100.0
1 2.560.9 2.5 2.5 ▲
Jan 1 - Dec 31
Change in
1.7
4.5%-11.1%
4
22 9.4
Market
Industry % Change from Same Period Last Year ▲
Citi▼
5732.5
64.8
60.9
5
Goldman Sachs & CoFinancial Advisor
2*
2015 Rank
2*
PricewaterhouseCoopers
Asia (ex-Japan) Buyside Financial Sponsor Activity
12*
Rank Value per Advisor (US$m)
▼
563.8
37.1%
Barclays
▲7.4
Bank of America Merrill Lynch
-20 7%
Haitong Securities Co LtdIndustry Total
4,665.9
▼304.1%Industry % Change from Last Quarter
2014 Rank
4,665.9
-
US$m
-
▼▲
Industry % Change from Same Period Last Year
6 - 3.3314.6 3.3
848.4
-2.5Macquarie Group
57.87.1
7*667.7
2*9.0
158.9
-15.3
▲▲
+3
+2
2.16
1
4Cameron Partners Ltd
13▲
▼24.3
# ofDeals
$6.0 $3.1$9.6
$1.0 $3.5 $6.0 $8.9 $6.1$12.7 $14.1$7.4
$4.0
$3.9 $3.9$6.6
$13.3$8.2
$17.3
$46.2
$4.4$3.9
$5.1 $3.3$8.1
$10.0
$6.6
$31.7
$42.3
$7.4 $2.3$2.9
$17.3$5.9
$3.4
$9.8
$13.9
$30.7
2.3%
3.1%
7.8% 10.0%
10.7%
8.1%
11.0%
8.0%
14.4%
18.8%
0%
2%
4%
6%
8%
10%
12%
14%
16%
18%
20%
$0
$20
$40
$60
$80
$100
$120
$140
2006 2007 2008 2009 2010 2011 2012 2013 2014 2015
% o
f Asi
a (e
x-Ja
pan)
Vol
ume
Ran
k Va
lue
(US
$b)
Q4 Volume (US$b)
Q3 Volume (US$b)
Q2 Volume (US$b)
Q1 Volume (US$b)
% of WW FS Volume YTD
0.0%20.5% ▲Industry % Change from Last Quarter* tie
Any Asian (ex-Japan) Involvement Announced M&A by Target Industry ($bil) Australian Cross Border Announced M&A
-▼-20.7%
14%
14%
12%
12% 11%
10%
7%
5%
4%4%
4%
Industrials High Technology Financials
Real Estate Telecommunications Energy and Power
Materials Healthcare Retail
Media and Entertainment Consumer Staples Consumer Products and Services
Government and Agencies
0%
20%
40%
60%
80%
100%
$0
$10
$20
$30
$40
3Q09
4Q09
1Q10
2Q10
3Q10
4Q10
1Q11
2Q11
3Q11
4Q11
1Q12
2Q12
3Q12
4Q12
1Q13
2Q13
3Q13
4Q13
1Q14
2Q14
3Q14
4Q14
1Q15
2Q15
3Q15
4Q15
Out
boun
d
Ran
k Va
lue
(US
$b)
Outbound (US$b)
Inbound (US$b)
% of Cross Border is Outbound
2006 2007 2008 2009 2010 2011 2012 2013 2014 2015
https://www.thomsonone.com Visit http://dmi.thomsonreuters.com to view archives and order custom League Tables17

Mitsubishi UFJ Morgan Stanley
* tie
13.8 2 1,768.3 3 12.3 1
357 2,713.5 1 18.9 8
Bank of America Merrill LynchING
14,385.1
1,983.8 2
1
4,937.3
43,270.4
Full Year 2015 | Mergers & Acquisitions | Financial Advisors
Japan M&AJapanese M&A Up 56% | Financial Sector Drives M&A Activity | Outbound Highest On Record
21,136.9
23,379.2 1
48.0
Rank Val US$m
Citi 221,509.2 3
Deloitte
Real Estate
Mitsubishi UFJ Morgan Stanley
54.0
28.534.4
Consumer Products and ServicesNomura
Industrials
Mizuho Financial Group
Rothschild
42.344.4
No. DealsRank
29,239.3 23
Share
Japan Deals Intelligence
25,740.4 27,008.0
60,897.0 1
Nomura
FinancialsMitsubishi UFJ Morgan Stanley
Driven by 40 large scale deals valued at US$1 billion or more, announced M&A activity with Japanese involvementtotaled US$195.2 billion during full year 2015, a 55.5% increase from comparable 2014 levels and the second strongestfull year period for Japanese M&A on record after 1999’s US$242.4 billion. Orix and Vinci’s Kansai Airport’s acquisitionof New Kansai International Airport’s operating rights worth US$17.9 billion was the largest Japanese deal in 2015 andthe tenth largest Japanese involvement deal, since records began in 1980.
The financials sector led the Japanese market in 2015, with deal volume totaling US$60.9 billion, accounting for 31.2%market share and a 225.9% increase compared to 2014. Industrials followed, accruing US$43.3 billion for a 22.2%share of the market.
Outbound activity continued to drive the Japanese M&A market, reaching a new record high with total value worthUS$87.8 billion, a 53.4% increase compared to 2014. Number of deals recorded 701 deals and the second highestdeal count since 2012's 732 deals. Seven out of the top 10 deals were outbound deals. Americas targets were themost sought-after by Japanese companies, recording US$38 billion with a 43.3% market share and the second highestvolume on record.
Japanese Domestic market activity totaled US$72.6 billion, registering 52.2% increase compared to the same period in2014, the first increase after three years of decline on domestic M&A activity. The fourth quarter of 2015 recordedUS$32.4 billion, a 184% increase compared to the last three months of 2014 and the second highest volume since1999’s US$74.3 billion on record.
Japanese Involvement Announced M&A - Top Advisors by Target Industry Jan 1 - Dec 31 2015Mkt.
Goldman Sachs & Co
5 49.712
9
16
190 14
6
4
13 553
48.9
470
9
17,328.9 High Technology
5,961.0 6,106.6
2
6,564.2 16,370.0
29
5 40.1
325,883.7 1
28.7 6
35.2
35.9
3187
4,698.6
Mitsubishi UFJ Morgan StanleyNomuraSumitomo Mitsui Finl Grp Inc
7,540.9
CITIC Ltd (10%)
1/20/2015
Completed
CompletedCompleted
2/18/2015
11/10/2015
Pending6,021.2
AcquirorTarget (% Sought/Acquired)Rank Date Target Macro / Mid Industry
Any Japanese Involvement Announced M&A
Reynolds Amer Inc-Natural (100%) Japan Tobacco Inc
10/19/2015Japan Post Co Ltd
Japan, France / JapanDate Effective
Top Ten Japanese Involvement Announced Deals
HCC Insurance Holdings Inc (100%) Tokio Marine & Nichido FirePending
6/10/2015 Japan / United States
Pending
Pending
12/15/2015
9/29/20159/8/2015 Pending
PendingPending
1/20/2015
7/23/2015 Financials / Insurance
Financials / Other Financials
Acquiror / Target Nation
Financials / Other Financials
4,755.8Financials / Other Financials
Gen Elec Co-Coml Lending (100%) Sumitomo Mitsui Fin & Leasing
Financials / InsuranceConsumer Staples / Tobacco
Japan / United Kingdom
Meiji Yasuda Life Insurance Co Japan / United StatesFinancials / Credit Institutions
5,924.0
5,005.2
Industrials / Transportation & Infrastructure
Any Japanese Involvement by Market
Chia Tai Bright Investment
StanCorp Financial Group Inc (100%) 4,961.3
Japan / Australia
4,433.3Japan / Japan
Hong Kong / Hong Kong
5,296.5Hong Kong / Hong Kong
Japan / United States
Consumer Products and Services / Professional ServicesIndustrials / Transportation & Infrastructure
Jan 1 - Dec 31 2015
Amlin PLC (100%)Chia Tai Bright InvestmentMitsui Sumitomo Insurance
6,121.1Japan / Japan
Rank Value (US$m)
Japan Post Holdings Co Ltd (8.52%)Toll Holdings Ltd (100%)CITIC Ltd (11.8%)
New Kansai Intl-Op Concession (100%) 17,911.2Kansai Airports
Japan Post Holdings Co Ltd
$26.9$50.1
$34.0 $23.4 $35.2 $38.8 $37.0 $25.6$42.1 $51.0
$51.8$31.1
$37.1
$21.6$19.2
$45.9 $40.1$32.9
$32.2$33.0
$22.5 $28.7 $47.5
$42.4$50.3
$50.2$42.4
$32.6$24.4
$45.1
$48.5$51.9 $28.7
$38.9$30.2
$50.5$59.3
$35.2 $26.8
$66.1
0
500
1,000
1,500
2,000
2,500
3,000
3,500
$0
$25
$50
$75
$100
$125
$150
$175
$200
$225
2006 2007 2008 2009 2010 2011 2012 2013 2014 2015
# of
Dea
ls
Ran
k Va
lue
(US
$b)
Q4 Volume (US$b) Q3 Volume (US$b) Q2 Volume (US$b) Q1 Volume (US$b) # of Deals Q4
100
200
300
400
500
600
700
.0
5.0
10.0
15.0
20.0
25.0
30.0
35.0
40.0
4Q12 1Q13 2Q13 3Q13 4Q13 1Q14 2Q14 3Q14 4Q14 1Q15 2Q15 3Q15 4Q15
# of
Dea
ls
Ran
k Va
lue
(US
$b)
Domestic Value Inbound Value Outbound Value Outbound # Inbound # Domestic #
https://www.thomsonone.com Visit http://dmi.thomsonreuters.com to view archives and order custom League Tables
18

Imputed Fees (US$m)
Financial Advisor
Lazard
Jan 1 - Dec 31
6,459.4
Deutsche BankLazard
5.3
Rothschild
5.3 ▲Bank of America Merrill Lynch
▼
20
066
1.6+33.0
36.72120
6.12.60.4▲
2.80.6
+1 ▲
3.0
0.2-12
▲ 1
1 768 311.2SEB1
3.4
Mitsubishi UFJ Financial Group
16
6
4,068.7
5.0
2.4
PricewaterhouseCoopers3.74,471.1
2,372.8 ▲1.2
▼-
15
▲
29 0.9MTS Health Partners LP
▼-11.03,380.4
70
0.0▲
22
0.47,004.1
▲
Ernst & Young LLP-
0.2Deloitte+2 33GCA Savvian Group Corp
243,154.541 1.3
▲ +1 2,955.2+9
-▲
132.8
1260
+7▼
Any Japanese Involvement Completed (AF23)
▲
172.2
5 9,590.55.0
▲
3.7 -7.4
4,098.6
0.1
63 2.0 +10 3.4
Gresham Partners15 8
▲
- 6,021.2 3.1 ▲Centerview Partners LLC▼3,048.4 -1
3.1 +1
UBS0 0 1 12 12 25 ▲47
2 570 2▲ 29ING 25 33 0 9 ▼0 5
Mitsubishi UFJ Financial Group 23 38 2,958.4 1.5▼1.6
1.222 12
Gresham PartnersGCA Savvian Group Corp
21-3.6
▼JP MorganKPMG -2.6
3.41▲
▲ 2.3 +60.0 ▼3,634.4
7 ▼2.6
4.180
-9.6+15▼ ICICI Bank Ltd
▲ 3.2-0.5
Deloitte 20 30KPMG 19 11 9,288.5
8,062.7
4.918 17 9,317.5 4.8
4.8-1.6 ▼
9.9-1.7 2.1 +5
7.78-8.9
+1110
-0.26,021.2
▼
0.56,671.7
23-1
1.2▲4.8
0.5
1314
-115.5
14
0.3
0.1 ▲52
6.35.8
2.6+4+4 12
0.46.0 -38.410,165.1
▲
6
0.5
9,766.5
7,674.1
30 11.2
▲0.3
-2.6
4.96
▲
63 3.2
0.311.0 +44.2 0.8▲
6613,367.4
8
0.6
0.416
5.921 ▲
9
0.6
-▲
190.5 +816
5.419
-2 ▼
Mizuho Financial Group▲Sumitomo Mitsui Finl Grp Inc-Evercore Partners
0
1
1110.3
513,604.1
▼18.9
-3.95▲ 7.9
+3Nomura
25,430.12
157
-12.1
+1020.9
+9
Goldman Sachs & Co47
Mitsubishi UFJ Morgan Stanley
Sumitomo Mitsui Finl Grp Inc
8
▲7
4
4
7.513.0
Deutsche Bank
9
16
9
13
Citi
7
▲
23
45
22,993.29
Mitsubishi UFJ Morgan StanleyNomura
4.223
15,748.8
Rothschild
85.5
7.715,104.8 3.711
▲
▲
11
9,969.8
115.5 ▲ 4
19.2
5.1
▲18.6
8.4
10,630.210,357.2
5.5
16.131,331.5
-
17,263.429,365.0
24
34▲
108,063.19,356.3
30.3 Credit Suisse+110+7
1.815.614.7
7.78.022
▲
0Citi
0.8
6.6 -12.8 ▼▼
25 9
2.7
▲
▼
1.9
1 1
2.0
0.7
0.7
0.2
▼▲
▲▲
0.30.2
▲
3.4
▲
0.1
0.7
▲
20.4
31.6
▲0.6
48.2
1.50.9
0.7
1.3
▼
0.6
▲2.2
▲▼
▲2.8
139.9 9.9
▼▼9.9
4.4
101.2 7.2
▲
17
10
110.4
▲
19 -
1 4
▲2.2-▲
0 5
0.2 +1▲
+22.12.6
1.835▲
9.4▲
+1
+7 19 8
37.8
16.40.123
▲2.6
24- ▲ 1
18
3,934.3
0.7--
3
0.1
1.2
3.4 0.1
▲
45
▲20
▼▲
2.31.0
7.3
1.1
0.3
-1
26.1
35.7
-
1.6
0.00
0.2
1.9
-5
-4▼
▼
▲
0.6
▼
0.0
▼
1.5
2.2
2.1
4.8
0.4
3.6
▲
▲
▲
99.7
▼
▲
▼
31.1
46.5
▲7.1
29.3
2.5
▲
3.3
-5.6
1.4
68.4
50.9
145 +7
▲
▲
-3
+6
1.7
28.7
+4
▼
▼
107▼▼ 5.4
18▼-12▲
-50.9+5 ▲
+11 ▲▲
5.2
12
2.01 28,715.8 23.6
29,370.7139.4
▲2.4
6.9 ▼24.2US$m
Rank ValueDeals
Market Change in Sh (%)
MarketMarketMarketFees# of Deals
# ofShare Ch.Financial Advisor Share Ch.
# of Deals per Advisor
Japan Rankings
Share Ch.Market MarketAdvisor
Sh (%)
8.85.6
Daiwa Securities Group Inc2515.0 ▲ +212
0.3PricewaterhouseCoopers ▲Credit Suisse
JP Morgan
14SomerleyCITICUBS
Daiwa Securities Group Inc
13,325.6
36,225.5
2
37,414.236,906.5
12
9,714.216
3
5.0
20
108
5.3
6.8
17
15
8
10
13
Bank of America Merrill Lynch
Mizuho Financial Group
Goldman Sachs & Co 6 3
Evercore Partners
7
-
▲▲
▲
22.7
1
10.99.5
18.9
7.5
76
Market2014 Rank
▲
74,000.056,593.7
US$m
42,050.8
Rank ValueSh (%)
21.544,337.9
13211.262
▲▲29.0
169
Sh (%)Change in
Rank Value per Advisor (US$m)
Sh (%)
# of Deals per AdvisorMarket
12.7 163
37.9+24
Deals2014 Rank
Jan 1 - Dec 31
# of Deals# of 2015
Rank
Any Japanese Involvement Announced (AD19)
Rank Value per Advisor (US$m)2015 Rank
Full Year 2015 | Mergers & Acquisitions | Financial Advisors
Industry % Change from Same Period Last Year Industry % Change from Same Period Last YearIndustry % Change from Last Quarter Industry % Change from Last Quarter
121,469.0
Japanese Involvement Announced M&A Target Industry by Value
1,768.3 1 UBS0.0 1.12.1-2 25100.0
▲
▲▲▲ 6.1%
-5.8%▲
▲110.8%
* tie
46.4%55.5%
▼
2,570.2▲ 29
4.6%
Industry Total +178ING 25 33 0.9 ▼
100.0 3,108195,224.40.5 1.1
htt // th
1,413.7
▼
100.0
▼
-1▲10
1,9931.40.5
77.2%-1.0%
Industry Total
Japanese Target Completed M&A Fees
Vi it htt //d i th t t i hi d d t L T bl
-0.1%
▲+7 19.8
-3.1% ▼ ▲
31.2%
22.2% 8.9%
8.4%
7.4%
6.3%
Financials Industrials High Technology
Real Estate Consumer Products and Services Consumer Staples
Retail Healthcare Media and Entertainment
Materials Energy and Power Telecommunications
$267.2$191.0 $227.2
$98.2
$236.8 $212.7 $175.3 $217.8 $224.0$128.0
$273.6
$269.0 $180.4
$147.8
$239.6
$132.3 $202.9 $116.5 $75.8
$140.3
$191.4
$206.5
$160.9
$142.2
$144.9
$106.3
$223.3
$192.6
$138.5
$89.5
202.1255.9
176.6
237.7
178.2
155.9
239.1
208.8
149.0
195.6
0
500
1000
1500
2000
2500
3000
$0
$100
$200
$300
$400
$500
$600
$700
$800
$900
$1,000
2006 2007 2008 2009 2010 2011 2012 2013 2014 2015
Num
ber o
f Dea
ls
Impu
teed
Fee
s (U
S$m
il)
4Q 3Q 2Q 1Q # of Deals YTD
https://www.thomsonone.com Visit http://dmi.thomsonreuters.com to view archives and order custom League Tables
19

Industry Total
1.60.03.00.20.30.1
13,030.2188.0
24,056.31,297.42,195.0
537.1
▲▲▲▼▲▲
+2+1+2-6
+3+5
1.51.51.51.31.31.3
666555
23*20*23*1133*
-
13*13*13*17*17*17*
2.8
RothschildHovde Group LLCJefferies LLCRaymond James Financial IncPiper Jaffray CosSimmons & Co International
Credit Suisse 17* 15 6 1.3 -2 ▼ 24,625.9
- 3,203.5 0.4Deutsche Bank 13* 18* 6 1.5 0
▼▼▲ 13,030.2
0.40.21.5
17*17*17*
1.31.31.3
16*1128*
666
Raymond James Financial IncRothschild
1,801.87,204.62,259.8
0.10.50.2
-2-2
-21+17
▼▼▲24
1.41.31.31.2
Fairness Opinion Rankings†
▼
39319 16* 22 1.5 +10
20*22*22*
13.9.0 0.0
▲
2.61,801.8 0.2
20,733.0
112,416.3
159.6%
Full Year 2015 | Mergers & Acquisitions | Financial Advisors
9,769.4 1.21,127.4 0.1
416,335.9 51.326,106.2 1.862
US$m37,352.0
0.715,860.0
▲444,259.0
▲
1.1▲
16,173.9
Stifel/KBW
-7
Shenwan Hongyuan Securities Co
146,300.1
0.2
8,949.8▲
+6
21*
5 +21
0.6
28 1.91.5
1.2
2.6
▼
4.4
▲
9,994.0
2.0
36,224.1
+243.4
20,733.0
2
▲
+31
13*
▼
211919
▲
1.9 -3
3*99*62*
1.8
514.2
3.4 +2651 3.4 +26
4* 10*3 8
+32
+2344 3.0
4*514* 3*
23* 399 1 4287 16*
16* 19,613.9
62.6
13.1
1.4 ▼.0
31.3
9 70,132.9
JP Morgan
Stifel/KBW
Prairie Capital Advisors IncSandler O'Neill Partners
1,801.8114,171.5
48.82.40.2
Houlihan Lokey
Morgan Stanley
8.10.0
14Evercore PartnersBank of America Merrill Lynch0.43.01,127.4
1.1
1.6
0.1
7*Goldman Sachs & Co
7*10*10*30
2.83.0Bank of America Merrill Lynch
7*
2.12.1
3.2
▲15,297.1-2
3,372.3
-2
+10
▼
▼24
261.6
23,377.2
18,347.2
15
27* 1.8▲▲
+139 24
7
Industrial Securities Co Ltd
12*
1.627*1.6
23
Morgan Stanley
18
14
16*
Stout Risius Ross Inc
Houlihan Lokey
16*
12*Haitong Securities Co LtdGuosen Securities Co Ltd
1011
15
-4
Houlihan Lokey
Somerley
25 ▲
7*
Pendo Advisors LLC2728
10.3
Southwest Securities Co LtdChina Securities Co Ltd
6JP Morgan
14Prairie Capital Advisors IncMorgan Stanley
▲GF Securities +26
424,087.620,733.0
▲
▼▼
CITIC 66*47 ▲+11 ▲
4.1
14 +133.03.4 -916
-2119
1.12 1 42 9.0
30
1,127.4-2 ▼
▼
Sh (%)
0.111.1 +13 ▲
3 5 39 8.3 +11JP Morgan
# of Market Change in
1 3# of Deals
-1.1
Market
4.4
2015 Rank
Huatai Securities Co Ltd
Rank Value
9,769.452US$mSh (%) Deals Sh (%)
2014 Rank
2.6
Rank Value
Duff & Phelps1*1* 6 65
Fairness Opinion Provider2014 Rank Sh (%)
Stout Risius Ross Inc
Deals0
-55 2
6.44 4
100.0
Industry % Change from Same Period Last Year
46912.8%
Pendo Advisors LLC
3,203.51,364.6
Industry Total 811,140.9
-14
-1-8
+2
869,306.1
100.0-15
-3.7% ▲
75,530.413▼
+4
▲▲
8
-6 ▼70,132.9 8.6
3,434.0 0.4▼-4
23*62,928.8 7.89
10 +1
30.52.3
▲2.0
4.8
▲
3.39.3
3.6
▼
3.6
0.0
Industry % Change from Last Quarter
▲
▲9.2-2
36
15
30
82.5
42.9%
▼
▼+1353*
91413
4
-9
1
-66-21
-2
7
193.8
14
2015 Rank
2014 Rank
1 310.7
+13▼
7.6+10
▲Sh (%) # of Deals
12
2
1110
Goldman Sachs & Co
3
7*9
5
7*
Deutsche Bank
18
1.4
+5
Bank of America Merrill Lynch
▲
7*
28*
Sandler O'Neill PartnersEvercore PartnersCormark Securities Inc
Rank Value (US$m)
Worldwide Announced Fairness Opinion
Rank Value (US$m)MarketRank ValueChange in
# of Deals per Advisor# of Deals per AdvisorBased on Number of Transactions
Change in # of Market# of Deals per Advisor
Market2015 Rank
# of
Jan 1 – Dec 31 Jan 1 – Dec 31Any Americas Involvement Announced Fairness Opinion
Jan 1 – Dec 31Any US Involvement Announced Fairness Opinion
Rank Value (US$m)Based on Number of TransactionsBased on Number of Transactions
6
65
DealsMarket
42Duff & PhelpsFairness Opinion Provider
Stout Risius Ross Inc
# of Deals
Duff & Phelps
Fairness Opinion Provider US$m Sh (%)
Guotai Junan Securities
2
5
13.252
4
Sinolink Securities Co LtdCiti
10*
5.4▼ 17*17*17*
GMP Capital Corp▲
1.91.7
24*
1.0
12
0.7
76,333.1
Jefferies LLC
1010
98
28*
13
13*45*
8.70.17.20.0
-6+1+8-11+4
▼
Stifel/KBW
3,434.075,530.4
475.962,928.8
30.5
▼▲▲
BMO Capital Markets
New Times Securities Co LtdChina Merchants Securities Co
+1 ▲ 14,638.4KPMG 20* 13* 21
▲ 16,401.9
14*14*14*1.3
0.57,370.2
9,506.8
Deutsche Bank28*
777
1.51.51.5
+2+3+3
0.32.83.3▲
2,430.024,329.228,533.0
Moelis & CoHovde Group LLCEvans & Evans Inc
19*24*66*
666
1.31.31.3
0+1+5
-▲▲
2,517.3188.0
36.1
0.30.00.0
y
Industry Total
Industry % Change from Same Period Last Year ▲ ▲Industry % Change from Last Quarter ▲ ▲
7.8574.0
.0
0.03.00.0
+1-1
+1
▲▼▲
111
3.53.53.5
1.40.70.20.7
Moelis & CoSumitomo Mitsui Finl Grp IncCITIC3.4
Industry % Change from Last Quarter
Goldman Sachs & Co
▲▼▲▲
5,904.42,957.8
851.52,892.9
1.41.21.21.2
+13-8
+7+9
▲ -9*32*58*
13111111
Bank of China LtdGreat Wall Securities Co LtdZheshang Securities Co LtdDuff & Phelps
19*22*22*22*
▲ .0
▲
880.820,774.0
276.7
0.36.00.13
1.71.71.7
00
+3equinet AG
15*15*15*
15*15*
-
InvestecMorgan Stanley
33
--
0.05*
1
Any Japan Inv Announced Fairness Opinion
5*
GF Securities 7* - 1
1
0
3.5
2*
13.8
7*7*7*
Morgan Stanley7*7*
5* --
410.43,817.41
3.53.5
+10Evercore Partners
,158,861.7 11.2+14 ▲25 16* 1.2
†Fairness Opinion rankings include fairness opinions provided as a standalone mandate as well as fairness opinions provided as part of a broader advisory mandate.
0.2
Essence Securities Co Ltd 19* 32* 13
17 16
13 ▲ 5,425.8 1.3
8.42.1
19.6
11*11*
26*4
▲+2
27,991.4UBSLazard
52,622.5
2.3
▲
2
0+3
2.32,523.1 13.01,773.3
Rank Value (US$m)
Sh (%)
-9.1
756.4 3.9
2.3 -12
15.3
+3 ▲ 95,598.0
2,255.1 0.7+5
▲
1.1
6+2
Plutus Consulting Co Ltd
+64.139
▲es Networks Co Ltd
8
Deloitte
JP Morgan
2.39,506.8▲
5.4
+10
+21
▲3*47
Market
6.6
▲+26
6*
65 +316.9+32
# ofDeals
▲
Change in
-66.7%
1.80.8
29 19,450.6 100.0
▼
Industry Total
Industry % Change from Same Period Last Year 20.8%
9
3*
7
11
Nomura
+13
23,377.2
10
5.4
▲
+5
408,362.5
▲
▲
1.4+9
1.71.5 ▲
95.8%▲
+373
2,808.4 0.7
▲ 1,715.4 0.41.4+10
Lazard
2
-66.7%
6.93
▼
6
---
5 -2,414.73*
▲
1,631.1
+5
-
▲
-
4.83.75.7
▲10.3- 4 13.8 +4
Mizuho Financial Group
US$m
4 13.8 +1+3
Daiwa Securities Group Inc22* 450.5
2*
# of DealsSh (%)
▲
-3*-
1 3.5 +1
▲
1▲▼5
Deals
417.2 -4
-24.3%▼
12.4
7,370.2▲ 3,372.3
15,297.1▲19,613.9
Industry % Change from Last Quarter 64.9% ▲ 67.8%
Industry Total 100.0
▲
947
Industry % Change from Same Period Last Year 65.0%
Sinolink Securities Co Ltd
1415
9* 24
14
8.9
6.4
2.5
2.95 3.012 2713* 26
▲ 36,224.151
9.137,352.0▲
+26 2.43.9
▲
2.6
Industry % Change from Last Quarter 4.5% ▲ 16.5%Industry % Change from Same Period Last Year
Industry Total
▲
343,810.3
10.1%
100.0+16175
83.3% ▲
81*16*
19* 44*Minsheng Securities Co Ltd 18 16China International Capital Co
Gram Capital 16*
▲ 0.6+15
754.011,717.8
2,259.8
+5+2
8.1▲ 1.8
20▼
2.9
19 2.08,968.3
58* +3
- 8,136.6 2.4
3,729.5+3
12* 0▲ 37.5
26* +58*
22* 2.9▲8*
- 2.95
3,658.3 1.1▲ 2,505.3 0.7
3.46
281.0
4 4*3
108*
1315*
8
2015 Rank
1
Jan 1 – Dec 31Any EMEA Inv Announced Fairness Opinion
Market
39.1 -1
10.32
Market2014 Rank
Change in Deals
18Sh (%) # of Deals
▲16
Industry % Change from Same Period Last Year
# of Deals2014 Rank
# of2015 Rank
▼
Rank Value
Jan 1 – Dec 31
,
Change in MarketMarketRank Value (US$m)
796.9 4.1
# of Deals per Advisor
152.2%32.6%
17
Industry % Change from Last Quarter
Citi
China Securities Co Ltd
62
27.8
Sh (%)
0.2
34.73*
13*
0.1
5.7
178,634.62
+10
Huatai Securities Co Ltd2
22.9
+2 119,253.8
2.9
▲
▼
-2.9%55.5%44.1% 129.5%
3*
6*
▲51 +26
Industrial Securities Co Ltd
11
2.8
28
44
* tie
32* 18 1.9 +14▲
China Merchants Securities Co16 1.7Deutsche Bank
11*+7 ▲ 13,721.8
11* 26* 2.3 0.0Shenwan Hongyuan Securities Co 12Citi
Stout Risius Ross Inc
66*
15*
Fairness Opinion ProviderJP MorganKPMG
Goldman Sachs & Co
4
GF SecuritiesPricewaterhouseCoopers
1
CITIC
Southwest Securities Co Ltd
Somerley
7.4
+7651.5
5
+3651,484
# of
Based on Number of Transactions
2015 Rank
Based on Number of Transactions
Fairness Opinion ProviderUS$m
13
# of Deals per Advisor
6*
# of Deals per Advisor
Bank of America Merrill Lynch
1
Guosen Securities Co Ltd
2014 Rank
Guotai Junan Securities
Rank Value
Any Asia Pacific Inv Announced Fairness Opinion
New Times Securities Co Ltd
Rank Value (US$m)
4 2.3 +3
4.6
53.4
▲
Haitong Securities Co Ltd
+17
4
Fairness Opinion ProviderRank Value
+1
58*
US$mMarket
7,204.62.1
Based on Number of Transactions
7*
14.9%
Jan 1 – Dec 31
▲41.8%
26,106.2
9,994.0
4.75.0
▲ 8,949.8 2.222 2.3
▲
+23
15,860.0
Sh (%)Sh (%)
▲
SomerleyEvercore Partners
6*
Duff & Phelps
Deloitte
Rothschild 512*
1,417,907.2 100.0Goldman Sachs & Co
Panmure Gordon & Co LtdDuff & PhelpsBank of America Merrill Lynch
7*7*7*7*7*7*
ACE Consulting
-5*
111111
3.53.53.53.53.53.5
+1+1+1+1+10
▲▲▲▲▲-
13.1988.8
4,961.384.3
.1825.7
0.15.1
25.50.40.04.2
https://www.thomsonone.com Visit http://dmi.thomsonreuters.com to view archives and order custom League Tables20

-
-
-
-
- Financial and legal advisors receive full credit for each deal on which they provide financial or legal advisory services, unless they represent minority sellers or advise on only a portionof the transaction or Thomson Reuters has not been made aware of their participation in that transaction. For pending transactions, advisors to targets of multiple bids receive credit forthe transaction agreed to or, in the absence of an agreement, the value of the highest offer.
EMEA
Tel: +44 (0) 20 7542 7381
E-mail: [email protected]
Japan
Christina MavrakiDeals with undisclosed dollar values are rank eligible but with no corresponding Rank Value. Non-US dollar denominated transactions are converted to the US dollar equivalent at thetime of announcement of terms.
Full Year 2015 | Mergers & Acquisitions | Financial Advisors
Ranking Criteria Summary
If you would like to participate in the submissionprocess, receive quarterly press releases, or havequestions about league table criteria pleasecontact:
League tables include rank eligible mergers, acquisitions, repurchases, spin-offs, self-tenders, minority stake purchases and debt restructurings.
A tender/merger transaction is considered to be effective at the time of consummation of the merger or the date on which it is declared wholly unconditional.E-mail: [email protected]
AmericasRobert LevineTel: +1 646 223 5682
Announced league tables include all deals that were announced between January 1, 2014 and December 31, 2015 and of which Thomson Reuters was made aware. All current dataand previous year's data is as of 5:00pm EST on December 31, 2015.
Tel: +852 3761 1852
E-mail: [email protected]
Asia-PacificKelvin Bian
Kaori Motohashi
-
-
-
-
League tables, commentary, and charts citing announced activity are based on Rank Date and include intended, pending, partially complete, completed, pending regulatory, andunconditional transactions. Rank Date is defined as the earliest public announcement of when a value can be applied to a transaction.
League table volumes for Mitsubishi UFJ Financial Group and Morgan Stanley, included herein reflect the changes after the commencement of their jointly established securities firmsin Japan: (1) Mitsubishi UFJ Morgan Stanley Securities and (2) Morgan Stanley MUFG Securities. Accr editation for transactions involving the newly established joint ventures arereflected in totals for Morgan Stanley. For Japanese related rankings, Morgan Stanley is represented as "Mitsubishi UFJ Morgan Stanley”.
Any Involvement league tables include deals where the target, acquiror, or either ultimate parent are domiciled (nation of headquarters) in the specified region or nation. Anyinvolvement league tables also include the nation of the seller and seller ultimate parent on privately negotiated stake purchases
Imputed fees are calculated using Freeman & Co. proprietary algorithm where spreads or fees are not disclosed. Deal fees are on a gross basis before all expenses. Each underwriteror advisor is allocated its share of deal fees using Freeman & Co. allocation methodology, based on the number of underwriters or advisors on the deal and their role. No fees areallocated to syndicated members.
Tel: +813 6441 1338Kaori Motohashi
E-mail: [email protected]
While Thomson Reuters has used reasonable endeavors to ensure that the information provided in this document is accurate and up to date as at the time of issue, neither Thomson Reuters nor its third party content providers shall be liable forany errors, inaccuracies or delays in the information, nor for any actions taken in reliance thereon, nor does it endorse any views or opinions of any third party content provider. Thomson Reuters disclaims all warranties, express or implied, as tothe accuracy or completeness of any of the content provided, or as to the fitness of the content for any purpose to the extent permitted by law. The content herein is not appropriate for the purposes of making a decision to carry out a transactionor trade and does not provide any form of advice (investment, tax, legal) amounting to investment advice, nor make any recommendations or solicitations regarding particular financial instruments, investments or products, including the buying orselling of securities. Thomson Reuters has not undertaken any liability or obligation relating to the purchase or sale of securities for or by any person in connection with this document.
© 2016 Thomson Reuters. All rights reserved.
Thomson Reuters and the Thomson Reuters logo are registered trademarks and trademarks of Thomson Reuters and its affiliated companies. Any third party name or mark herein belongs to the relevant third party.
https://www.thomsonone.com 21

© 2015 Thomson Reuters..Thomson Reuters and the Kinesis logo are trademarks of Thomson Reuters.
FOR INFORMATION PROFESSIONALSSDC Platinum is the world’s foremost financial transactions database, covering new issues, M&A, syndicated loans, private equity, project finance, poison pills, and more.
Solution for:• Market Analysis & Trends (Geography, Sector,
Asset Class, Deal Type, Deal Size, etc.)• Deal Origination (Debt Maturity Analysis,
Company Lifecycle including Private Equity)• Pitch Creation (Firm Credentials,
Representative Acquirors)• M&A Targeting (Active Strategic/Sponsor
Acquirors, Target Company Screener)• Negotiation (T&C Benchmarking)
FOR INVESTMENT BANKERSThomson Reuters Eikon is the most intuitive and comprehensive way of staying informed. With natural-language search, you can quickly find global information, news, charts and analytics. Company and industry views provide top-level summaries, and then detailed information is just a click away. Identify new opportunities and gain deep understanding of markets, industries, companies and events.
Thomson Reuters Eikon also includes an Add-In for Microsoft® Office to help you increase your efficiency. From screening and targeting to comparables analysis, building league tables, valuing a company and
developing a client pitch book, you can do all this without leaving Microsoft Office. Search and autosuggest features in Excel make model-building easier.
Solution for:• Managing Client Relationships• Deal Origination• New Issues Pre-Marketing/Roadshows• Financial Modeling• Customized League Tables• Simple Deals screening• Valuation analysis and comparable
deal screening• On-brand pitch book creation
FOR STRATEGY AND PLANNING TEAMSThomson Reuters Deals Business Intelligence enables you to slice and dice our renowned Deals and Fees data to create ad hoc reports, analyze market trends, benchmark your performance and identify opportunities – all within a tool built into your workflow in Excel®, saving you valuable time and giving you a competitive edge.
Solution for:• Conducting market analysis and
identifying trends• Benchmarking your performance and
monitoring competitors• Targeting clients by wallet size and
banking relationship• Allocating resources more effectively by
evaluating and analyzing lost deals
Send us a sales enquiry at: financial.thomsonreuters.com/salesRead more about our products at: financial.thomsonreuters.com/products
To purchase individual Thomson Reuters Deals or League Table reports, please contact our Thomson Reuters On Demand group:
Web: http://financial.thomsonreuters.com/ondemandEmail: [email protected]
Access unique analysis for free anytime using Thomson Reuters Deals Intelligence website and receive regular updates, delivered direct to your inbox.
Go to: dmi.thomsonreuters.com/dealsintelligence
Thomson Reuters Solutions for the Deal Making Community
22