q4 2016 earnings call presentation · textron inc. q4 2016 earnings call presentation; january 25,...
TRANSCRIPT
Textron Inc. Q4 2016 Earnings Call Presentation; January 25, 2017
1
Q4 2016 Earnings Call Presentation
January 25, 2017
The data in this package should be read in conjunction with the Textron earnings release and accompanying tables.

Textron Inc. Q4 2016 Earnings Call Presentation; January 25, 2017
Forward-Looking Information
Certain statements in this package and other oral and written statements made by Textron from time to time are forward-looking statements, including those that discuss strategies, goals, outlook or other non-historical matters; or project revenues, income, returns or other financial measures. These forward-looking statements speak only as of the date on which they are made, and we undertake no obligation to update or revise any forward-looking statements. These forward-looking statements are subject to risks and uncertainties that may cause actual results to differ materially from those contained in the statements, including the risks and uncertainties set forth under "Forward-Looking Information" in our fourth quarter 2016 earnings release. Additional information on risks and uncertainties that may impact forward-looking statements is discussed under "Risk Factors" in our most recent Annual Report on Form 10-K and our Quarterly Reports on Form 10-Q.
2

Textron Inc. Q4 2016 Earnings Call Presentation; January 25, 2017
Key Data - Fourth Quarter, 2016
3
Q4 2016 Q4 2015
Revenues $3.8B $3.9B
Segment Profit $391M $378M
Adjusted EPS from Continuing Operations*
$0.80 $0.81
Manufacturing Cash FlowBefore Pension Contributions*
$727M $534M
Pension Contributions $14M $18M
* Adjusted EPS from continuing operations and manufacturing cash flow before pension contributions are non-GAAP measures that are defined and reconciled to GAAP in our earnings release.

Textron Inc. Q4 2016 Earnings Call Presentation; January 25, 2017
Key Data – Full-Year, 2016
4
Full-Year 2016
Full-Year 2015
Revenues $13.8B $13.4B
Segment Profit $1,309M $1,255M
Adjusted EPS from Continuing Operations*
$2.62 $2.50
Manufacturing Cash FlowBefore Pension Contributions*
$573M $631M
Pension Contributions $50M $68M
* Adjusted EPS from continuing operations and Manufacturing cash flow before pension contributions is a non-GAAP measure that is defined and reconciled to GAAP in our earnings release.

Textron Inc. Q4 2016 Earnings Call Presentation; January 25, 2017
Textron Consolidated Net Debt
($, millions)
5
YE 2016 YE 2015
Cash $1,298 $1,005
Finance Group Debt 903 913
Manufacturing Group Debt 2,777 2,697
Total Debt 3,680 3,610
Net Debt $2,382 $2,605

Textron Inc. Q4 2016 Earnings Call Presentation; January 25, 2017
6
Q4 2016 Sales Growth
Sales Growth
M&AImpact
Organic Growth
FX Impact Unfav./
(Fav.)
OrganicGrowth Before
FX
Textron Aviation (3.5%) (1.0%) (4.5%) - (4.5%)
Bell (14.3%) - (14.3%) - (14.3%)
Textron Systems 14.9% (2.2%) 12.7% - 12.7%
Industrial 3.8% (0.7%) 3.1% 0.9% 4.0%
Manufacturing (2.5%) (0.8%) (3.3%) 0.3% (3.0%)
Finance (10.0%) - (10.0%) - (10.0%)
Total Segments (2.5%) (0.8%) (3.3%) 0.2% (3.1%)

Textron Inc. Q4 2016 Earnings Call Presentation; January 25, 2017
7
Finance Segment Key Statistics
Q4 2016 Q3 2016
60+ Delinquency $40 $85
Non-accrual $87 $90
Finance Receivables $976 $1,013
Shareholders’ Equity $157 $161
($, millions)

Textron Inc. Q4 2016 Earnings Call Presentation; January 25, 2017
8
Outlook – Full Year, 2017
Adjusted EPS from Continuing Operations*
$2.50 - $2.70
Manufacturing Cash FlowBefore Pension Contributions*
$650M - $750M
Pension Contributions ~$55M
* Adjusted EPS from continuing operations and manufacturing cash flow before pension contributions are non-GAAP measures that are defined and reconciled to GAAP in our earnings release.

Textron Inc. Q4 2016 Earnings Call Presentation; January 25, 2017
9
Segment Outlook – Full Year, 2017
Segment Revenue Profitability
Textron Aviation
Inclusive of Scorpion~$5.0B
~8.0%*~7.0%*
Bell ~$3.3B ~11.0%
Textron Systems ~$1.9B ~8.5%*
Industrial ~$4.0B ~9.0%*
Finance ~$80M ~$20 million
* In 2017, financial reporting for the Scorpion program has been transitioned to the *iTextron Aviation segment and includes ~$50M of program expense for the year

Textron Inc. Q4 2016 Earnings Call Presentation; January 25, 2017
2017E 2016
Discount Rates 4.25% 4.75%
Total Pension Cost ~$81M $81M
Assumed Long-Term Rate of Return
7.75% 7.75%
Pension Contributions ~$55M $50M
Pension Outlook – Full Year, 2017
10
Textron Inc. Q4 2016 Earnings Call Presentation; January 25, 2017
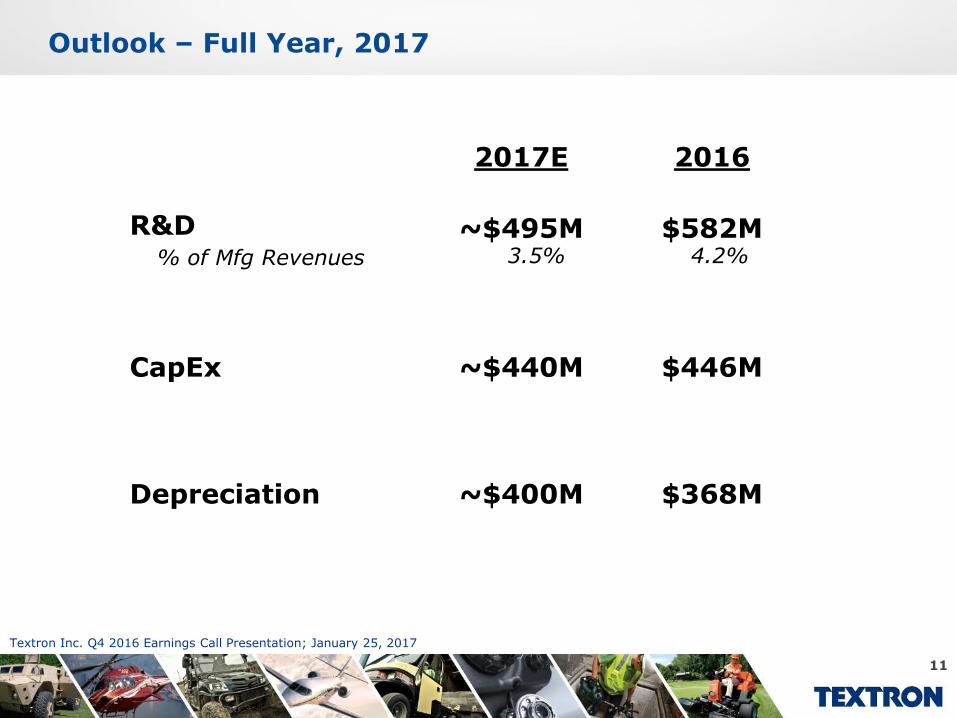
2017E 2016
R&D% of Mfg Revenues
~$495M3.5%
$582M4.2%
CapEx ~$440M $446M
Depreciation ~$400M $368M
Outlook – Full Year, 2017
11
Textron Inc. Q4 2016 Earnings Call Presentation; January 25, 2017
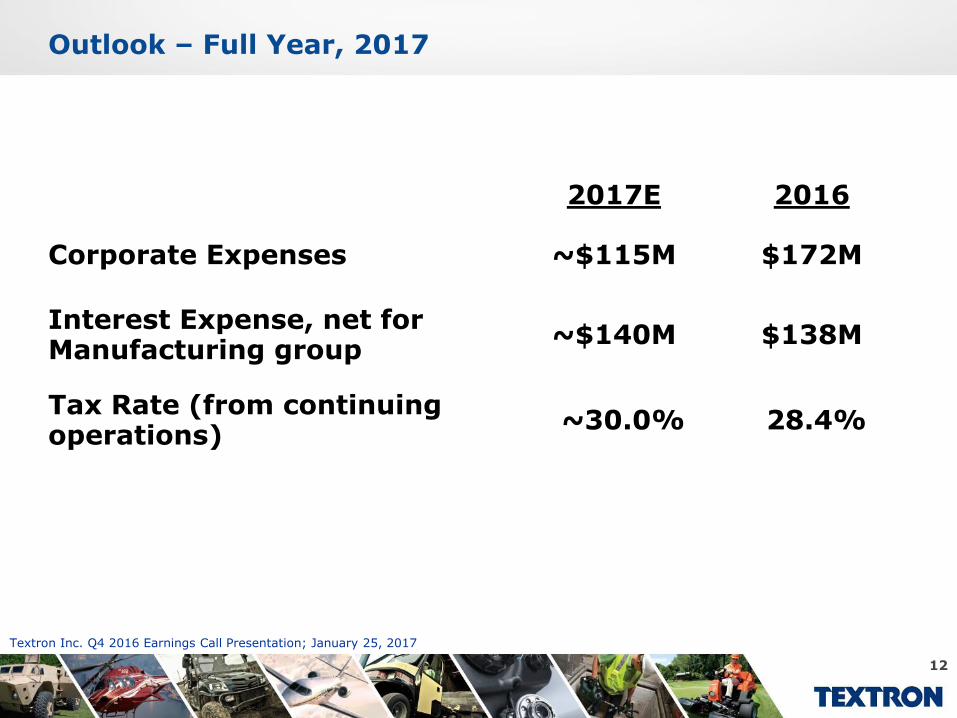
Outlook – Full Year, 2017
2017E 2016
Corporate Expenses ~$115M $172M
Interest Expense, net for Manufacturing group
~$140M $138M
Tax Rate (from continuing operations)
~30.0% 28.4%
12