q4 | 2019...q4 2019 shareholder letter 4 to our shareholders, 2019 was a year of tremendous growth...
TRANSCRIPT

Q4 | 2019 Shareholder Letter
Jennifer Shealy, Seller Graphic Designer and Digital Marketing Expert
Melbourne, FL

Q4 | 2019 Shareholder Letter 2
Fiverr is a global marketplace that connects buyers and sellers for digital services.
Our Mission
Changing How the World Works Together
On the cover:
JENNIFER SHEALY, Seller Graphic Designer and Digital Marketing Expert, Melbourne, FL
Jennifer Shealy has been a Fiverr seller since 2014. She has completed over 5,500 orders, worked with nearly 4,000 buyers from 100+ countries, and earned over $300K on the platform. Some of her most popular gigs® include website banner design, amazon product listing design, and social media campaigns for Facebook, Instagram and YouTube.
Jennifer is a natural self-starter and leader. After graduating from college with degrees in psychology and graphic design, Jennifer worked several corporate jobs before starting to develop her freelancing business. She tried multiple freelancing platforms at first, but only Fiverr provided her with the adequate guidance and support that helped her “put the pieces together” to grow a real business. She also managed to finish her MBA while working on Fiverr. Jennifer’s career really took off when she went full-time and became a Top Rated Seller on Fiverr in 2016. Today, Jennifer’s business on Fiverr continues to evolve with new products, such as being featured in the Political Campaign store and becoming a Studio Lead on Fiverr Studios. Her goal for growth in 2020 is to grow her Studio on Fiverr, collaborating with other sellers to offer more robust services to her clients.
“When I find something I love, I really put my heart into it and run with it. That’s how I got into Fiverr. I started little by little and built my business on Fiverr from the ground up. I have really evolved on Fiverr, from 15-20 hours a week to now a full-time Top Rated Seller. As my reputation on Fiverr grows, I was able to raise my gig price and work with larger clients on larger projects. It got to a point where Fiverr became my full time job.”
“You really changed my life, without a doubt. I’ve made more money on Fiverr than any other job I’ve ever had. The financial independence and the freedom to do what I love...it’s hard to explain how much that means to me.”

Q4 | 2019 Shareholder Letter 3
REVENUE (Y/Y GROWTH) ADJUSTED EBITDA MARGIN(1)
SPB ($)
NEW CATEGORIES INDUSTRY STORES
Each dot represents a transaction on Fiverr’s marketplace in 2019
2019 Highlights
ACTIVE BUYERS (Y/Y GROWTH)
Strong growth momentum continued throughout 2019
Accelerating active buyer growth with improving marketing efficiency
Significant progress on our path to profitability
Continue going upmarket with expanding wallet share
Continue to expand our Service-as-a-Product catalog
Strengthening our ecosystem with a portfolio of new products
Strong start of international expansion with new currencies and languages
100+ 7
(1) Adjusted EBITDA is a non-GAAP financial measure. See “Key Performance Metrics and Non-GAAP Financial Measure” for additional information regarding this and other non-GAAP metrics used in this release.

Q4 | 2019 Shareholder Letter 4
To Our Shareholders,2019 was a year of tremendous growth for Fiverr. Financially, we grew our top line by 42% y/y and improved our adjusted EBITDA(1) margin by nearly 1,100 basis points. Our active buyer base growth accelerated throughout the year and culminated in a strong finish to reach 2.4 million. Our strategy of going upmarket continued to pay off, reflected in the ongoing growth of spend per buyer to over $170. All of these milestones were achieved against a backdrop of consistent cohort behavior and increased marketing efficiency.
Strategically, we continued to expand the Fiverr ecosystem by launching an extensive portfolio of new products, led by Fiverr Studios and Fiverr’s Choice, which are transforming the industry. We grew our Service-as-a-Product catalog with the launch of over 100 new categories and seven industry stores and made significant strides in international expansion with new currencies and new languages. We launched new marketing campaigns, and made a significant contribution to growing our brand awareness and awareness of the industry as a whole.
As a company, we transitioned from the private to the public sector and started trading on the NYSE on June 13, 2019. We grew our team across product, marketing, finance, and operations, and expanded our footprint as a global company with new offices in Berlin, London, and Kyiv. We also strengthened our management team with the addition of a COO and promoted our long tenured VP of HR to CHRO. We believe that now, as a public company, we are well positioned for the next stage of our growth.
While we are thrilled by the incredible growth in 2019, the essence of Fiverr remains the same. Our mission to change how the world works together hasn’t changed. Our passion for our community hasn’t changed. Our focus on delivering the best customer experience and our purpose of providing a level playing field for skilled freelancers hasn’t changed. We continue to be a product company at our core, obsessed with perfecting every feature while not shying away from exploring big ideas. We continue to cherish a culture of doers - we are people with focus, drive, and creativity. And lastly, our commitment to execute our growth strategies, to pursue disciplined and consistent financial objectives, and to drive long-term shareholder value hasn’t changed.
2020 will mark Fiverr’s 10th anniversary and our first full year as a public company. Our business momentum is stronger than ever, and we are already off to a great start to the year. We have a compelling suite of products on our roadmap, which will set us up for the continued growth of our marketplace. We expect to continue to execute on category expansion and international expansion. We will also continue our efforts to grow larger customers and to expand our wallet share among our buyers. Furthermore, we will continue to strengthen our competitive advantage by investing in proprietary technology addressing quality, matching, and personalization.
The global freelancing market is huge, and we are still in the early days of this market transformation. The vast majority of freelancing still happens offline. We are just getting started and couldn’t be more excited about what’s ahead.
(1) See “Key Performance Metrics and Non-GAAP Financial Measure” for additional information regarding this and other non-GAAP metrics used in this release.

Q4 | 2019 Shareholder Letter 5
• Consistent execution through 2019 drove a strong finish to the year with Q4 revenue growth of 43% y/y, exceeding the top end of our guidance and accelerating for the 2nd consecutive quarter
• Both active buyers and spend per buyer accelerated to 17% y/y during the fourth quarter along with continued improvement in take rate to 26.7%
• Rolled out two localized websites in German and Spanish - the first time we enabled our buyers to complete a transaction in a non-English environment
• Successfully launched Fiverr Logo Maker that brings the power of artificial intelligence to Fiverr’s best creative talents
• Celebrated the 300 category milestone and opened new industry stores in Influencer, Real Estate and Podcasting
• Initiating strong guidance for 2020 with 30-32% revenue growth and continued progress towards profitability
FOURTH QUARTER AND FULL YEAR 2019 HIGHLIGHTS
TAKE RATE(1)
26.7% 100 bps y/y improvement
ACTIVE BUYERS(1)
2.4M17% y/y growth
SPEND PER BUYER(1)
$17017% y/y growth
GROSS MARGIN
GAAP NET LOSS
ADJUSTED EBITDA(1)
ADJUSTED EBITDA MARGIN(1)
Q4 2019
Q1 2020
FY 2019
FY 2020
$29.5 million43% y/y growth
$32.0-$33.0 million
($5.5)-($4.5)million
79.3% 80.8%
($7.4) million ($33.5) million
79.2% 81.0%
$107.1 million42% y/y growth
$139-$141 million
($15.0)-($13.0) million
GAAP NON-GAAP GAAP NON-GAAP
+840 bps y/y +1,100 bps y/y
35%-39% y/y growth 30%-32% y/y growth
REVENUE
REVENUE
ADJUSTED EBITDA
($3.3) million
(11.3%) (16.8%)
($18.0) million
FINANCIAL OUTLOOK
FOURTH QUARTER AND FULL YEAR 2019 KEY RESULTS
(1) See “Key Performance Metrics and Non-GAAP Financial Measure” for additional information regarding this and other non-GAAP metrics used in this release.

Q4 | 2019 Shareholder Letter 6
Growth Strategies and Recent ProgressUpdates regarding our key growth drivers and progress made in each area, as we continue to grow and capture market share, are detailed below.
#1 Bring new buyers onto the platform
In the year ended December 31, 2019, active buyers grew 17% y/y to 2.4 million, representing the fourth consecutive quarter of accelerating growth. Both organic and paid channels were strong during the quarter, and we continue to acquire the majority of our buyers through organic channels such as direct website traffic, non-paid search and referrals. Our buyer cohorts continued to deliver consistent performance, with repeat buyers contributing 58% of revenue on our core marketplace.
We continue to benefit from consistent behavior across all annual cohorts. As reflected in the chart on the sidebar, the aggregate spend of each cohort continued to stabilize after its inception year, contributing a consistent revenue stream from the second year onwards.
We measure our paid marketing efficiency through two metrics. The first is tROI, or time to return on investment, which measures the short-term efficiency of our paid marketing spend. tROI for our recent two quarters has performed extremely well, enabling us to recover all investments spent during those quarters in less than 4 months. It is worth noting that while tROI is one of the key considerations for our strategy and spend allocation, we also take into account factors such as marginal cost of acquisition, buyer lifetime value, channel distribution, and various cross-company strategic initiatives, in order to allocate our marketing resources.
The second measure for our paid marketing efficiency is the cumulative revenue to performance marketing investment ratio. As reflected in the chart below, as existing cohorts season over time, they continue to generate steady revenue streams which drives increasing return on marketing dollars. The resilient behavior of our cohorts continues to be driven by positive product experience, cross-category purchases, and expanding wallet share.
Cohorts:
CONSISTENT COHORT BEHAVIOR ON CORE MARKETPLACE WITH MAJORITY OF REVENUE FROM REPEAT BUYERS
Revenue composition by annual cohort 2010-2019

Q4 | 2019 Shareholder Letter 7
The improvement of our marketing efficiency was primarily driven by marketing automation, catalog expansion and channel diversification. The ongoing investments we make in automating our marketing engine has enabled us to respond to changing environment and optimize our campaigns super quickly. We are also capitalizing on our massive and growing catalog which enables us to serve both top and long-tail search queries. Lastly, our expansion into affiliates and social media channels this year has benefited us in driving down overall acquisition costs.
In 2019, we significantly grew our Affiliates program, which helped us expand our reach with tremendous cost efficiency. Our Affiliates program rewards website owners, social media influencers, content creators, promoters, or anyone who has access to an audience to spread the word about Fiverr. In 2019, the program nearly doubled its active partners. We also expanded the program to the U.K., Germany and Austria in conjunction with our international expansion efforts. Not only do affiliates bring new buyers to our platform, they often purchase a wide range of services on Fiverr such as blog content, graphics design and audio/video editing for their social media presence. Our recently opened Influencer industry store is designed to cater to their needs and has gained strong traction among these affiliate partners.
Some additional activities during the fourth quarter include:
• We asked our global design community to re-image several iconic album covers, such as Sgt. Pepper’s Lonely Hearts Club Band, Aladdin Sane, The Dark Side of the Moon and Born in the U.S.A., turning them into timeless works of art within the context of 2019. And the results are stunning! This is one of the coolest branding events we’ve run to showcase
CUMULATIVE REVENUE TO PERFORMANCE MARKETING INVESTMENT RATIOS
SGT. PEPPER’S LONELY HEARTS CLUB BAND
Designer trippiesteff’s retro riff on the Beatles’ Sgt. Pepper replaces the Fab Four’s 1967 panoply of ‘60s celebrities with today’s influencers including teenage climate-change activist Greta Thunberg and artists including Beyoncé, Kanye West and Kendrick Lamar.
INCREASING ROI FOR PERFORMANCE MARKETING INVESTMENTS AS COHORTS SEASON OVER TIME
As of December 31, 2019, the cumulative revenue from the Q1’17 cohort has reached 3.0x of our performance marketing investments for the first quarter of 2017, up from 2.9x as of September 30, 2019.

Q4 | 2019 Shareholder Letter 8
our community’s talent and it was well received with various media outlets such as Design Taxi, Creativebloq, Muse by Clio & The NME.
• In Q4’19, we hosted 61 community events across 19 cities in 5 countries, bringing the total number of events in 2019 to nearly 200. In addition to freelancing topics, we see an increase in buyer focused events where the latest trends in digital marketing, product and engineering, and entrepreneurship are being discussed.
• We recently partnered with market research company YouGov® to conduct a work perception study for the new decade. The results show that over a quarter of today’s U.S. working population currently work as freelancers or have done so in the past. Freelancing is most popular among millennials, with nearly 6 in 10 millennials either currently freelancing or open to the idea.
#2 Go upmarket
In the year ended December 31, 2019, spend per buyer on our platform increased 17% y/y to $170, demonstrating our continued progress towards moving upmarket. High-value buyers, those with annual spend per buyer over $500, continued to grow from the previous quarter and now represent over 53% of core marketplace revenue. Strong results were driven by both the increase in spending from our existing buyers, as well as our paid marketing strategy, which increasingly targets buyers with higher lifetime value.
Fiverr’s VID program, which stands for Very Important Doers, is one of the efforts in which we continue to invest to grow high-value buyers and their spend on the platform. Through a hybrid approach of automated CRM activities and personalized service, the program offers our most active buyers special promotions and discounts, business content and educational materials, and in some cases access to a dedicated team of success managers. The program was launched in April 2018 and has grown and matured throughout 2019. We’ve seen meaningful increase in spend among VID buyers after joining the program, and more importantly, these buyers increasingly contribute feedback that helps us improve our product, engage our buyer community and grow Fiverr’s presence across social media. VID program will continue to be an area of investment for 2020.
COCONUT GRASS - VID PROGRAM
Coconutgrass is a small e-commerce company that sells home goods with unique and personalized designs. It runs its own website and operates a Shopify and Etsy store as well. Coconutgrass uses Fiverr for a wide range of services including logo design, illustration, packaging design, photoshop editing and product photography, to name a few.
‘MARKETING WITH TIKTOK’ Coral Gables, FL
In one of Fiverr’s ‘Leveling Up’ workshop series, marketing expert Carlos Vazquez shared everything you need to know to break into the TikTok platform.

Q4 | 2019 Shareholder Letter 9
#3 Expand our Gig catalog
One of Fiverr’s key competitive moats is our comprehensive Service-as-a-Product catalog. Most traditional freelancing solutions focus on matching at the talent level, thus lacking the granularity and transparency regarding the scope, quality, style, and pricing of the project itself. On Fiverr, our gig-level catalog ensures that businesses can find not only a quality freelancer, but also someone who is qualified for the specific project. After all, a financial journalist is not the most relevant candidate for updating your fashion blog, and a movie director might not be able to create the most viral TikTok video for your business. Fiverr is able to create this expansive and granular catalog based on nearly 10 years of know-how, transaction data, continuous buyer and seller feedback, and dedicated vertical teams with domain expertise
Today, Fiverr’s catalog spans over 300 categories across 8 verticals. We added over 100 new categories in 2019 alone. The categories we launched in 2019, supporting Gaming and Real Estate industry stores, enabled us to expand our total market opportunity and to address buyer demand not previously met on Fiverr. Other new categories such as those opened for podcasts are helping us become more granular in the Music & Audio vertical, driving better matching and conversion. We also opened seven industry stores throughout the year to aggregate services across multiple categories for buyers within specific industries. Politics, Influencers, Real Estate, and Podcasting are four of the newest industry stores.
Lastly, we launched Fiverr Discover, a beautiful destination site showcasing the outstanding designs our sellers made for our buyers through our platform. Customers use this site to look for inspiration for their projects on hand, or to get a taste of the style of sellers to find the perfect match. Fiverr Discover demonstrates the power of our end-to-end transaction platform - not only do we connect buyers and sellers, the entire workflow happens on Fiverr including the final deliverables. Since launch, we’ve seen these pages improve engagement and purchase considerations on the buyer journey, and improve top of funnel by creating additional catalog pages.
#4 Innovate technology and services
We are a technology company at our core. Nearly 40% of our total headcount makes up our product and engineering organization, and we constantly strive to innovate our platform. In 2019, we rolled out over 200 major product releases internally, an average of about one every two days. These new products range from
FIVERR DISCOVER
Inspirational content on Fiverr Discover creates additional touchpoints for buyers and sellers to connect, which leads to better engagement, brand perception, and ultimately purchase consideration.
POLITICS STORE
Fiverr launched Politics Store ahead of the 2020 elections, providing consultants quality services such as political advertising and branding, speechwriting, video and animation and voiceover.

Q4 | 2019 Shareholder Letter 10
big initiatives such as Fiverr’s Choice and Fiverr Studios to improvements throughout the platform, such as gig listing pages or search filters, search and recommendation algorithms, and back-end platform infrastructure. Being a customer obsessed company, we are constantly thinking about how to improve our buyer experience throughout the buyer journey. That’s the magic that continuously drives the engagement, stickiness and loyalty of our buyer and seller community.
A few days ago, we launched another revolutionary product - Fiverr Logo Maker, bringing the power of artificial intelligence to Fiverr’s best creative talent. At Fiverr, we believe artificial intelligence should not replace human talent, but rather free human talent from repetitive and undesirable work so that people can focus on critical thinking and creativity. With that in mind, we launched a first-of-its-kind Logo Maker that allows graphic designers on our platform to monetize their existing designs, deliver their work faster, and serve more customers. Once a logo is purchased, Logo Maker buyers can download dozens of branding files to be used across different media within seconds, all generated through the power of AI. They can also order from the original designer extra modifications and enhancement that are not possible through the software. We believe Logo Maker can help the best designers on our platform to earn more money, and we also expect incremental conversion benefits on our marketplace given the instantly gratifying experience that it brings to our buyers.
Fiverr’s Choice continued to show positive impact on conversion, cancelled orders and buyer ratings on our marketplace. We also observed this impact to be particularly meaningful among high value buyers and buyers with larger spending capacity, such as those in developed countries. In Q4, we expanded Fiverr’s Choice to our mobile app, with design and browse experience tailored to fit the smaller screen. Currently about one third of our marketplace has been exposed to Fiverr’s Choice, and we expect additional impact from Fiverr’s Choice as we roll it out to the rest of the marketplace.
Lastly, we want to give you an update on promoted listings. We have been testing the product internally for a while, and we are planning to launch the beta version in April. This will be the first time we give our sellers a tool to proactively promote themselves on our platform - it is something our sellers have requested for a long time. In the beginning, we are going to launch it in a handful of categories and the beta version of the product will take a streamlined approach in order to drive adoption.
FIVERR LOGO MAKER
The AI-powered authoring tool enhances the productivity of Fiverr’s creative seller community, while allowing businesses to rapidly personalize and customize the perfect logo.
FIVERR’S CHOICE
Fiverr’s Choice recommends highly related Gigs that are trusted based on quality and delivery.

Q4 | 2019 Shareholder Letter 11
#5 Expand our geographic footprint
We continue to invest in international expansion in both product and marketing. On the product side, during Q4, we completed the initial phase of a significant upgrade to our technology infrastructure that will set us up for multilingual support and full localization of our platform down the road. Essentially, work done in English can automatically be translated into local languages which will then be pushed onto the system in a seamless manner.
Following the infrastructure upgrade, we recently launched two localized websites, de.fiverr.com and es.fiverr.com, in German and Spanish respectively. Buyers can now navigate from the home page, category page and gig page to order checkout, payment and resolution center, in their preferred language setting. We are very excited about this rollout, as this is the first time we enable our buyers to complete a transaction in a non-English environment. We believe that not only will this allow us to provide better buyer experience, it will also help drive more efficient buyer acquisition and conversion. In addition to buyer experience, we are also exploring and planning to fully localize user generated content including gig content as well. We expect localization to be a long-term investment for us.
On the marketing side, we continued to be active in Germany, with additional out-of-home marketing campaigns in Hamburg. We are also partnering with some German influencers to generate organic content which has been effective in driving brand traffic. In the U.K., we recently ran several stages of out-of-home campaigns in London across underground stations and double-decker buses, and we are starting to see impact of these efforts in driving U.K. traffic and new buyer acquisition.
We are in the very early stage of our long-term international expansion effort. With the encouraging signals we’ve seen from the initial efforts in 2019, we are more convinced that there is a huge opportunity across many non-English speaking countries. As we start to roll out localized websites and build out local marketing automation engines in 2020, we look forward to further unlocking these opportunities.
FIVERR IN LONDON
We are featured on hundreds of double-decker buses and at 70+ underground and rail stations across London.
ES.FIVERR.COM
Fiverr launched its localized Spanish website to provide Spanish speaking buyers with a more tailored experience.

Q4 | 2019 Shareholder Letter 12
Financial DiscussionOur fourth quarter 2019 results demonstrate strong top line growth and continued bottom line improvement. We grew revenue by 43% year over year, and our adjusted EBITDA margin improved by 840 bps compared to the fourth quarter of 2018. Unless otherwise noted, all comparisons are on a year-over-year basis.
Revenue
Revenue for Q4 was $29.5 million, up 43% from $20.7 million, driven by continued growth in both active buyers and spend per buyer. The year-over-year growth also benefited from the increase of our take rate, which grew to 26.7% for the 12 months ended December 31, 2019 from 25.7% for the 12 months ended December 31, 2018. Revenue during the quarter continued to be highly diversified, with no buyer contributing more than 1% of revenue, and no single category accounting for more than 15% of total revenue on core marketplace.
Active buyers
Our active buyer base has consistently grown over time, and Q4 was no different. In Q4 2019 our active buyers reached 2.4 million, representing 17% y/y growth. Our robust active buyer growth was driven by consistent cohort behavior and efficient marketing investments. We also continue to focus on higher lifetime value customers by targeting buyers with larger budgets.
Spend per buyer
The second driver of our revenue growth is the annual spend per buyer, or SPB. In Q4 2019 SPB grew to $170, up 17% y/y from $145. SPB is an indicator of our buyers’ purchasing patterns and is impacted by the number of active buyers, buyers purchasing across multiple categories, average price per purchase, and our ability to acquire buyers with a higher lifetime value.
Take rate
For the 12 months ended December 31, 2019 our take rate was 26.7%, an increase of 100 bps y/y. We believe that our industry-leading take rate reflects the value our platform delivers to both buyers and sellers. The increase in our take rate was driven by the continued growth of back-office software subscriptions, e-learning courses and content marketing subscriptions.

Q4 | 2019 Shareholder Letter 13
Gross Profit and Margin
Gross profit on a GAAP basis for Q4’19 was $23.4 million, up 40% from $16.7 million in Q4’18. Gross margin was 79.3% down from 80.6% in Q4’18. Non-GAAP gross margin was 80.8% in Q4’19, decreasing 130 bps from 82.1% in Q4’18. The reduction in gross margin was primarily driven by the growth of our content marketing subscriptions business, which has a higher take rate but lower gross margin compared to our overall marketplace.
Operating Expenses
Total operating expenses on a GAAP basis were $31.5 million in Q4’19, compared to $22.8 million in Q4’18. Non-GAAP operating expenses were $27.2 million, or 92.0% of revenue, compared to $21.1 million, or 101.8% of revenue. The improvement in operating leverage represents greater efficiency as a result of our scale, disciplined expense control, and increased marketing efficiency, partially offset by increased accounting costs and expenses related to us operating as a public company.
Research and development (R&D) expenses on a GAAP basis were $9.3 million, or 31.6% of revenue in Q4’19. Non-GAAP research and development expenses were $8.4 million, or 28.4% of revenue, compared to 31.5% in the prior year period. We continue to invest in improving user experience with initiatives such as logo maker, localization project in the international expansion area, mobile web and mobile app and category expansion. In addition, Fiverr opened a new site in Kyiv, in order to support the research and development task growth.
Sales and marketing (S&M) expenses on a GAAP basis were $15.7 million, or 53.0% of revenue in Q4’19. Non-GAAP sales and marketing expenses were $14.5 million, or 49.1% of revenue in Q4’19, compared to 54.8% in the prior year period. We continued to gain significant sales and marketing leverage during the quarter driven by buyer conversion, channel diversification and continued strong execution, which demonstrates our ability to drive marketing efficiency at scale, and our commitment to achieving profitability.
General and administrative (G&A) expenses were $6.5 million, or 22.0% of revenue, on a GAAP basis, and $4.3 million, or 14.6% of revenue, on a non-GAAP basis in Q4’19, compared to 20.4% and 15.5% in Q4’18, respectively. The increase was was primarily driven by an increase in accounting, legal and insurance expenses related to being a public company.

Q4 | 2019 Shareholder Letter 14
Our outlook reflects the continued growth momentum of our business and progress toward profitability. We expect to continue benefiting from our consistent cohort behavior and strong momentum in both organic and paid acquisition channels to drive growth of active buyers. We believe our investments in category expansion, quality, and product innovation will continue to help us expand spend per buyer and increase high value buyers. We expect our take rate to be sustainable with modest upside as we continue to enhance our product offerings to our buyers and sellers. We expect to maintain gross margin at current level, and continue to drive operating leverage through growth of revenue, improving marketing efficiency and disciplined expense control.
Q1 2020 FY 2020
REVENUE $32.0 - $33.0 million $139 - $141 million
y/y growth 35% - 39% 30% - 32%
ADJUSTED EBITDA ($5.5) - ($4.5) million ($15.0) - ($13.0) million
Net Loss and Adjusted EBITDA
Net loss on a GAAP basis in Q4’19 was ($7.4) million, compared to ($5.9) million. Adjusted EBITDA was ($3.3) million, or (11.3%) of revenue in Q4 2019, compared to ($4.1) million or (19.7%) in the prior year period. The improved EBITDA margin was driven by improved leverage in operating expenses. We are making steady progress on our path to profitability and continue to demonstrate cost discipline and Adjusted EBITDA leverage, as compared to last year.
Financial OutlookOur outlook for the first quarter and full year 2020 is as follows:

Q4 | 2019 Shareholder Letter 15
Conference Call DetailsWe will host a conference call to discuss our financial results on Wednesday, February 19, 2020 at 8:30 a.m. Eastern Time. A live webcast of the call can be accessed from Fiverr’s Investor Relations website. An archived version will be available on the website after the call. Investors and analysts can participate in the conference call by dialing (866) 360-3590, or (412) 317-5278 for callers outside the United States, and mention the passcode, “Fiverr.” A telephonic replay of the conference call will be available until Wednesday, February 26, 2020, beginning one hour after the end of the conference call. To listen to the replay please dial (877) 344-7529, or (412) 317-0088 for callers outside the United States, and enter replay code 10138270.
Micha Kaufman Ofer Katz Chief Executive Officer Chief Financial Officer
INVESTOR [email protected]

Q4 | 2019 Shareholder Letter 16
CONSOLIDATED BALANCE SHEETS(In thousands)CONSOLIDATED BALANCED SHEETS(in thousands)
December 31, December 31,2019 2018
(Unaudited) (Audited)AssetsCurrent assets:Cash and cash equivalents 24,171$ 55,955$ User funds 55,945 39,736 Bank deposits 15,000 - Restricted deposit 324 327 Marketable securities 88,559 - Other receivables 3,117 776
Total current assets 187,116 96,794
Marketable securities 21,805 - Property and equipment, net 5,321 5,143 Intangible assets, net 7,188 4,065 Goodwill 11,240 1,381 Restricted deposit 3,168 3,191 Other non-current assets 522 456
Total assets 236,360$ 111,030$
Liabilities and Shareholders' EquityCurrent liabilities:Trade payables 3,749$ 3,364$ User accounts 53,013 39,736 Deferred revenue 3,248 - Other account payables and accrued expenses 21,426 10,231 Current maturities of long-term loan 503 445
Total current liabilities 81,939 53,776
Long-term loan and other non-current liabilities 5,612 3,280
Total liabilities 87,551 57,056
Shareholders' equity:Share capital and additional paid-in capital 306,334 178,164 Accumulated deficit (157,763) (123,592) Accumulated other comprehensive income (loss) 238 (598)
Total shareholders' equity 148,809 53,974 Total liabilities and shareholders' equity 236,360$ 111,030$

Q4 | 2019 Shareholder Letter 17
CONSOLIDATED STATEMENTS OF OPERATIONS(In thousands, except loss per share data)
CONSOLIDATED STATEMENTS OF OPERATIONS(in thousands, except loss per share data)
2019 2018 2019 2018(Unaudited) (Audited)
Revenue 29,531$ 20,705$ 107,073$ 75,503$ Cost of revenue 6,120 4,018 22,224 15,621 Gross profit 23,411 16,687 84,849 59,882
Operating expenses:Research and development 9,322 6,855 34,483 26,035 Sales and marketing 15,663 11,681 62,750 49,720 General and administrative 6,495 4,233 22,366 20,596 Total operating expenses 31,480 22,769 119,599 96,351 Operating loss (8,069) (6,082) (34,750) (36,469) Financial income, net 684 199 1,371 408 Loss before income taxes (7,385) (5,883) (33,379) (36,061) Income taxes (54) - (160) - Net loss (7,439)$ (5,883)$ (33,539)$ (36,061)$ Deemed dividend to protected ordinary shareholders - - (632) - Net loss attributable to ordinary shareholders (7,439)$ (5,883)$ (34,171)$ (36,061)$ Basic and diluted net loss per share attributable to ordinary shareholders (0.23)$ (0.84)$ (1.67)$ (5.42)$ Basic and diluted weighted average ordinary shares 31,900 7,017 20,504 6,648
(Unaudited)
Three Months Ended Year EndedDecember 31, December 31,

Q4 | 2019 Shareholder Letter 18
CONSOLIDATED STATEMENTS OF CASH FLOWS(In thousands)
CONSOLIDATED STATEMENTS OF CASH FLOWS(in thousands)
2019 2018 2019 2018(Unaudited) (Audited)
Operating ActivitiesNet loss (7,439)$ (5,883)$ (33,539)$ (36,061)$ Adjustments to reconcile net loss to net cash used in operating activities:Depreciation and amortization 893 609 3,571 2,250 Amortization of discount on marketable securities (430) - (988) - Shared-based compensation 2,337 1,293 8,899 11,648 Loss from disposal of property plant and equipment, net - 26 - 26 Net loss (gain) from exchange rate fluctuations (67) (101) 65 (77) Changes in assets and liabilities:User funds (1,245) (39,736) (16,209) (39,736) Other receivables (232) 546 (1,583) (143) Trade payables 1,750 (211) 240 808 User accounts (1,687) (953) 13,277 7,542 Deferred revenue 3,248 - 3,248 - Other account payables and accrued expenses (372) (80) 8,677 1,937 Non-current liabilities 336 (64) 398 130 Net cash used in operating activities (2,908) (44,554) (13,944) (51,676)
Investing ActivitiesAcquisition of business, net of cash acquired - - (9,967) (2,676) Purchase of property and equipment (181) (160) (1,016) (767) Capitalization of internal-use software (216) (184) (739) (830) Other receivables and non-current assets (29) (27) (40) (142) Bank deposits 5,000 30,000 (15,000) 30,000 Restricted deposit - 542 - 482 Investment in marketable securities (69,954) - (214,306) - Proceeds from sale of marketable securities 69,993 - 104,990 - Net cash provided by (used in) investing activities 4,613 30,171 (136,078) 26,067
Financing ActivitiesProceeds from exercise of options 200 570 773 1,240 Proceeds from initial public o�ering, net (452) - 113,350 - Proceeds from issuance of protected ordinary shares, net - 53,069 4,340 53,069 Repayment of long-term loan (123) (94) (470) (421) Net cash provided by (used in) financing activities (375) 53,545 117,993 53,888
E�ect of exchange rate fluctuations on cash and cash equivalents 100 (23) 245 (190)
Increase (decrease) in cash and cash equivalents 1,430 39,139 (31,784) 28,089 Cash and cash equivalents at the beginning of period 22,741 16,816 55,955 27,866 Cash and cash equivalents at the end of period 24,171$ 55,955$ 24,171$ 55,955$
(Unaudited)
Three Months Ended Year EndedDecember 31, December 31,
CONSOLIDATED STATEMENTS OF OPERATIONS(in thousands, except loss per share data)
2019 2018 2019 2018(Unaudited) (Audited)
Revenue 29,531$ 20,705$ 107,073$ 75,503$ Cost of revenue 6,120 4,018 22,224 15,621 Gross profit 23,411 16,687 84,849 59,882
Operating expenses:Research and development 9,322 6,855 34,483 26,035 Sales and marketing 15,663 11,681 62,750 49,720 General and administrative 6,495 4,233 22,366 20,596 Total operating expenses 31,480 22,769 119,599 96,351 Operating loss (8,069) (6,082) (34,750) (36,469) Financial income, net 684 199 1,371 408 Loss before income taxes (7,385) (5,883) (33,379) (36,061) Income taxes (54) - (160) - Net loss (7,439)$ (5,883)$ (33,539)$ (36,061)$ Deemed dividend to protected ordinary shareholders - - (632) - Net loss attributable to ordinary shareholders (7,439)$ (5,883)$ (34,171)$ (36,061)$ Basic and diluted net loss per share attributable to ordinary shareholders (0.23)$ (0.84)$ (1.67)$ (5.42)$ Basic and diluted weighted average ordinary shares 31,900 7,017 20,504 6,648
(Unaudited)
Three Months Ended Year EndedDecember 31, December 31,
Q4 | 2019 Shareholder Letter 19
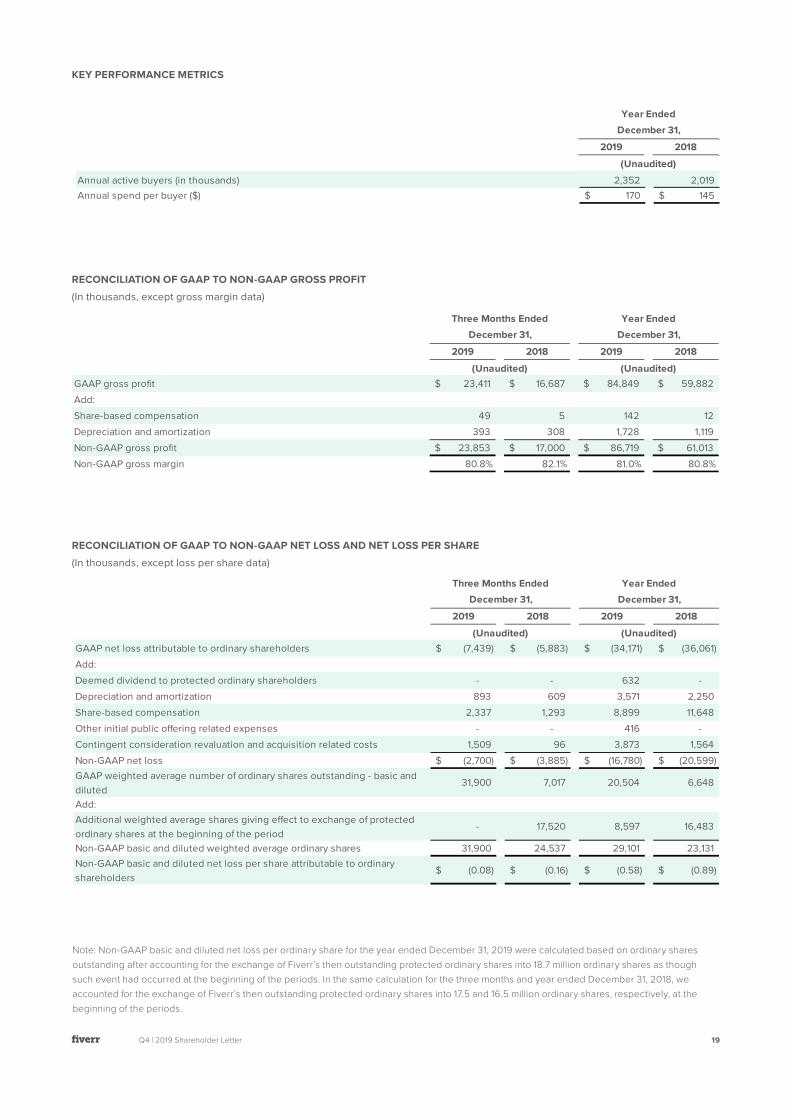
KEY PERFORMANCE METRICS
RECONCILIATION OF GAAP TO NON-GAAP NET LOSS AND NET LOSS PER SHARE(In thousands, except loss per share data)
Note: Non-GAAP basic and diluted net loss per ordinary share for the year ended December 31, 2019 were calculated based on ordinary shares outstanding after accounting for the exchange of Fiverr’s then outstanding protected ordinary shares into 18.7 million ordinary shares as though such event had occurred at the beginning of the periods. In the same calculation for the three months and year ended December 31, 2018, we accounted for the exchange of Fiverr’s then outstanding protected ordinary shares into 17.5 and 16.5 million ordinary shares, respectively, at the beginning of the periods.
RECONCILIATION OF GAAP TO NON-GAAP GROSS PROFIT(In thousands, except gross margin data)
KEY PERFORMANCE METRICS(Unaudited)
2019 2018
Annual active buyers (in thousands) 2,352 2,019 Annual spend per buyer ($) 170$ 145$
Year EndedDecember 31,
(Unaudited)
RECONCILIATION OF GAAP TO NON-GAAP GROSS PROFIT(in thousands, except gross margin data)
2019 2018 2019 2018
GAAP gross profit 23,411$ 16,687$ 84,849$ 59,882$ Add:Share-based compensation 49 5 142 12 Depreciation and amortization 393 308 1,728 1,119 Non-GAAP gross profit 23,853$ 17,000$ 86,719$ 61,013$ Non-GAAP gross margin 80.8% 82.1% 81.0% 80.8%
Three Months Ended Year Ended
(Unaudited)(Unaudited)
December 31, December 31,
RECONCILIATION OF GAAP TO NON-GAAP NET LOSS AND NET LOSS PER SHARE
(in thousands, except loss per share data)
2019 2018 2019 2018
GAAP net loss attributable to ordinary shareholders (7,439)$ (5,883)$ (34,171)$ (36,061)$ Add:Deemed dividend to protected ordinary shareholders - - 632 - Depreciation and amortization 893 609 3,571 2,250 Share-based compensation 2,337 1,293 8,899 11,648 Other initial public o�ering related expenses - - 416 - Contingent consideration revaluation and acquisition related costs 1,509 96 3,873 1,564 Non-GAAP net loss (2,700)$ (3,885)$ (16,780)$ (20,599)$ GAAP weighted average number of ordinary shares outstanding - basic and diluted
31,900 7,017 20,504 6,648
Add:Additional weighted average shares giving e�ect to exchange of protected ordinary shares at the beginning of the period
- 17,520 8,597 16,483
Non-GAAP basic and diluted weighted average ordinary shares 31,900 24,537 29,101 23,131 Non-GAAP basic and diluted net loss per share attributable to ordinary shareholders
(0.08)$ (0.16)$ (0.58)$ (0.89)$
Three Months Ended Year EndedDecember 31, December 31,
(Unaudited)(Unaudited)
RECONCILIATION OF GAAP NET LOSS TO ADJUSTED EBITDA(in thousands, except adjusted EBITDA margin data)
2019 2018 2019 2018
GAAP net loss (7,439)$ (5,883)$ (33,539)$ (36,061)$ Add:Financial income, net (684) (199) (1,371) (408) Income taxes 54 - 160 - Depreciation and amortization 893 609 3,571 2,250 Share-based compensation 2,337 1,293 8,899 11,648 Other initial public o�ering related expenses - - 416 - Contingent consideration revaluation and acquisition related costs 1,509 96 3,873 1,564 Adjusted EBITDA (3,330)$ (4,084)$ (17,991)$ (21,007)$ Adjusted EBITDA margin (11.3%) (19.7%) (16.8%) (27.8%)
Three Months Ended Year EndedDecember 31, December 31,
(Unaudited)(Unaudited)

Q4 | 2019 Shareholder Letter 20
RECONCILIATION OF GAAP TO NON-GAAP OPERATING EXPENSES(In thousands)
RECONCILIATION OF GAAP NET LOSS TO ADJUSTED EBITDA(in thousands, except adjusted EBITDA margin data)
RECONCILIATION OF GAAP TO NON-GAAP OPERATING EXPENSES(in thousands)
2019 2018 2019 2018
GAAP research and development 9,322$ 6,855$ 34,483$ 26,035$ Less:Share-based compensation 811 198 3,197 731 Depreciation and amortization 126 95 454 411 Acquisition related costs - 48 106 750 Non-GAAP research and development 8,385$ 6,514$ 30,726$ 24,143$
GAAP sales and marketing 15,663$ 11,681$ 62,750$ 49,720$ Less:Share-based compensation 488 126 1,853 1,480 Depreciation and amortization 325 155 1,212 555 Acquisition related costs 363 48 1,436 749 Non-GAAP sales and marketing 14,487$ 11,352$ 58,249$ 46,936$
GAAP general and administrative 6,495$ 4,233$ 22,366$ 20,596$ Less:Share-based compensation 989 964 3,707 9,425 Depreciation and amortization 49 51 177 165 Other initial public o�ering related expenses - - 416 - Contingent consideration revaluation and acquisition related costs 1,146 - 2,331 65 Non-GAAP general and administrative 4,311$ 3,218$ 15,735$ 10,941$
(Unaudited)(Unaudited)
Three Months Ended Year EndedDecember 31, December 31,
RECONCILIATION OF GAAP NET LOSS TO ADJUSTED EBITDA(in thousands, except adjusted EBITDA margin data)
2019 2018 2019 2018
GAAP net loss (7,439)$ (5,883)$ (33,539)$ (36,061)$ Add:Financial income, net (684) (199) (1,371) (408) Income taxes 54 - 160 - Depreciation and amortization 893 609 3,571 2,250 Share-based compensation 2,337 1,293 8,899 11,648 Other initial public o�ering related expenses - - 416 - Contingent consideration revaluation and acquisition related costs 1,509 96 3,873 1,564 Adjusted EBITDA (3,330)$ (4,084)$ (17,991)$ (21,007)$ Adjusted EBITDA margin (11.3%) (19.7%) (16.8%) (27.8%)
Three Months Ended Year EndedDecember 31, December 31,
(Unaudited)(Unaudited)

Q4 | 2019 Shareholder Letter 21
Key Performance Metrics and Non-GAAP Financial Measures This shareholder letter includes certain key performance metrics and financial measures not based on GAAP, including Adjusted EBITDA, Adjusted EBITDA margin, Non-GAAP gross profit, Non-GAAP gross margin, Non-GAAP operating expenses, Non-GAAP net loss and Non-GAAP net loss per share as well as operating metrics, including GMV, active buyers, spend per buyer, take rate and Some amounts in this release may not total due to rounding. All percentages have been calculated using unrounded amounts..
We define GMV or Gross Merchandise Value as the total value of transactions through our platforms, excluding value added tax, goods and services tax, service chargebacks and refunds. Active buyers on any given date are defined as buyers who have ordered a Gig on Fiverr within the last 12-month period, irrespective of cancellations. Spend per buyer on any given date is calculated by dividing our GMV within the last 12-month period by the number of active buyers as of such date. Take rate is revenue for any such period divided by GMV for the same period.
We define tROI or Time to Return On Investment as the number of months required to recover performance marketing investments during a particular period of time from the revenue generated by the new buyers acquired during that period. We use tROI to measure the efficiency of our buyer acquisition strategy. Performance marketing investments in new buyer acquisition is determined by aggregating online advertising spend across various channels, including search engine optimization, search engine marketing, video and social media used for buyer acquisition. Our performance marketing investments exclude certain fixed costs, including out of home advertising and fixed labor costs. Our performance marketing investment differs from sales and marketing expenses presented in accordance with GAAP and should not be considered as an alternative to sales and marketing expenses. Our performance marketing investment has limitations as an analytical tool, including that it does not reflect certain expenditures necessary to the operation of our business, and should not be considered in isolation. Certain fixed costs are excluded from performance marketing investments and related tROl calculations because performance marketing investments represent our direct variable costs related to buyer acquisition and its corresponding revenue generation. tROl measures the efficiency of such variable marketing investments and is an indicator actively used by management to make day-to-day operational decisions.
Management and our board of directors use these metrics as supplemental measures of our performance that is not required by, or presented in accordance with GAAP because they assist us in comparing our operating performance on a consistent basis, as they remove the impact of items not directly resulting from our core operations. We also use these metrics for planning purposes, including the preparation of our internal annual operating budget and financial projections, to evaluate the performance and effectiveness of our strategic initiatives and to evaluate our capacity to and capital expenditures and expand our business.
Adjusted EBITDA, Adjusted EBITDA margin, Non-GAAP gross profit, Non-GAAP gross margin, Non-GAAP operating expenses, Non-GAAP net loss and Non-GAAP net loss per share as well as operating metrics, including GMV, active buyers, spend per buyer, take rate and tROI should not be considered in isolation, as an alternative to, or superior to net loss, revenue, cash flows or other performance measure derived in accordance with GAAP. These metrics are frequently used by analysts, investors and other interested parties to evaluate companies in our industry. Management believes that the presentation of non-GAAP metrics is an appropriate measure of operating performance because they eliminate the impact of expenses that do not relate directly to the performance of our underlying business.
These non-GAAP metrics should not be construed as an inference that our future results will be unaffected by unusual or other items. Additionally, Adjusted EBITDA and other non-GAAP metrics used herein are not intended to be a measure of free cash flow for management’s discretionary use, as they do not reflect our tax payments and certain other cash costs that may recur in the future, including, among other things, cash requirements for costs to replace assets being depreciated and amortized. Management compensates for these limitations by relying on our GAAP results in addition to using Adjusted EBITDA and other non-GAAP metrics as supplemental measures of our performance. Our measure of Adjusted EBITDA and other non-GAAP metrics used herein is not necessarily comparable to similarly titled captions of other companies due to different methods of calculation.
We are not able to provide a reconciliation of Adjusted EBITDA guidance for the first quarter of 2020 or the fiscal year 2020 to net loss, the comparable GAAP measure, because certain items that are excluded from Adjusted EBITDA cannot be reasonably predicted or are not in our control. In particular, we are unable to forecast the timing or magnitude of share based compensation, amortization of intangible assets and gain or loss on revaluation of contingent consideration, as applicable without unreasonable efforts, and these items could significantly impact, either individually or in the aggregate, net loss in the future.
See the tables of above regarding reconciliations of these non-GAAP measures to the most directly comparable GAAP measures.

Q4 | 2019 Shareholder Letter 22
Forward Looking Statements This shareholder letter contains forward-looking statements within the meaning of the Private Securities Litigation Reform Act of 1995. All statements contained in this shareholder letter that do not relate to matters of historical fact should be considered forward-looking statements, including, without limitation, statements regarding our expected financial performance and operational performance for the first quarter of 2020, and the fiscal year ended December 31, 2020, as well as statements that include the words “expect,” “intend,” “plan,” “believe,” “project,” “forecast,” “estimate,” “may,” “should,” “anticipate” and similar statements of a future or forward-looking nature. These forward-looking statements are based on management’s current expectations. These statements are neither promises nor guarantees, but involve known and unknown risks, uncertainties and other important factors that may cause actual results, performance or achievements to be materially different from any future results, performance or achievements expressed or implied by the forward-looking statements, including, but not limited to: our ability to attract and retain a large community of buyers and freelancers; our ability to achieve profitability; our ability to maintain and enhance our brand; our dependence on the continued growth and expansion of the market for freelancers and the services they offer; our ability to maintain user engagement on our website and to maintain and improve the quality of our platform; our dependence on the interoperability of our platform with mobile operating systems that we do not control; our ability and the ability of third parties to protect our users’ personal or other data from a security breach and to comply with laws and regulations relating to consumer data privacy and data protection; our ability to detect errors, defects or disruptions in our platform; our ability to comply with the terms of underlying licenses of open source software components on our platform; our ability to expand into markets outside the United States; our ability to achieve desired operating margins; our compliance with a wide variety of U.S. and international laws and regulations; our ability to protect our intellectual property rights and to successfully halt the operations of copycat websites or misappropriation of data; our reliance on Amazon Web Services; our ability to mitigate payment and fraud risks; our dependence on relationships with payment partners, banks and disbursement partners; our dependence on our senior management and our ability to attract new talent; and the other important factors discussed under the caption “Risk Factors” in our final prospectus under Rule 424(b) filed with the U.S. Securities and Exchange Commission (“SEC”) on June 12, 2019 in connection with our initial public offering as such factors may be updated from time to time in our other filings with the SEC, which are accessible on the SEC’s website at www.sec.gov. In addition, we operate in a very competitive and rapidly changing environment. New risks emerge from time to time. It is not possible for our management to predict all risks, nor can we assess the impact of all factors on its business or the extent to which any factor, or combination of factors, may cause actual results to differ materially from those contained in any forward-looking statements that we may make. In light of these risks, uncertainties and assumptions, the forward-looking events and circumstances discussed in this release are inherently uncertain and may not occur, and actual results could differ materially and adversely from those anticipated or implied in the forward-looking statements. Accordingly, you should not rely upon forward-looking statements as predictions of future events. In addition, the forward-looking statements made in this release relate only to events or information as of the date on which the statements are made in this release. Except as required by law, we undertake no obligation to update or revise publicly any forward-looking statements, whether as a result of new information, future events or otherwise, after the date on which the statements are made or to reflect the occurrence of unanticipated events.