q4 2020 financial results - wish
TRANSCRIPT

1
Q4 2020 Financial Results
March 8, 2021
Copyright © Wish 2021.
2
Safe Harbor
This presentation contains forward-looking statements that involve risks and uncertainties. Forward-looking
statements are neither historical facts nor assurances of future performance. Instead, they are based on our
current expectations and projections about future events and financial trends that we believe may affect our
financial condition, results of operations, business strategy, and financial needs. All statements other than
statements of historical facts contained in this presentation, including, but not limited to, statements
regarding our business, effectiveness of our platform in attracting and engaging users and merchants,
growth in mobile usage, our ability to expand our offerings, network effects to drive growth; our operating
leverage and our ability to flex growth and margin; our ability to scale and effectively manage growth, our
outlook , recovery of ProductBoost revenue, improving customer service, reducing delivery times and growth
opportunities, could be deemed forward-looking statements. The words “anticipate,” “believe,” “could,”
“estimate,” “expect,” “intend,” “may,” “plan,” “potential,” “predict,” “project,” “seek,” “should,” “will,”
“would” or other similar expressions and the negatives of those terms are intended to identify forward-
looking statements, although not all forward-looking statements contain these identifying words. The
forward-looking statements in this presentation are only predictions and represent our views as of the date
of this presentation. Although we believe the expectations reflected in such forward-looking statements are
reasonable, we can give no assurance that such expectations will prove to be correct. The forward-looking
statements are subject to a number of risks, uncertainties and assumptions, including, but not limited to: our
efforts to acquire, retain, and engage users may not be successful or may be more costly than we expect,
which could prevent us from maintaining or increasing our revenue; if we are unable to promote, maintain,
and protect our brand and reputation and offer a compelling user experience, our ability to attract new users
and engage with our existing base of users will be impaired; if we lose the services of Peter Szulczewski, our
founder, Chief Executive Officer, and Chairperson, or other members of our senior management team, we
may not be able to execute our business strategy; we rely on the Apple App Store and the Google Play Store
to offer and promote our app and if we are unable to maintain a good relationship with such platform
providers, if their terms and conditions change to our detriment, if we violate, or if a platform provider
believes that we have violated, the terms and conditions of its platform, our business will suffer; our brand,
reputation, and business may be harmed if our merchants use unethical or illegal business practices,
including the sale of counterfeit or fraudulent products or if our policies and practices with respect to such
sales are perceived or found to be inadequate, and we may be impacted by the unlawful activity of
merchants on our platform; we face intense competition, the market in which we operate is rapidly evolving
and if we do not compete effectively, our results of operations and financial condition could be harmed; the
COVID-19 pandemic may adversely affect our business and results of operations; economic tension between
the United States and China, or between other countries, may intensify and the United States, China, or
other countries may adopt drastic measures in the future that impact our business; and any significant
disruption in service on our platform or in our computer systems, some of which are currently hosted by
third-party providers, could damage our reputation and result in a loss of users, which would harm our
business and results of operations.
Accordingly, readers are cautioned not to place undue reliance on these forward-looking statements. Except
as required by applicable law, we do not plan to publicly update or revise any forward-looking statements
contained herein, whether as a result of any new information, future events, changed circumstances or
otherwise. No representations or warranties (expressed or implied) are made about the accuracy of any such
forward-looking statements. We operate in a very competitive and rapidly changing environment. New risk
factors and uncertainties may emerge from time to time, and it is not possible to predict all risk factors and
uncertainties nor can we assess the impact of all factors on our business or the extent to which any factor,
or combination of factors, may cause actual results to differ materially from those contained in, or implied
by, any forward-looking statements. In light of these risks, uncertainties and assumptions, the forward-
looking events and circumstances described in this presentation may not occur and actual results could differ
materially and adversely from those anticipated or implied in the forward-looking statements contained in
this presentation. There can be no assurance that the opportunity will meet your investment objectives or
that you will receive a return of all or part of such investment. Investment results may vary significantly over
any given time period. The appropriateness of a particular investment or strategy will depend on an
investor's individual circumstances and objectives. We recommend that investors independently evaluate
specific investments and strategies.
The information is intended only for the use of individuals or entities to which it is addressed. By agreeing to
attend this meeting, you agree to keep all such information and the fact that this meeting has taken place
confidential. If you are not the intended recipient, you are hereby notified that any reliance, disclosure,
copying, distribution, or taking of any action on the contents of this material is strictly prohibited.
This presentation includes non-GAAP financial measures. These non-GAAP financial measures are in addition
to, and not as a substitute for or superior to measures of financial performance prepared in accordance with
GAAP. There are a number of limitations related to the use of these non-GAAP financial measures. For
example, other companies may calculate similarly-titled non-GAAP financial measures differently. Refer to
the Appendix for a reconciliation of these non-GAAP financial measures to the most directly comparable
GAAP measures.

3 4
Bring an affordable and entertaining
mobile shopping experience to
billions
of consumers around the world.
Our MissionOur Mission
Bring an affordable and entertaining mobile shopping
experience to billions of consumers around the world.
3

2020 was a milestone year for Wish
$2.5BRevenue
34% YoY Growth
107M 550k+
100+ 50k+ $1.1B
Monthly Average Users19% YoY Growth
Partner Merchants
Countries Wish Local Partners IPO Proceeds Raised
Note: MAUs refer to Monthly Active Users. LTM revenue as December 31, 2020. Countries, Merchants, and MAU data as of December 31, 2020.Source: Sensor Tower, Analysis of store intelligence platform data, November 2019.
LOCAL
4
$(124)
$(66)
$(11)
$(99)
$(569)
Q4'19 Q1'20 Q2'20 Q3'20 Q4'20
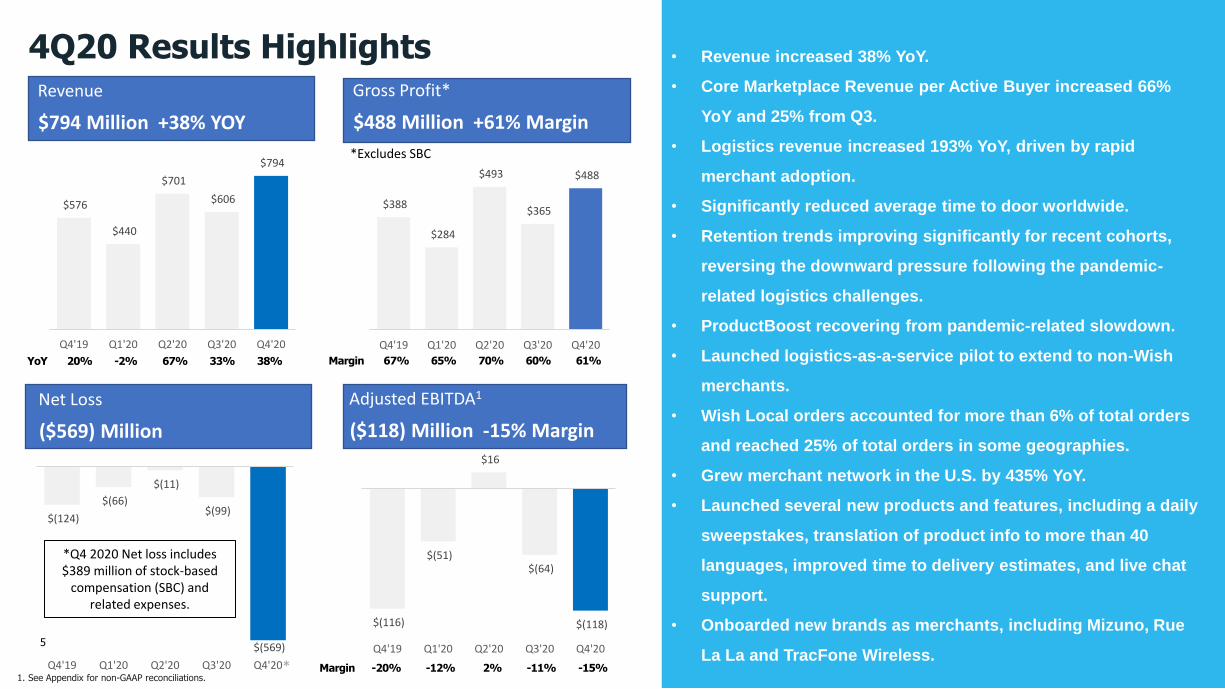
4Q20 Results HighlightsRevenue
$794 Million +38% YOY
Gross Profit*
$488 Million +61% Margin
Net Loss
($569) Million
$388
$284
$493
$365
$488
Q4'19 Q1'20 Q2'20 Q3'20 Q4'20
*Excludes SBC
*Q4 2020 Net loss includes $389 million of stock-based
compensation (SBC) and related expenses.
YoY 20% -2% 67% 33% 38% Margin 67% 65% 70% 60% 61%
Adjusted EBITDA1
($118) Million -15% Margin
Margin -20% -12% 2% -11% -15%
$576
$440
$701
$606
$794
Q4'19 Q1'20 Q2'20 Q3'20 Q4'20
• Revenue increased 38% YoY.
• Core Marketplace Revenue per Active Buyer increased 66%
YoY and 25% from Q3.
• Logistics revenue increased 193% YoY, driven by rapid
merchant adoption.
• Significantly reduced average time to door worldwide.
• Retention trends improving significantly for recent cohorts,
reversing the downward pressure following the pandemic-
related logistics challenges.
• ProductBoost recovering from pandemic-related slowdown.
• Launched logistics-as-a-service pilot to extend to non-Wish
merchants.
• Wish Local orders accounted for more than 6% of total orders
and reached 25% of total orders in some geographies.
• Grew merchant network in the U.S. by 435% YoY.
• Launched several new products and features, including a daily
sweepstakes, translation of product info to more than 40
languages, improved time to delivery estimates, and live chat
support.
• Onboarded new brands as merchants, including Mizuno, Rue
La La and TracFone Wireless.
1. See Appendix for non-GAAP reconciliations.
5
*
$(116)
$(51)
$16
$(64)
$(118)
Q4'19 Q1'20 Q2'20 Q3'20 Q4'20
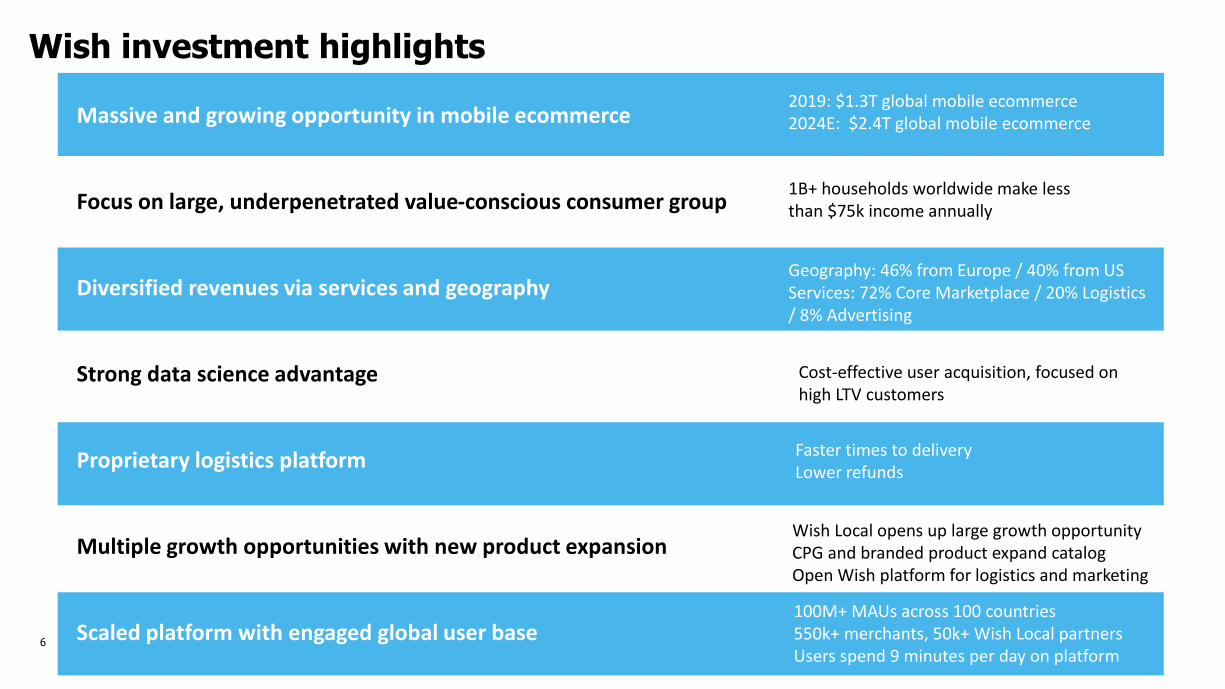
Wish investment highlights
Massive and growing opportunity in mobile ecommerce
Focus on large, underpenetrated value-conscious consumer group
Diversified revenues via services and geography
Strong data science advantage
Proprietary logistics platform
Multiple growth opportunities with new product expansion
Scaled platform with engaged global user base
2019: $1.3T global mobile ecommerce2024E: $2.4T global mobile ecommerce
1B+ households worldwide make lessthan $75k income annually
Geography: 46% from Europe / 40% from USServices: 72% Core Marketplace / 20% Logistics / 8% Advertising
Cost-effective user acquisition, focused on high LTV customers
Faster times to deliveryLower refunds
Wish Local opens up large growth opportunityCPG and branded product expand catalogOpen Wish platform for logistics and marketing
100M+ MAUs across 100 countries550k+ merchants, 50k+ Wish Local partnersUsers spend 9 minutes per day on platform
6
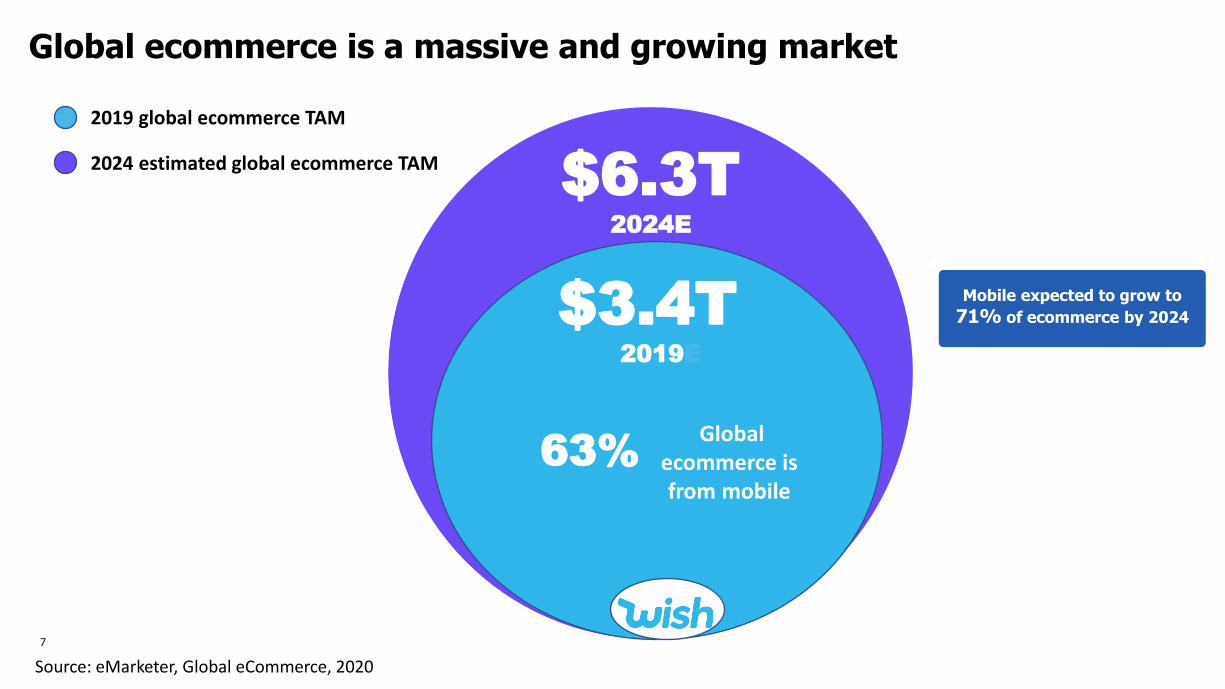
Global ecommerce is a massive and growing market
$6.3T2024E
$3.4T2019E
2019 global ecommerce TAM
Source: eMarketer, Global eCommerce, 2020
Global ecommerce is from mobile
63%
2024 estimated global ecommerce TAM
Mobile expected to grow to
71% of ecommerce by 2024
7

8 Source: Wish survey, conducted in August 2020 across 2,850 consumers in select countries; U.S. and European household income from Euromonitor International Limited, Economies and Consumers, updated August 2020. Global Households are according to our estimates.
Value-conscious consumers have been left behind by ecommerce
60M 300M
75%
75%
$50K~~~United States Europe
ex. China and IndiaOf people surveyed prioritize the price of an item over brand and delivery time
Wish buyer median annual household income
Of Wish users have an annual household income less than $75,000
Number of households with annual income < $75,000
~
1B+ Global Households make less than $75k in annual income, ex. China & India
~
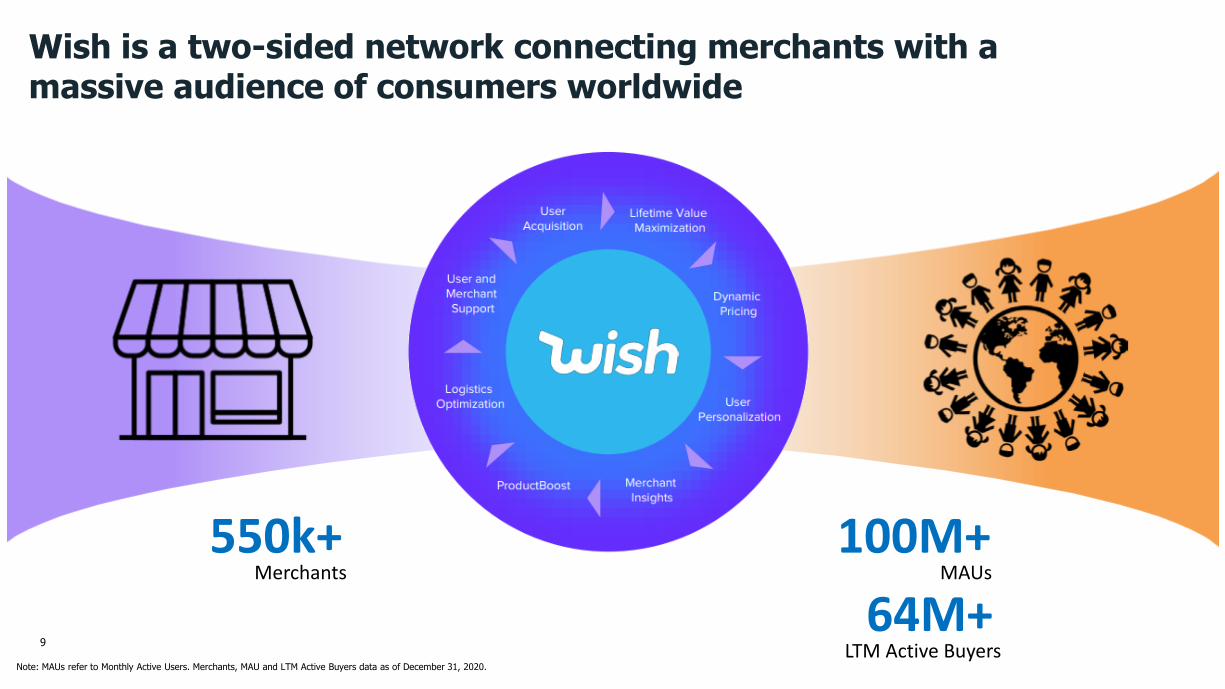
Wish is a two-sided network connecting merchants with a massive audience of consumers worldwide
550k+Merchants
100M+MAUs
Note: MAUs refer to Monthly Active Users. Merchants, MAU and LTM Active Buyers data as of December 31, 2020.
64M+LTM Active Buyers
9
10
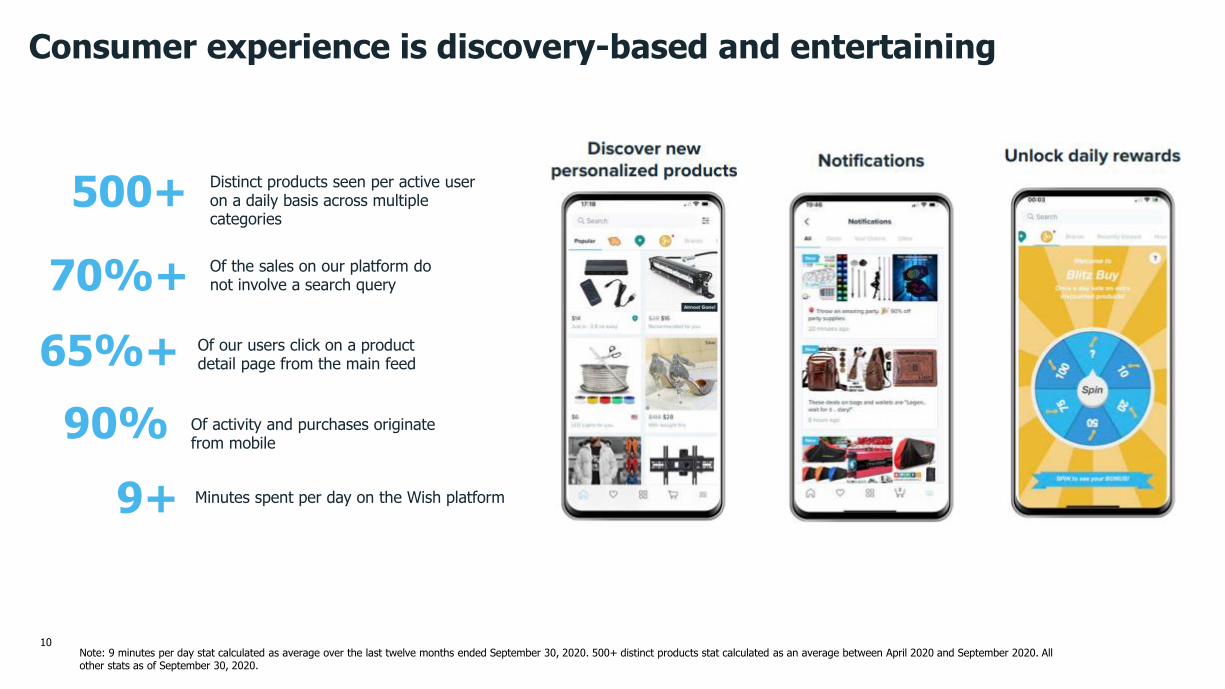
Consumer experience is discovery-based and entertaining
500+
70%+
65%+
9+
Distinct products seen per active user on a daily basis across multiple categories
Of the sales on our platform do not involve a search query
Of our users click on a product detail page from the main feed
Minutes spent per day on the Wish platform
Note: 9 minutes per day stat calculated as average over the last twelve months ended September 30, 2020. 500+ distinct products stat calculated as an average between April 2020 and September 2020. All other stats as of September 30, 2020.
Copyright © Wish 2020.
90% Of activity and purchases originate from mobile
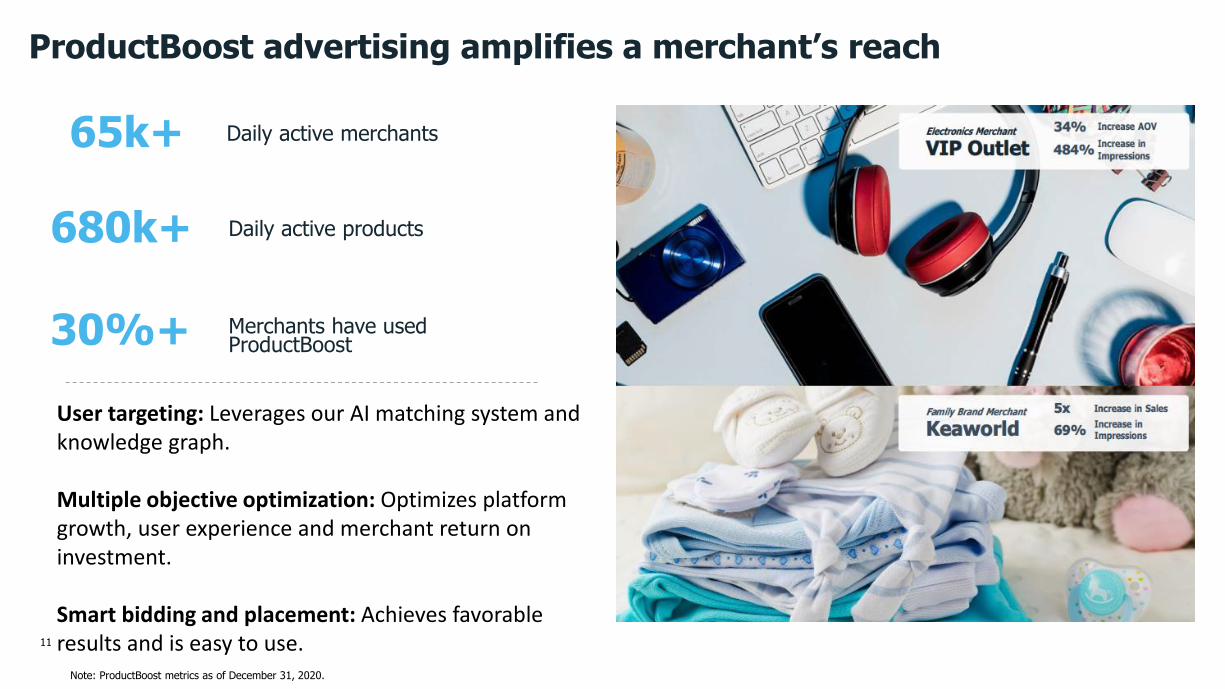
ProductBoost advertising amplifies a merchant’s reach
65k+ Daily active merchants
680k+ Daily active products
30%+ Merchants have used ProductBoost
User targeting: Leverages our AI matching system and knowledge graph.
Multiple objective optimization: Optimizes platform growth, user experience and merchant return on investment.
Smart bidding and placement: Achieves favorable results and is easy to use.11
Note: ProductBoost metrics as of December 31, 2020.
12
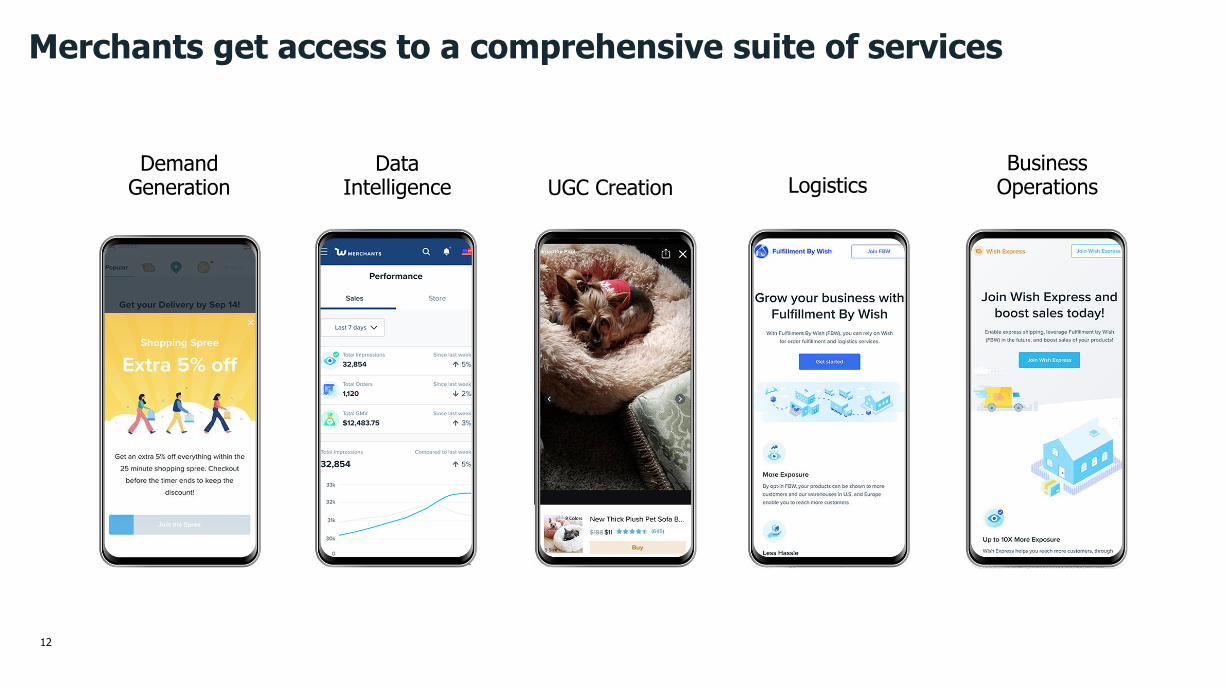
Merchants get access to a comprehensive suite of services
DataIntelligence UGC Creation Logistics
BusinessOperations
DemandGeneration

13
Robust global logistics platform adds efficiency at scale
More than 90% of packages are shipped through Wish’s proprietary logistics platform.
Wish performs all logistics services for approximately 50% of those packages, representing a large growth opportunity.
First Mile Bundling Transportation Warehousing Last MileEnables efficient first
mile collection
Combines orders
into one parcel
Partners with logistics
vendors; optimizes pricing
and service level
Connects to a network of
warehouse partners
Enables dropship, last mile
delivery and fulfillment in
local stores
14
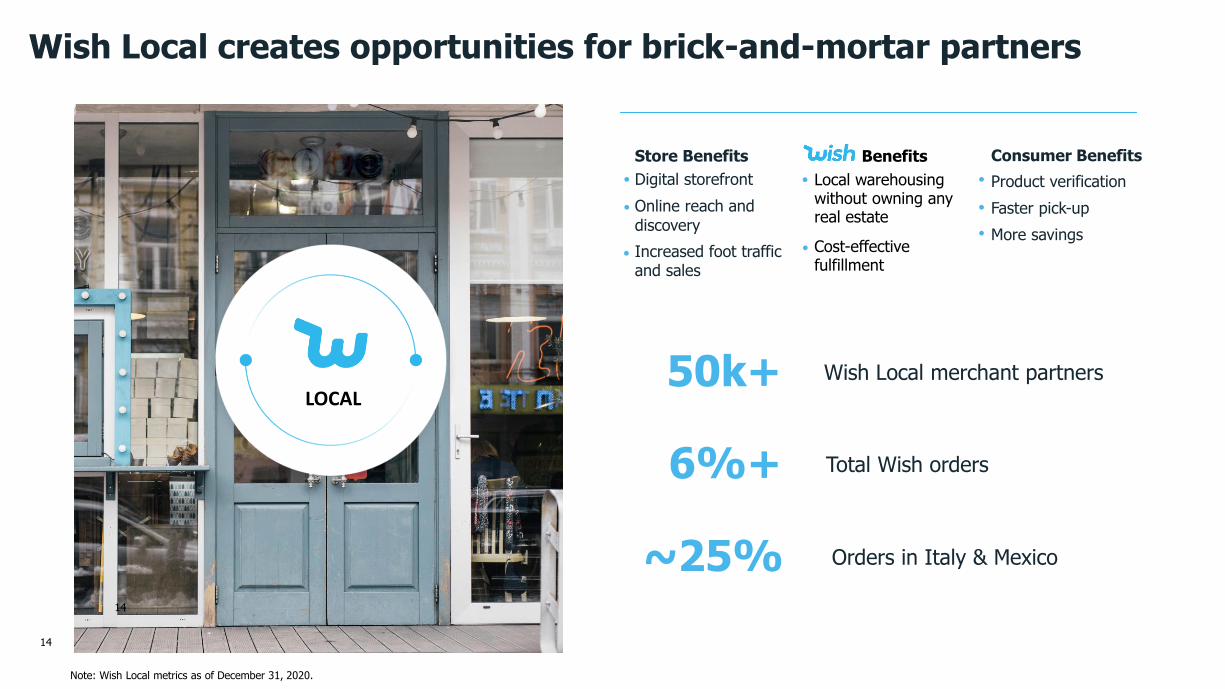
LOCAL
Store Benefits
Digital storefront
Online reach and discovery
Increased foot traffic and sales
Consumer Benefits
Product verification
Faster pick-up
More savings
Benefits
Cost-effective fulfillment
Local warehousing without owning any real estate
14
Wish Local creates opportunities for brick-and-mortar partners
50k+ Wish Local merchant partners
6%+ Total Wish orders
~25% Orders in Italy & Mexico
Note: Wish Local metrics as of December 31, 2020.
15
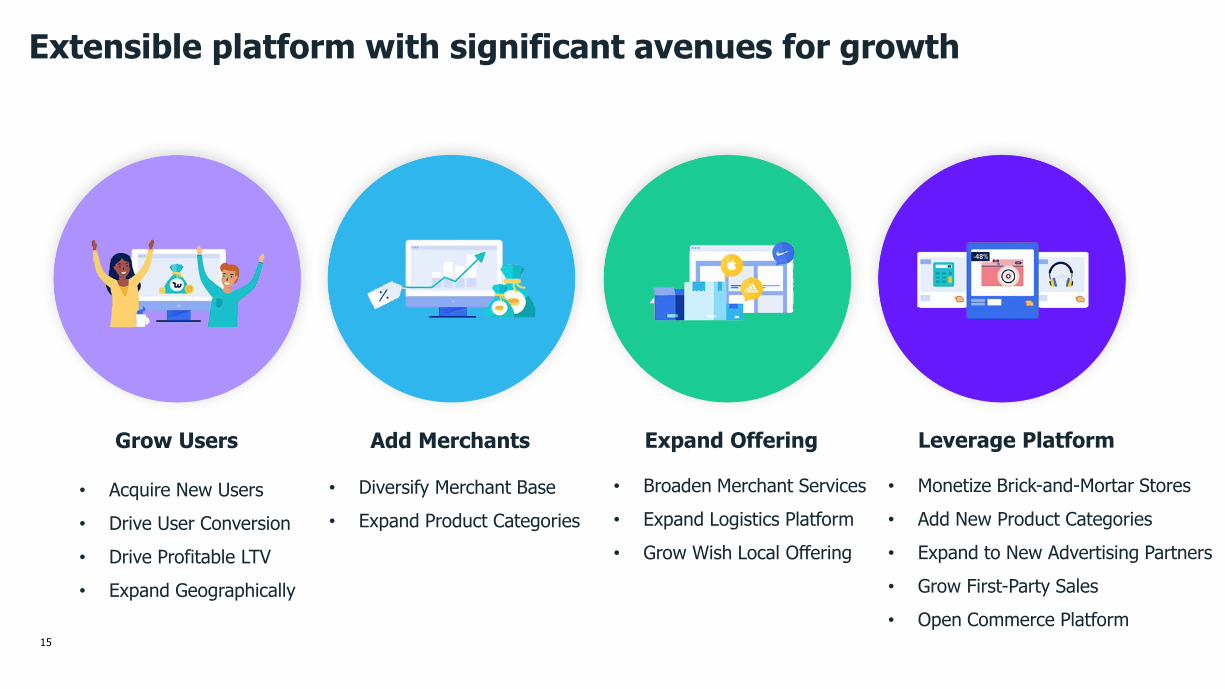
Extensible platform with significant avenues for growth
Grow Users Add Merchants Expand Offering Leverage Platform
• Acquire New Users
• Drive User Conversion
• Drive Profitable LTV
• Expand Geographically
• Diversify Merchant Base
• Expand Product Categories
• Monetize Brick-and-Mortar Stores
• Add New Product Categories
• Expand to New Advertising Partners
• Grow First-Party Sales
• Open Commerce Platform
• Broaden Merchant Services
• Expand Logistics Platform
• Grow Wish Local Offering
Copyright © Wish 2020. Confidential and proprietary.
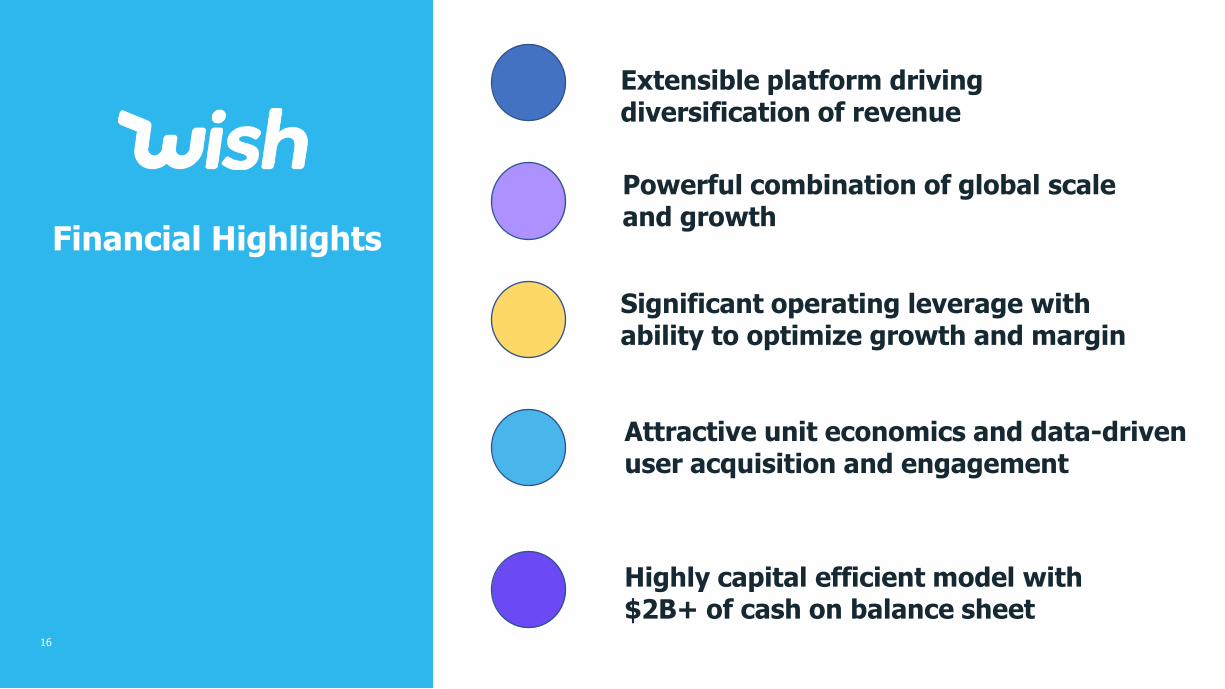
Financial Highlights
Extensible platform driving diversification of revenue
Powerful combination of global scale and growth
Significant operating leverage with ability to optimize growth and margin
Attractive unit economics and data-driven user acquisition and engagement
Highly capital efficient model with $2B+ of cash on balance sheet
16

17 Copyright © Wish 2020.
Model benefits from strong revenue diversification
NorthAmerica
40%
South America
5%
Rest of World
9%
Note: Revenue by geography is based on the ship-to address of the user and calculated as the geographic breakdown of Core Marketplace Revenue as of year ended December 31, 2020.
Revenue by Geography Revenue by Service
Europe
46% Logistics
20%
Core Marketplace
72%
ProductBoost
8%
2020 Logistics
Revenue
Increased
275% YoY
18
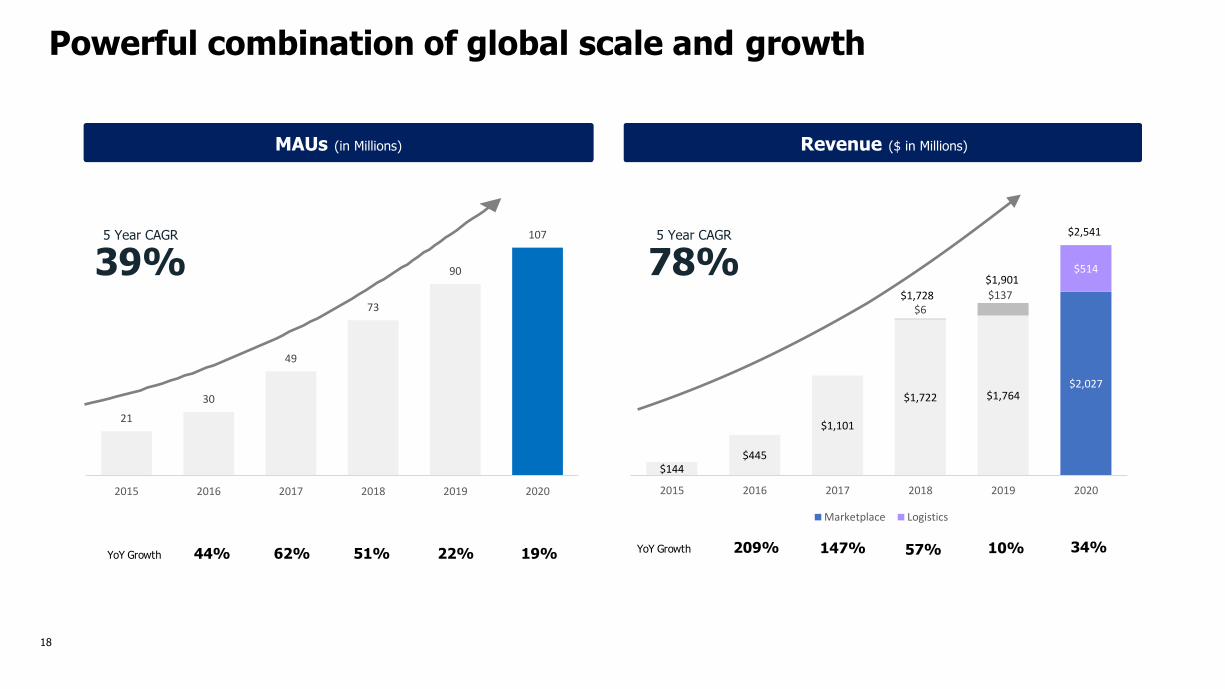
$144$445
$1,101
$1,722 $1,764$2,027
$6$137
$514
2015 2016 2017 2018 2019 2020
Marketplace Logistics
21
30
49
73
90
107
2015 2016 2017 2018 2019 2020
Powerful combination of global scale and growth
44% 62% 51% 22% 19%
MAUs (in Millions)
YoY Growth
Revenue ($ in Millions)
5 Year CAGR
39%
147% 57% 10% 34%
5 Year CAGR
78%
YoY Growth
$1,728
$1,901
$2,541
209%
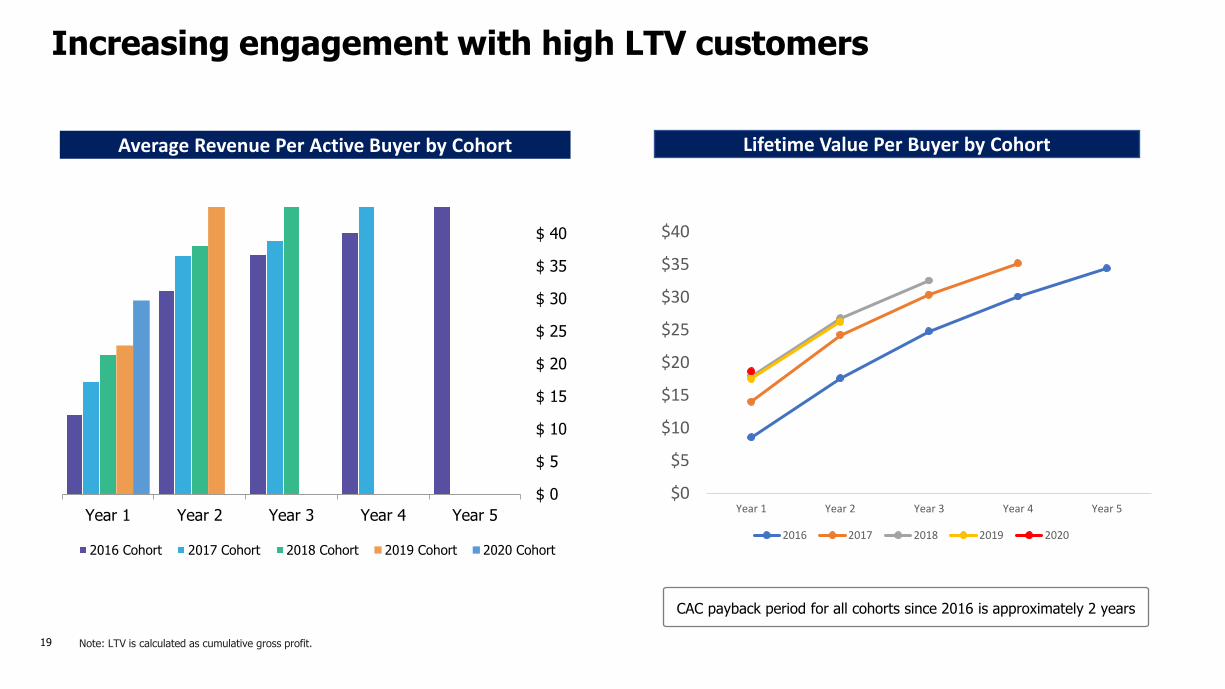
19 Note: LTV is calculated as cumulative gross profit.
Lifetime Value Per Buyer by Cohort
CAC payback period for all cohorts since 2016 is approximately 2 years
Increasing engagement with high LTV customers
Average Revenue Per Active Buyer by Cohort
$ 0
$ 5
$ 10
$ 15
$ 20
$ 25
$ 30
$ 35
$ 40
Year 1 Year 2 Year 3 Year 4 Year 5
2016 Cohort 2017 Cohort 2018 Cohort 2019 Cohort 2020 Cohort
$0
$5
$10
$15
$20
$25
$30
$35
$40
Year 1 Year 2 Year 3 Year 4 Year 5
2016 2017 2018 2019 2020
20 Copyright © Wish 2020. Confidential and proprietary.
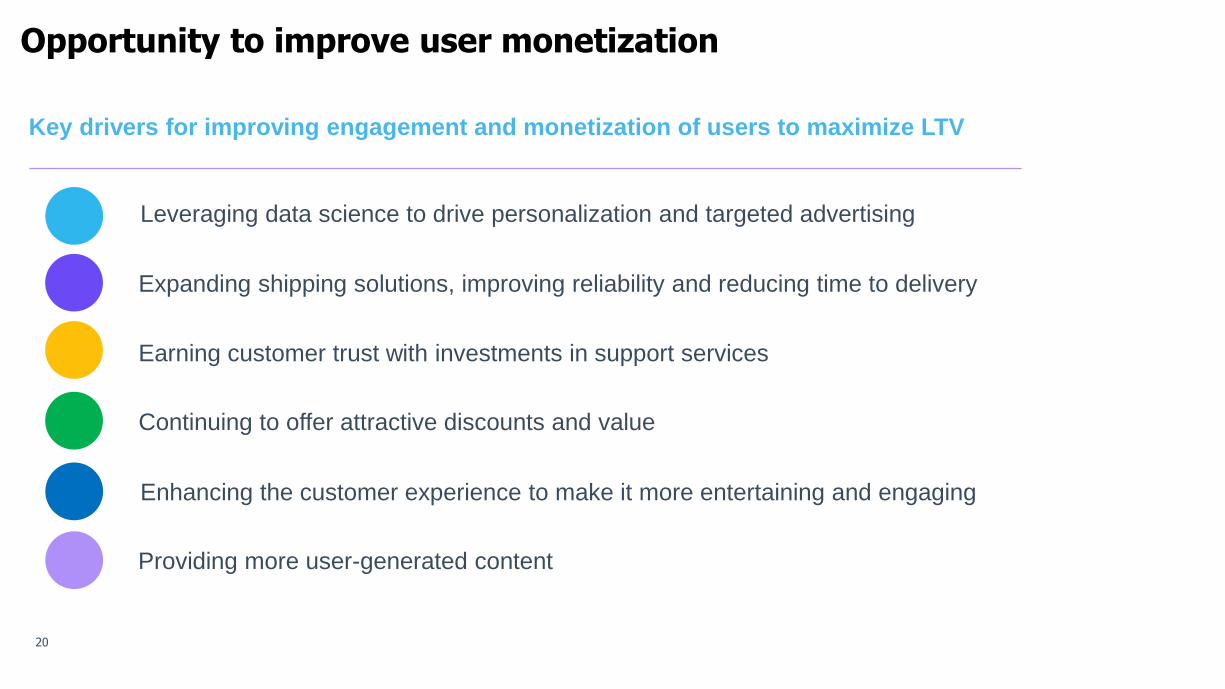
Opportunity to improve user monetization
Key drivers for improving engagement and monetization of users to maximize LTV
Expanding shipping solutions, improving reliability and reducing time to delivery
Earning customer trust with investments in support services
Continuing to offer attractive discounts and value
Enhancing the customer experience to make it more entertaining and engaging
Providing more user-generated content
Leveraging data science to drive personalization and targeted advertising
21
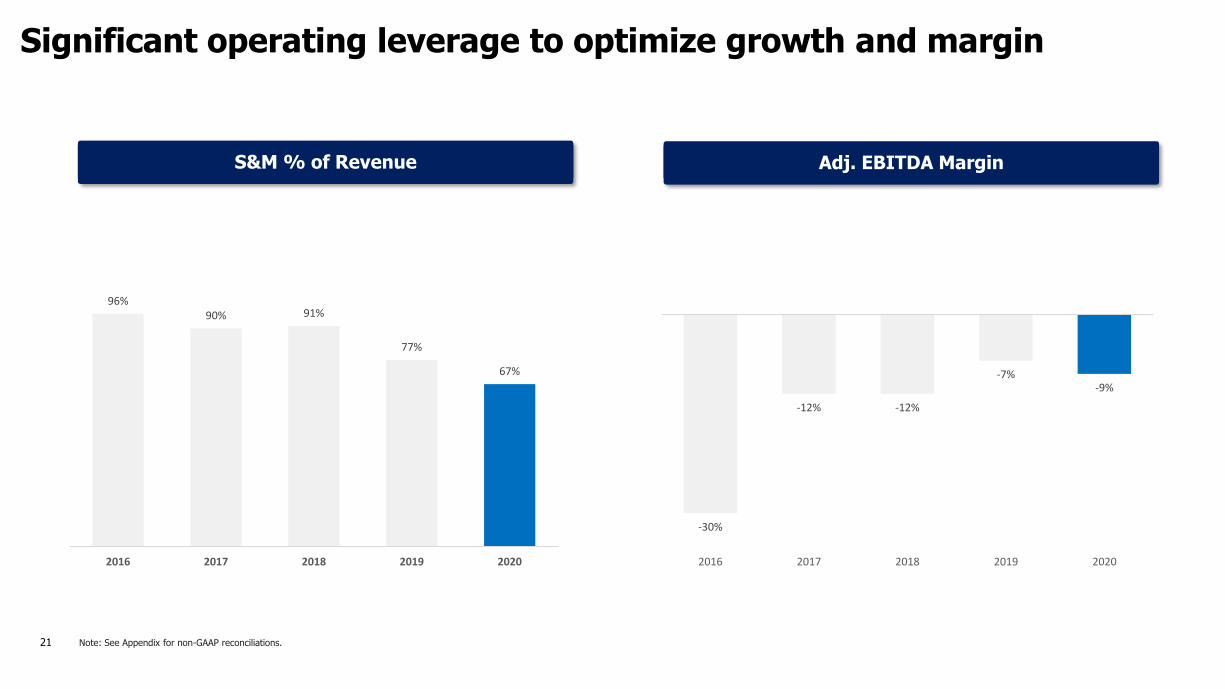
Significant operating leverage to optimize growth and margin
Note: See Appendix for non-GAAP reconciliations.
96%90% 91%
77%
67%
2016 2017 2018 2019 2020
-30%
-12% -12%
-7%-9%
2016 2017 2018 2019 2020
Adj. EBITDA MarginS&M % of Revenue

22
Highly capital efficient model with $2B+ of cash on balance sheet
Note: See Appendix for non-GAAP reconciliations.
Cash from Ops and Adj. EBITDA ($ in Millions) Capex as % of Revenue
$6 $12 $20 $11 $2
$21
$146
($94)
($60)
--
($132) ($135)
($211)
($127)
($217)
2016 2017 2018 2019 2020
Cash from Ops Adj. EBITDA
1.3%
1.1%
1.2%
0.6%
0.1%
2016 2017 2018 2019 2020
23 Copyright © Wish 2020. Confidential and proprietary.
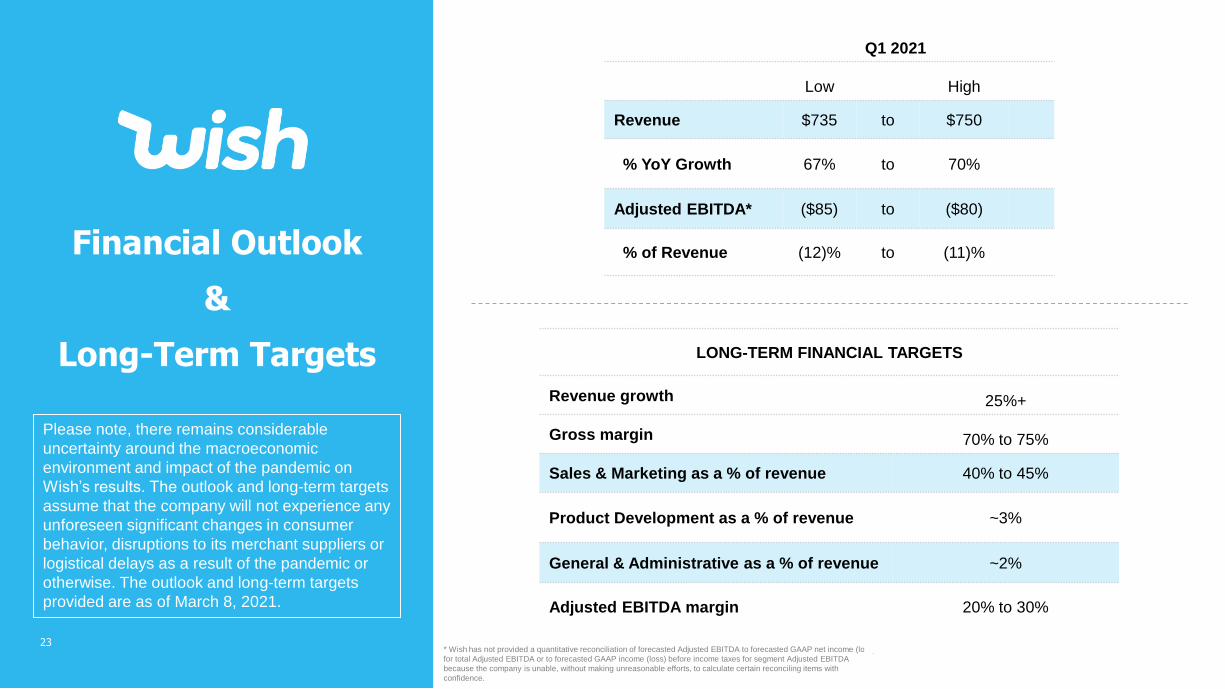
Q1 2021
Low High
Revenue $735 to $750
% YoY Growth 67% to 70%
Adjusted EBITDA* ($85) to ($80)
% of Revenue (12)% to (11)%Financial Outlook
&
Long-Term Targets LONG-TERM FINANCIAL TARGETS
Revenue growth 25%+
Gross margin 70% to 75%
Sales & Marketing as a % of revenue 40% to 45%
Product Development as a % of revenue ~3%
General & Administrative as a % of revenue ~2%
Adjusted EBITDA margin 20% to 30%
* Wish has not provided a quantitative reconciliation of forecasted Adjusted EBITDA to forecasted GAAP net income (loss)
for total Adjusted EBITDA or to forecasted GAAP income (loss) before income taxes for segment Adjusted EBITDA
because the company is unable, without making unreasonable efforts, to calculate certain reconciling items with
confidence.
23
Please note, there remains considerable
uncertainty around the macroeconomic
environment and impact of the pandemic on
Wish’s results. The outlook and long-term targets
assume that the company will not experience any
unforeseen significant changes in consumer
behavior, disruptions to its merchant suppliers or
logistical delays as a result of the pandemic or
otherwise. The outlook and long-term targets
provided are as of March 8, 2021.
24 Copyright © Wish 2020. Confidential and proprietary.Copyright © Wish 2020. 24
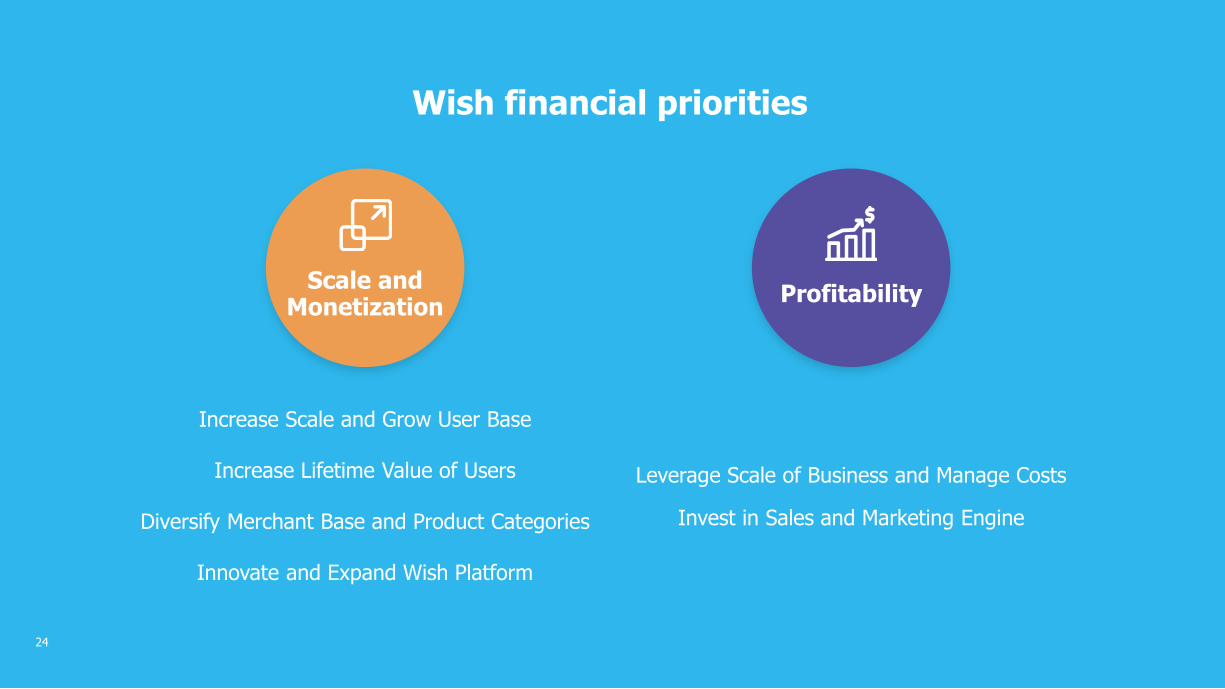
Wish financial priorities
Increase Scale and Grow User Base
Increase Lifetime Value of Users
Diversify Merchant Base and Product Categories
Innovate and Expand Wish Platform
Leverage Scale of Business and Manage Costs
Invest in Sales and Marketing Engine
ProfitabilityScale and
Monetization

25 Copyright © Wish 2020. Confidential and proprietary.
GAAP Reconciliations
Reconciliation of GAAP Net Loss to Non-GAAP EBITDA
Quarterly Annual
Q1'19 Q2'19 Q3'19 Q4'19 Q1'20 Q2'20 Q3'20 Q4'20 2016 2017 2018 2019 2020
Revenue 450$ 420$ 455$ 576$ 440$ 701$ 606$ 794$ 445$ 1,101$ 1,728$ 1,901$ 2,541$
Net income (loss) 87 42 (134) (124) (66) (11) (99) (569) (151) (207) (208) (129) (745)
Net income (loss) as a percentage of revenue 19% 10% (29)% (22)% (15)% (2)% (16)% (72)% (34)% (19)% (12)% (7)% (29)%
Excluding:
Interest and other income (expense), net (5) (8) (3) (3) (3) (5) 8 2 5 (10) (15) (19) 2
Provision for income taxes — — — 1 — — 1 1 — — — 1 2
Depreciation and amortization 2 3 2 3 2 3 4 3 2 4 8 10 12
Stock-based compensation expense(1)
— 2 — — — — 9 381 7 8 2 2 390
Employer payroll taxes related to stock-based compensation expense — — — — — — — 8 — — — — 8
Remeasurement of redeemable convertible preferred stock warrant liability 10 (17) 4 6 15 28 12 55 5 70 — 3 110
Recurring other items 1 2 1 1 1 1 1 1 — — 2 5 4
Adjusted EBITDA 95$ 24$ (130)$ (116)$ (51)$ 16$ (64)$ (118)$ (132)$ (135)$ (211)$ (127)$ (217)$
Adjusted EBITDA margin 21% 6% (29)% (20)% (12)% 2% (11)% (15)% (30)% (12)% (12)% (7)% (9)%
(in million, except percentages)
Quarterly Annual
Q1'19 Q2'19 Q3'19 Q4'19 Q1'20 Q2'20 Q3'20 Q4'20 2016 2017 2018 2019 2020
Gross profit - GAAP 378$ 346$ 346$ 388$ 284$ 493$ 365$ 452$ 314$ 896$ 1,450$ 1,458$ 1,594$
Gross margin - GAAP 84% 82% 76% 67% 65% 70% 60% 57% 71% 81% 84% 77% 63%
Stock-based compensation expense — — — — — — — 35 — — — — 35
Employer tax related to stock-based compensation expense — — — — — — — 1 — — — — 1
Gross profit - non-GAAP 378$ 346$ 346$ 388$ 284$ 493$ 365$ 488$ 314$ 896$ 1,450$ 1,458$ 1,630$
Gross margin - non-GAAP 84% 82% 76% 67% 65% 70% 60% 61% 71% 81% 84% 77% 64%
Reconciliation of GAAP Gross Profit to Non-GAAP Gross Profit