q417 - saferoad.com · eventful 2017 where we took several important steps to ... from the sale of...
TRANSCRIPT

Q417 REPORT

Message from the CEO
As we enter a new year, we look back on an exciting and eventful 2017 where we took several important steps to develop the Group, both operationally and strategically. Starting with the fourth quarter, revenue grew by more than 16 per cent, driven by strong sales and high project execution in the Road Infrastructure business in Poland and continued good traction in the work zone protection business in the Nordics. The margin challenges we experienced in the third quarter also had a negative impact in the fourth quarter, but operating earnings in the quarter were in line with last year. We executed the first part of the restructuring program in the Road Safety business in Sweden as planned and also initiated a change program in the Road Infrastructure business in Lithuania, where we will exit the water & sewage business in 2018.
We improved the cash flow from operations in the quarter through a combination of structured measures to reduce working capital, the normal seasonal release and the proceeds from the sale of the water & sewage business. As a result, we brought down the leverage by 1x compared to the end of the third quarter, which gives us sufficient financial flexibility to execute our planned projects and initiatives.
Looking at our full year performance, I’m pleased to see that we are on track to achieve three out of our four main financial targets. We achieved an organic growth rate of six per cent, our year-end leverage is 2x and we propose a dividend of NOK 0.90 per share for 2017, slightly above the targeted 50 per cent of net underlying earnings.
The operating margin did not develop in the right direction in 2017. Rising raw materials prices had a negative impact in the second half of the year, but we consider this temporary in nature. There were also parts of the Group that performed below my expectations. Some of these businesses have already been divested, while the remaining underperforming businesses have been addressed with forceful improvement measures. Improving the Group’s margin will continue to have my full attention in the coming quarters.
We also continued our work to optimise the business portfolio in 2017. We divested the low margin water & sewage business in Sweden, the rental business in Germany and the RRS operations in Turkey. We also acquired two companies – one within work zone protection in Norway and one in the Road Infrastructure segment in Poland – to leverage and expand our existing offering and to capture further synergies. Most of these portfolio measures had limited impact on the 2017 performance since they were executed late in the year, but they will have a positive effect in 2018.
The outlook for 2018 is promising. Our overall assessment of the market is unchanged. Demand is expected to continue to grow in our main markets and we are well positioned to benefit from the positive market environment. The operational profit improvement initiatives that we are executing and the strategic steps we took in 2017 will have a positive impact on the performance going forward. We will continue to execute our strategic agenda, and I am confident that we will take new steps forward in 2018 to further strengthen our competitiveness and to build value for our customers and shareholders.
Morten Holum CEO Saferoad
Saferoad | Fourth quarter report 20172

Underlying revenue NOK million
Underlying revenuelast 12 months (LTM)NOK million
Underlying EBITA NOK million
Underlying EBITA last 12 months (LTM)NOK million
Underlying EBITDA NOK million
Underlying EBITDA last 12 months (LTM)NOK million
1) Of underlying net income
Q4 17Q3 17Q2 17Q1 17Q4 16
1 537 904 1 710 1 7871 626
Q4 17Q3 17Q2 17Q1 17Q4 16
(83)
120
(90) (90)
156118 118
Q4 17Q3 17Q2 17Q1 17Q4 16
337 330 332 304 302
Q4 17Q3 17Q2 17Q1 17Q4 16
478 469 469 441440
Q4 17Q3 17Q2 16Q1 17Q4 16
(47)
152 153 192
(56)(56)
152
Increased revenue and stable earnings (The figures are unaudited)
Fourth quarter highlights
· Underlying revenue increased to NOK 1 787 million, which was 16 per cent higher than the fourth quarter last year. Revenue increased in both Road Safety and Road Infrastructure.
· Underlying EBITDA of NOK 152 million was in line with the fourth quarter last year.
· Reported EBITA was NOK 110 million compared to NOK 89 million in the previous year.
· Reported Net income increased to NOK 137 million compared to NOK (312) million in fourth quarter last year.
· The Board proposes a dividend of NOK 0.90 per share for the year 2017, corresponding to a pay-out-ratio of 56 per cent1).
Q4 17Q3 17Q2 17Q1 17Q4 16
5 738 5 768 5 777 6 0285 764
Saferoad | Fourth quarter report 2017 3
Key FiguresNOK million Q4 2017 Q4 2016
% change prior year quarter
2017 2016
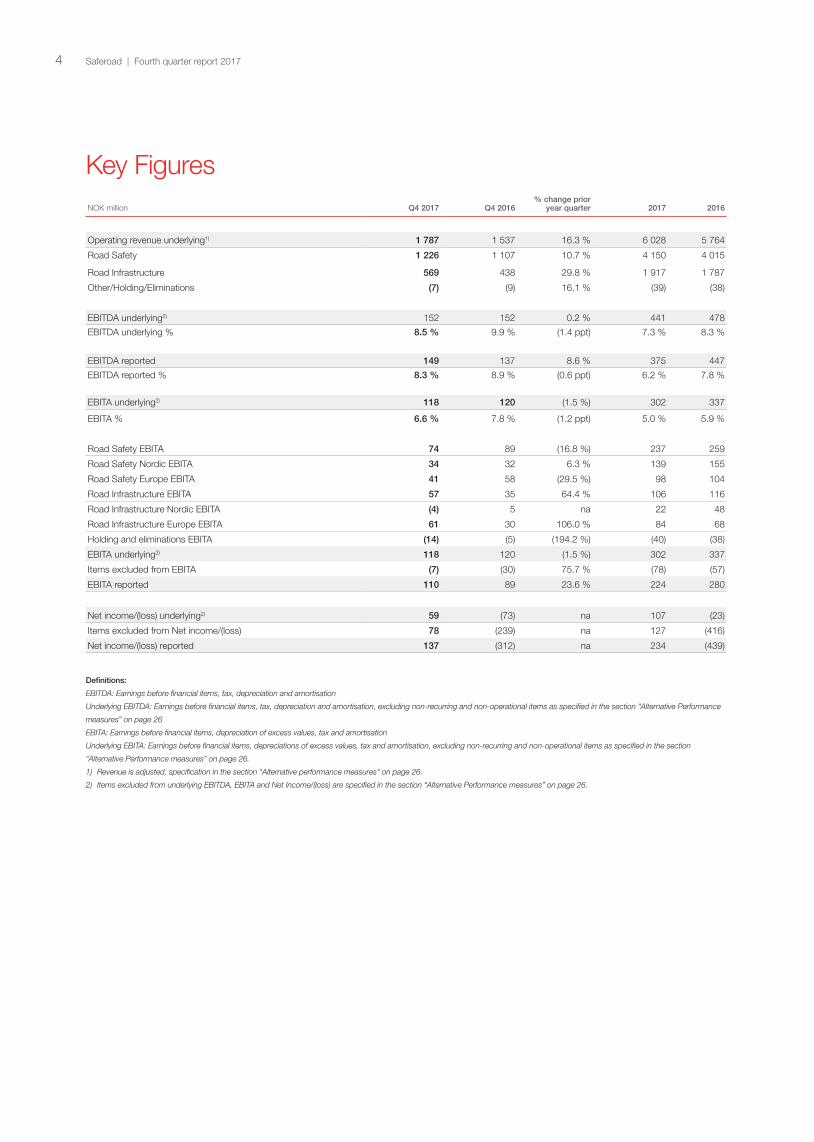
Operating revenue underlying1) 1 787 1 537 16.3 % 6 028 5 764
Road Safety 1 226 1 107 10.7 % 4 150 4 015
Road Infrastructure 569 438 29.8 % 1 917 1 787
Other/Holding/Eliminations (7) (9) 16.1 % (39) (38)
EBITDA underlying2) 152 152 0.2 % 441 478
EBITDA underlying % 8.5 % 9.9 % (1.4 ppt) 7.3 % 8.3 %
EBITDA reported 149 137 8.6 % 375 447
EBITDA reported % 8.3 % 8.9 % (0.6 ppt) 6.2 % 7.8 %
EBITA underlying2) 118 120 (1.5 %) 302 337
EBITA % 6.6 % 7.8 % (1.2 ppt) 5.0 % 5.9 %
Road Safety EBITA 74 89 (16.8 %) 237 259
Road Safety Nordic EBITA 34 32 6.3 % 139 155
Road Safety Europe EBITA 41 58 (29.5 %) 98 104
Road Infrastructure EBITA 57 35 64.4 % 106 116
Road Infrastructure Nordic EBITA (4) 5 na 22 48
Road Infrastructure Europe EBITA 61 30 106.0 % 84 68
Holding and eliminations EBITA (14) (5) (194.2 %) (40) (38)
EBITA underlying2) 118 120 (1.5 %) 302 337
Items excluded from EBITA (7) (30) 75.7 % (78) (57)
EBITA reported 110 89 23.6 % 224 280
Net income/(loss) underlying2) 59 (73) na 107 (23)
Items excluded from Net income/(loss) 78 (239) na 127 (416)
Net income/(loss) reported 137 (312) na 234 (439)
Definitions:
EBITDA: Earnings before financial items, tax, depreciation and amortisation
Underlying EBITDA: Earnings before financial items, tax, depreciation and amortisation, excluding non-recurring and non-operational items as specified in the section “Alternative Performance
measures” on page 26
EBITA: Earnings before financial items, depreciation of excess values, tax and amortisation
Underlying EBITA: Earnings before financial items, depreciations of excess values, tax and amortisation, excluding non-recurring and non-operational items as specified in the section
“Alternative Performance measures” on page 26.
1) Revenue is adjusted, specification in the section "Alternative performance measures" on page 26.
2) Items excluded from underlying EBITDA, EBITA and Net Income/(loss) are specified in the section “Alternative Performance measures” on page 26.
Saferoad | Fourth quarter report 20174

Developments during the quarterUnderlying revenue in the quarter increased by 16 per cent to NOK 1 787 million compared to NOK 1 537 million in the fourth quarter last year. Revenue increased in both Road Safety and Road Infrastructure.
In Road Safety, revenues increased in both the Nordic and Europe region. The signs and work zone protection business in the Nordic region grew significantly in the quarter and the demand in Germany and Poland was high.
The increase in Road Infrastructure was driven by high execution of orders and projects in Poland on the back of a continued positive market sentiment, whereas revenue in the Nordic region declined as a result of the divestment of the water & sewage business.
Underlying EBITA for the Group was NOK 118 million compared to NOK 120 million in the fourth quarter 2016. Higher raw material prices and softer pricing in some areas had a negative impact on the earnings. This was compensated by higher revenue.
Underlying revenue and underlying EBITDA NOK million
Reported revenue, EBITDA, EBITA and Net income The Group reported revenue of NOK 1 792 million in the fourth quarter 2017 compared to NOK 1 537 million in corresponding period last year.
The reported EBITDA margin in the quarter was 8.3 per cent, compared to 8.9 per cent in the fourth quarter last year. Items excluded from underlying EBITDA, EBITA and Net income are specified in the section "Alternative performance measures" on page 26.
The Group’s reported EBITA for the fourth quarter 2017 was NOK 110 million compared to NOK 89 million in the fourth quarter of 2016. Lower non-recurring costs in 2017 was the main reason for the increase in reported EBITA. In the fourth quarter of 2016, impairment loss and IPO related costs negatively impacted the reported EBITA.
In fourth quarter 2017, the Group had a tax income of NOK 17 million compared to a tax income of NOK 7 million in the fourth quarter last year. The tax income in the fourth quarter 2017 is affected by recognition of deferred tax assets for tax losses carried forward from previous years.
The Group’s net income in the quarter amounted to NOK 137 million, up from NOK (312) million in fourth quarter last year. The improvement was mainly a result of lower non-recurring costs, lower net financial costs and the absence of impairment loss in 2017.
The Group’s total cash flow in the quarter amounted to NOK 152 million, up from NOK 73 million in the corresponding quarter in 2016. The improvement in cash flow was mainly a result of release of working capital of NOK 142 million and the divestment of the water & sewage business in Sweden.
Developments during the year Underlying revenue in 2017 increased by 5 per cent to NOK 6 028 million, driven by good market sentiment in Poland, increased demand of road restraint systems in Germany and higher work zone protection sales in the Nordic countries. The Group had higher revenues in both business areas.
Underlying EBITA decreased to NOK 302 million from NOK 337 million. Higher raw material prices, stronger competition in some product areas and lower earnings in the road restraint system business in Sweden impacted the results over the year. Consequently, the EBITA margin declined to 5.0 per cent for 2017 down from 5.9 per cent the year before.
The Group’s reported net income in 2017 amounted to NOK 234 million, up from NOK (439) million last year. The improve-ment was mainly a result of lower non-recurring costs, lower net financial costs and the absence of impairment losses in 2017.
The Group’s total cash flow was NOK 67 million in 2017 compared to a total cash flow of NOK (208) million in 2016. The refinancing of the Group through the listing on Oslo Stock Exchange, divestments of three subsidiaries, as well as a release of working capital made a positive impact on the total cash flow over the year.
Group performance
0
1000
2000
3000
4000
5000
6000
7000
Q4 17Q3 17Q2 17Q1 17Q4 160
150
300
450
600
5 764 5 738 5 768 5 777 6 028
Underlying Revenue LTM Underlying EBITDA LTM
Saferoad | Fourth quarter report 2017 5
Road Safety
Key figuresNOK million Q4 2017 Q4 2016 2017 2016
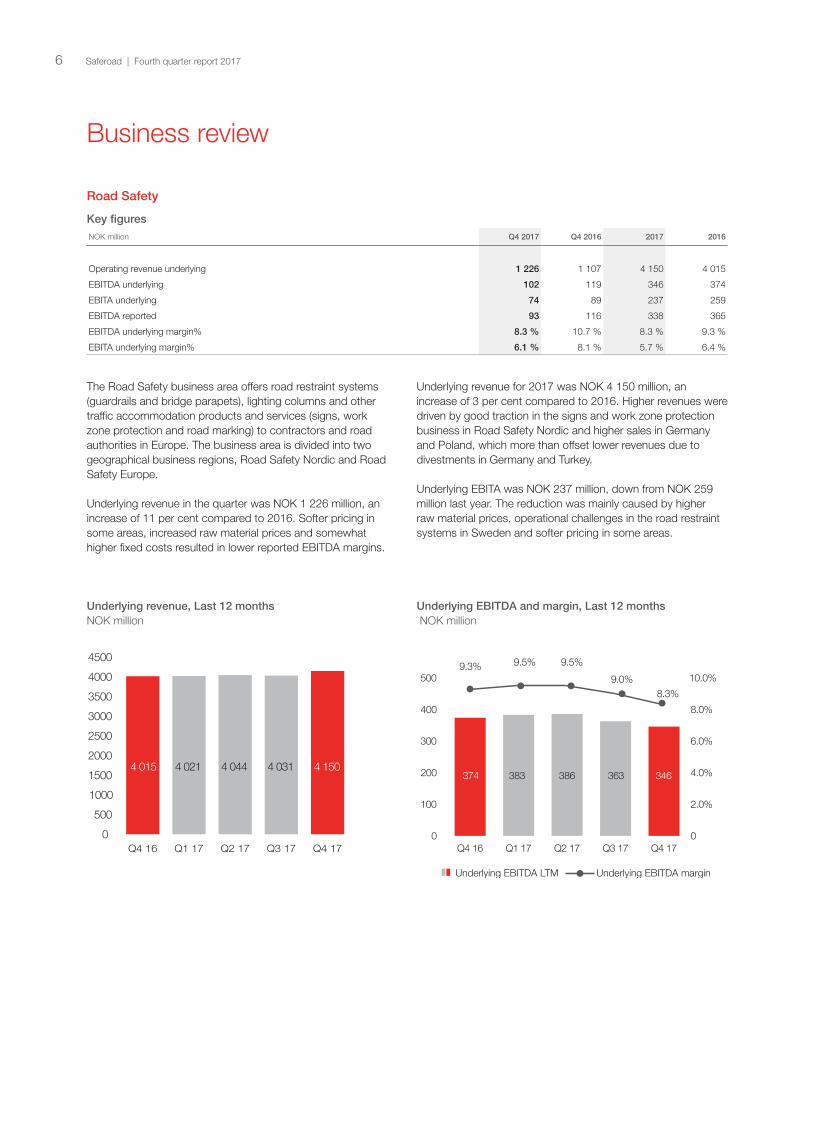
Operating revenue underlying 1 226 1 107 4 150 4 015
EBITDA underlying 102 119 346 374
EBITA underlying 74 89 237 259
EBITDA reported 93 116 338 365
EBITDA underlying margin% 8.3 % 10.7 % 8.3 % 9.3 %
EBITA underlying margin% 6.1 % 8.1 % 5.7 % 6.4 %
The Road Safety business area offers road restraint systems (guardrails and bridge parapets), lighting columns and other traffic accommodation products and services (signs, work zone protection and road marking) to contractors and road authorities in Europe. The business area is divided into two geographical business regions, Road Safety Nordic and Road Safety Europe.
Underlying revenue in the quarter was NOK 1 226 million, an increase of 11 per cent compared to 2016. Softer pricing in some areas, increased raw material prices and somewhat higher fixed costs resulted in lower reported EBITDA margins.
Underlying revenue, Last 12 months NOK million
Underlying revenue for 2017 was NOK 4 150 million, an increase of 3 per cent compared to 2016. Higher revenues were driven by good traction in the signs and work zone protection business in Road Safety Nordic and higher sales in Germany and Poland, which more than offset lower revenues due to divestments in Germany and Turkey.
Underlying EBITA was NOK 237 million, down from NOK 259 million last year. The reduction was mainly caused by higher raw material prices, operational challenges in the road restraint systems in Sweden and softer pricing in some areas.
Underlying EBITDA and margin, Last 12 months NOK million
Business review
0
100
200
300
400
500
Q4 17Q3 17Q2 17Q1 17Q4 160
2.0%
4.0%
6.0%
8.0%
10.0%
374 383 386 363 346
Underlying EBITDA LTM Underlying EBITDA margin
9.5% 9.5%9.3%9.0%
8.3%
0
500
1000
1500
2000
2500
3000
3500
4000
4500
Q4 17Q3 17Q2 17Q1 17Q4 16
4 015 4 021 4 044 4 031 4 150
Saferoad | Fourth quarter report 20176

Road Safety Nordic
Key figures
NOK million Q4 2017 Q4 2016 2017 2016
Operating revenue underlying 799 695 2 780 2 648
EBITDA underlying 55 53 223 237
EBITA underlying 34 32 139 155
EBITDA reported 47 55 202 233
EBITDA underlying margin% 6.9 % 7.7 % 8.0 % 8.9 %
EBITA underlying margin% 4.2 % 4.6 % 5.0 % 5.9 %
Development during the quarter Underlying revenue in the quarter increased by 15 per cent to NOK 799 million as a result of high sales in most areas. The signs and work zone protection business in Sweden and Norway continued to develop positively and increased revenues by 22 per cent quarter on quarter. The road restraint systems business in Norway also had higher sales volume in the fourth quarter, growing revenue by 9 per cent from 2016.
Underlying EBITA was NOK 34 million compared to NOK 32 million in the fourth quarter 2016. The main drivers for higher earnings were increased revenues across most product areas. Higher raw material prices, increased cost base for future improved earnings and extra costs seen as temporary in nature reduced the margins. Reported EBITDA was NOK 47 million, down from NOK 55 million the fourth quarter last year, which is a result of restructuring costs in the road restraint system business in Sweden.
The Group initiated a restructuring program in the fourth quarter where three companies will be merged to extract operating synergies. The new company will have a stronger regional presence throughout Sweden and a significantly lower cost base. The restructuring, which is estimated to result in an annual earnings improvement of around NOK 20 million, is on track.
Development during the year Underlying revenue in 2017 increased by 5 per cent to NOK 2 780 million. Higher sales within the signs and work zone protection business compensated for the lower sales in the road marking segment and in the UK. 2017 has been a challenging year for road marking, with poor operating weather conditions in both Norway and Denmark, affecting both the volume and the efficiency of the surface application of thermoplastics and paint. Lower revenue in the UK was mainly driven by the phasing of projects.
Underlying EBITA decreased to NOK 139 million from NOK 155 million. Lower margins in the rock support business combined with higher raw material prices and stronger competition in the road restraint business in Norway and Sweden, had a negative impact on earnings. The underlying EBITA margin declined to 5.0 per cent for 2017, down from 5.9 per cent prior year. Several measures to improve production efficiency and achieve scale effects, including a restructuring of the road restraint business in Sweden, were introduced in 2017.
Reported EBITDA was NOK 202 million in 2017, down from NOK 233 million in 2016.
Underlying revenue and margin, Last 12 months NOK million
0
500
1000
1500
2000
2500
3000
Q4 17Q3 17Q2 17Q1 17Q4 160
2.0%
4.0%
6.0%
8.0%
10.0%
12.0%
2 648 2 656 2 668 2 677 2 780
Underlying Revenue LTM Underlying EBITDA margin
8.9% 9.0% 8.7% 8.3% 8.0%
Saferoad | Fourth quarter report 2017 7

Road Safety Europe Key figuresNOK million Q4 2017 Q4 2016 2017 2016
Operating revenue underlying 441 436 1 423 1 438
EBITDA underlying 47 66 123 137
EBITA underlying 41 58 98 104
EBITDA reported 46 61 136 132
EBITDA underlying margin% 10.6 % 15.1 % 8.6 % 9.5 %
EBITA underlying margin% 9.2 % 13.2 % 6.9 % 7.2 %
Development during the quarter Underlying revenue in the quarter was NOK 441 million, in line with the fourth quarter last year. Adjusted for the divestment of Limes Mobil GmbH and Saferoad Kisan, revenue increased by 10 per cent. The main growth driver was high volume in the maintenance business in Poland, high sales of road restraint systems in most markets and a positive development in the road marking business.
Underlying EBITA was NOK 41 million which is NOK 17 million lower than the same period last year. The decline is mainly due to high competition in road restraint systems in Germany and higher costs on maintenance contracts in Poland. In addition, the divested business areas reported an EBITA in the fourth quarter 2016 of NOK 3.7 million.
Reported EBITDA decreased to NOK 46 million from NOK 61 million.
Development during the year Underlying revenue in 2017 was NOK 1 423 million, in line with last year. Adjusted for the divestment of Limes Mobil GmbH and Saferoad Kisan, revenue increased by 9 per cent. The increase was mainly driven by higher sales of road restraint systems in Germany and a favourable market sentiment in Poland.
Underlying EBITA decreased to NOK 98 million from NOK 104 million. Adjusted for the effect of divestments, EBITA ended NOK 1 million below last year. The underlying EBITA margin was at 6.9 per cent in 2017, down from 7.2 per cent the year before.
Reported EBITDA was NOK 136 million, up from NOK 132 million in 2016.
Underlying revenue and margin, Last 12 months NOK million
0
200
400
600
800
1000
1200
1400
1600
Q4 17Q3 17Q2 17Q1 17Q4 160
2.0%
4.0%
6.0%
8.0%
10.0%
12.0%
1 438 1 439 1 451 1417 1 423
Underlying Revenue LTM Underlying EBITDA margin
9.5% 9.9% 10.6% 10.0% 8.6%
Saferoad | Fourth quarter report 20178

Road Infrastructure
Key figuresNOK million Q4 2017 Q4 2016 2017 2016
Operating revenue underlying 569 438 1 917 1 787
EBITDA underlying 64 38 134 142
EBITA underlying 57 35 106 116
EBITDA reported 66 38 129 142
EBITDA underlying margin% 11.3 % 8.7 % 7.0 % 8.0 %
EBITA underlying margin% 10.1 % 8.0 % 5.5 % 6.5 %
The Road Infrastructure business area offers a wide range of soil steel bridges, pipes, culverts, geosynthetics and water & sewage systems for road construction projects in Europe. It is divided into two geographical business regions, Road Infrastructure Nordic and Road Infrastructure Europe.
Underlying revenue was NOK 569 million in the quarter, an increase of 30 per cent compared to fourth quarter last year. The increase was mainly driven by higher sales in Poland as a result of high execution of projects and an overall positive market sentiment. Underlying EBITA increased by 64 per cent to NOK 57 million, up from NOK 35 million in the same period last year.
Underlying revenue, Last 12 months NOK million
Underlying revenue in 2017 was NOK 1 917 million, an increase of 7 per cent compared to last year. Higher revenues were driven by high sales in the Polish and Baltic markets and acquisition of Elikopol, which compensated lower demand in the Nordics and the divestment of the water & sewage business.
Underlying EBITA was NOK 106 million, down from NOK 116 million in the same period last year. Higher sales and good leverage of the fixed cost base, offset some of the effects of competition and unfavourable product-mix.
Underlying EBITDA and margin, Last 12 months NOK million
0
200
400
600
800
1000
1200
1400
1600
1800
2000
Q4 17Q3 17Q2 17Q1 17Q4 16
1 787 1 756 1 765 1 787 1 917
0
20
40
60
80
100
120
140
160
Q4 17Q3 17Q2 17Q1 17Q4 160
2.0%
4.0%
6.0%
8.0%
10.0%
142 134128 119 108
Underlying EBITDA LTM Underlying EBITDA margin
8.0% 7.3% 6.7% 6.0% 7.0%
Saferoad | Fourth quarter report 2017 9

Road Infrastructure Nordic
Key figures
NOK million Q4 2017 Q4 2016 2017 2016
Operating revenue underlying 140 174 743 851
EBITDA underlying (3) 5 25 51
EBITA underlying (4) 5 22 48
EBITDA reported 1 5 29 51
EBITDA underlying margin% (2.3 %) 3.0 % 3.4 % 6.0 %
EBITA underlying margin% (2.9 %) 2.9 % 2.9 % 5.7 %
Development during the quarter Underlying revenue in the quarter decreased by 20 per cent to NOK 140 million compared to fourth quarter last year. The decrease was mainly a result of lower demand for technical products and the divestment of the water & sewage business in Sweden.
Underlying EBITA was NOK (4) million, down from NOK 5 million in the fourth quarter of 2016. The underlying EBITA margin was (2.9) per cent compared to 2.9 per cent the year before. The decline was mainly driven by softer pricing in Finland and lower capacity utilisation in Sweden.
Reported EBITDA for the period was NOK 1 million compared to NOK 5 million in the fourth quarter 2016.
Development during the year Underlying revenue in 2017 decreased by 13 per cent to NOK 743 million. Lower revenue is mainly a result of the divestment of the water & sewage business, but lower demand for technical products in Sweden also impacted full year revenues.
Underlying EBITA decreased to NOK 22 million from NOK 48 million. Lower demand for both technical products and traded products combined with softer pricing impacted the margins also for the year. Consequently, the EBITA margin was 2.9 per cent for 2017, down from 5.7 per cent the year before.
Reported EBITDA was NOK 29 million, down from NOK 51 million in 2016.
Underlying revenue and margin, Last 12 months NOK million
0
200
400
600
800
1000
Q4 17Q3 17Q2 17Q1 17Q4 160
2.0%
4.0%
6.0%
8.0%
851 845 819 777 743
Underlying Revenue LTM Underlying EBITDA margin
6.0% 6.1% 5.9% 4.3% 3.4%
Saferoad | Fourth quarter report 201710

Road Infrastructure Europe
Key figuresNOK million Q4 2017 Q4 2016 2017 2016
Operating revenue underlying 436 273 1 224 1 001
EBITDA underlying 68 33 109 91
EBITA underlying 61 30 84 68
EBITDA reported 65 33 106 91
EBITDA underlying margin% 15.5 % 12.1 % 8.9 % 9.1 %
EBITA underlying margin% 14.1 % 10.9 % 6.9 % 6.8 %
Development during the quarterUnderlying revenue in the quarter increased by 60 per cent to NOK 436 million. The large increase was mainly driven by higher sales in Poland as a result of high execution of projects and orders at the tail-end of the high season, good export sales and an overall positive market sentiment in the region. The acquisition of Elikopol added NOK 33 million of revenue in the quarter compared to last year.
Underlying EBITA was NOK 61 million in the fourth quarter, up from NOK 30 million in the same period last year. This was driven by higher volume with improved margins. High volume of large span bridges and good leverage of the fixed cost base, returned higher margins than in 2016. This to some extent offset the lower margin in earlier quarters, where the increased sales mainly came from traded goods and plastic pipes. The profitability in Lithuania was low. The Group has initiated a restructuring and turnaround program of that business.
Reported EBITDA for the period was NOK 65 million, up from NOK 33 million a year ago.
Development during the year Underlying revenue in 2017 increased by 22 per cent to NOK 1 224 million. The overall market sentiment for the region was strong in 2017. The activity in Poland continued at a high level, the presence in the Turkish market was strengthened and new export projects were successfully executed. Several large span bridge installations in the last part of the year impacted the results positively.
Underlying EBITA increased to NOK 84 million from NOK 68 million, taking the underlying EBITA margin to 6.9 per cent from 6.8 per cent. The improvement in margin was a result of higher operating leverage.
Reported EBITDA was NOK 106 million, up from NOK 91 million a year ago. Underlying revenue and margin, Last 12 months NOK million
Other/Holding/Eliminations Holding costs consist of the unallocated costs associated with the Group’s corporate administration, financial management and the elimination of inter-segment sales.
Development during the quarter The underlying EBITA in the quarter was NOK (14) million compared to NOK (5) million in the corresponding period prior year. The increase in costs is mainly attributed to license fees and advisory costs. Reported EBITDA in the fourth quarter was NOK (10) million, compared to NOK (17) million in the corresponding quarter last year.
Development during the year The underlying EBITA for the full year was NOK (40) million compared to NOK (38) million last year. The increase in costs is mainly attributed to license fees and advisory cost in the last part of the year. Reported EBITDA for the full year was NOK (91) million, compared to NOK (60) million last year.
0
200
400
600
800
1000
1200
1400
Q4 17Q3 17Q2 17Q1 17Q4 160
2.0%
4.0%
6.0%
8.0%
10.0%
12.0%
1 001 973 1001 1060 1 224
Underlying Revenue LTM Underlying EBITDA margin
9.1% 7.9% 7.0% 7.0% 8.9%
Saferoad | Fourth quarter report 2017 11

Financial review
Saferoad had net interest bearing debt of NOK 0.9 billion at the end of the fourth quarter 2017 compared to 1.3 billion at the end of third quarter 2017 and 2.0 billion at year end 2016. The Group has significantly lower interest-bearing debt compared to the year before, following the refinancing and IPO in the second quarter 2017.
The equity ratio at year end 2017 was 54 per cent, compared to 25 per cent at year end 2016. The Group's financial position is good, with sufficient financial capacity to execute current projects and initiatives. The Group was in compliance with its financial covenants per 31 December 2017.
Development during the quarter The total cash flow was NOK 152 million in the fourth quarter 2017 compared to a total cash flow of NOK 73 million in the corresponding quarter in 2016. Higher cash flow from operations, combined with the divestment of the water & sewage business in Sweden, led to higher cash flow in fourth quarter 2017 compared to last year.
Net cash flow from operating activities was NOK 450 million for the fourth quarter 2017, compared to NOK 288 million for the fourth quarter 2016. The improvement is mainly related to a release of NOK 142 million in operating working capital1), driven by inventories due to higher sales volume in the last quarter and structured measures to improve working capital efficiency.
Net cash flow from investment activities was NOK 46 million for the fourth quarter 2017 compared to NOK (53) million for the fourth quarter last year. The change is mainly related to the divestment of the water & sewage business in Sweden.
Net cash flow from financing activities was NOK (344) million for the fourth quarter 2017 compared to NOK (162) million for the fourth quarter last year. The amount drawn under the multicurrency revolving facility (RCF) loan was reduced by NOK 300 million in the fourth quarter 2017. This was offset by lower repayment of other borrowings of NOK 60 million and lower interest payment of NOK 46 million compared to last year.
Development during the year The total cash flow was NOK 67 million in 2017 compared to a total cash flow of NOK (208) million in 2016. The increase is mainly related to NOK 1 400 million proceeds from the issue of ordinary shares in connection with the listing on Oslo Stock Exchange in May 2017 and NOK 139 million from a shareholder loan. This was partly offset by the repayment of debt and buy-out of non-controlling interests. Sale of subsidiaries and the divestment of the water & sewage business in Sweden also led to higher cash flow in 2017 compared to last year.
1) Operational working capital consists of inventories, trade receivables and accounts payables.
Net cash flow from operating activities was NOK 207 million in 2017, compared to NOK 243 million in 2016. The change is mainly related to transaction costs of NOK 67 million in connection with the public listing of Saferoad in May 2017, partly offset by a release of NOK 47 million in operating working capital, due to a structured program initiated to increase working capital efficiency.
Net cash flow from investment activities was NOK (293) million in 2017 compared to NOK (162) million in 2016. The change is mainly related to buy-out of non-controlling interests in 2017, which was partly offset by the divestment of the water & sewage business in Sweden and the sale of the subsidiaries Limes Mobil GmbH and Saferoad Kisan.
Net cash flow from financing activities was NOK 153 million in 2017 compared to NOK (289) million in 2016. The increase is mainly related to NOK 1 400 million proceeds from the issue of ordinary shares in connection with the listing on Oslo Stock Exchange, NOK 139 million from a shareholder loan and NOK 64 million lower interest payment due to significant decrease in net interest-bearing debt following the refinancing in connection with the IPO. This was partly offset by the repayment of debt.
Financial items
Development during the quarter Net financial income amounted to NOK 31 million for the fourth quarter, compared to a net expense of NOK 79 million for the fourth quarter 2016.
Financial income was NOK 2 million lower in the fourth quarter 2017 compared to fourth quarter 2016.
Financial expenses decreased by NOK 69 million in the fourth quarter 2017 compared to the corresponding period in 2016. The decrease is mainly explained by the following factors:
· Interest expense decreased by NOK 37 million in the quarter compared to corresponding period in 2016, due to a significant decrease in net interest-bearing debt following the refinancing in connection with the IPO as well as the conversion of shareholder loans to equity in the fourth quarter 2016.
· Other financial expenses decreased by NOK 32 million in the quarter compared to the corresponding period in 2016, mainly explained by decrease in estimated future payments of minority buy-outs and acquired shares.
Saferoad | Fourth quarter report 201712
The net foreign exchange gain was NOK 39 million in the quarter compared to a loss of NOK 3 million in the fourth quarter the prior year. The exchange gains and losses arise from entities holding Group internal and external monetary positions in currencies different from the entity's functional currency.
The NOK depreciated against the main foreign currencies in the fourth quarter resulting in currency gains on group internal short-term financing denominated in the subsidiary functional currency.
Development during the year Net financial income amounted to NOK 59 million in 2017, compared to a net expense of NOK 330 million in 2016.
Financial income was NOK 127 million higher in 2017 compared to 2016. The increase is mainly explained by income from debt extinguishment of a shareholder loan of NOK 139 million in 2017.
Financial expenses decreased by NOK 117 million in 2017 compared to 2016. The decrease is mainly explained by the following factors:
· Interest expense decreased by NOK 122 million in 2017 compared to 2016, due to a significant decrease in net interest-bearing debt following the refinancing in connection with the IPO, as well as the conversion of shareholder loans to equity in the fourth quarter 2016.
· Other financial expenses increased by NOK 5 million in 2017 compared to 2016. The increase is mainly explained by bank fees capitalised in prior periods that were expensed in the first quarter 2017, as a consequence of the refinancing in connection with the listing on Oslo Stock Exchange. This is partly offset by decrease in estimated future payments of minority buy-outs and acquired shares.
The net foreign exchange gain was NOK 47 million 2017 compared to a loss of NOK 97 million in 2016. The exchange gains and losses arise from entities holding Group internal and external monetary positions in currencies different from the entity's functional currency.
NOK depreciated against the main foreign currencies in 2017 resulting in currency gains on group internal short-term financing denominated in the subsidiary functional currency. This compares to 2016 when NOK appreciated against the main foreign currencies, driving net currency losses for the Group.
Saferoad | Fourth quarter report 2017 13
Outlook
The outlook for the Group’s main markets looks promising in the coming years. Overall, EU and national government spending to build, maintain and upgrade the road infrastructure in Saferoad’s addressable markets is projected to grow five to six per cent annually in real terms over the next years. The Group is well positioned to grow with a strong market position, a competitive product portfolio and an extensive sales and service network.
The Group is continuously working to further strengthen its competitive position and improve profitability through opera-tional improvement initiatives. In addition, the Group is actively working to improve the structure and focus of its business portfolio. Mergers and acquisitions are a key part of Saferoad's strategy to develop its offering and drive growth. The Group maintains its positive view on the prospects of making accretive acquisitions.
Short-term outlook The first quarter is the one with the lowest activity level due to winter conditions across most of the Group’s main markets. In this quarter, the Group prepares for the high season by maintaining and upgrading machinery and equipment, as well as building inventories to ensure efficient and timely customer deliveries throughout the high season. The financial perfor-mance in the first quarter has limited bearing for the perfor-mance of the full year.
Operating earnings in the first quarter are expected to be weaker than in the first quarter last year. In the Road Safety area, a shift in project phasing in the UK and Poland is expected to result in lower volume compared to last year. The road restraint systems business in Europe also had a positive impact from significant raw materials purchases at favourable prices last year that will not be repeated this year. In addition, the Group acquired the work zone protection company Trafikkdirigering in the fourth quarter, which is a seasonal business with negative earnings in the first quarter (around NOK 7 million in 2017). No significant changes are expected in the Road Infrastructure area.
The winter in Scandinavia has so far been stronger than last year, with an unusually high level of snow in several areas. If this continues throughout the quarter, sales volumes could be negatively impacted.
Outlook for the year Even though operating earnings in the first quarter are expected to be lower than last year, the operating earnings for the full year are expected to increase compared to 2017. This is due to a combination of good market conditions, company growth initiatives, margin improvement initiatives and active portfolio management.
Demand is expected to continue to grow across the majority of the product segments and business areas, driven by a continued high investment into the infrastructure sector in most of the Group´s main markets. In the Road Safety area, the Group continues to expand the work zone protection business and there are also significant projects for road restraint systems available in the Nordics and in Europe. In the Road Infrastructure area, the Group does not yet see an uptick in the project activity or demand for technical products in Sweden and Finland and does not expect a material improvement in performance there. In the Europe region, however, the Group expects a continued improvement on the back of growing demand in home markets and additional sales efforts in export markets.
The Group has intensified its focus on raising profitability in 2018 and have initiated and executed several initiatives to improve margins. The restructuring of the RRS business in Sweden is expected to positively impact the performance. The Group has also launched a program to reduce the fixed cost base in Norway and is working on a series of other operational improvement projects. In addition, the Group has initiated an exit of the water and sewage business in Lithuania. The combined effect of these initiatives is around NOK 40 million. Furthermore, the portfolio measures taken last year – the divest-ment of the water and sewage business in Sweden, the exit of the RRS business in Turkey, the acquisitions of Trafikkdirigering and the acquisition of Elikopol – had limited impact on the 2017 financials but is expected to have a positive impact of around NOK 20 million in 2018 (pro forma effect). Given this sizable collection of initiatives either already executed or in progress, the Group is confident on its ability to improve the profitability in 2018.
The mid-term financial targets for Saferoad are unchanged. The Group aims to achieve an average annual revenue growth of 5 per cent and increase the EBITDA margin towards the 10 per cent level.
Oslo, 13 February 2018 The Board of Saferoad Holding ASA
Carl Johan Henrik Ek Chairman of the Board
Bård Martin Mikkelsen Board member
Liisa Annika Poutiainen Board member
Synnøve Lyssand Sandberg Board member
Gry Hege Sølsnes Board member
Olof Bertil Faxander Board member
Jan Torgeir Hovden Board member
Knut Brevik Board member
Britt Sandvik Board member
Morten Holum CEO Saferoad
Saferoad | Fourth quarter report 201714

Financial statements (unaudited)
NOK million Notes Q4 2017 Q4 2016 2017
2016
Total operating revenue 4 1 792 1 537 6 051 5 764
Cost of goods sold (1 078) (883) (3 558) (3 337)
Personnel costs (338) (305) (1 287) (1 192)
Other operating costs (227) (212) (830) (788)
Total operating cost (1 643) (1 400) (5 675) (5 317)
EBITDA 4 149 137 375 447
Depreciation and impairment (38) (48) (151) (167)
EBITA 4 110 89 224 280
Amortisation and impairment (21) (330) (70) (390)
EBIT 89 (241) 154 (110)
Financial income 5 7 151 24
Financial expenses (14) (82) (139) (256)
Net exchange rate gain/(loss) 39 (3) 47 (97)
Share of profit/(loss) of associated companies 0 0 1 0
Net financial income/(expense) 31 (79) 59 (330)
Income/(loss) before tax 120 (320) 213 (440)
Income taxes 17 7 21 1
Net income/(loss) 137 (312) 234 (439)
Items to be reclassified to profit/(loss) in subsequent periods
Exchange difference on translation of foreign operations 42 13 68 34
Items not to be reclassified to profit/(loss) in subsequent periods
Remeasurement of net defined benefit liability (4) 0 (4) (4)
Other comprehensive income, net of tax 39 12 65 30
Total comprehensive income 176 (300) 299 (409)
Profit/(loss) attributable to:
Equity holders of the parent company 136 (311) 233 (460)
Non-controlling interests 2 (2) 1 21
137 (312) 234 (439)
Total comprehensive income attributable to:
Equity holders of the parent company 174 (310) 285 (418)
Non-controlling interests 3 9 14 9
176 (300) 299 (409)
Average number of shares1) 66 666 667 66 666 667 66 666 667 66 666 667
EPS (Earnings per share) in NOK (basic and diluted) 2.03 (4.66) 3.50 (6.90)
1) After share split adopted on 2 May 2017 and issue of new shares as part of the listing 29 May 2017
Condensed statement of comprehensive income
Saferoad | Fourth quarter report 2017 15
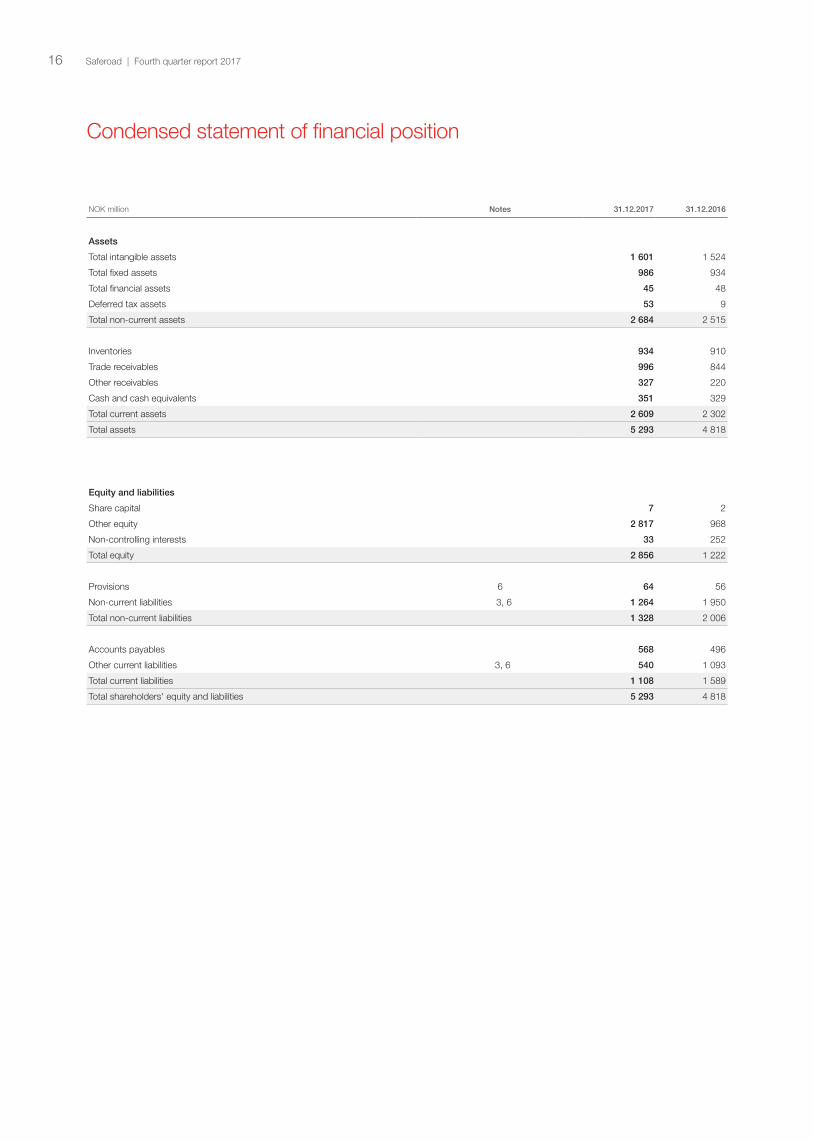
Condensed statement of financial position
NOK million Notes 31.12.2017 31.12.2016
Assets
Total intangible assets 1 601 1 524
Total fixed assets 986 934
Total financial assets 45 48
Deferred tax assets 53 9
Total non-current assets 2 684 2 515
Inventories 934 910
Trade receivables 996 844
Other receivables 327 220
Cash and cash equivalents 351 329
Total current assets 2 609 2 302
Total assets 5 293 4 818
Equity and liabilities
Share capital 7 2
Other equity 2 817 968
Non-controlling interests 33 252
Total equity 2 856 1 222
Provisions 6 64 56
Non-current liabilities 3, 6 1 264 1 950
Total non-current liabilities 1 328 2 006
Accounts payables 568 496
Other current liabilities 3, 6 540 1 093
Total current liabilities 1 108 1 589
Total shareholders' equity and liabilities 5 293 4 818
Saferoad | Fourth quarter report 201716
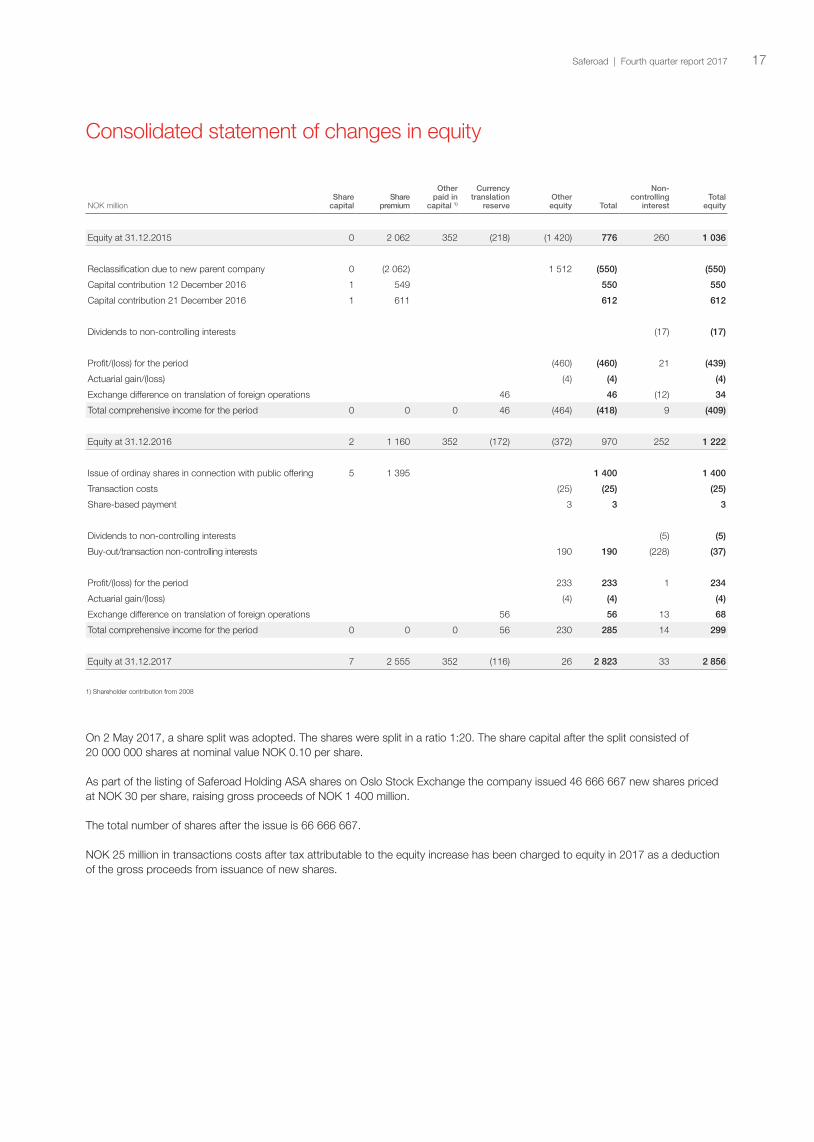
Consolidated statement of changes in equity
NOK millionShare
capitalShare
premium
Other paid in
capital 1)
Currency translation
reserveOther equity Total
Non- controlling
interestTotal
equity
Equity at 31.12.2015 0 2 062 352 (218) (1 420) 776 260 1 036
Reclassification due to new parent company 0 (2 062) 1 512 (550) (550)
Capital contribution 12 December 2016 1 549 550 550
Capital contribution 21 December 2016 1 611 612 612
Dividends to non-controlling interests (17) (17)
Profit/(loss) for the period (460) (460) 21 (439)
Actuarial gain/(loss) (4) (4) (4)
Exchange difference on translation of foreign operations 46 46 (12) 34
Total comprehensive income for the period 0 0 0 46 (464) (418) 9 (409)
Equity at 31.12.2016 2 1 160 352 (172) (372) 970 252 1 222
Issue of ordinay shares in connection with public offering 5 1 395 1 400 1 400
Transaction costs (25) (25) (25)
Share-based payment 3 3 3
Dividends to non-controlling interests (5) (5)
Buy-out/transaction non-controlling interests 190 190 (228) (37)
Profit/(loss) for the period 233 233 1 234
Actuarial gain/(loss) (4) (4) (4)
Exchange difference on translation of foreign operations 56 56 13 68
Total comprehensive income for the period 0 0 0 56 230 285 14 299
Equity at 31.12.2017 7 2 555 352 (116) 26 2 823 33 2 856
1) Shareholder contribution from 2008
On 2 May 2017, a share split was adopted. The shares were split in a ratio 1:20. The share capital after the split consisted of 20 000 000 shares at nominal value NOK 0.10 per share.
As part of the listing of Saferoad Holding ASA shares on Oslo Stock Exchange the company issued 46 666 667 new shares priced at NOK 30 per share, raising gross proceeds of NOK 1 400 million.
The total number of shares after the issue is 66 666 667.
NOK 25 million in transactions costs after tax attributable to the equity increase has been charged to equity in 2017 as a deduction of the gross proceeds from issuance of new shares.
Saferoad | Fourth quarter report 2017 17

Consolidated statement of cash flows
NOK million Q4 2017 Q4 2016 2017
2016
Cash flow from operations
Profit/loss before tax 120 (320) 213 (440)
Income tax paid (3) (17) (28) (69)
(Gain)/loss on sale of tangible assets and subsidiaries (5) 0 (25) (5)
Net depreciation, amortisation and impairment 59 378 221 558
Net financial items (16) 108 (49) 327
Changes in working capital 295 139 (126) (128)
Net cash flow from operations 450 288 207 243
Cash flow from investment activities
Buy-out of non-controlling interests, acquisition of subsidiaries, fixed and intangible assets (55) (47) (468) (195)
Proceeds from sale of subsidiaries and fixed assets 97 0 168 13
Interest received and other changes 4 (7) 7 20
Net cash flow from investment activities 46 (53) (293) (162)
Cash flow from financing activities
Proceeds from borrowings 6 3 1 325 22
Repayment of borrowings (332) (91) (2 632) (137)
Proceeds from issue of ordinary shares (1) 0 1 367 0
Proceed from shareholder loan 0 0 139 0
Dividends and loans from the sellers (former minority shareholders) (2) (11) 47 (17)
Interest paid (16) (62) (93) (158)
Net cash flow from financing activities (344) (162) 153 (289)
Net increase/(decrease) in cash and cash equivalents 152 73 67 (208)
Effect of exchange rate differences on cash and cash equivalents 12 (6) 19 (34)
Cash and cash equivalents at beginning of the year 187 199 266 508
Cash and cash equivalents at the end of the period 351 266 351 266
Cash and cash equivalents at the end of the period in statement of financial position 351 329 351 329
Bank overdrafts at the end of the period in statement of financial position 0 (63) 0 (63)
Cash and cash equivalents at the end of the period in statement of cash flow 351 266 351 266
Saferoad | Fourth quarter report 201718

Notes to the condensed consolidated financial statements
Note 1 Company information
Saferoad Holding ASA is a public limited company and the parent company of Saferoad Group. The Company is
incorporated and domiciled in Oslo with its registered office, Enebakkveien 150, 0680 Oslo, Norway.
Note 2 Accounting principles
The interim accounts are presented in accordance with IAS 34 Interim Financial Reporting. The accounting principles adopted in the interim consolidated financial statements are consistent with those followed in the preparation of the Group’s Annual Financial Statements for the year ended 31 December 2016.
Saferoad’s accounting principles are presented in note 2 Accounting principles in Saferoad’s Financial Statements for 2016. As a result of rounding adjustments, the figures in one or more columns may not add up to the total of that column.
Future IFRS amendments
IFRS 15 Revenue from Contracts with Customers IFRS 15 Revenue from Contracts with Customers is effective from 1 January 2018 and approved by the EU. IFRS 15 establish a five-step model to account for revenue arising from contracts with customers. Under IFRS 15, revenue is recog-nised at an amount that reflects the consideration to which an entity expects to be entitled in exchange for transferring goods or services to a customer, replacing the current principle that revenue is recognised when the risks and rewards of ownership have been transferred to the buyer.
The Group has adopted the new standard from 1 January 2018, with a modified retrospective application. The impact of IFRS 15 adoption is expected to be not significant on the timing and measurement of revenues as of 1 January 2018, and consequently with no significant effects on equity as of 31 December 2017. The presentation and disclosure requirements in IFRS 15 are more detailed than under current IFRS. The Group expects that the notes to the financial statements will be expanded, including disclosure of disaggregation of revenues recognised from contracts with customers into product categories.
IFRS 9 Financial Instruments IFRS 9 Financial Instruments is effective from 1 January 2018 and approved by the EU. IFRS 9 replaces IAS 39. The standard introduces new requirements for classification and measure-ment, impairment and hedge accounting.
The Group has adopted the new standard from 1 January 2018, with retrospective application as required. The impact of IFRS 9 adoption is expected to be not significant on the statement of financial position, with no significant effects on equity as of 31 December 2017.
IFRS 16 Leases IFRS 16 Leases is effective from 1 January 2019 and approved by the EU. IFRS 16 replaces existing IFRS leases requirements, IAS 17. IFRS 16 sets out the principles for the recognition, measurement, presentation and disclosure of leases for both parties to a contract, i.e. the customer (‘lessee’) and the supplier (‘lessor’).
The Group plans to adopt the new standard from 1 January 2019. The standard requires lessees to recognise all leases under a single on-balance sheet model with exemptions for low-value assets and short term-leases. The Group has leasing commitments for machinery, offices and other facilities, expected for a larger part to be recognised in the statement of financial position. No decision has been made with respect to the implementation of the standard, which can be implemented using either the full retrospective or modified retrospective method. In 2018, the Group will continue to assess the effect of IFRS 16 on its consolidated financial statements.
Saferoad | Fourth quarter report 2017 19
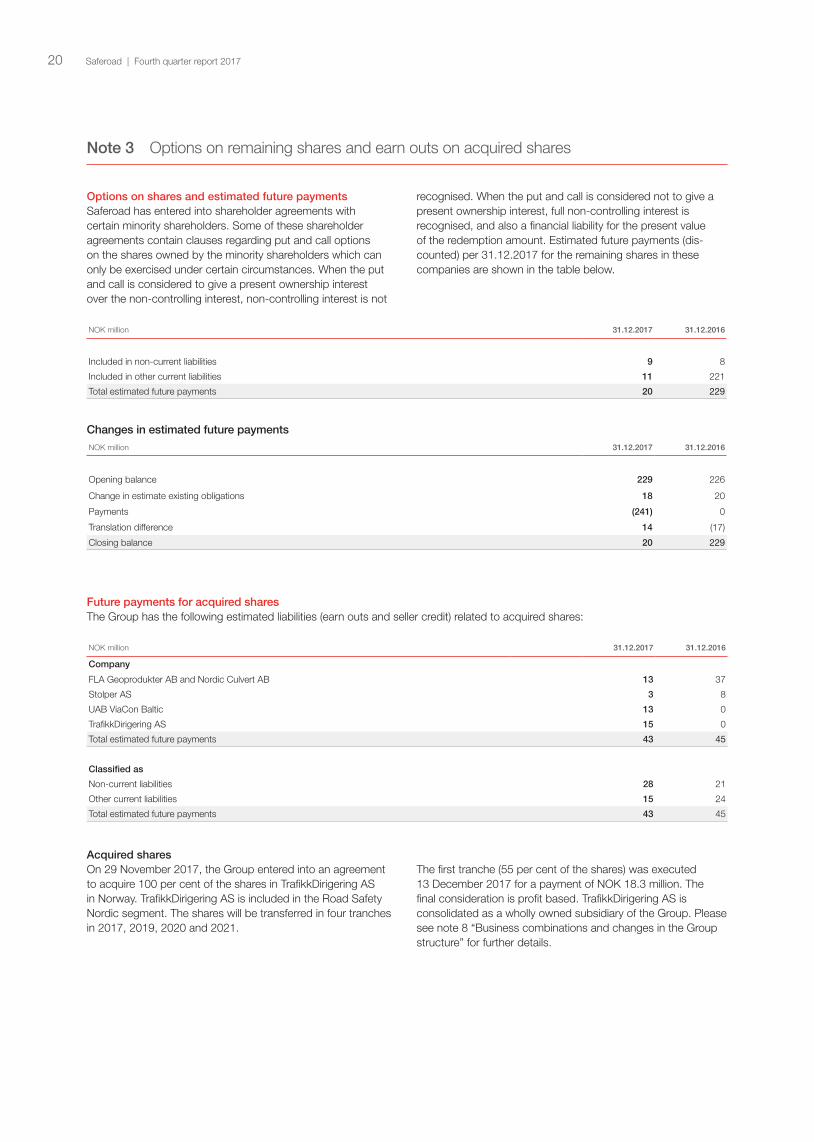
Note 3 Options on remaining shares and earn outs on acquired shares
Options on shares and estimated future payments Saferoad has entered into shareholder agreements with certain minority shareholders. Some of these shareholder agreements contain clauses regarding put and call options on the shares owned by the minority shareholders which can only be exercised under certain circumstances. When the put and call is considered to give a present ownership interest over the non-controlling interest, non-controlling interest is not
recognised. When the put and call is considered not to give a present ownership interest, full non-controlling interest is recognised, and also a financial liability for the present value of the redemption amount. Estimated future payments (dis-counted) per 31.12.2017 for the remaining shares in these companies are shown in the table below.
NOK million 31.12.2017 31.12.2016
Included in non-current liabilities 9 8
Included in other current liabilities 11 221
Total estimated future payments 20 229
Changes in estimated future paymentsNOK million 31.12.2017 31.12.2016
Opening balance 229 226
Change in estimate existing obligations 18 20
Payments (241) 0
Translation difference 14 (17)
Closing balance 20 229
Future payments for acquired shares The Group has the following estimated liabilities (earn outs and seller credit) related to acquired shares:
NOK million 31.12.2017 31.12.2016
Company
FLA Geoprodukter AB and Nordic Culvert AB 13 37
Stolper AS 3 8
UAB ViaCon Baltic 13 0
TrafikkDirigering AS 15 0
Total estimated future payments 43 45
Classified as
Non-current liabilities 28 21
Other current liabilities 15 24
Total estimated future payments 43 45
Acquired shares On 29 November 2017, the Group entered into an agreement to acquire 100 per cent of the shares in TrafikkDirigering AS in Norway. TrafikkDirigering AS is included in the Road Safety Nordic segment. The shares will be transferred in four tranches in 2017, 2019, 2020 and 2021.
The first tranche (55 per cent of the shares) was executed 13 December 2017 for a payment of NOK 18.3 million. The final consideration is profit based. TrafikkDirigering AS is consolidated as a wholly owned subsidiary of the Group. Please see note 8 “Business combinations and changes in the Group structure” for further details.
Saferoad | Fourth quarter report 201720

Note 4 Operating segment information
Segment performance is evaluated based on "underlying EBITDA” and “underlying EBITA” which deviates from EBITDA and EBITA derived from the consolidated financial statements. In the internal reporting, revenues and expenses are adjusted for items which management believes to be non-recurring, such as restructuring expenses, gains and losses (including transaction costs) from disposals of business, transaction costs from preparations and execution of the Group IPO, impairment loss and other non-recurring items.
Segment structureThe operating segments presented are the key components of Saferoad’s business and the segment note follows the structure of internal reporting. The following operating segments have been identified: Road Safety Nordic, Road Safety Europe, Road Infrastructure and Other/Holding. The segments are managed as separate and strategic businesses and no operating segment has been combined for the purpose of segment reporting. Assets and liabilities are not included in the internal reporting.
Road Safety Europe and Road Safety NordicThe Road Safety segments offer road restraint systems (guardrails and bridge parapets), lighting columns and other traffic accommodation products and services (signs, work zone protection and road marking) to contractors and road authorities in the Nordics and rest of Europe.
Road InfrastructureRoad Infrastructure offers a wide range of soil steel bridges, pipes, culverts, geosynthetics and water and sewage systems for road construction projects in Europe. The segment is divided in two geographical business regions, Road Infrastructure Nordic and Road Infrastructure Europe.
Other/Holding/EliminationsThe Other/Holding/Eliminations segment consists of the unallocated costs associated with the Group’s corporate administration, financial management and the elimination of inter-segment sales.
Operating segment informationThe reported measures of segment profit are EBITDA and EBITA. Saferoad’s definition of EBITDA and EBITA may be different from other companies. Transfer prices between operating segments are on an arm’s length basis in a manner similar to transactions with third parties. The following tables include information about Saferoad’s operating segments and business areas. Depreciation and impairments related to excess values for fixed assets recognised at acquisition are not allocated to the segments but are shown under ‘Depreciation other’ and ‘Impairment other’.
NOK million Q4 2017 Q4 2016 2017 2016
Operating revenue underlying
Segment Road Safety Nordic 799 695 2 780 2 648
Segment Road Safety Europe 441 436 1 423 1 438
Other/Eliminations (14) (24) (54) (71)
Road Safety 1 226 1 107 4 150 4 015
Road Infrastructure Nordic 140 174 743 851
Road Infrastructure Europe 436 273 1 224 1 001
Other/Eliminations (8) (9) (49) (65)
Segment Road Infrastructure 569 438 1 917 1 787
Other/Holding/Eliminations (7) (9) (39) (38)
Operating revenue underlying 1 787 1 537 6 028 5 764
Adjustments 1) 4 0 23 0
Operating revenue reported 1 792 1 537 6 051 5 764
1) Items which management believe to be non-recurring
Saferoad | Fourth quarter report 2017 21
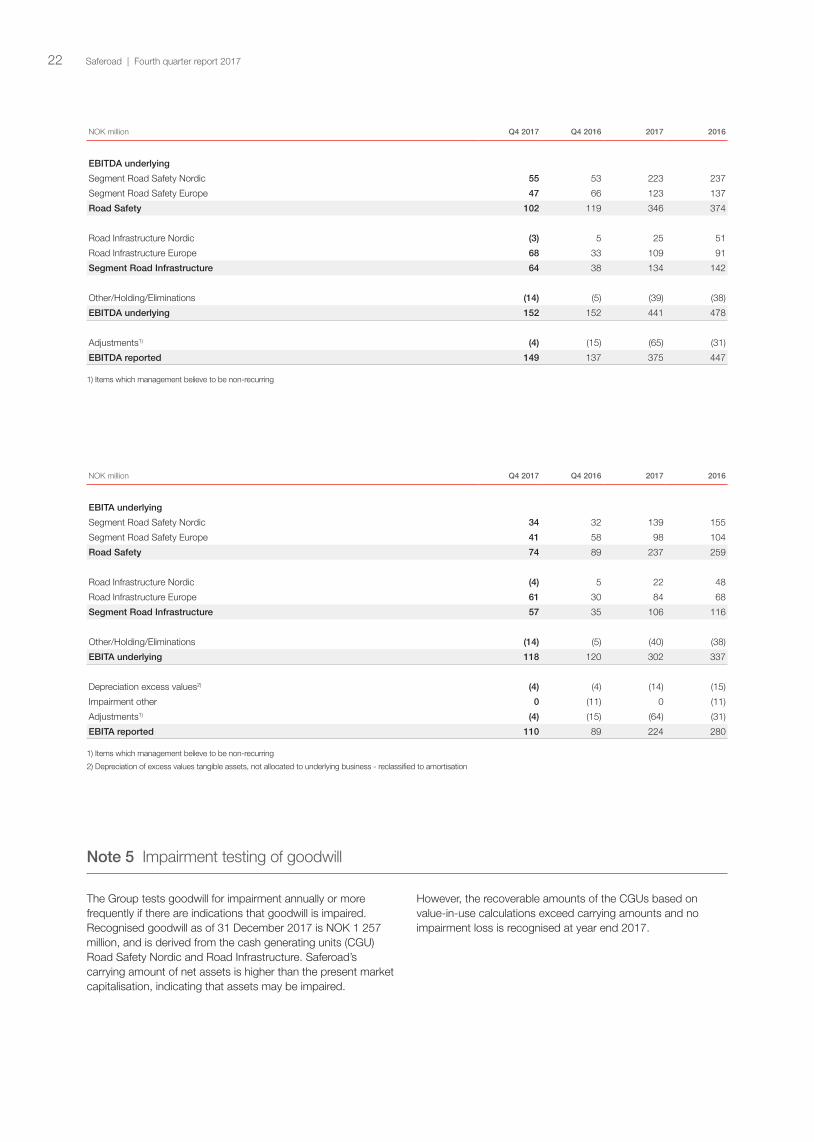
NOK million Q4 2017 Q4 2016 2017 2016
EBITDA underlying
Segment Road Safety Nordic 55 53 223 237
Segment Road Safety Europe 47 66 123 137
Road Safety 102 119 346 374
Road Infrastructure Nordic (3) 5 25 51
Road Infrastructure Europe 68 33 109 91
Segment Road Infrastructure 64 38 134 142
Other/Holding/Eliminations (14) (5) (39) (38)
EBITDA underlying 152 152 441 478
Adjustments1) (4) (15) (65) (31)
EBITDA reported 149 137 375 447
1) Items which management believe to be non-recurring
NOK million Q4 2017 Q4 2016 2017 2016
EBITA underlying
Segment Road Safety Nordic 34 32 139 155
Segment Road Safety Europe 41 58 98 104
Road Safety 74 89 237 259
Road Infrastructure Nordic (4) 5 22 48
Road Infrastructure Europe 61 30 84 68
Segment Road Infrastructure 57 35 106 116
Other/Holding/Eliminations (14) (5) (40) (38)
EBITA underlying 118 120 302 337
Depreciation excess values2) (4) (4) (14) (15)
Impairment other 0 (11) 0 (11)
Adjustments1) (4) (15) (64) (31)
EBITA reported 110 89 224 280
1) Items which management believe to be non-recurring
2) Depreciation of excess values tangible assets, not allocated to underlying business - reclassified to amortisation
Note 5 Impairment testing of goodwill
The Group tests goodwill for impairment annually or more frequently if there are indications that goodwill is impaired. Recognised goodwill as of 31 December 2017 is NOK 1 257 million, and is derived from the cash generating units (CGU) Road Safety Nordic and Road Infrastructure. Saferoad’s carrying amount of net assets is higher than the present market capitalisation, indicating that assets may be impaired.
However, the recoverable amounts of the CGUs based on value-in-use calculations exceed carrying amounts and no impairment loss is recognised at year end 2017.
Saferoad | Fourth quarter report 201722
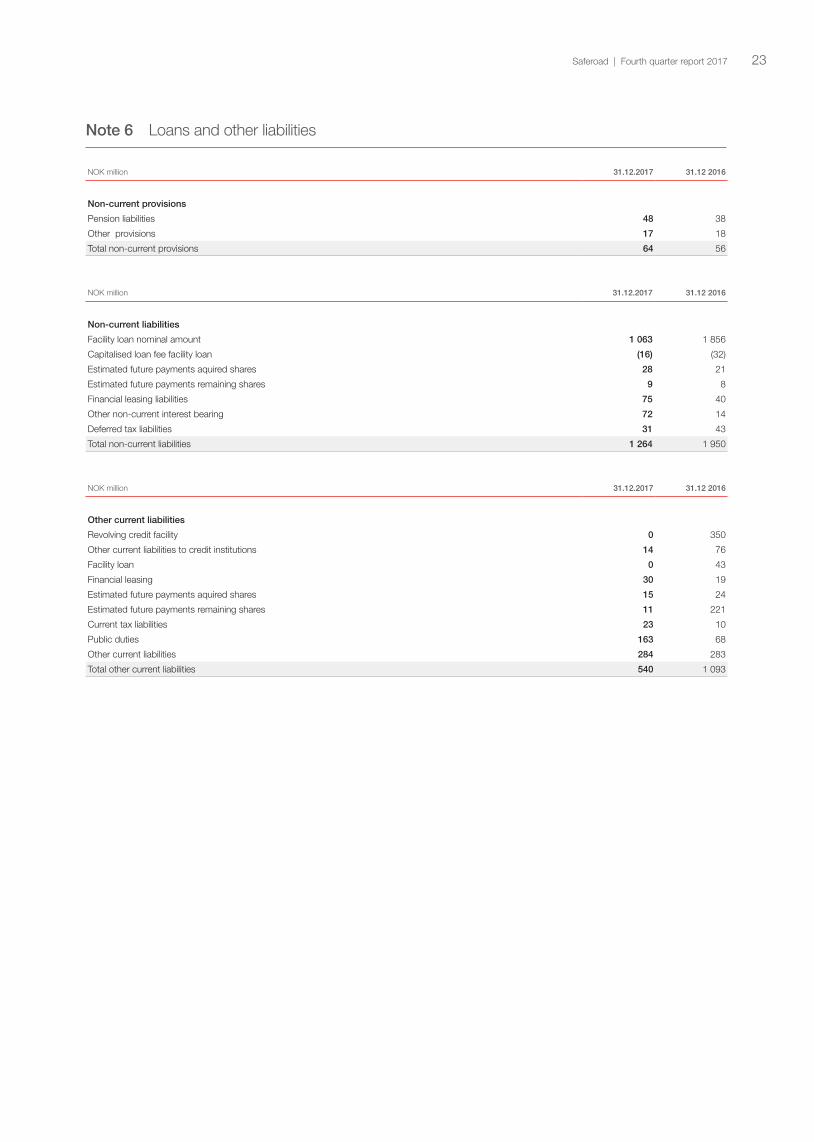
Note 6 Loans and other liabilities
NOK million 31.12.2017 31.12 2016
Non-current provisions
Pension liabilities 48 38
Other provisions 17 18
Total non-current provisions 64 56
NOK million 31.12.2017 31.12 2016
Non-current liabilities
Facility loan nominal amount 1 063 1 856
Capitalised loan fee facility loan (16) (32)
Estimated future payments aquired shares 28 21
Estimated future payments remaining shares 9 8
Financial leasing liabilities 75 40
Other non-current interest bearing 72 14
Deferred tax liabilities 31 43
Total non-current liabilities 1 264 1 950
NOK million 31.12.2017 31.12 2016
Other current liabilities
Revolving credit facility 0 350
Other current liabilities to credit institutions 14 76
Facility loan 0 43
Financial leasing 30 19
Estimated future payments aquired shares 15 24
Estimated future payments remaining shares 11 221
Current tax liabilities 23 10
Public duties 163 68
Other current liabilities 284 283
Total other current liabilities 540 1 093
Saferoad | Fourth quarter report 2017 23
Note 7 Other commitments and contingencies
In June 2015, the Danish Competition Council found Eurostar Denmark A/S, a company within the Group, non-compliant with the Danish and EU competition law by having engaged in joint bidding via a consortium with LKF Vejmarkering A/S in a tender for road marking in Denmark. Prior to entering the joint bidding consortium, Eurostar Denmark A/S sought legal advice, which stated that such a joint bidding consortium did not infringe applicable competition law. The decision was contested by Eurostar Denmark A/S and appealed to the Danish Competition Appeals Tribunal, which upheld the decision in April 2016. Eurostar Denmark has appealed the decision from the Danish Competition Council and brought the case before the Danish
Maritime and Commercial High Court where it is currently pend-ing. The trial is scheduled for May 2018. Additional disclosures of information as required by IAS 37 regarding this case are not made, due to the ongoing proceedings.
Note 8 Business combinations and changes in the Group structure
On 13 December 2017, the Group acquired TrafikkDirigering AS in Norway. The company is included in the Road Safety Nordic segment. TrafikkDirigering AS is a leading player in the Norwegian market for work zone protection services and had revenue of NOK 92 million in 2016. The preliminary purchase price is allocated into customer relationship with deferred tax liabilities, goodwill and identifiable current assets and liabilities, mainly consisting of machines, rental equipment, accounts receivables and liabilities to financial institutions.
On 1 November 2017, the divestment of the Swedish water & sewage business of Saferoad’s subsidiary ViaCon AB in the Road Infrastructure segment was completed. The transaction with Ahlsell AB was completed in accordance with the agreement entered into in June 2017 and resulted in a gain of NOK 4.2 million.
Saferoad | Fourth quarter report 201724

Note 9 Related parties
The Group has the following transactions with shareholders, associated companies or companies that can be considered related to members of the Board of Directors or leading executives.
NOK million Q4 2017 2017 2016
Profit and loss:
Sales to related parties 1 2 0
Purchases from related parties 18 75 9
Extinguishment of loan from Cidron Triangle Ltd1) 0 139 0
Interest expense shareholder loans 0 0 66
Balance sheet:
Receivables 15 15 11
Payables (4) (4) 0
Loans from other related parties (56) (56) 11
1) In preparation to the IPO Cidron Triangle Limited decided to extinguish a short-term loan to Saferoad Group.
Note 10 Events after the balance sheet date
There were no significant events for the Group after the balance sheet date.
Saferoad | Fourth quarter report 2017 25

Alternative performance measures (APMs)
APMs are used by Saferoad for annual and periodic financial reporting to provide a better understanding of the company's underlying financial performance for the period. Underlying revenue, underlying EBITDA and underlying EBITA is also used by management to drive performance in terms of target setting. These measures are adjusted IFRS measures defined, calculated and used in a consistent and transparent manner over time and across the Group where relevant. Operational measures such as volumes, prices and currency effects are not defined as APMs. Saferoad focuses on underly-ing EBITDA and underlying EBITA in the discussions of periodic operating results for the segments and for the Group. Each of the following APMs has been defined by the Group as follows:
· Net interest-bearing debt is defined as liabilities which require payment of interest minus cash and cash equivalents.
· Underlying revenue is defined as reported operating revenue adjusted for material items such as gains from divestments of businesses, as well as other major effects of a special nature.
· EBITDA is defined as operating profit (loss) before interests, income tax, depreciation and amortisation.
· Underlying EBITDA is defined as EBITDA adjusted for material items which are not regarded as part of underlying business performance for the period, such as costs related to acquisitions and divestments, major restructuring costs and closure costs, major impairments of property, plant and equipment, gains and losses of disposals of businesses and operating assets, as well as other major effects of a special nature.
· EBITA is defined as operating profit/(loss) before interests, income tax and amortisation.
· Underlying EBITA is defined as EBITA adjusted for material items which are not regarded as part of underlying business performance for the period, such as costs related to acquisi-tions and divestments, major restructuring costs and closure costs, major impairments of property, plant and equipment, depreciations of excess values of tangibles, gains and losses of disposals of businesses and operating assets, as well as other major effects of a special nature.
· Underlying net income is defined as net income adjusted for material items which are not regarded as part of underlying business performance for the period, such as costs related to acquisitions and divestments, major restructuring costs and closure costs, major impairments of property, plant and equipment, depreciations of excess values of tangible assets, gains and losses of disposals of businesses and operating assets, impairments of intangible assets, change in deferred tax, changes in earn outs and estimated future payments related to options on shares, and unrealised foreign exchange rate gains/losses, as well as other major effects of a special nature.
Net interest bearing debt has been calculated as follows:
NOK million 31.12.2017 31.12.2016
Net interest bearing debt
Facility loans (including RCF) 1 048 2 217
Leasing 106 59
Other interest bearing debt 91 101
Total interest bearing debt 1 244 2 377
Cash and cash equivalents 351 329
Net interesting bearing debt 893 2 048
Saferoad | Fourth quarter report 201726
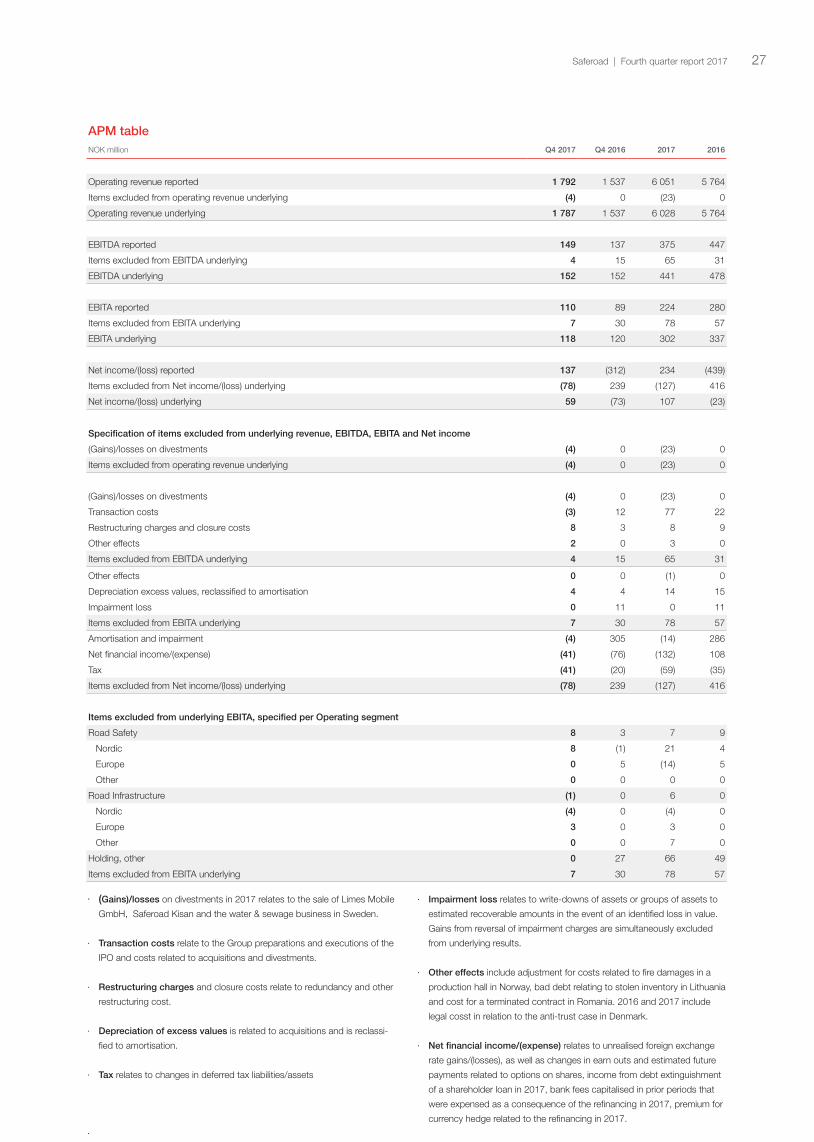
APM table NOK million Q4 2017 Q4 2016 2017 2016
Operating revenue reported 1 792 1 537 6 051 5 764
Items excluded from operating revenue underlying (4) 0 (23) 0
Operating revenue underlying 1 787 1 537 6 028 5 764
EBITDA reported 149 137 375 447
Items excluded from EBITDA underlying 4 15 65 31
EBITDA underlying 152 152 441 478
EBITA reported 110 89 224 280
Items excluded from EBITA underlying 7 30 78 57
EBITA underlying 118 120 302 337
Net income/(loss) reported 137 (312) 234 (439)
Items excluded from Net income/(loss) underlying (78) 239 (127) 416
Net income/(loss) underlying 59 (73) 107 (23)
Specification of items excluded from underlying revenue, EBITDA, EBITA and Net income
(Gains)/losses on divestments (4) 0 (23) 0
Items excluded from operating revenue underlying (4) 0 (23) 0
(Gains)/losses on divestments (4) 0 (23) 0
Transaction costs (3) 12 77 22
Restructuring charges and closure costs 8 3 8 9
Other effects 2 0 3 0
Items excluded from EBITDA underlying 4 15 65 31
Other effects 0 0 (1) 0
Depreciation excess values, reclassified to amortisation 4 4 14 15
Impairment loss 0 11 0 11
Items excluded from EBITA underlying 7 30 78 57
Amortisation and impairment (4) 305 (14) 286
Net financial income/(expense) (41) (76) (132) 108
Tax (41) (20) (59) (35)
Items excluded from Net income/(loss) underlying (78) 239 (127) 416
Items excluded from underlying EBITA, specified per Operating segment
Road Safety 8 3 7 9
Nordic 8 (1) 21 4
Europe 0 5 (14) 5
Other 0 0 0 0
Road Infrastructure (1) 0 6 0
Nordic (4) 0 (4) 0
Europe 3 0 3 0
Other 0 0 7 0
Holding, other 0 27 66 49
Items excluded from EBITA underlying 7 30 78 57
· (Gains)/losses on divestments in 2017 relates to the sale of Limes Mobile
GmbH, Saferoad Kisan and the water & sewage business in Sweden.
· Transaction costs relate to the Group preparations and executions of the
IPO and costs related to acquisitions and divestments.
· Restructuring charges and closure costs relate to redundancy and other
restructuring cost.
· Depreciation of excess values is related to acquisitions and is reclassi-
fied to amortisation.
· Tax relates to changes in deferred tax liabilities/assets
·
· Impairment loss relates to write-downs of assets or groups of assets to
estimated recoverable amounts in the event of an identified loss in value.
Gains from reversal of impairment charges are simultaneously excluded
from underlying results.
· Other effects include adjustment for costs related to fire damages in a
production hall in Norway, bad debt relating to stolen inventory in Lithuania
and cost for a terminated contract in Romania. 2016 and 2017 include
legal cosst in relation to the anti-trust case in Denmark.
· Net financial income/(expense) relates to unrealised foreign exchange
rate gains/(losses), as well as changes in earn outs and estimated future
payments related to options on shares, income from debt extinguishment
of a shareholder loan in 2017, bank fees capitalised in prior periods that
were expensed as a consequence of the refinancing in 2017, premium for
currency hedge related to the refinancing in 2017.
·
Saferoad | Fourth quarter report 2017 27

Design: A
rtbox AS
Saferoad Holding ASA
Enebakkveien 150
0680 Oslo
T: +47 70 06 40 00
saferoad.com
Our purpose is to make life on the road safer. Saferoad is a leading road safety and road infrastructure solutions provider in Northern, Central and Eastern Europe. We design, manufacture and deliver products and solutions that improve the road safety and road infrastructure standards.
Saferoad employs approximately 2 800 employees across 20 countries in Europe.