qantas airways limited 1h19 results...– reversal of temporary working capital movements –...
TRANSCRIPT
Qantas Airways Limited
1H19 ResultsSupplementary Presentation
21 February 2019
ASX:QAN
US OTC:QABSY

Group Performance

3
1H19 Key Group Financial Metrics
1H19 1H1810 VLY %11 Comments
Underlying PBT1 ($M) 780 959 (19) Revenue growth substantially recovered increased fuel costs
Underlying Earnings per Share2 (c) 31.8 38.0 (16)Lower earnings offset by reduction of shares on issue through on-market share buy-back
Statutory Profit Before Tax ($M) 735 840 (13) Includes gains on sale of assets
Statutory Earnings per Share (c) 30.0 33.3 (9.9)Lower earnings offset by reduction of shares on issue through on-market share buy-back
Rolling 12 month ROIC3 (%) 19.3 20.7 (1.4)pts All operating segments delivering ROIC > WACC12
Revenue ($M) 9,206 8,699 5.8 Increases in unit revenue and ancillary revenue
Operating cash flow ($M) 1,254 1,734 (28)Timing differences related to temporary working capital movements and hedge premium cash spend
Net Debt4 ($B) 5.2 4.9 (6.1) At the bottom of the target range of $5.2b to $6.5b
Unit Revenue5 (RASK) 8.94 8.45 5.7 Capacity discipline and Transformation
Total unit cost6 (c/ASK) 7.92 7.21 (9.8) Higher fuel and selling costs. Adverse FX movements
Ex-fuel unit cost7 (c/ASK) 5.37 5.30 (1.3) Includes impact of lower ASKs
Available Seat Kilometres8 (ASK) (M) 76,854 77,240 (0.5) Disciplined capacity management in high fuel environment
Revenue Passenger Kilometres9 (RPK) (M) 64,958 64,512 0.7 Improved revenue seat factor on lower ASKs
1. Underlying PBT is a non-statutory measure and is the primary reporting measure used by the chief operating decision-making bodies, being the Chief Executive Officer, Group Management Committee and the Board of Directors, for the purpose of assessing the
performance of the Qantas Group. All items in the 1H19 Results Presentation are reported on an Underlying basis unless otherwise stated. Refer to slide 6 for a reconciliation of Underlying to Statutory PBT. 2. Underlying Earnings per Share is calculated as Underlying PBT
less tax expense (based on the Group’s effective tax rate of 32.2% (1H18: 29.2%)) divided by the weighted average number of shares during the year (consistent with the Statutory Earnings per Share calculation). 3. Return on Invested Capital (ROIC). For a detailed
calculation of ROIC please see slide 11. 4. Net Debt under the Group’s Financial Framework includes net on balance sheet debt and off balance sheet aircraft operating lease liabilities. For a detailed calculation of Net Debt, please see slide 14. 5. Ticketed passenger revenue
divided by ASKs. 6. Underlying PBT less ticketed passenger revenue per ASK. 7. Underlying PBT less ticketed passenger revenue, fuel and share of profit/(loss) of investments accounted for under the equity method, adjusted for the impact of changes in FX rates, discount
rates and other actuarial assumptions per ASK. 8. Total number of seats available for passengers multiplied by the number of kilometres flown. 9. Total number of passengers carried multiplied by the number of kilometres flown. 10. 1H18 restated for changes associated with
the first time adoption of AASB 15 where applicable. 11. Variance to 1H18. Unfavourable variance shown as negative amount. 12. Weighted Average Cost of Capital calculated on a pre-tax basis.

4
$M 1H19 1H182 VLY % Comments
Net passenger revenue 8,027 7,607 5.5Group Unit Revenue increase of 5.7% and higher ancillary revenue. Group capacity decreased 0.5% as disciplined capacity adjustments were made to address higher fuel costs
Net freight revenue 525 455 15 Increases in global demand for freight forwarding
Other revenue 654 637 2.7 Growing Qantas Loyalty revenue streams
Total Revenue 9,206 8,699 5.8
Operating expenses (excluding fuel) (5,436) (5,239) (3.8) FX impact on non-fuel costs and higher commissions and selling costs
Fuel (1,963) (1,547) (27)Increased fuel price partially offset by favourable hedging strategies and fuel transformation initiatives
Depreciation and amortisation (814) (747) (9.0) 3 Additional 787-9 Dreamliners, aircraft operating lease buyouts
Non-cancellable aircraft operating lease rentals (135) (141) 4.3 2 x Aircraft operating lease buyouts in 1H19
Share of net profit/(loss) of investments accounted for under the equity method
13 21 (38) Jetstar’s Asian associates earnings impacted by higher fuel costs
Total Expenditure (8,335) (7,653) (8.9)
Underlying EBIT1 871 1,046 (17)
Net finance costs (91) (87) (4.6)Higher Net Debt and lower capitalised interest due to aircraft deliveries
Underlying PBT 780 959 (19)
Underlying Income Statement Summary
1. Underlying Earnings Before Net Finance Cost and Income Tax Expense (Underlying EBIT). 2. 1H18 restated for changes associated with the first time adoption of AASB 15.

5
Items Not Included in Underlying PBT
1. Items which are identified by Management and reported to the chief operating decision-making bodies as not representing the underlying performance of the business are not included in Underlying PBT. The determination of these items is made after consideration of
their nature and materiality and is applied consistently from period to period. Items not included in Underlying PBT primarily result from revenues and expenses relating to business activities in other reporting periods, major transformational/restructuring initiatives,
transactions involving investments and impairments of assets and other transactions outside the ordinary course of business.
$M 1H19 1H18 Comments
Transformation costs 98 74Redundancies, restructuring, 787-9 introduction, accelerated depreciation on 747s and A320s, and other costs which form part of the transformation program
Net gain on sale/reversal of impairment of associate (43) -Includes the reversal of impairment, consistent with the treatment of the original impairment and gain on sale of Helloworld investment
Net gain on sale of a controlled entity (37) (6)Gain on sale of Catering business in November 2018, less transaction costs
Discretionary bonuses to non-executive employees 19 53
Other 8 (2)
Total items not included in Underlying PBT1 45 119
6
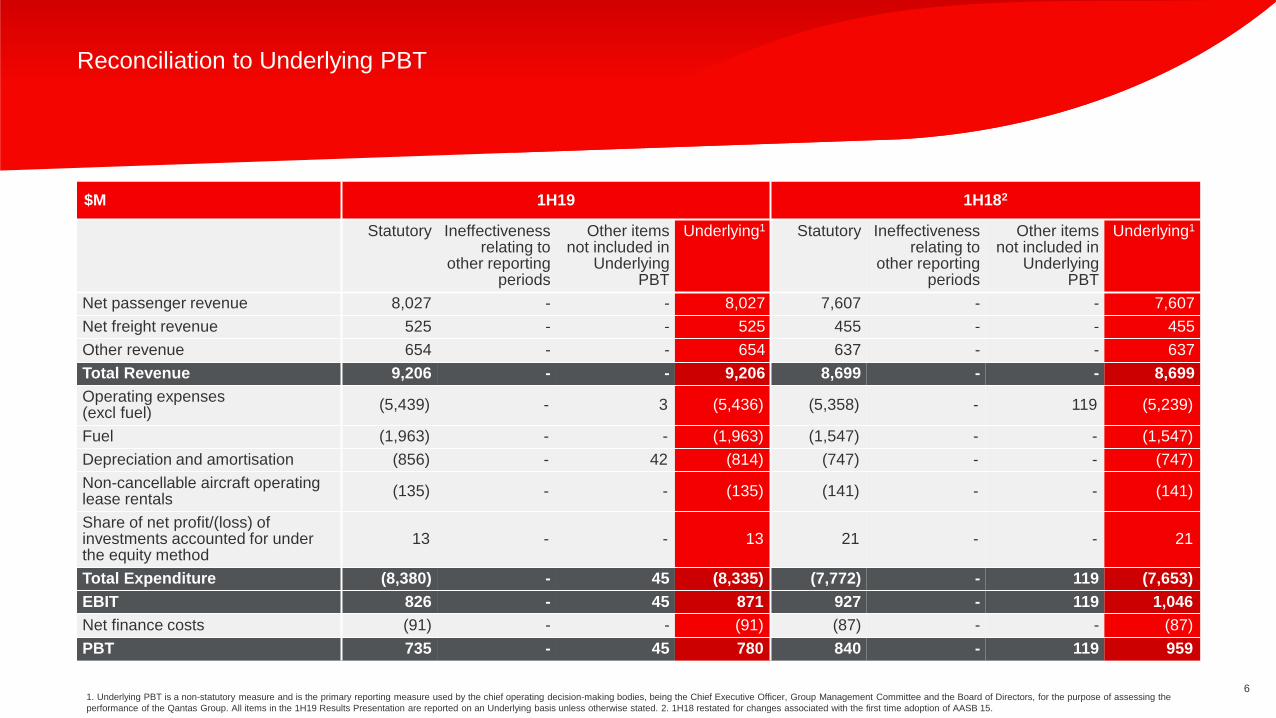
Reconciliation to Underlying PBT
1. Underlying PBT is a non-statutory measure and is the primary reporting measure used by the chief operating decision-making bodies, being the Chief Executive Officer, Group Management Committee and the Board of Directors, for the purpose of assessing the
performance of the Qantas Group. All items in the 1H19 Results Presentation are reported on an Underlying basis unless otherwise stated. 2. 1H18 restated for changes associated with the first time adoption of AASB 15.
$M 1H19 1H182
Statutory Ineffectiveness relating to
other reporting periods
Other items not included in
Underlying PBT
Underlying1 Statutory Ineffectiveness relating to
other reporting periods
Other items not included in
Underlying PBT
Underlying1
Net passenger revenue 8,027 - - 8,027 7,607 - - 7,607
Net freight revenue 525 - - 525 455 - - 455
Other revenue 654 - - 654 637 - - 637
Total Revenue 9,206 - - 9,206 8,699 - - 8,699
Operating expenses (excl fuel)
(5,439) - 3 (5,436) (5,358) - 119 (5,239)
Fuel (1,963) - - (1,963) (1,547) - - (1,547)
Depreciation and amortisation (856) - 42 (814) (747) - - (747)
Non-cancellable aircraft operating lease rentals
(135) - - (135) (141) - - (141)
Share of net profit/(loss) of investments accounted for under the equity method
13 - - 13 21 - - 21
Total Expenditure (8,380) - 45 (8,335) (7,772) - 119 (7,653)
EBIT 826 - 45 871 927 - 119 1,046
Net finance costs (91) - - (91) (87) - - (87)
PBT 735 - 45 780 840 - 119 959

7
1H18 1H19
Revenue Detail
1. 1H18 restated for changes associated with the first time adoption of AASB 15.
Net passenger revenue up 6%
• Group Unit Revenue increased 5.7%
− Group Domestic Unit Revenue up 6.1%
− Group International Unit Revenue up 5.4%
• Group capacity down 0.5%, disciplined capacity management in high fuel environment
• Transformation benefits
Net freight revenue up 15%
• Driven by increase in global demand
Frequent flyer redemption, marketing, store and other Loyalty businesses revenue
up 9%
• Increase in redemption in the core loyalty business
• Increased points issuances from partners
• Growth in new businesses
Revenue from other sources down 2%
• Decrease in third party service revenue
• Offset by increase in other revenue sourcesRPKs (m) 64,512
0.7%64,958
ASKs (m) 77,240(0.5)%
76,854
Revenue ($B)
8.7
6% 9.2
1

8
Passengers
(‘000)28,138
1.3%28,500
1H18 1H19
Expenditure1 Detail
1. All expenditure is presented on an Underlying basis which excludes hedge effectiveness relative to other reporting periods and other items not included in Underlying PBT. 2. 1H18 restated for changes associated with the first time adoption of AASB 15.
Fuel costs up 27%
• Higher jet fuel prices
• Offset by effective hedging and fuel efficiency initiatives
Manpower and staff-related up 3%
• Increased operating crew manpower driven by network mix changes
• Wage increases following the completion of the 18-month wage freeze
Aircraft operating variable costs up 7%
• Impact of network changes, fleet transition and increased passengers
• CPI partially offset by Transformation
• Increase in airport charges and taxes
Depreciation and amortisation costs up 9%
• New 787-9 aircraft and investment in Wi-Fi and aircraft reconfigurations
• Refinancing of aircraft out of operating leases to unencumbered/owned aircraft
• Investment in Lounges and technology
Non-cancellable aircraft operating lease rental expense down 4%
• Reduction in aircraft operating leases through refinancing of 2 x leased aircraft
Other expenditure up 1%
• Higher fuel costs at Jetstar’s Asian associates
ASKs (m) 77,240(0.5)%
76,854
Underlying Expenditure ($B)
7.7
8.39%
2

9
Cash Flow
1. Cash from operating activities less net cash used in investing activities (excluding aircraft operating lease refinancing). 2. Earnings before income tax expense, net finance costs, depreciation and amortisation.
• Stable Statutory EBITDA2 trend; Quality of earnings remains
strong
• Operating Cash Flow variance to 1H18 related to timing
differences:
– Reversal of temporary working capital movements
– Benefit of option premium relating to 1H18 paid in FY17
– Higher option premium relating to FY20 paid in 1H19
• Borrowings of $445m from A$ Corporate Debt Program and
repayment of $221m short term amortising debt
• 57.9m shares bought back during 1H19 for $332m
• Dividend payment of $168m
$M 1H19 1H18 VLY %
Operating cash flows 1,254 1,734 (28)
Investing cash flows (excluding aircraft operating lease
refinancing)(1,036) (962) (7.7)
Net free cash flow1 218 772 (72)
Aircraft operating lease refinancing (88) (153) 42
Financing cash flows (332) (606) 45
Cash at beginning of period 1,694 1,775 (4.6)
Effects of FX on cash 2 (1) >100
Cash at end of period 1,494 1,787 (16)
1,3731,173
1,734
1,254
1,6791,489
1,674 1,682
1H16 1H17 1H18 1H19
Operating Cash flow ($M)Operating Cash flow Statutory EBITDA
10
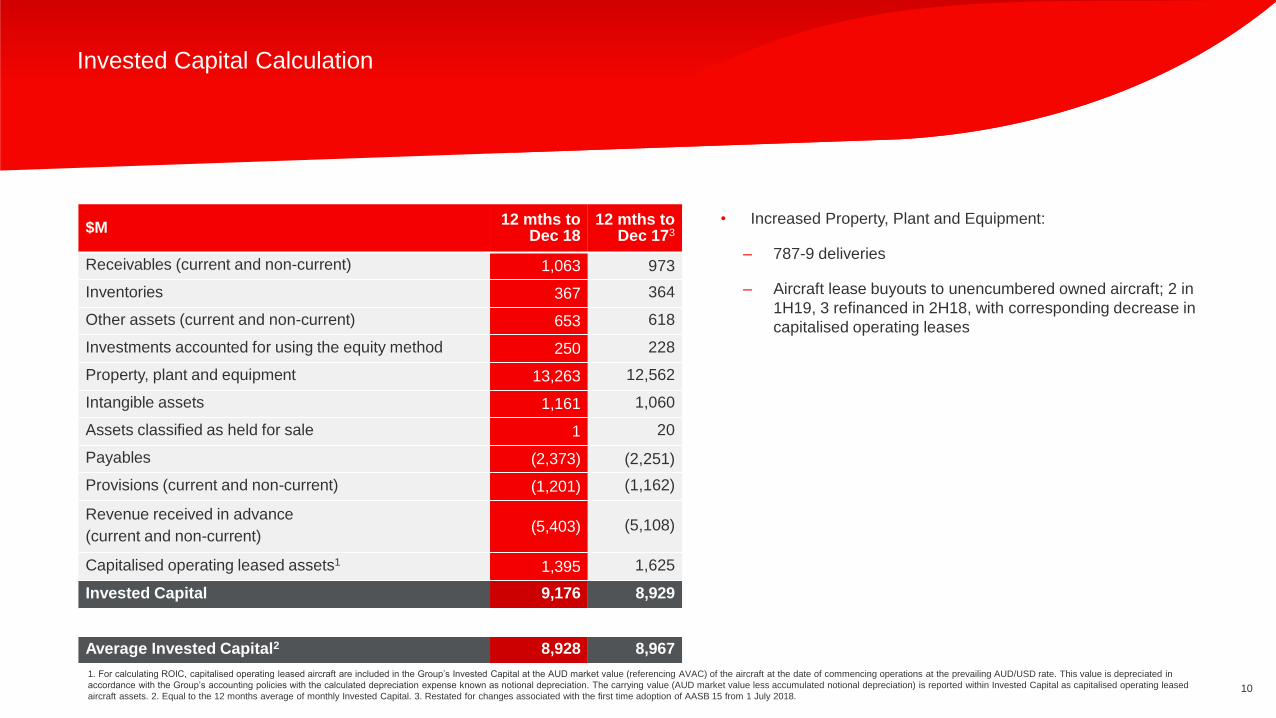
Invested Capital Calculation
1. For calculating ROIC, capitalised operating leased aircraft are included in the Group’s Invested Capital at the AUD market value (referencing AVAC) of the aircraft at the date of commencing operations at the prevailing AUD/USD rate. This value is depreciated in
accordance with the Group’s accounting policies with the calculated depreciation expense known as notional depreciation. The carrying value (AUD market value less accumulated notional depreciation) is reported within Invested Capital as capitalised operating leased
aircraft assets. 2. Equal to the 12 months average of monthly Invested Capital. 3. Restated for changes associated with the first time adoption of AASB 15 from 1 July 2018.
• Increased Property, Plant and Equipment:
– 787-9 deliveries
– Aircraft lease buyouts to unencumbered owned aircraft; 2 in
1H19, 3 refinanced in 2H18, with corresponding decrease in
capitalised operating leases
$M12 mths to
Dec 1812 mths to
Dec 173
Receivables (current and non-current) 1,063 973
Inventories 367 364
Other assets (current and non-current) 653 618
Investments accounted for using the equity method 250 228
Property, plant and equipment 13,263 12,562
Intangible assets 1,161 1,060
Assets classified as held for sale 1 20
Payables (2,373) (2,251)
Provisions (current and non-current) (1,201) (1,162)
Revenue received in advance
(current and non-current)(5,403) (5,108)
Capitalised operating leased assets1 1,395 1,625
Invested Capital 9,176 8,929
Average Invested Capital2 8,928 8,967
11
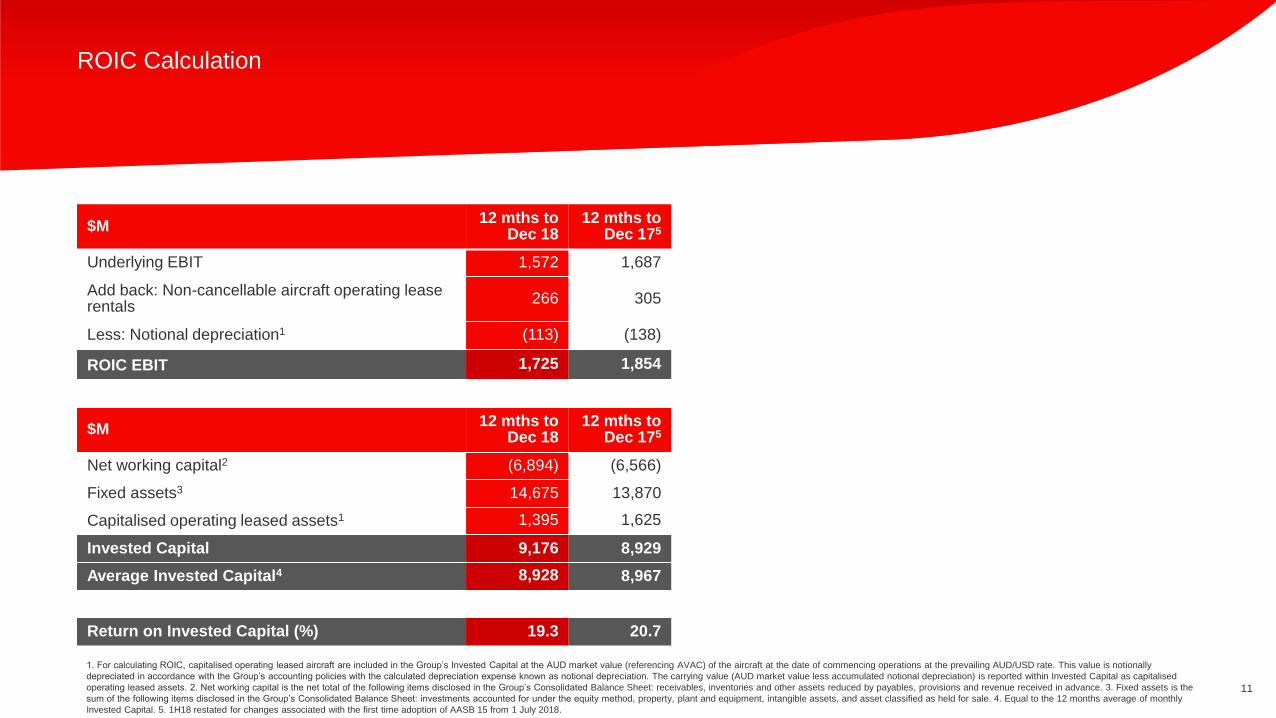
1. For calculating ROIC, capitalised operating leased aircraft are included in the Group’s Invested Capital at the AUD market value (referencing AVAC) of the aircraft at the date of commencing operations at the prevailing AUD/USD rate. This value is notionally
depreciated in accordance with the Group’s accounting policies with the calculated depreciation expense known as notional depreciation. The carrying value (AUD market value less accumulated notional depreciation) is reported within Invested Capital as capitalised
operating leased assets. 2. Net working capital is the net total of the following items disclosed in the Group’s Consolidated Balance Sheet: receivables, inventories and other assets reduced by payables, provisions and revenue received in advance. 3. Fixed assets is the
sum of the following items disclosed in the Group’s Consolidated Balance Sheet: investments accounted for under the equity method, property, plant and equipment, intangible assets, and asset classified as held for sale. 4. Equal to the 12 months average of monthly
Invested Capital. 5. 1H18 restated for changes associated with the first time adoption of AASB 15 from 1 July 2018.
$M12 mths to
Dec 1812 mths to
Dec 175
Underlying EBIT 1,572 1,687
Add back: Non-cancellable aircraft operating lease rentals
266 305
Less: Notional depreciation1 (113) (138)
ROIC EBIT 1,725 1,854
$M12 mths to
Dec 1812 mths to
Dec 175
Net working capital2 (6,894) (6,566)
Fixed assets3 14,675 13,870
Capitalised operating leased assets1 1,395 1,625
Invested Capital 9,176 8,929
Average Invested Capital4 8,928 8,967
Return on Invested Capital (%) 19.3 20.7
ROIC Calculation
12
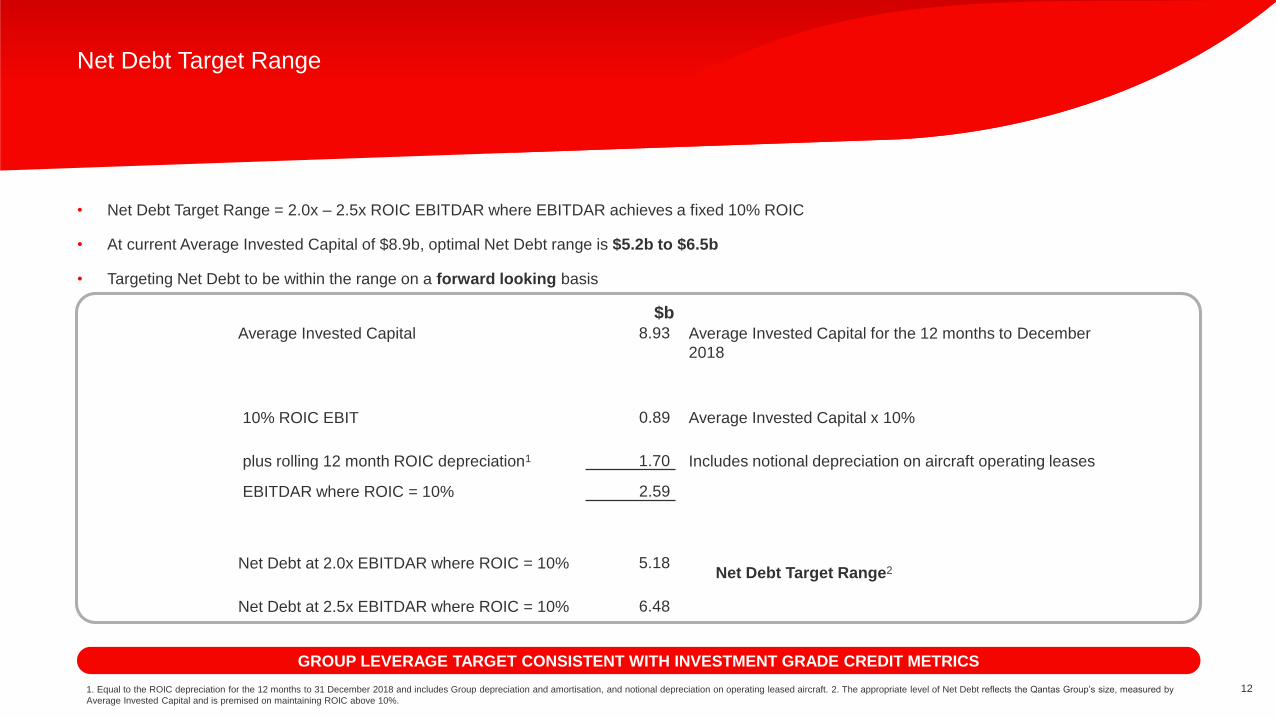
Net Debt Target Range
1. Equal to the ROIC depreciation for the 12 months to 31 December 2018 and includes Group depreciation and amortisation, and notional depreciation on operating leased aircraft. 2. The appropriate level of Net Debt reflects the Qantas Group’s size, measured by
Average Invested Capital and is premised on maintaining ROIC above 10%.
• Net Debt Target Range = 2.0x – 2.5x ROIC EBITDAR where EBITDAR achieves a fixed 10% ROIC
• At current Average Invested Capital of $8.9b, optimal Net Debt range is $5.2b to $6.5b
• Targeting Net Debt to be within the range on a forward looking basis
GROUP LEVERAGE TARGET CONSISTENT WITH INVESTMENT GRADE CREDIT METRICS
$b
Average Invested Capital 8.93 Average Invested Capital for the 12 months to December
2018
10% ROIC EBIT 0.89 Average Invested Capital x 10%
plus rolling 12 month ROIC depreciation1 1.70 Includes notional depreciation on aircraft operating leases
EBITDAR where ROIC = 10% 2.59
Net Debt at 2.0x EBITDAR where ROIC = 10% 5.18Net Debt Target Range2
Net Debt at 2.5x EBITDAR where ROIC = 10% 6.48

13
Disciplined Allocation of Capital
Debt reduction Capital ManagementGreater returns to
shareholders
Constrain capex ReinvestmentConsider growth
investment
Higher Liquidity Lower
Disciplined focus on operating costs
at all times
>$6.5B <$5.2B$5.2B$6.5B
Capital Allocation PrioritiesCapital allocation prioritised to:
• Debt reduction (where required)
to achieve optimal capital structure
• Base dividend
• Reinvestment
• Remaining surpluses presumed
to be distributed to shareholders
• Additional capex only where there is clear
shareholder value accretion
DISCIPLINED ALLOCATION OF CAPITAL TO INCREASE SHAREHOLDER VALUE

14
Net Debt
1. Net on balance sheet debt includes interest-bearing liabilities and the fair value of hedges related to debt reduced by cash and cash equivalents. 2. Capitalised aircraft operating lease liabilities are measured at fair value at the lease commencement date and
remeasured over lease term on a principal and interest basis akin to a finance lease. Residual value of capitalised aircraft operating lease liability denominated in foreign currency is translated at the long-term exchange rate. 3. Net Debt includes on balance sheet debt
and capitalised aircraft operating lease liabilities under the Group’s Financial Framework.
• Borrowings of $445m from A$ Corporate Debt
Program
• Repayment of $221m in short term amortising debt,
largely secured debt
• Reduction in capitalised aircraft operating lease
liabilities with the refinancing of an additional 2
aircraft out of operating leases
$M 1H19 FY18 VLY
Current interest bearing liabilities on balance sheet 373 404 31
Non-current interest bearing liabilities on balance sheet 4,637 4,344 (293)
Cash at end of period (1,494) (1,694) (200)
Net on Balance Sheet Debt1 3,516 3,054 (462)
Capitalised aircraft operating lease liabilities2 1,671 1,849 178
Net Debt3 5,187 4,903 (284)

15
Net Debt Movement
$M 1H19 1H18
Opening Net Debt (30 June) (4,903) (5,212)
Net cash from operating activities 1,254 1,734
Principal portion of aircraft operating lease rentals 84 86
Funds From Operations 1,338 1,820
Net cash from investing activities (1,124) (1,115)
Aircraft operating lease refinancing 88 153
Net Capex (1,036) (962)
Dividend paid to shareholders (168) (127)
Payments for share buy-back (332) (373)
Shareholder Distributions (500) (500)
Payment for treasury shares (56) (146)
FX revaluations and other fair value movements (30) (64)
Closing Net Debt (31 December) (5,187) (5,064)

16
Total Unit Cost
1. Underlying PBT less ticketed passenger revenue per ASK. 1H18 restated for changes associated with the first time adoption of AASB 15. 2. Underlying PBT less ticketed passenger revenue, fuel and share of profit/(loss) of investments accounted for under the equity
method, adjusted for the impact of changes in FX rates, discount rates and other actuarial assumptions per ASK. 1H18 restated for changes associated with the first time adoption of AASB 15. 3. Unfavourable variance shown as negative amount.
C/ASK 1H19 1H18 VLY %3
Total Unit Cost1 7.92 7.21 (9.8)
Excluding:
Fuel (2.55) (2.00)
Change in FX rates - 0.08
Impact of changes in the discount rate and other actuarial assumptions (0.02) (0.02)
Share of net profit/(loss) of investments accounted for under the equity method 0.02 0.03
Ex-Fuel Unit Cost2 5.37 5.30 (1.3)

17
Impact of AASB 15 Adoption from 1 July 2018
The main changes from previous accounting standards to the new
requirements under AASB 15 are:
– Ancillary passenger services – Delay in timing of recognition of
ancillary services (such as booking and change fees) from transaction
date to the date of passenger travel
– Qantas Points expiring unredeemed – Earlier recognition under
AASB 15 of the impact of Qantas Points issued but expected to
expire. Under the old standards, the Group took a more conservative
approach than required by AASB 15
– Timing of revenue recognised as an agent – Timing of recognition
of fees where the Group is acting as an agent changed to align with
the service being provided to the principal. This may result in revenue
recognised earlier/later than previously recognised
– Allocation of revenue to Qantas Points and passenger travel –
Change in allocation of revenue between passenger travel and
Qantas Points to a relative basis
– Classification – Changes in classification of revenue and expenses
being recognised gross/net, with no net Underlying PBT impact
The adoption of AASB 15 in FY19 requires restatement of the FY18 result for comparative purposes. There is a net increase in opening retained earnings and
net reduction in FY18 Underlying PBT as a result of retrospectively applying AASB 15 to prior periods.
1H17 & FY17
1H18 & FY18 (restated) 1H19 & FY19
Old
revenue
standards
New
revenue
standard
“AASB 15”
FY18 (Restated)
Reduction in
Underlying PBT of
-$39m under AASB 15
FY19 Report
Opening retained
earnings impact of
+$36m (before tax)
under AASB 15
FY18 (Restated)
Opening retained earnings
impact of +$75m (before tax)
under AASB 15
1 July 2018
Effective date
of AASB 15
1H18 & FY18
1H18 Interim Report and FY18 Annual Report
1H19 Interim Report and FY19 Annual Report
18
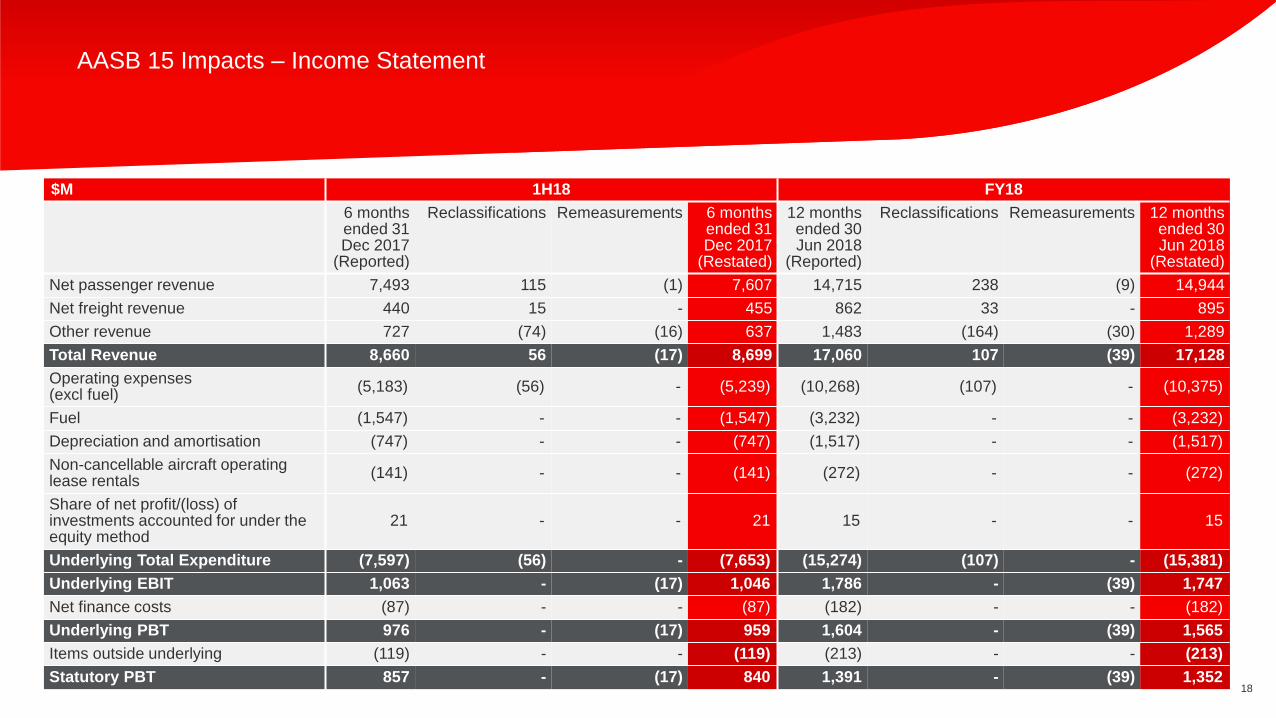
AASB 15 Impacts – Income Statement
$M 1H18 FY18
6 months ended 31 Dec 2017
(Reported)
Reclassifications Remeasurements 6 months ended 31 Dec 2017
(Restated)
12 months ended 30 Jun 2018
(Reported)
Reclassifications Remeasurements 12 months ended 30 Jun 2018
(Restated)
Net passenger revenue 7,493 115 (1) 7,607 14,715 238 (9) 14,944
Net freight revenue 440 15 - 455 862 33 - 895
Other revenue 727 (74) (16) 637 1,483 (164) (30) 1,289
Total Revenue 8,660 56 (17) 8,699 17,060 107 (39) 17,128
Operating expenses (excl fuel)
(5,183) (56) - (5,239) (10,268) (107) - (10,375)
Fuel (1,547) - - (1,547) (3,232) - - (3,232)
Depreciation and amortisation (747) - - (747) (1,517) - - (1,517)
Non-cancellable aircraft operating lease rentals
(141) - - (141) (272) - - (272)
Share of net profit/(loss) of investments accounted for under the equity method
21 - - 21 15 - - 15
Underlying Total Expenditure (7,597) (56) - (7,653) (15,274) (107) - (15,381)
Underlying EBIT 1,063 - (17) 1,046 1,786 - (39) 1,747
Net finance costs (87) - - (87) (182) - - (182)
Underlying PBT 976 - (17) 959 1,604 - (39) 1,565
Items outside underlying (119) - - (119) (213) - - (213)
Statutory PBT 857 - (17) 840 1,391 - (39) 1,352
Group Operational Information
20
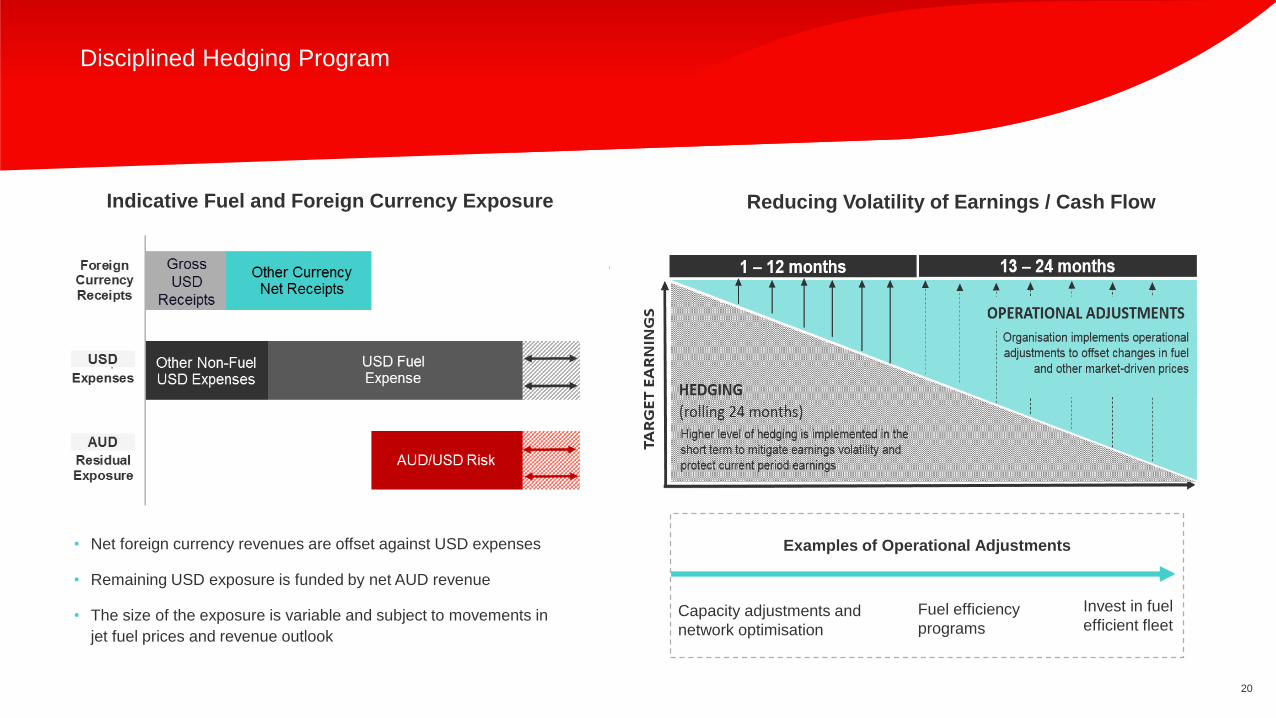
• Net foreign currency revenues are offset against USD expenses
• Remaining USD exposure is funded by net AUD revenue
• The size of the exposure is variable and subject to movements in
jet fuel prices and revenue outlook
Reducing Volatility of Earnings / Cash Flow
Examples of Operational Adjustments
Capacity adjustments and
network optimisation
Invest in fuel
efficient fleet Fuel efficiency
programs
Indicative Fuel and Foreign Currency Exposure
Disciplined Hedging Program

21
Qantas Group Long-term Value Framework

22
Fleet at 31 December 2018
1. Includes Jetstar Asia (Singapore) owned fleet (18 x A320), excludes Jetstar Pacific (Vietnam), Jetstar Japan and short-term leases of 1 x A320-200 aircraft at Jetstar Asia (Singapore). 2. Qantas Group wet leases the capacity of 2 x 747-400 freighter aircraft and 4 x
BAe146 freighter aircraft (not included in the table). 3. Includes purchased and operating leased aircraft.
• Net addition3 of 2 aircraft in 1H19
– 3 x 787-9 additions
– 1 x 747-400 retired October 2018
Aircraft Type 1H19 FY18 Change
A380-800 12 12 -
747-400 3 4 (1)
747-400ER 6 6 -
A330-200 18 18 -
A330-300 10 10 -
737-800NG 75 75 -
787-9 8 5 3
Total Qantas 132 130 2
717-200 20 20 -
Q200/Q300 14 14 -
Q400 31 31 -
F100 17 17 -
A320-200 2 2 -
Total QantasLink 84 84 -
Q300 5 5 -
A320-2001 69 69 -
A321-200 8 8 -
787-8 11 11 -
Total Jetstar 93 93 -
737-300SF 4 4 -
737-400SF 1 1 -
767-300SF 1 1 -
Total Freight2 6 6 -
Total Group 315 313 2
23
21.3
15.9
8.6
11.910.7
13.2
7.4
4.3
14.716.8
12.0
25.5
13.4
0
2
4
6
8
10
12
14
16
18
20
22
24
26
QFA380
QFB747
QFB738
QFA320
QF787-9
QFB747 ER
0.7
QFA330
JQA320/ A321
JQA320/A321
JQ787-8
JQQ300
QFB717
QFDash8
QFF100
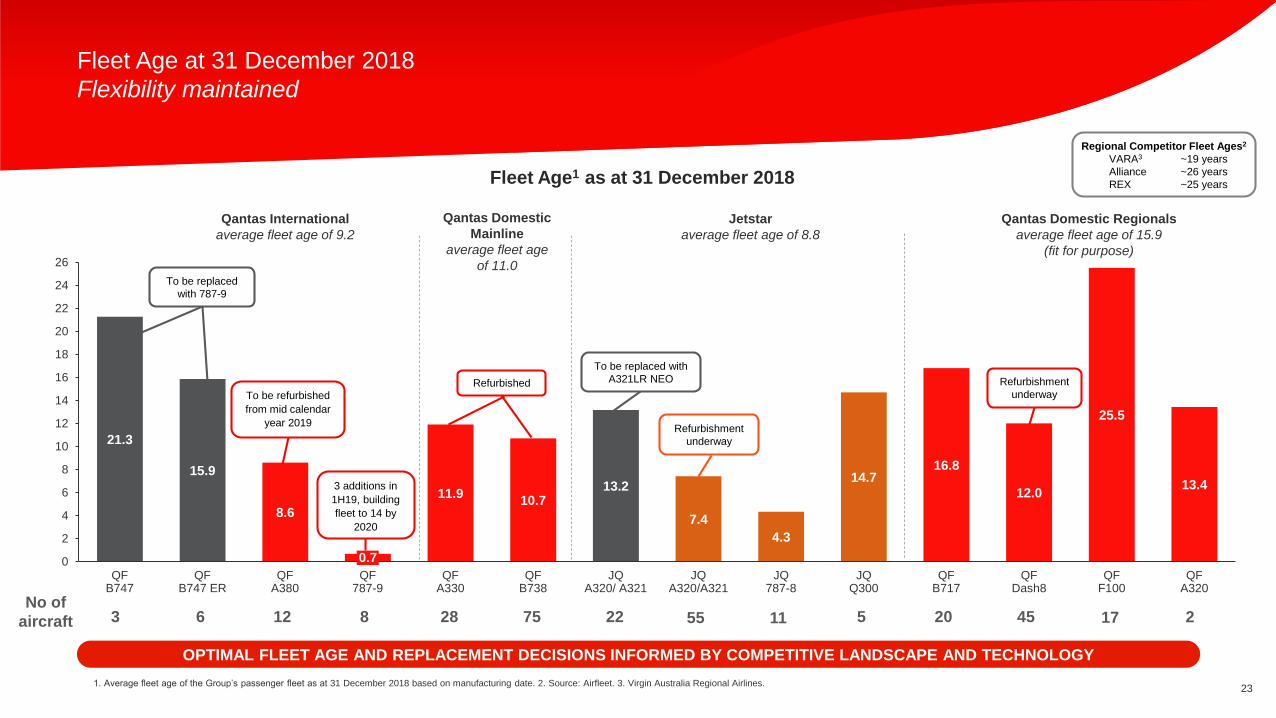
Fleet Age at 31 December 2018
Flexibility maintained
1. Average fleet age of the Group’s passenger fleet as at 31 December 2018 based on manufacturing date. 2. Source: Airfleet. 3. Virgin Australia Regional Airlines.
OPTIMAL FLEET AGE AND REPLACEMENT DECISIONS INFORMED BY COMPETITIVE LANDSCAPE AND TECHNOLOGY
Fleet Age1 as at 31 December 2018
6 12 28 75 22 55 5 20 45 17
Regional Competitor Fleet Ages2
VARA3 ~19 years
Alliance ~26 years
REX ~25 years
211
Qantas International
average fleet age of 9.2
Qantas Domestic
Mainline
average fleet age
of 11.0
Jetstar
average fleet age of 8.8
Qantas Domestic Regionals
average fleet age of 15.9
(fit for purpose)
3No of
aircraft
Refurbishment
underway
Refurbished
To be replaced with
A321LR NEO
To be replaced
with 787-9
To be refurbished
from mid calendar
year 2019
Refurbishment
underway
8
3 additions in
1H19, building
fleet to 14 by
2020

Supplementary Segment Information

25
Jetstar Group
1. Including Jetstar Australia and New Zealand, Jetstar Asia (Singapore), Jetstar Pacific (Vietnam) and Jetstar Japan. 2. Based on voting rights. 3. Represents operational fleet (includes aircraft subleased for Jetstar operations, excludes subleased aircraft to external
parties). 4. Includes Jetstar Trans-Tasman services commenced in 2005, Jetstar New Zealand (Domestic) services commenced in 2009, Jetstar New Zealand (Regional) services commenced in December 2015. 5. Jetstar Pacific (Vietnam) rebranded in 2008.
BUSINESS OWNERSHIP2 LAUNCH AIRCRAFT3
❶Jetstar Australia 100% 2004 52 x A320s/A321s
❷Jetstar International 100% 2006 11 x 787-8s
❸Jetstar New Zealand4 100% 2009 8 x A320s 5 x Q300s
❹Jetstar Asia (Singapore) 49% 2004 18 x A320s
❺Jetstar Japan 33% 2012 24 x A320s
❻Jetstar Pacific (Vietnam)5 30% 2008 17 x A320s
1
2
3
4
5
6
Jetstar Group – Network of Routes1
31 3959 67
82 96 98 109 115 129 130151
179 177 179 183
FY11FY07 FY10FY05FY04 FY06 FY08 FY09 FY12 FY13 FY14 FY15 FY16 FY17 FY18 1H19

26
Jetstar in Asia1
1. Jetstar-branded airlines in Asia includes Jetstar Asia (Singapore), Jetstar Japan and Jetstar Pacific (Vietnam). 2. Source IATA 20-Year Passenger Forecast 2018. 3. Underlying EBIT. 4. Measured as percentage of market share based on ASKs. Source: Diio Mi.
Japanese Low Cost Carrier (LCC) includes Jetstar Japan, Vanilla Air, Peach Aviation and Spring Airlines Japan. 5. Based on passengers. 6. Jetstar Japan A321LR NEO order in addition to previously announced order for 18 x A321LR NEOs for Jetstar Group.
7. Compared to 1H18 restated for changes associated with the first time adoption of AASB 15. 8. Across Jetstar-branded airlines in Asia in 1H19. 9. Flights per week to China and its territories including charters. Source: Diio Mi Weekly Report.
• Growing the Jetstar leisure brand in Asian markets, taking advantage of strong
regional tourism demand2
• Improved connectivity across Asia between Jetstar Group and Qantas airlines in
Australia, Japan, Singapore and Vietnam
• Jetstar Japan remained profitable3 whilst impacted by fuel increases and natural
disasters; Retains leading domestic LCC position4 in growing market5, added 2 x A320
aircraft in 1H19 and ordered three A321LR NEOs for delivery from mid 20206
• Jetstar Asia (Singapore) earnings3 declined7 due to higher fuel, FX and airport
charges and taxes
• Jetstar Pacific (Vietnam) achieved strong revenue growth7 with earnings3 impacted by
fuel increases; Significant growth market5 with highly competitive landscape
MAXIMISING EXISTING OPPORTUNITIES WHILE POSITIONED FOR SUCCESS IN THE FASTEST GROWING PASSENGER MARKET IN THE WORLD2
56 Asian destinations8
6 new routes8
~100 services per week to China9
27
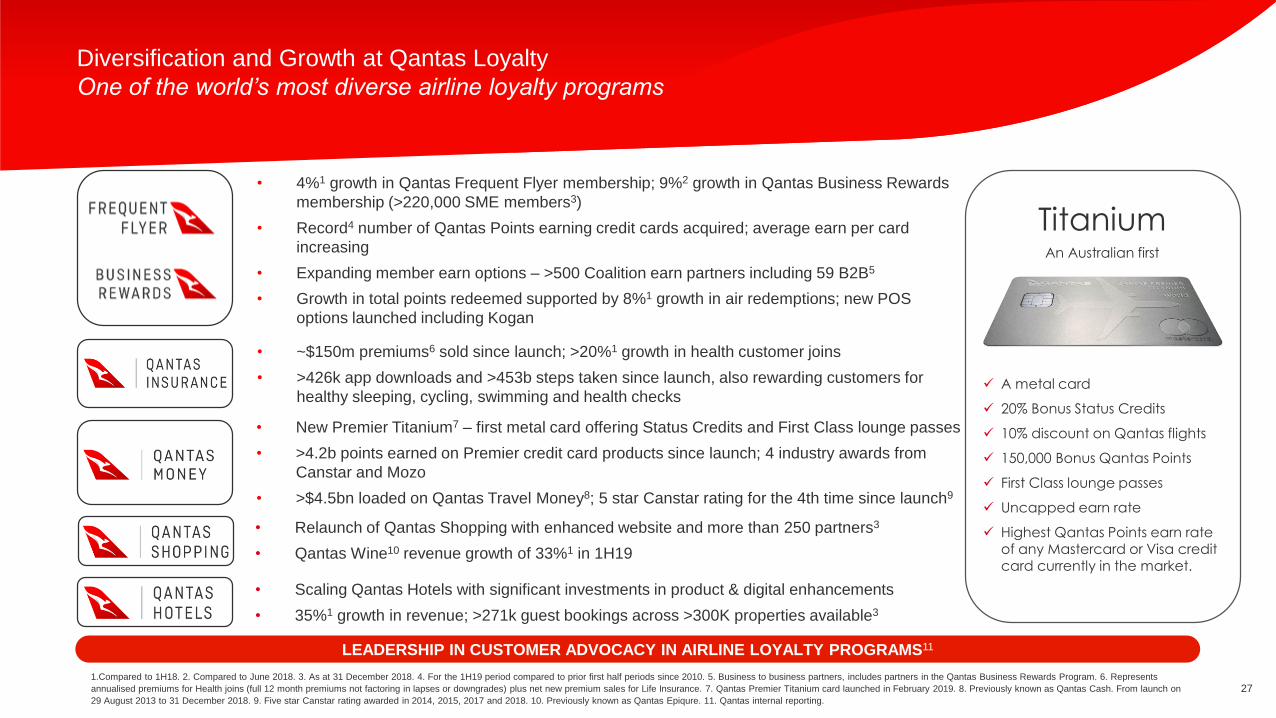
Diversification and Growth at Qantas Loyalty
One of the world’s most diverse airline loyalty programs
• ~$150m premiums6 sold since launch; >20%1 growth in health customer joins
• >426k app downloads and >453b steps taken since launch, also rewarding customers for
healthy sleeping, cycling, swimming and health checks
LEADERSHIP IN CUSTOMER ADVOCACY IN AIRLINE LOYALTY PROGRAMS11
• 4%1 growth in Qantas Frequent Flyer membership; 9%2 growth in Qantas Business Rewards
membership (>220,000 SME members3)
• Record4 number of Qantas Points earning credit cards acquired; average earn per card
increasing
• Expanding member earn options – >500 Coalition earn partners including 59 B2B5
• Growth in total points redeemed supported by 8%1 growth in air redemptions; new POS
options launched including Kogan
• New Premier Titanium7 – first metal card offering Status Credits and First Class lounge passes
• >4.2b points earned on Premier credit card products since launch; 4 industry awards from
Canstar and Mozo
• >$4.5bn loaded on Qantas Travel Money8; 5 star Canstar rating for the 4th time since launch9
1.Compared to 1H18. 2. Compared to June 2018. 3. As at 31 December 2018. 4. For the 1H19 period compared to prior first half periods since 2010. 5. Business to business partners, includes partners in the Qantas Business Rewards Program. 6. Represents
annualised premiums for Health joins (full 12 month premiums not factoring in lapses or downgrades) plus net new premium sales for Life Insurance. 7. Qantas Premier Titanium card launched in February 2019. 8. Previously known as Qantas Cash. From launch on
29 August 2013 to 31 December 2018. 9. Five star Canstar rating awarded in 2014, 2015, 2017 and 2018. 10. Previously known as Qantas Epiqure. 11. Qantas internal reporting.
• Relaunch of Qantas Shopping with enhanced website and more than 250 partners3
• Qantas Wine10 revenue growth of 33%1 in 1H19
• Scaling Qantas Hotels with significant investments in product & digital enhancements
• 35%1 growth in revenue; >271k guest bookings across >300K properties available3
TitaniumAn Australian first
A metal card
20% Bonus Status Credits
10% discount on Qantas flights
150,000 Bonus Qantas Points
First Class lounge passes
Uncapped earn rate
Highest Qantas Points earn rate of any Mastercard or Visa credit card currently in the market.

28
Glossary
Available Seat Kilometres (ASK) – Total number of seats available for passengers, multiplied by
the number of kilometres flown
B2B – Business to business Loyalty program partners
Capital expenditure (Capex) – Net investing cash flows included in the Consolidated Cash Flow
Statement (excluding aircraft operating lease refinancing) and the impact to Invested Capital from
acquiring or returning operating leased aircraft
CPI – Consumer Price Index
EBIT – Earnings before interest and tax
EPS – Earnings per share. Statutory profit after tax divided by the weighted average number of
issued shares, rounded to the nearest cent.
Fixed assets - Sum of the following items disclosed in the Group’s Consolidated Balance Sheet:
investments accounted for under the equity method, property, plant and equipment, intangible
assets, and assets classified as held for sale
FX – Foreign exchange
GDP – Gross domestic product
Invested Capital – Net assets (excluding cash, debt, other financial assets and liabilities and tax
balances) including capitalised operating lease assets
LCC – Low Cost Carrier
Net Debt – includes net on balance sheet debt and off balance sheet aircraft operating lease
liabilities
Net free cash flow – Net cash from operating activities less net cash used in investing activities
(excluding aircraft operating lease refinancing)
Net on balance sheet debt – Interest-bearing liabilities and the fair value of hedges related to debt
reduced by cash and cash equivalents
Net Working capital – Net total of the following items disclosed in the Group’s Consolidated Balance
Sheet: receivables, inventories and other assets reduced by payables, provisions, revenue received in
advance and liabilities classified as held for sale
NPS – Net promoter score. Customer advocacy measure
Operating Margin – Underlying EBIT divided by Total Revenue
OTP – On time performance. Measured as departures within 15 minutes of scheduled departure time
PBT – Profit before tax
QBR – Qantas Business Rewards
QFF – Qantas Frequent Flyer
Return on Invested Capital (ROIC) – ROIC EBIT for the 12 months ended for the reporting period,
divided by the 12 months average Invested Capital
Revenue Passenger Kilometre (RPK) – Total number of passengers carried, multiplied by the number of
kilometres flown
Seat factor – Revenue passenger kilometres divided by available seat kilometres
SME – Small to medium enterprise
Ticketed passenger revenue – Uplifted passenger revenue included in Net Passenger Revenue
Total Unit Cost – Underlying PBT less ticketed passenger revenue per available seat kilometre (ASK)
Unit Revenue – Ticketed passenger revenue per available seat kilometre (ASK)
Utilisation – Average block hours per aircraft per day
WACC – Weighted average cost of capital calculated on a pre-tax basis
29
This Presentation has been prepared by Qantas Airways Limited (ABN 16 009 661 901) (Qantas).
Summary information
This Presentation contains summary information about Qantas and its subsidiaries (Qantas Group) and their activities current as at 21 February 2019, unless otherwise stated. The information in this Presentation does not purport to be complete. It should be read in
conjunction with the Qantas Group’s other periodic and continuous disclosure announcements lodged with the Australian Securities Exchange, which are available at www.asx.com.au.
Not financial product advice
This Presentation is for information purposes only and is not financial product or investment advice or a recommendation to acquire Qantas shares and has been prepared without taking into account the objectives, financial situation or needs of individuals. Before making
an investment decision prospective investors should consider the appropriateness of the information having regard to their own objectives, financial situation and needs and seek legal and taxation advice appropriate to their jurisdiction. Qantas is not licensed to provide
financial product advice in respect of Qantas shares. Cooling off rights do not apply to the acquisition of Qantas shares.
Not tax advice
Tax implications for individual shareholders will depend on the circumstances of the particular shareholder. All shareholders should therefore seek their own professional advice in relation to their tax position. Neither Qantas nor any of its officers, employees or advisers
assumes any liability or responsibility for advising shareholders about the tax consequences of the return of capital and/or share consolidation.
Financial data
All dollar values are in Australian dollars (A$) and financial data is presented within the six months ended 31 December 2018 unless otherwise stated.
Future performance
Forward looking statements, opinions and estimates provided in this Presentation are based on assumptions and contingencies which are subject to change without notice, as are statements about market and industry trends, which are based on interpretations of current
market conditions. Forward looking statements including projections, guidance on future earnings and estimates are provided as a general guide only and should not be relied upon as an indication or guarantee of future performance.
An investment in Qantas shares is subject to investment and other known and unknown risks, some of which are beyond the control of the Qantas Group, including possible delays in repayment and loss of income and principal invested. Qantas does not guarantee any
particular rate of return or the performance of the Qantas Group nor does it guarantee the repayment of capital from Qantas or any particular tax treatment. Persons should have regard to the risks outlined in this Presentation.
No representation or warranty, express or implied, is made as to the fairness, accuracy, completeness or correctness of the information, opinions and conclusions contained in this Presentation. To the maximum extent permitted by law, none of Qantas, its directors,
employees or agents, nor any other person accepts any liability, including, without limitation, any liability arising out of fault or negligence, for any loss arising from the use of the information contained in this Presentation. In particular, no representation or warranty,
express or implied is given as to the accuracy, completeness or correctness, likelihood of achievement or reasonableness of any forecasts, prospects or returns contained in this Presentation nor is any obligation assumed to update such information. Such forecasts,
prospects or returns are by their nature subject to significant uncertainties and contingencies. Before making an investment decision, you should consider, with or without the assistance of a financial adviser, whether an investment is appropriate in light of your particular
investment needs, objectives and financial circumstances.
Past performance
Past performance information given in this Presentation is given for illustrative purposes only and should not be relied upon as (and is not) an indication of future performance.
Not an offer
This Presentation is not, and should not be considered, an offer or an invitation to acquire Qantas shares or any other financial products.
ASIC GUIDANCE
In December 2011 ASIC issued Regulatory Guide 230. To comply with this Guide, Qantas is required to make a clear statement about whether information disclosed in documents other than the financial report has been audited or reviewed in accordance with Australian
Auditing Standards. In line with previous years, this Presentation is unaudited. Notwithstanding this, the Presentation contains disclosures which are extracted or derived from the Consolidated Interim Financial Report for the half year ended 31 December 2018 which has
been reviewed by the Group’s Independent Auditor.
Disclaimer & ASIC Guidance