qa/qc practice for rtwq monitoring in nl
TRANSCRIPT

QA/QC Practice for RTWQ Monitoring in NL
QA/QC Practice for RTWQ Monitoring in NL
Paula DaweDept of Environment & Conservation
Phone: 709-637-2542Email: [email protected]
Web: http://www.env.gov.nl.ca/env/Env/water_resources.asp
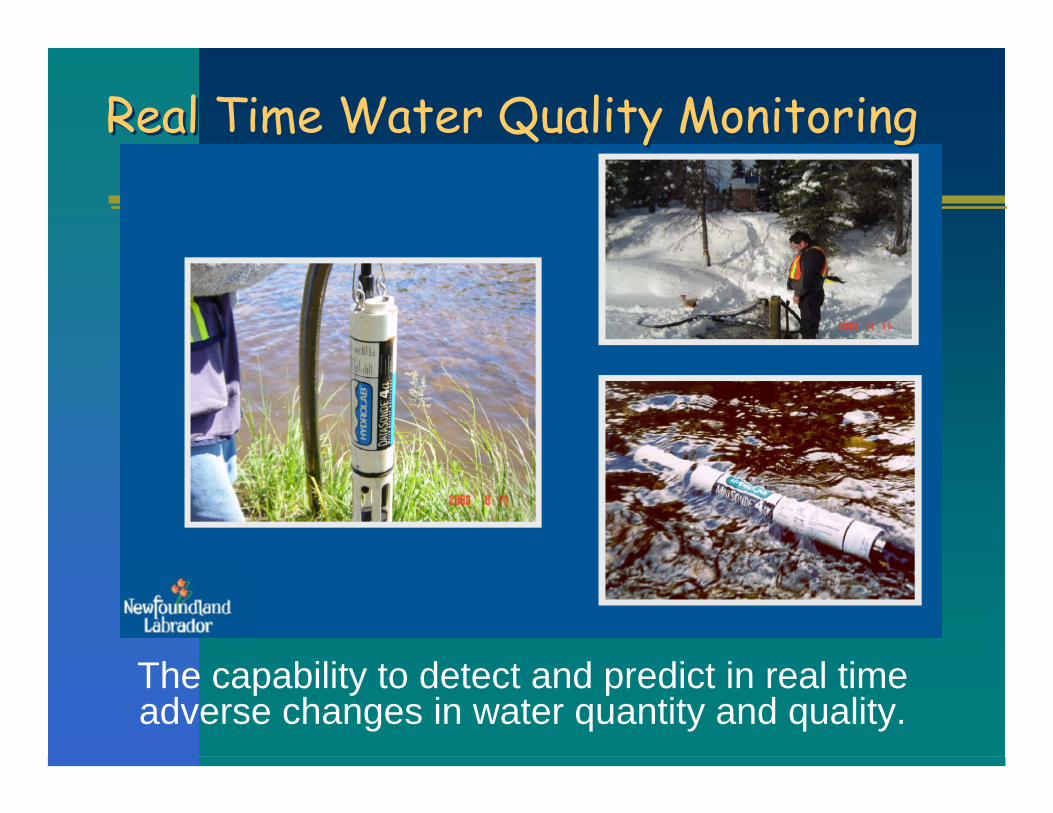
Real Time Water Quality MonitoringReal Time Water Quality Monitoring
The capability to detect and predict in real time adverse changes in water quantity and quality.


What is QA/QC?What is QA/QC?QA/QC = Quality Assurance/ Quality ControlQA/QC basically refers the things investigators do to make sure their measurements are:– Accurate (ie. the absolute true value)– Reproducible (ie. precise, consistent)– And that they have a good estimate of their
uncertainty

Specifics of QA/QCSpecifics of QA/QCIt involves following established rules in the field and lab to assure everyone that the sample is: – representative of the site– free from outside contamination by the
sample collector – and that it has been analyzed following
standard QA/QC methodsTypically involves comparing the sample to a set of known samples for estimating accuracy and by replicating the measurement to estimate its precision

Why the Need for QA/QC?Why the Need for QA/QC?When deployed for continuous operation RTWQ sensors are colonized gradually by a biofilm of algae and less noticeably, by bacteria and fungi as wellAs this material builds up, the biofilm interferes with the sensor's ability to accurately sample the surrounding water
Quality Assurance (QA)Quality Assurance (QA)Includes all high-level activities, structures and mechanisms used to ensure and document the accuracy, precision, completeness, effectiveness and representativeness of the RTWQ monitoring programConsists of two separate but interrelated activities: – Quality Control (QC) – Quality Assessment
Quality AssuranceQuality AssuranceRTWQ monitoring program planPurchasing control to ensure all instruments made from a sole manufacturer (ie. Hydrolab)Ensuring probe maintenance and warranty checks are carried out in compliance with manufacturer recommendationsPersonnel qualification and training Technical procedures for sampling and conducting field and analytical work
Quality AssuranceQuality AssuranceTroubleshooting of instruments, recording equipment, installations, transmission of data and corrective action plansRecord keeping including chain of custody for grab samples, logbooks and instrument calibration recordsImplementation of QA/QC procedures including data verification and validationPreparation of analytical reports, data packages and RTWQ web page

Quality AssuranceQuality AssuranceAssessments to determine whether personnel are adhering to program requirements and following internal proceduresExpert peer review of RTWQ program design, QA/QC procedures and data analysisKeep up to date on emerging RTWQ technology, QA/QC procedures, and analysis techniquesDevelop first hand knowledge of each individual watershed through observation and field visits

Quality Control (QC)Quality Control (QC)Technical activities employed to ensure that the data collected are adequate for quality assessment purposesMaintenance and calibration of the probe and its sensorsInspection and maintenance of RTWQ station installationField readings taken at the time of removal and reinstallation of the probe for maintenance and calibration purposes using a calibrated field instrument

Quality Control (QC)Quality Control (QC)Collection of a water quality grab sample at the time of reinstallation of the probe to be sent to a laboratory for analysis Updating maintenance forms with collected field instrument readings after reinstallationUsing field results taken during removal of the probe with the field instrument, data from the preceding period is corrected for driftStoring corrected data in a separate databaseUpdating spreadsheet with grab sample results once laboratory analysis is complete

RTWQ Monitoring SitesRTWQ Monitoring Sites

Maintenance and CalibrationMaintenance and CalibrationOccurs once a week to every 2 months typicallyFollow the Instrument Manuals for calibration and maintenance proceduresRegular maintenance depends on conditions at the monitoring locationUse Hydras 3LT or HyperTerminal/ ProComm for calibrating

Maintenance and CalibrationMaintenance and Calibration
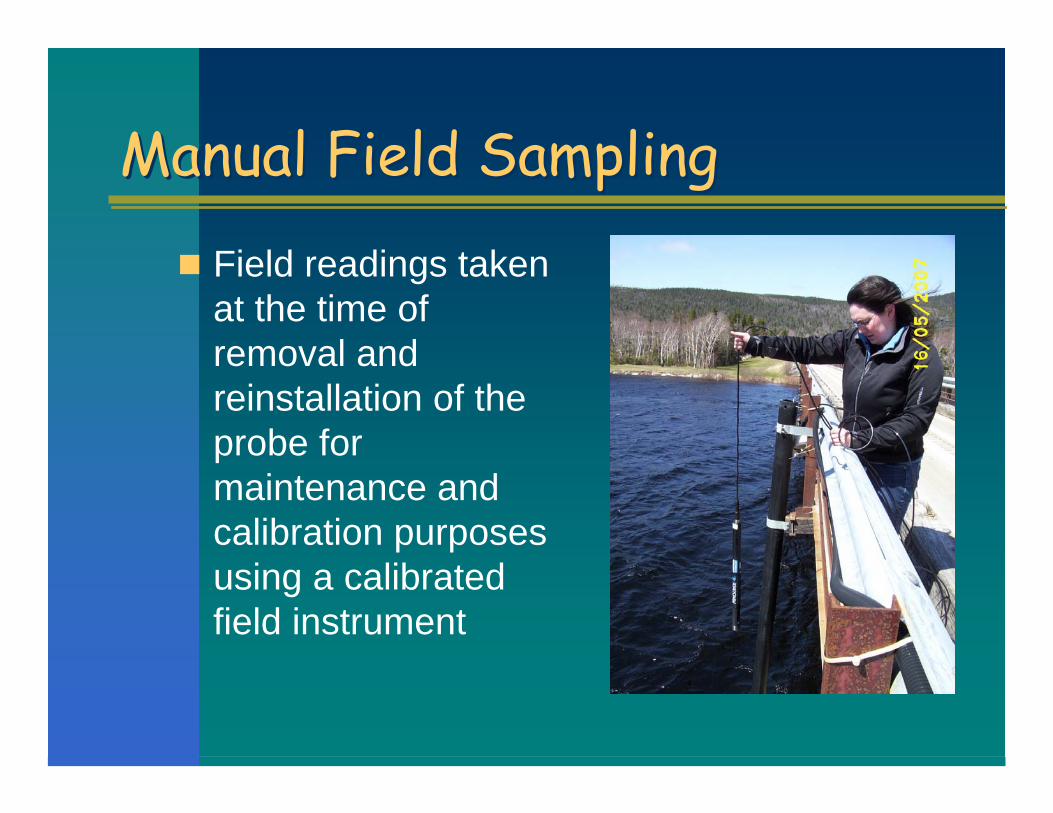
Manual Field SamplingManual Field SamplingField readings taken at the time of removal and reinstallation of the probe for maintenance and calibration purposes using a calibrated field instrument
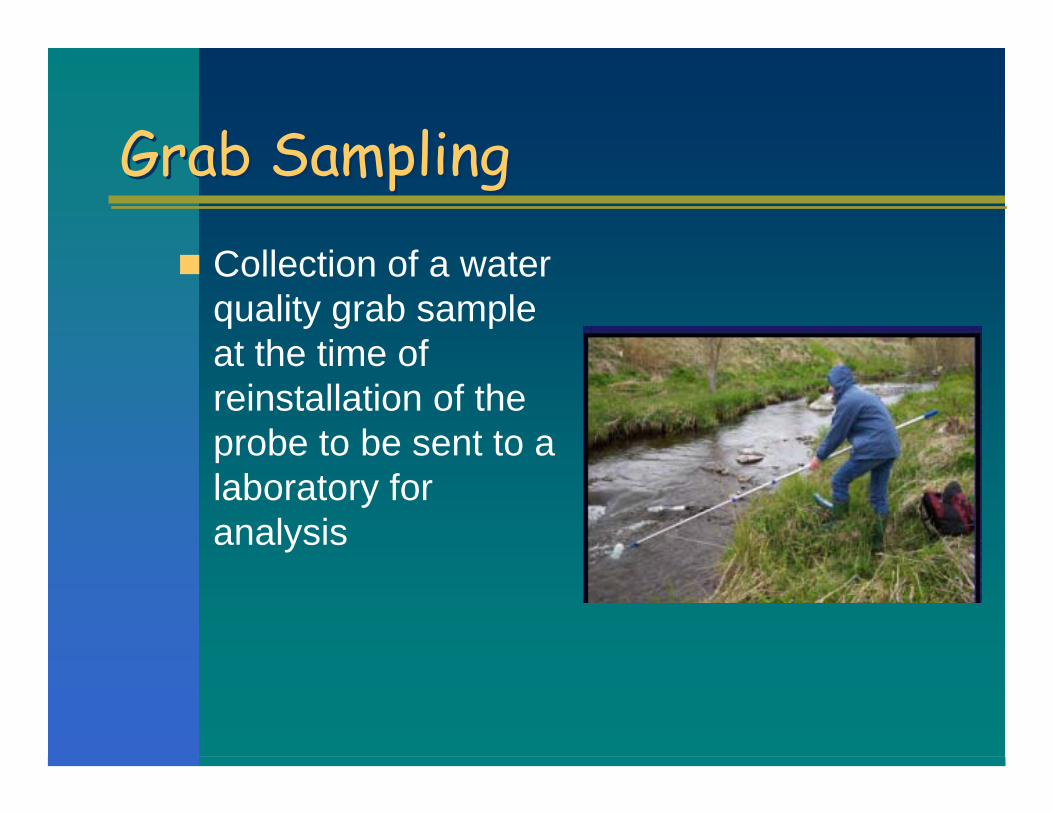
Grab SamplingGrab SamplingCollection of a water quality grab sample at the time of reinstallation of the probe to be sent to a laboratory for analysis

Quality AssessmentQuality AssessmentTo quantify the effectiveness of the quality control proceduresComparison of field results with RTWQ probe results to evaluate amount of drift observed in water quality parameters over that period Evaluate if field and actual readings are within acceptable ranges, by how much the reading is off, and reasons why the parameter reading may be offCalculate long-term and monthly period summary statistics using the corrected data

Quality AssessmentQuality AssessmentDaily updates of RTWQ data on the Water Resources Division web page for reviewProduce time series graphs for each parameter and evaluate for gaps, data errors, and guideline exceedancesPreparation of auxiliary information to aid in the review of water quality recordsProduce a monthly report for each stationProduce an annual report for each RTWQ station at the end of each calendar yearArchiving of RTWQ monitoring data records

Data DriftData Drift
02YL003- Humber River at Humber Village Bridge
6
6.5
7
7.5
8
8.5
9
9-Nov 14-Nov 19-Nov 24-Nov 29-Nov 4-Dec 9-Dec 14-Dec 19-Dec
Date
pH
pH Min Guideline (CCME) Max Guideline (CCME)

What is Allowable Error?What is Allowable Error?The difference in value between automatic RTWQ data and data collected manually (ie. drift)Automatic RTWQ data is considered suspect when the allowable % error is exceededError associated with drift and fouling
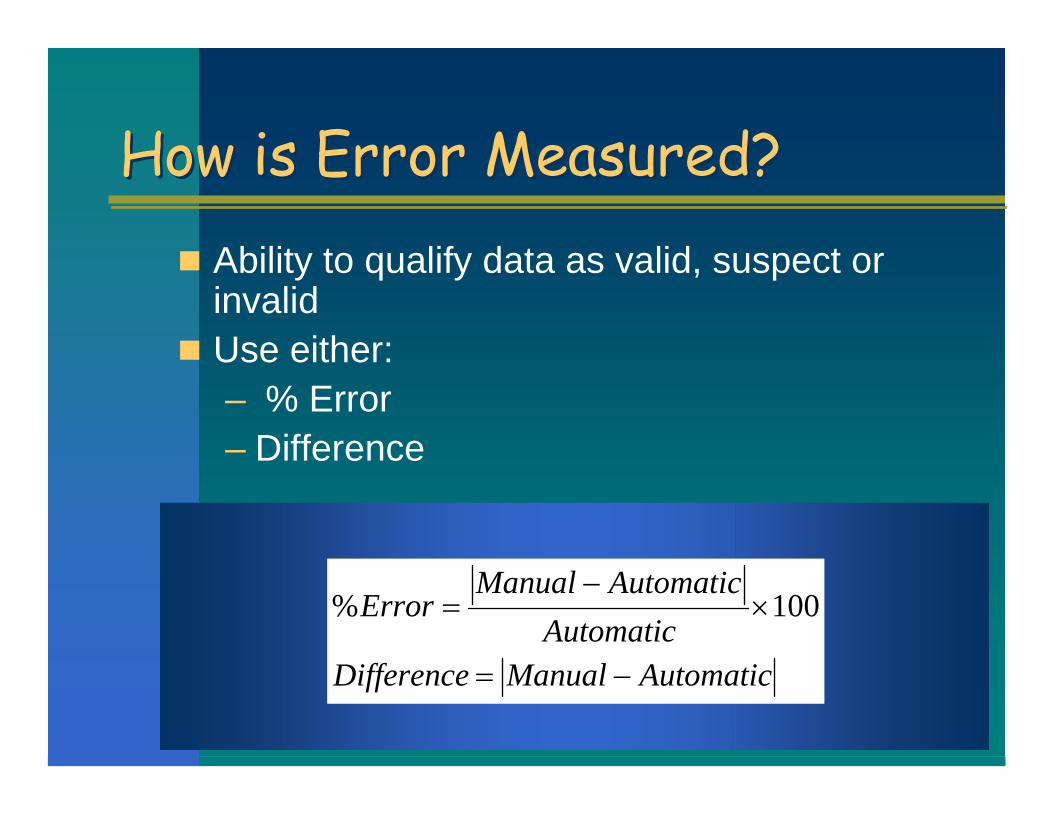
How is Error Measured?How is Error Measured?Ability to qualify data as valid, suspect or invalidUse either:– % Error – Difference
AutomaticManualDifferenceAutomatic
AutomaticManualError
−=
×−
= 100%
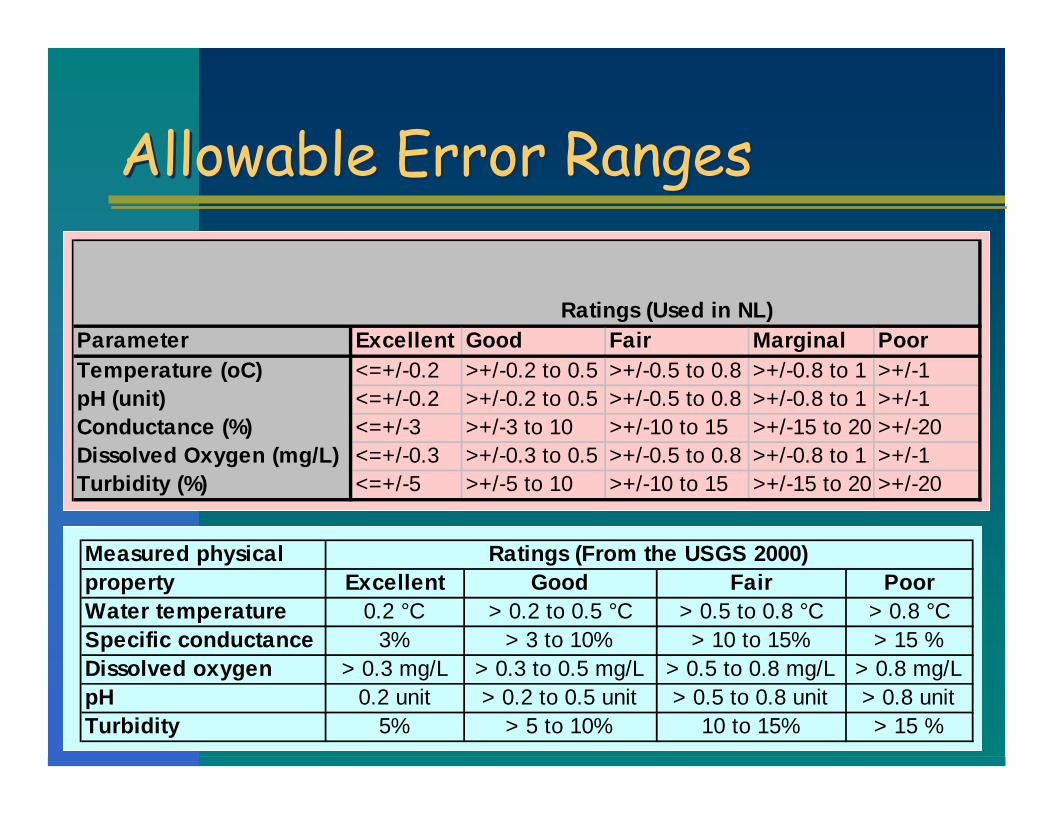
Allowable Error Ranges Allowable Error Ranges
Parameter Excellent Good Fair Marginal PoorTemperature (oC) <=+/-0.2 >+/-0.2 to 0.5 >+/-0.5 to 0.8 >+/-0.8 to 1 >+/-1pH (unit) <=+/-0.2 >+/-0.2 to 0.5 >+/-0.5 to 0.8 >+/-0.8 to 1 >+/-1Conductance (%) <=+/-3 >+/-3 to 10 >+/-10 to 15 >+/-15 to 20 >+/-20Dissolved Oxygen (mg/L) <=+/-0.3 >+/-0.3 to 0.5 >+/-0.5 to 0.8 >+/-0.8 to 1 >+/-1Turbidity (%) <=+/-5 >+/-5 to 10 >+/-10 to 15 >+/-15 to 20 >+/-20
Ratings (Used in NL)
Measured physicalproperty Excellent Good Fair PoorWater temperature 0.2 °C > 0.2 to 0.5 °C > 0.5 to 0.8 °C > 0.8 °CSpecific conductance 3% > 3 to 10% > 10 to 15% > 15 %Dissolved oxygen > 0.3 mg/L > 0.3 to 0.5 mg/L > 0.5 to 0.8 mg/L > 0.8 mg/LpH 0.2 unit > 0.2 to 0.5 unit > 0.5 to 0.8 unit > 0.8 unitTurbidity 5% > 5 to 10% 10 to 15% > 15 %
Ratings (From the USGS 2000)
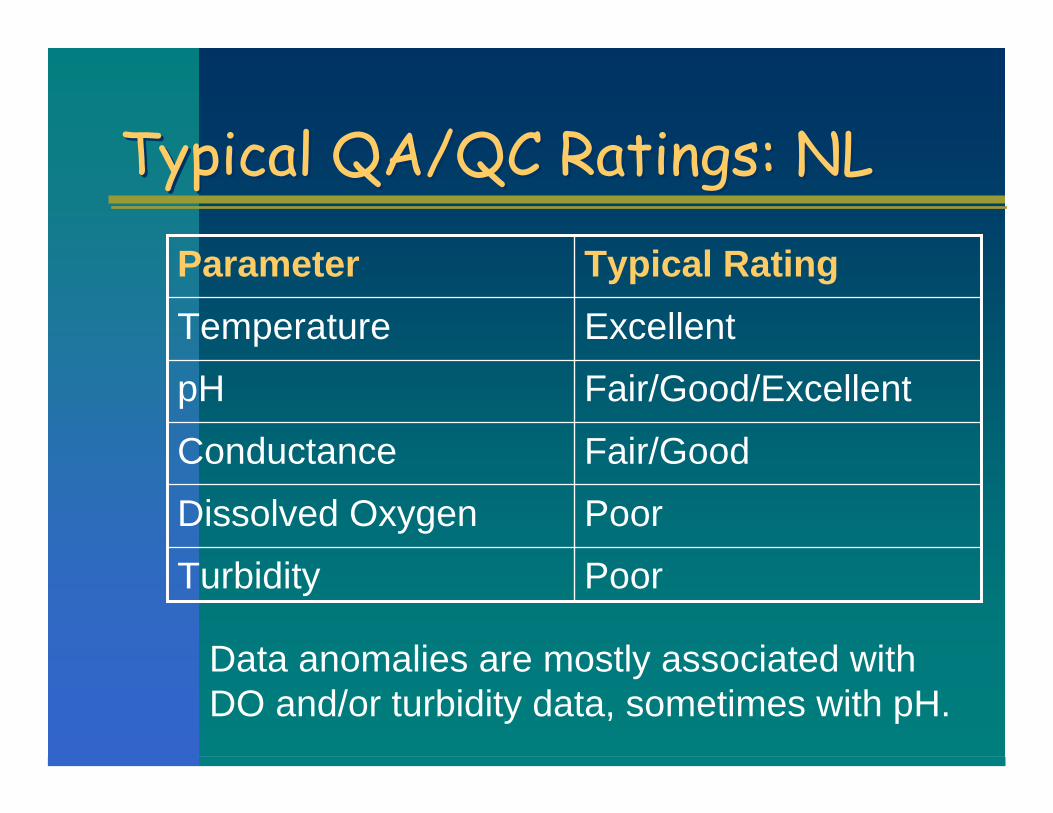
Typical QA/QC Ratings: NLTypical QA/QC Ratings: NL
PoorTurbidity
PoorDissolved Oxygen
Fair/GoodConductance
Fair/Good/ExcellentpH
ExcellentTemperature
Typical RatingParameter
Data anomalies are mostly associated with DO and/or turbidity data, sometimes with pH.
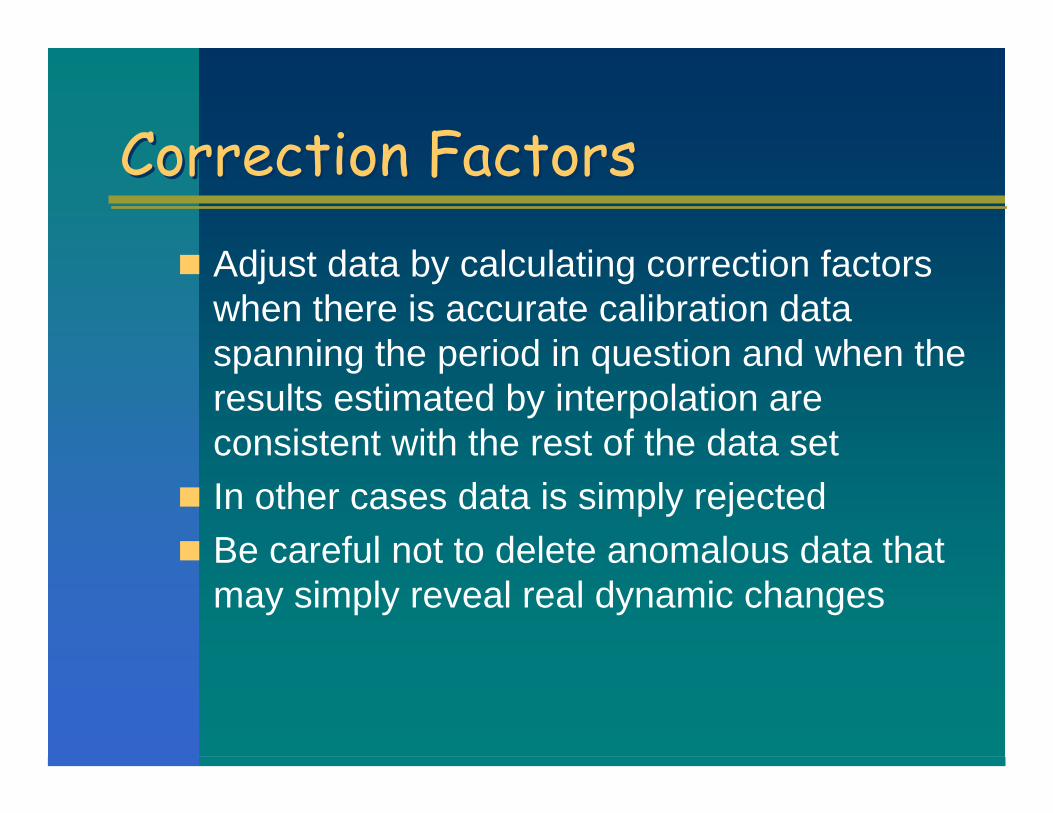
Correction FactorsCorrection FactorsAdjust data by calculating correction factors when there is accurate calibration data spanning the period in question and when the results estimated by interpolation are consistent with the rest of the data setIn other cases data is simply rejectedBe careful not to delete anomalous data that may simply reveal real dynamic changes

How is Correction Factor Measured?How is Correction Factor Measured?
Automatic RTWQ value is adjusted by the difference between the Automatic and Manual reading at probe extraction, spread over the entire data count
x
final
x tt
t DataCountDataCount
ManualAutomaticAutomaticFactorCorrection ×
−+=

RTWQ Summary StatisticsRTWQ Summary Statistics
Temp-Water pH Conductance Percent-Satur Diss-Oxymax 20.7 7.7 44.9 148.10 20.01min -0.1 5.4 25.3 87.71 7.78average 7.8 6.8 36.7 99.00 11.73standard diviation 5.7 0.3 3.6 8.14 2.10
From Humber River Station

Web Based ReportingWeb Based Reporting

Data GapsData Gaps
02YL003- Humber River at Humber Village Bridge
37.538
38.539
39.540
40.541
41.542
22-Jun 27-Jun 2-Jul 7-Jul 12-Jul 17-Jul 22-Jul 27-Jul 1-Aug
Date
Con
duct
ance
(uS/
cm)

Data Error: Unusual Data SpikesData Error: Unusual Data Spikes
02YL003- Humber River at Humber Village Bridge
0
200
400
600
800
1000
1200
20-Sep 30-Sep 10-Oct 20-Oct 30-Oct 9-Nov 19-Nov
Date
Turb
idity
(NTU
)

Guideline ExceedencesGuideline Exceedences
02YL003- Humber River at Humber Village Bridge
05
101520253035404550
9-Nov 14-Nov 19-Nov 24-Nov 29-Nov 4-Dec 9-Dec 14-Dec 19-Dec
Date
Turb
idity
(NTU
)
Turbidity Max Guideline (CCME)

Data Interpretation: Natural Conditions
Data Interpretation: Natural Conditions
02YL0012- Humber River at Humber Village Bridge
00.5
11.5
22.5
33.5
4
13-May
18-May
23-May
28-May
2-Jun 7-Jun 12-Jun 17-Jun 22-Jun 27-Jun
Date
Stag
e02YL0012- Humber River at Humber Village Bridge
0
1020
30
4050
60
13-May
18-May
23-May
28-May
2-Jun 7-Jun 12-Jun 17-Jun 22-Jun 27-Jun
Date
Turb
idity
(NTU
)
Examine data in context of our understanding of natural conditions and other data

Data Interpretation: Seasonal Effects
Data Interpretation: Seasonal Effects
02YL0012- Humber River at Humber Village Bridge
0
1
2
3
4
5
6
5-Dec 10-Dec
15-Dec
20-Dec
25-Dec
30-Dec
4-Jan 9-Jan 14-Jan 19-Jan
Date
Tem
p-W
ater
(oC
)02YL0012- Humber River at Humber Village Bridge
10.811
11.211.411.611.8
1212.2
5-Dec 10-Dec
15-Dec
20-Dec
25-Dec
30-Dec
4-Jan 9-Jan 14-Jan 19-Jan
Date
Dis
s-O
xy (m
g/L)

QA/QC Logistics: Time and MoneyQA/QC Logistics: Time and Money
Optimal number of RTWQ Monitoring locations assigned per person: 3-5QA/QC of data generally takes 30-60 days after collectionQA/QC requirements must be incorporated into the long term budgeting for any RTWQ monitoring program
No standard costs available but would include:– Instruments– Staff time – Grab sample analysis– Calibration solution
and maintenance supplies
– Installation site upkeep– Transportation– Training– Other

RTWQ Monitoring QA/QC InnovationsRTWQ Monitoring QA/QC Innovations
Data Visualization Tools (DVTs) to rapidly display data in a variety of formats to help identify anomalous dataData processing programs to profile data readings to look for data outside of expected ranges– Temp: < -1 or > 35 oC, pH: < 4 or >
10On-site calibration cube van (USGS)

USGS Guidance ManualUSGS Guidance ManualProvides basic guidelines
and procedures in:– site and water-quality
monitor selection– field procedures– calibration of continuous
water quality monitors– record computation and
review– data reporting
http://pubs.usgs.gov/tm/2006/tm1D3//

QA/QC ConclusionsQA/QC ConclusionsThe QA/QC of near-real time remotely collected sensor data has provided challenges that were not present under traditional sampling regimesNew rigorous protocols for each step of the data acquisition effort have been developedAs RTWQ technologies become more common in resource management, future efforts must be directed toward the unique problems posed by real-time data collection

Questions?Questions?