qatar economic report 2015 · economics qatar june 10, 2015 the qatari economy continued to perform...
TRANSCRIPT

1June 08, 2015
ECONOMICS
QATAR
JUNE 10, 2015
TABLE OF CONTENTS
CONTACTS
Research
Marwan S. Barakat(961-1) [email protected]
Jamil H. Naayem(961-1) [email protected]
Salma Saad Baba(961-1) [email protected]
Fadi A. Kanso(961-1) [email protected]
Sarah F. Borgi(961-1) [email protected]
Gerard H. Arabian(961-1) 964047 [email protected]
Farah N. Nahlawi
(961-1) [email protected]
Executive Summary 1
Introduction 2
Economic Conditions 4
Real Sector 4
External Sector 8
Public Sector 9
Financial Sector 10
Conclusion 16
The Qatar Economic Report can be accessed via internet at the following web address: http://www.banqueaudi.com
QATAR ECONOMIC REPORT
MAINTAINING STRONG ECONOMIC MOMENTUM IN AN INCREASINGLY
CHALLENGING ENVIRONMENT
• Strong growth momentum despite the contraction in energy prices The Qatari economy grew by 6.1% in 2014 (almost similar to 2013) and is set to rebound to 7.1% in 2015
according to the International Monetary Fund. The strong performance of the past year was actually driven
by an 11.8% expansion in the non-mining and quarrying sector which included a 17.7% year-on-year
increase in the construction sector while the hydrocarbon sector shrank by 1.5% in 2014. Other non-energy
growth drivers last year included financial services and the hotel and restaurant trade. The continuing influx
of foreign workers and resultant rapid population growth is increasing local consumption and the demand
for housing and financial services.
• Lower external surpluses amidst a slump in oil prices Qatar’s external sector came under pressure within the context of a slump in oil prices. The State’s overall
trade surplus contracted by 4.5% in 2014 as compared to a 3.1% growth in 2013, as per the Central Bank of
Qatar, and the current account surplus fell to 26.1% of GDP in 2014, compared to 30.7% of GDP in 2013. A
detailed look at the trade activity shows that total imports retreated by a tiny 1.0% year-on-year to reach US$
US$ 31.2 billion in 2014. Total exports declined by 3.7% in 2014 to reach US$ 131.7 billion.
• Decrease in government surplus reflecting lower hydrocarbon revenuesDriven by a drop in hydrocarbon revenues, growth in Qatar’s government balance has turned negative.
According to data released by the IMF, the government surplus has decreased by 30% to reach US$ 29.4
billion in FY 2014/2015, reversing the trend registered in the last few years, of which an increase of 53%
recorded in the FY 2013/2014. Following a rise of 22.1% in FY 2013/2014, revenues went down by 9.1% to
US$ 96.6 billion in FY 2014/2015. On the other hand, expenditures totalled US$ 67.3 billion in FY 2014/2015,
up by 4.5% from the previous FY during which they had risen by 8.1%. Gross government debt is estimated
at 31.5% of GDP as of March 2015.
• Contained inflation along with stability in money supplyQatar’s monetary conditions were marked during the first four months of the year 2015 by contained price
pressures, a fall in international reserves, sustained low policy rates in the context of an accommodative
monetary policy, and relative stability in monetary aggregates. Qatar’s Consumer Price Index grew by a mere
0.9% year-on-year in April 2015, after rising by 3.0% on average in 2014, mainly due to the direct and indirect
effects of falling oil and non-oil commodity prices and due to methodological changes adopted by Qatari
authorities in compiling CPI data.
• Strong activity growth coupled with robust financial soundnessQatar’s banking sector registered yet another year of solid private sector activity growth in 2014 and so far
this year. Measured by total assets of banks operating in Qatar, total sector activity reported a 10.4% growth
before registering a tiny one in this year’s first four months (+0.4%), reaching a total of US$ 277.2 billion at
end-April 2015. Financial soundness indicators continue to be robust, with a liquidity ratio of 23.1% of total
deposits, a non-performing loan ratio of 1.7% of total loans, a capital adequacy ratio of 16.3% and ROAA of
2.1% and ROAE of 16.5%.
• Mixed price movements in capital markets Qatar’s capital markets saw mixed price movements over the first five months of 2015. The equity market
registered price declines following strong price rally observed over the past couple of years, with Qatari
stocks posting the highest earnings multiple in the MENA region by year-end 2014. The Qatar Exchange
general index declined by 1.9% during the first five months of 2015, after rising by 18.4% in 2014. On the
other hand, the fixed income market in Qatar witnessed mostly upward price movements, given the ample
liquidity in the market and in the absence of new bond issues over the first five months of 2015.
Bank Audi sal - Group Research Department - Bank Audi Plaza - Bab Idriss - PO Box 11-2560 - Lebanon - Tel: 961 1 994 000 - email: [email protected]

2June 08, 2015
ECONOMICS
QATAR
JUNE 10, 2015
The Qatari economy continued to perform relatively well, maintaining a strong growth momentum
despite the contraction in energy prices. According to the International Monetary Fund, the Qatari
economy grew by 6.1% in 2014 (almost similar to 2013) and is set to rebound to 7.1% in 2015. The strong
performance of the past year was actually driven by an 11.8% expansion in the non-mining and quarrying
sector which included a 17.7% year-on-year increase in the construction sector while the hydrocarbon
sector shrank by 1.5% in 2014. Other non-energy growth drivers last year included financial services and
the hotel and restaurant trade. The continuing influx of foreign workers and resultant rapid population
growth is increasing local consumption and the demand for housing and financial services.
Qatar’s non-hydrocarbon sector has been indeed the primary driver of growth in recent years, driven by
infrastructure public spending and in line with Qatar’s long term development strategy. Public spending
has been considerably strong on the back of the government’s desire to provide Qatar with World class
infrastructure, health and education system, as well as outlays related to hosting the World Cup in 2022.
It is worth mentioning that despite the significant public spending growth, Qatar’s fiscal breakeven oil
price remains among the lowest in GCC countries which is partly tied to prudent budgeting. The public
finance balance remains in a surplus of 14.5% in FY 2014 and is forecasted to maintain a small surplus of
5.6% in FY 2015.
In parallel, the current account balance is being squeezed from both sides as contracting hydrocarbon
revenues combine with growing imports stemming from large infrastructure projects and the expanding
population. Still, it is worth highlighting that despite the fall in oil prices, Qatar’s current account remained
in surplus of 26.1% of GDP in 2014 (and is still expected at a surplus of 8.4% of GDP in 2015). The surplus
is boosting official foreign exchange reserves which reached a high of US$ 42.6 billion at end-December
2014.
At the monetary level, monetary policy remains accommodative in the context of the peg to the dollar.
In parallel, direct and indirect effects of falling oil and non-oil commodity prices have allowed consumer
price inflation to trend down, with inflation set to reach new floor after sharp fall in 2014. As a matter of
fact, the sharp fall in global commodity prices pushed down average inflation to 3% in 2014 and is likely
to push it further down to 2% in 2015. The moderate inflation in 2014 actually took place despite a 35%
yearly rise in the real estate index produced by the Central Bank. It is worth mentioning in this context
that the disinflationary effect will be magnified by the strength of the dollar, in which many commodities
are priced.
Sources: IMF, Bank Audi’s Group Research Department Sources: Central Bank of Qatar, Bank Audi’s Group Research Department
NOMINAL GDP AND REAL GROWTH RATES GDP BREAKDOWN BY ECONOMIC ACTIVITY*

3June 08, 2015
ECONOMICS
QATAR
JUNE 10, 2015
Banking activity in Qatar maintained a sound growth amid strong financial standing. Measured by the
consolidated assets of operating banks, total banking activity grew by 10.4% in 2014, but slowed down
to 0.4% in the first four months of 2015. Credit growth is still high at 13.0% in 2014 and 2.9% in the first
four months of 2015. Financial soundness indicators are good, with adequate capitalization, sound asset
quality, acceptable liquidity and high profitability.
At the capital markets level, equity markets have been somehow volatile. Having managed to hold onto a
positive gain (of 18.4%) in 2014, they are down by 1.9% for the year-to-date. Still, the Doha stock market
remains a strong performer as it ranks third in the region by market capitalization. Qatar’s 5-year CDS
spreads which stay low compared to the stresses in 2011, have remained almost stable in 2014 and in the
year-to-date period of 2015.
The detailed developments in the real sector, external sector, public sector and financial sector are
outlined in the sections that follow while the concluding remarks address Qatar’s near-term economic
outlook looking forward.
Sources: Central Bank of Qatar, IMF, Bank Audi’s Group Research Department
MONEY SUPPLY AND INFLATION

4June 08, 2015
ECONOMICS
QATAR
JUNE 10, 2015
1. ECONOMIC CONDITIONS
1.1. REAL SECTOR
1.1.1. Hydrocarbons
Hydrocarbons sector slows down from previous year
Qatar’s hydrocarbon industries witnessed a real contraction of 1.5% in 2014, against an expansion of
0.2% in 2013, according to official statistics. The country’s diversification strategy, part of Qatar National
Vision 2030, has been successful in supporting the non-hydrocarbons sector with the growth of the latter
exceeding that of hydrocarbons for the third consecutive year. Furthermore, showing further evidence
of the country’s diversification efforts, the share of the hydrocarbon sector out of total GDP dropped
from 57.0% in 2012 to 54.4% in 2013 to 50.5% in 2014. Export revenues from the hydrocarbon sector also
contracted by 7.9% in 2014 compared to a 2.2% expansion in 2013, as per the IMF.
Moving to the production of hydrocarbons, Qatar’s LNG production attained 77.8 million tons in 2014,
down by a marginal 0.4% year-on-year, according to IMF data. This compares to production rises of 1.5%
in 2013 and 0.7% in 2012. As for oil production, it continued its decreasing trend moving from 697.8
thousand barrels per day (bpd) in 2013 to 670 thousand bpd in 2014, a yearly decline of 3.9%.
Despite Qatar’s diversification efforts set in the 2030 National Vision, the economy is still heavily dependent
on hydrocarbons. For instance, oil and gas (including investment income from Qatar Petroleum) account
for around 85% of fiscal revenues, and current external receipts and spending of hydrocarbon revenues
are a key driver of the non-hydrocarbon economy. Also, it is worth adding that Qatar has the third-largest
reserves of gas in the world and 80% of its LNG exports are under long-term contracts, the earliest of
which expires in 2021.
Nonetheless, it is expected that the hydrocarbon sector would see growth in 2015 as a result of the
completion of the first two trains of the Barzan North Field gas development, which is designed to produce
gas feedstock for domestic power and water use. Barzan Gas Project is a vital project expected to sustain
and fuel the ongoing and future major infrastructure projects in Qatar. The US$ 10.3 billion project, being
implemented by RasGas, would increase its overall production capacity to 11 billion standard cubic feet
of sales gas per day and make it one of the world’s biggest single gas processors. In parallel, Chinese
companies have been increasingly active in the Qatari upstream sector with China National Offshore Oil
Corporation and PetroChina involved in exploring for new gas finds off Qatar’s north coast.
The majority of upstream investment in the next three years would focus on oil field redevelopments.
Occidental Petroleum would enter the fifth phase of the Idd El Shargi field development after signing an
agreement with Qatar Petroleum (QP) in mid-2013 to sustain oil production at around 100,000 barrels per
day. QP is also budgeting US$ 13 billion for the redevelopment of the Bul Hanine oil field.
NATURAL GAS PRICES
Sources: IMF, Bank Audi’s Group Research Department
CRUDE OIL PRICES
Sources: Bloomberg, Bank Audi’s Group Research Department

5June 08, 2015
ECONOMICS
QATAR
JUNE 10, 2015
As a result of the lower hydrocarbons export prices, government revenue was negatively affected,
contributing to curbing government spending. For instance, oil-related schemes such as the Al Karaana
petrochemicals project are vulnerable and would be delayed until oil prices recover in 2017 to 2019, as
per the Economist Intelligence Unit (EIU). Qatar’s State-run oil marketing firm Tasweeq also reported plans
to cut condensates exports by 150,000 barrels per day over the next two years.
In sum, falling oil prices make economic diversification even more crucial. The government would
continue to invest heavily in infrastructure projects essential for promoting the non-hydrocarbons sector
and turning Qatar into a regional financial and business hub.
1.1.2. Manufacturing
Robust growth with growing importance of economic diversification
Being a major component of Qatar’s economic diversification efforts, the country’s manufacturing sector
contributed to 10.0% of aggregate output in 2014 and expanded by 5.2% annually to become the third
largest contributor to GDP. The country’s manufacturing sector is essential to diversify Qatar’s economy by
creating job opportunities for future generations, reducing the country’s exposure to the hydrocarbons
sector, and reinforcing the private sector.
Incentives offered to industrial facilities in Qatar allow for the creation of a strong industrial base that
meets growing demand from the local market and allows it to compete internationally, as per the Gulf
Organization for Industrial Consulting (GOIC). In fact, the value of Qatar’s local investments in joint
industrial projects was about US$ 29.2 billion in 2014, with 35.4% of the total cumulative investments
taking place in manufacturing industries.
Moving on to the Qatar National Vision 2030, the country aims to expand industries and services, which
include manufacturing, with competitive advantages derived from hydrocarbon industries, develop
economic activities in which Qatar can specialize , and form a knowledge-based economy characterized
by innovation, entrepreneurship and excellence in education.
Within this context, Qatar Primary Materials Company’s (QPMC) 60,000 ton capacity cement silo project
at Mesaieed would be operational by November 2015, as per QPMC. The project would have 12 silos
with 5,000 tons of storage capacity each, as per the same source. On the other hand, State-owned Qatar
Petroleum and Royal Dutch Shell decided to halt their joint Al Karaana petrochemical project in Qatar.
The companies stated in a joint statement that the decision was made after the project was deemed
commercially unfeasible based on the price quoted to build the complex, amid the current economic
climate in the energy industry. In December 2011, Qatar Petroleum and Shell agreed to build a US$ 6.4
billion petrochemical complex in the Ras Laffan industrial city in Qatar, with the Qatari company holding
an 80% stake and Shell a 20% stake.
1.1.3. Construction
Another good year for Qatar’s realty sector
The construction sector in Qatar accounting for 5.6% of GDP continues to be supported by public spending
and population growth. In fact, it is estimated to have expanded by 18.0% in 2014, against 13.6% in 2013,
according to the Ministry of Development Planning and Statistics.
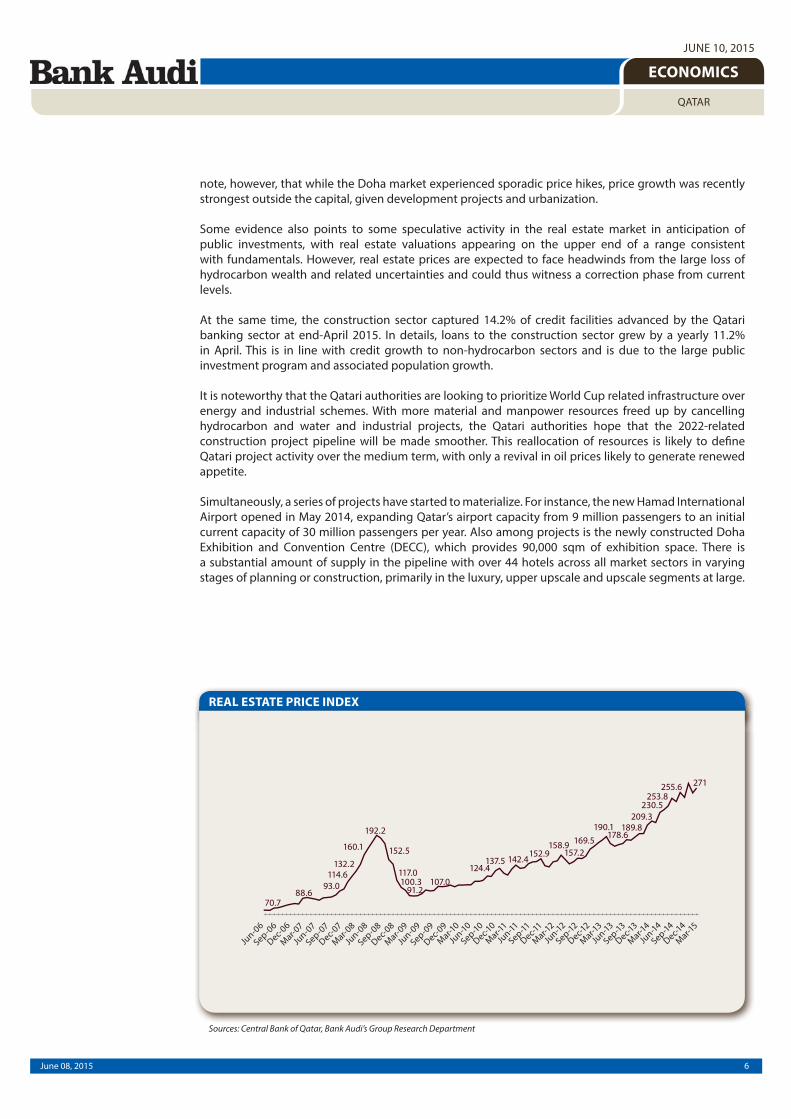
Moreover, Qatar’s real estate price index expanded by almost 16 points in March 2015 from year-end
2014, and by 62 points year-on-year, according to the Central Bank of Qatar. According to the IMF, this is
actually due to the fact that new housing supply is slow to accommodate demand from expatriates and
the government continues to purchase land for infrastructure projects. In fact, real estate prices, and land
prices in particular, have gone up quickly, especially in the second half of 2014. While the total number
of real estate transactions has decreased from the 2013 peak, the total value of real estate transactions
has dramatically increased, reflecting higher average prices and compositional changes. It is worthy to
6June 08, 2015
ECONOMICS
QATAR
JUNE 10, 2015
note, however, that while the Doha market experienced sporadic price hikes, price growth was recently
strongest outside the capital, given development projects and urbanization.
Some evidence also points to some speculative activity in the real estate market in anticipation of
public investments, with real estate valuations appearing on the upper end of a range consistent
with fundamentals. However, real estate prices are expected to face headwinds from the large loss of
hydrocarbon wealth and related uncertainties and could thus witness a correction phase from current
levels.
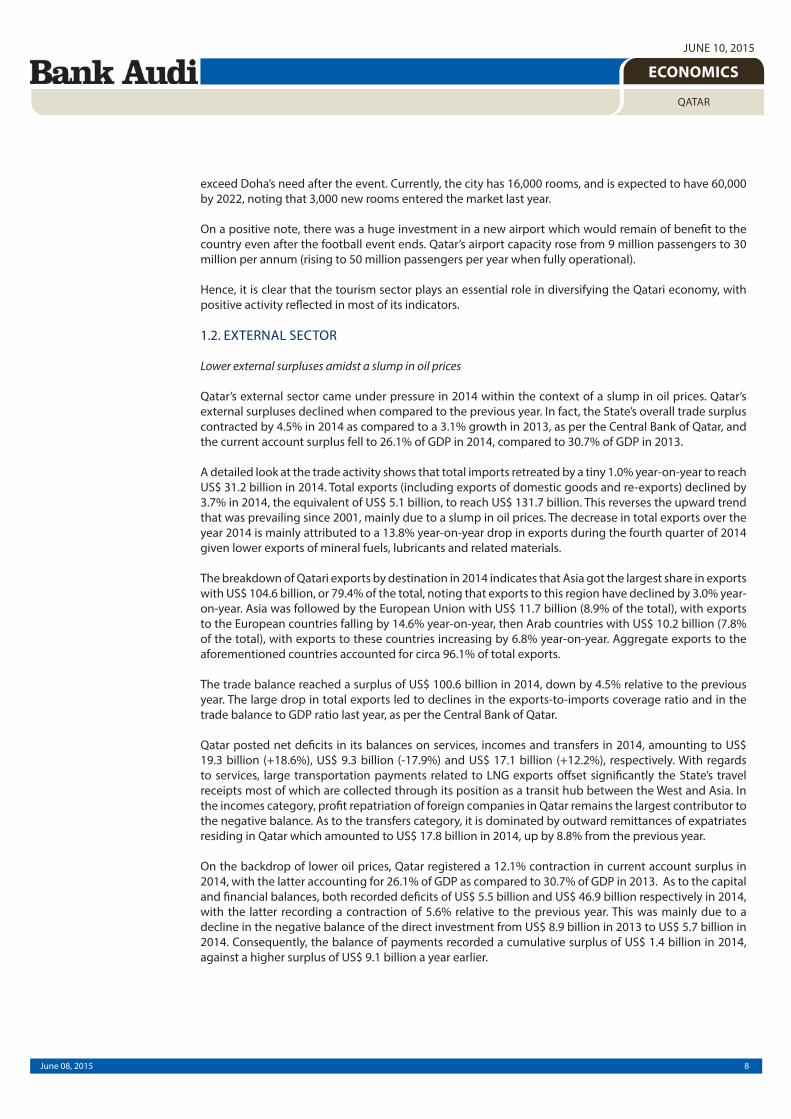
At the same time, the construction sector captured 14.2% of credit facilities advanced by the Qatari
banking sector at end-April 2015. In details, loans to the construction sector grew by a yearly 11.2%
in April. This is in line with credit growth to non-hydrocarbon sectors and is due to the large public
investment program and associated population growth.
It is noteworthy that the Qatari authorities are looking to prioritize World Cup related infrastructure over
energy and industrial schemes. With more material and manpower resources freed up by cancelling
hydrocarbon and water and industrial projects, the Qatari authorities hope that the 2022-related
construction project pipeline will be made smoother. This reallocation of resources is likely to define
Qatari project activity over the medium term, with only a revival in oil prices likely to generate renewed
appetite.
Simultaneously, a series of projects have started to materialize. For instance, the new Hamad International
Airport opened in May 2014, expanding Qatar’s airport capacity from 9 million passengers to an initial
current capacity of 30 million passengers per year. Also among projects is the newly constructed Doha
Exhibition and Convention Centre (DECC), which provides 90,000 sqm of exhibition space. There is
a substantial amount of supply in the pipeline with over 44 hotels across all market sectors in varying
stages of planning or construction, primarily in the luxury, upper upscale and upscale segments at large.
REAL ESTATE PRICE INDEX
Sources: Central Bank of Qatar, Bank Audi’s Group Research Department
7June 08, 2015
ECONOMICS
QATAR
JUNE 10, 2015
1.1.4. Tourism
Positive performance in the sector serving the country’s diversification strategy
Qatar’s tourism sector plays a pivotal role in the country’s economic diversification strategy. In 2014, the
total number of tourists visiting Qatar registered 2.82 million with tourists from the GCC region accounting
for the biggest share of 40% of total visitors, as per the Qatar Tourism Authority.
Looking at the first quarter of 2015, regional and international visitor arrivals amounted to 841,025 up
by nearly 11% year-on-year. The GCC remained the largest arrivals’ source market, whereby its number of
visitors grew by 16% compared to the first quarter of 2014.
According to the World Travel and Tourism Council (WTCC), the direct contribution of travel and tourism
to the country’s GDP was US$ 4.2 billion (2.0% of total GDP) in 2014. This number is forecasted to grow by
7.3% to US$ 4.6 billion in 2015. Furthermore, this contribution is expected to increase by 4.7% per annum
to US$ 7.2 billion (1.7% of GDP) by 2025.
It is worth noting that travel and tourism investment was US$ 1.6 billion in 2014 (2.3% of total investment).
This is expected to increase by 14.9% in 2015, and by 7.7% per annum to stand at US$ 3.9 billion in 2025
(2.5% of total), as per WTTC.
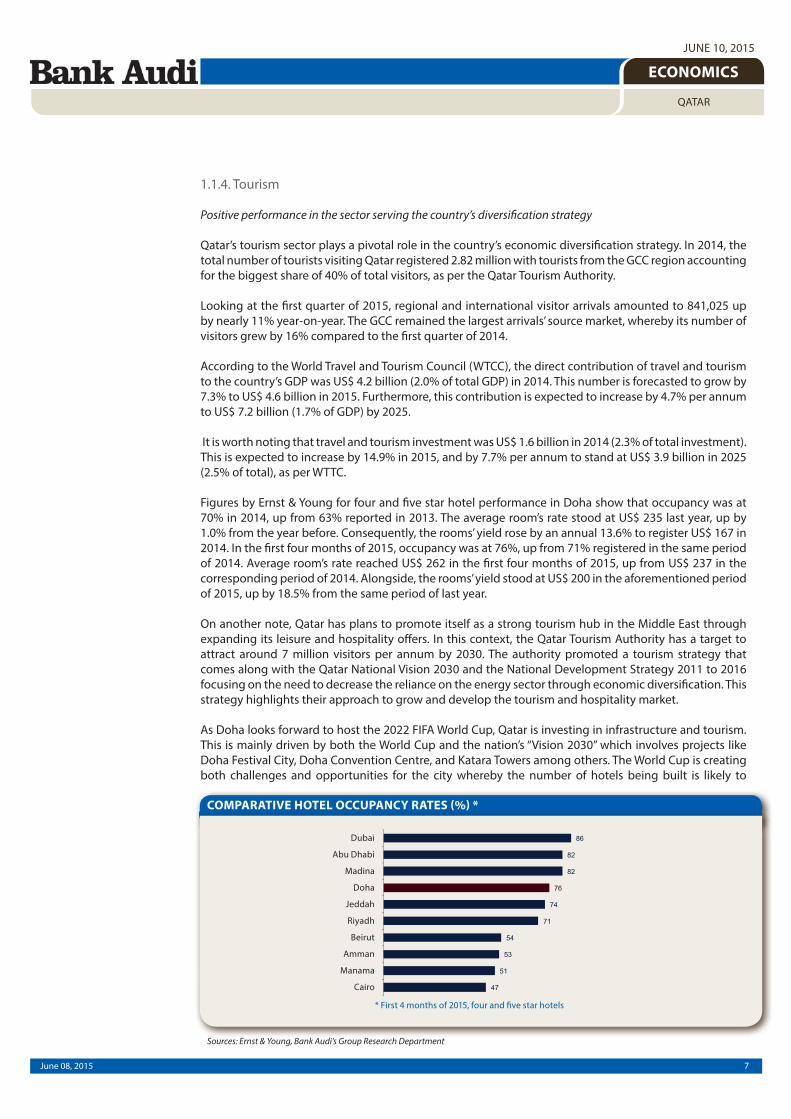
Figures by Ernst & Young for four and five star hotel performance in Doha show that occupancy was at
70% in 2014, up from 63% reported in 2013. The average room’s rate stood at US$ 235 last year, up by
1.0% from the year before. Consequently, the rooms’ yield rose by an annual 13.6% to register US$ 167 in
2014. In the first four months of 2015, occupancy was at 76%, up from 71% registered in the same period
of 2014. Average room’s rate reached US$ 262 in the first four months of 2015, up from US$ 237 in the
corresponding period of 2014. Alongside, the rooms’ yield stood at US$ 200 in the aforementioned period
of 2015, up by 18.5% from the same period of last year.
On another note, Qatar has plans to promote itself as a strong tourism hub in the Middle East through
expanding its leisure and hospitality offers. In this context, the Qatar Tourism Authority has a target to
attract around 7 million visitors per annum by 2030. The authority promoted a tourism strategy that
comes along with the Qatar National Vision 2030 and the National Development Strategy 2011 to 2016
focusing on the need to decrease the reliance on the energy sector through economic diversification. This
strategy highlights their approach to grow and develop the tourism and hospitality market.
As Doha looks forward to host the 2022 FIFA World Cup, Qatar is investing in infrastructure and tourism.
This is mainly driven by both the World Cup and the nation’s “Vision 2030” which involves projects like
Doha Festival City, Doha Convention Centre, and Katara Towers among others. The World Cup is creating
both challenges and opportunities for the city whereby the number of hotels being built is likely to
COMPARATIVE HOTEL OCCUPANCY RATES (%) *
Sources: Ernst & Young, Bank Audi’s Group Research Department
8June 08, 2015
ECONOMICS
QATAR
JUNE 10, 2015
exceed Doha’s need after the event. Currently, the city has 16,000 rooms, and is expected to have 60,000
by 2022, noting that 3,000 new rooms entered the market last year.
On a positive note, there was a huge investment in a new airport which would remain of benefit to the
country even after the football event ends. Qatar’s airport capacity rose from 9 million passengers to 30
million per annum (rising to 50 million passengers per year when fully operational).
Hence, it is clear that the tourism sector plays an essential role in diversifying the Qatari economy, with
positive activity reflected in most of its indicators.
1.2. EXTERNAL SECTOR
Lower external surpluses amidst a slump in oil prices
Qatar’s external sector came under pressure in 2014 within the context of a slump in oil prices. Qatar’s
external surpluses declined when compared to the previous year. In fact, the State’s overall trade surplus
contracted by 4.5% in 2014 as compared to a 3.1% growth in 2013, as per the Central Bank of Qatar, and
the current account surplus fell to 26.1% of GDP in 2014, compared to 30.7% of GDP in 2013.
A detailed look at the trade activity shows that total imports retreated by a tiny 1.0% year-on-year to reach
US$ 31.2 billion in 2014. Total exports (including exports of domestic goods and re-exports) declined by
3.7% in 2014, the equivalent of US$ 5.1 billion, to reach US$ 131.7 billion. This reverses the upward trend
that was prevailing since 2001, mainly due to a slump in oil prices. The decrease in total exports over the
year 2014 is mainly attributed to a 13.8% year-on-year drop in exports during the fourth quarter of 2014
given lower exports of mineral fuels, lubricants and related materials.
The breakdown of Qatari exports by destination in 2014 indicates that Asia got the largest share in exports
with US$ 104.6 billion, or 79.4% of the total, noting that exports to this region have declined by 3.0% year-
on-year. Asia was followed by the European Union with US$ 11.7 billion (8.9% of the total), with exports
to the European countries falling by 14.6% year-on-year, then Arab countries with US$ 10.2 billion (7.8%
of the total), with exports to these countries increasing by 6.8% year-on-year. Aggregate exports to the
aforementioned countries accounted for circa 96.1% of total exports.
The trade balance reached a surplus of US$ 100.6 billion in 2014, down by 4.5% relative to the previous
year. The large drop in total exports led to declines in the exports-to-imports coverage ratio and in the
trade balance to GDP ratio last year, as per the Central Bank of Qatar.
Qatar posted net deficits in its balances on services, incomes and transfers in 2014, amounting to US$
19.3 billion (+18.6%), US$ 9.3 billion (-17.9%) and US$ 17.1 billion (+12.2%), respectively. With regards
to services, large transportation payments related to LNG exports offset significantly the State’s travel
receipts most of which are collected through its position as a transit hub between the West and Asia. In
the incomes category, profit repatriation of foreign companies in Qatar remains the largest contributor to
the negative balance. As to the transfers category, it is dominated by outward remittances of expatriates
residing in Qatar which amounted to US$ 17.8 billion in 2014, up by 8.8% from the previous year.
On the backdrop of lower oil prices, Qatar registered a 12.1% contraction in current account surplus in
2014, with the latter accounting for 26.1% of GDP as compared to 30.7% of GDP in 2013. As to the capital
and financial balances, both recorded deficits of US$ 5.5 billion and US$ 46.9 billion respectively in 2014,
with the latter recording a contraction of 5.6% relative to the previous year. This was mainly due to a
decline in the negative balance of the direct investment from US$ 8.9 billion in 2013 to US$ 5.7 billion in
2014. Consequently, the balance of payments recorded a cumulative surplus of US$ 1.4 billion in 2014,
against a higher surplus of US$ 9.1 billion a year earlier.

9June 08, 2015
ECONOMICS
QATAR
JUNE 10, 2015
Going forward, the recent large drop in oil and natural gas prices would lead to a substantial deterioration
of the fiscal and external balances, calling for intensification of diversification efforts and some fiscal
consolidation in the medium term. In sharp contrast to previous years, the budget will be in deficit from
2016 onward and the current account surplus would largely be eliminated, as per the IMF.
1.3. PUBLIC SECTOR
Decrease in government surplus reflecting lower hydrocarbon revenues
Driven by a drop in hydrocarbon revenues, growth in Qatar’s government balance has turned negative.
According to data released by the IMF, the government surplus has decreased by 30% to reach US$ 29.4
billion in FY 2014/2015, reversing the trend registered in the last few years, of which an increase of 53%
recorded in the FY 2013/2014.
Following a rise of 22.1% in FY 2013/2014, revenues went down by 9.1% to US$ 96.6 billion in FY
2014/2015. Revenues stemming from hydrocarbons accounted for 47.1% of the total compared to
a higher share of 57.2% in FY 2013/2014. At the same time, non-hydrocarbon revenues accounted for
52.9% of FY 2014/2015 total revenues. Detailed IMF data shows that the dollar value of hydrocarbon
revenues decreased by 23.6% to account for 20.0% of the country’s GDP in FY 2014/2015, following a
rise of 10.0% in FY 2013/2014 during which they accounted for 26.1% of GDP. A lower growth rate was
registered by the other types of revenue, including investment income from public enterprises, corporate
tax revenues, and other non-tax revenues. In fact, the growth level of the above mentioned revenues
decelerated from a level of 37.0% in FY 2013/2014 to a much lower one of 14.8% in FY 2014/2015. Within
the context of renewed diversification efforts, the share of non-hydrocarbon revenues in the country’s
GDP has increased from 19.5% in FY 2013/2014 to 22.5% in FY 2014/2015. It is worth noting, however,
that growth in this category was mainly driven by revenues from public enterprises at large.
On the other hand, expenditures totaled US$ 67.3 billion in FY 2014/2015, up by 4.5% from the previous
fiscal year during which they had risen by 8.1%. Around 70% of the total was allocated to current
expenditures, almost equal to the share of 69% allocated in FY 2013/2014. The dollar value of the current
expenditures as well as that of capital expenditures both progressed at a mild pace last year. In fact, the
share of the latter out of the FY 2014/2015 GDP reached 10.9%, up from 10.1% in the previous fiscal
year. In fact, the consistent growth in capital expenditures is in line with Qatar’s ambitious diversification
agenda through a large public investment program. At the same time, growth in current expenditures
was restrained, mirroring the ongoing budget reforms and the significant progress made in setting up
the macro-fiscal unit and the public investment department.
Gross government debt as of March 2015 is estimated at 31.5% of GDP. Net worth of the Qatari
government remains, however, positive and 3-digit, when including the Qatar Investment Authority’s
(QIA) large assets.
Sources: Central Bank of Qatar, Bank Audi’s Group Research DepartmentSources: Ministry of Development Planning and Statistics, IMF, Bank Audi’s Group Research Department
CURRENT ACCOUNT AND BALANCE OF PAYMENTS FOREIGN SECTOR INDICATORS

10June 08, 2015
ECONOMICS
QATAR
JUNE 10, 2015
The fiscal balance has emerged at the end of FY 2014/2015 at around 14.5% of GDP. Looking forward,
despite the short-term growth outlook being positive, lower oil prices are expected to lead to a substantial
deterioration of the fiscal balance, with the IMF suggesting that the government budget could fall into a
deficit from 2016 onwards.
Finally, according to IMF recommendations, the oil price slump highlights the need for specifying a clear
medium-term fiscal framework, including contingency plans. The Ministry of Finance should formulate
medium-term fiscal objectives and, accordingly, an annual budgeting process, so that spending overruns
are eliminated.
1.4. FINANCIAL SECTOR
1.4.1. Monetary Situation
Contained inflation along with stability in money supply
Qatar’s monetary conditions were marked during the first four months of the year 2015 by contained price
pressures, a fall in international reserves, sustained low policy rates in the context of an accommodative
monetary policy, and relative stability in monetary aggregates.
Qatar’s Consumer Price Index grew by a mere 0.9% year-on-year in April 2015, after rising by 3.0% on
average in 2014, mainly due to the direct and indirect effects of falling oil and non-oil commodity prices
and due to methodological changes adopted by Qatari authorities in compiling CPI data. The breakdown
of the Consumer Price Index by segment showed in April 2015 that the tobacco segment rose by 14.1%
year-on-year, followed by the education segment with +11.1%, the transport segment with +6.0%,
the housing, water, electricity and gas segment with +3.0%, noting that the two latter segments have
together a combined weight of 36.5%. The furnishings and household equipment segment increased
by 0.9%, followed by the restaurants and hotels segment with +0.7%, the food and beverages segment
with +0.3%, the clothing and footwear segment with +0.2%, and the health segment with +0.2%. In
contrast, the recreation and culture segment reported a decline of 9.8% year-on-year, followed by the
communication segment with -3.5% and the miscellaneous goods and services segment with -0.1%.
The Qatari authorities started in January 2015 compiling CPI data according to a new methodology.
The new index shifts the basket weights from an old base year of 2007 to a new base year of 2013, and
implements other methodological changes. In the new CPI, the “Classification of Individual Consumption
According to Purpose” method has been used, which divides the prices basket into twelve main groups
instead of eight groups. The main implication is a drop in the weight of housing, electricity, water, and gas
from 32.1% to 21.9%, although it remains the highest in the basket. The reduction is partly explained by
the change in methodology for the computation of rental, following the exclusion of imputed rental of
owner-occupied dwellings. The weight for “Recreation and Culture” which includes expenditure incurred
abroad in respect of transport, travel and tourism, increased from 4.1% to 12.7% in the 2013 base CPI.
Finally, the weight for “Restaurants and hotels” rose from 3.7% to 6.1%.
Sources: IMF, Bank Audi’s Group Research Department Sources: IMF, Bank Audi’s Group Research Department
SELECTED PUBLIC FINANCE INDICATORS PUBLIC INDEBTEDNESS AND DEBT RATIO

11June 08, 2015
ECONOMICS
QATAR
JUNE 10, 2015
In 2015, inflation could decelerate to 1.8%, according to the IMF, given the large drop in international
commodity prices, including for food, and an appreciating US Dollar, although the rental market is likely
to continue putting upward pressure on inflation given strong expatriate labor inflows.
With inflation remaining quite contained in 2015, the Qatar Central Bank maintained its policy lending
and deposit rates unchanged so far this year, extending the trend that was prevailing over the past three
years. Accordingly, the overnight lending rate stands currently at 4.50%, the repo rate at 4.50%, and the
overnight deposit rate at 0.75%.
On the other hand, Qatar Central Bank’s net international reserves reversed during the first four months
of 2015 the upward trend that was prevailing over the past three years, registering a 4.6% decline since
end-2014, the equivalent of US$ 2 billion, to reach US$ 40.7 billion at end-April 2015, driven by a 14.8%
fall in balances with foreign banks. The QCB net international reserves covered around 41.7% of money
supply in local currency at end-April 2015 as compared to 44.6% at end-2014.
The broader Money Supply (M2) expanded by a mere 0.1% during the first four months of 2015 to reach
US$ 138.7 billion at end-April 2015, following a 10.6% expansion in 2014. The shy US$ 199 million variation
in money supply during the first four months of 2015 compares to a money creation of US$ 1.1 billion,
resulting mostly from a surge in claims on private sector of US$ 6.0 billion, an increase of US$ 1.6 billion
in net claims on the public sector and a fall of US$ 6.5 billion in net foreign assets. The difference between
the expansion in money supply on the one hand and money creation on the other hand, suggests a
demonetization of monetary claims by US$ 893 million during the first four months of 2015.
The Qatari Riyal continues to be pegged to the US Dollar at a rate of QR 3.64/US$ 1 since July 2002.
The authorities seem committed to maintaining the current exchange rate regime, arguing not only that
Qatar’s gas and oil exports are denominated in the US currency but also that the peg offers stability and
reassurance to investors. The peg to the US dollar has served Qatar well in periods of both high and low
oil prices by anchoring prices of tradables and providing stability to income flows and financial wealth,
as per the IMF.
Going forward, the disinflationary pressures from abroad will dissipate and headline inflation is projected
to increase modestly, as per the IMF. Future real estate price developments are uncertain since real estate
prices may remain supported by the public investment program but will also face headwinds from the
large loss of hydrocarbon wealth and related uncertainties.
1.4.2. Banking Activity
Healthy private sector deposit and lending growth coupled with robust financial soundness
Qatar’s banking sector registered yet another year of solid private sector activity growth in 2014 and so
far this year. This reflects a still healthy economic growth momentum across the country and ensuing
liquidity at hand and new financing opportunities for Qatari lenders throughout 2014, and the impact of
EVOLUTION OF MONETARY SITUATION
Sources: Central Bank of Qatar, Bank Audi’s Group Research Department
EXCHANGE MARKET INDICATORS
Sources: Central Bank of Qatar, Bank Audi’s Group Research Department

12June 08, 2015
ECONOMICS
QATAR
JUNE 10, 2015
dwindling hydrocarbons prices on the large public sector and its deposits and credit demand in the first
few months of 2015. Measured by total assets of banks operating in Qatar, total sector activity reported a
10.4% growth before registering a tiny one in this year’s first four months (+0.4%, due to lower inter-bank
funding/placements), reaching a total of US$ 277.2 billion at end-April 2015.
Activity growth in Qatar is to a good extent driven by customer deposits, which account for around 61%
of total balance sheets. Sector-wide funding in Qatar benefits from an adequate core customer deposit
base, which is mostly domestic. As a matter of fact, resident deposits account for close to 89% of the total
deposit base nowadays in Qatar. Total deposits rose by 9.6% last year, and by a further 3.1% in this year’s
first four months to reach US$ 170.3 billion at end-April 2015.
The rise in deposits during 2014 is mostly attributed to resident private sector deposits in local and foreign
currencies, in addition to non-resident deposits. In contrast, public sector deposits slightly contracted on
the overall, within the context of lower hydrocarbons prices as the year neared to an end. The same trend
continued so far this year, noting that the public sector deposit contraction accentuated, especially at the
level of time and saving foreign currency deposits.
It seems that the authorities have been drawing down on their deposits to settle debt service payments
and State obligations, all within the context of lower hydrocarbons prices impacting the accumulation of
funds parked at Qatari banks. Last year, it was only the government sector that was responsible for the
slight contraction in deposits, but this year, the other components, i.e. the government institutions and
semi-government institutions, followed suit.
EVOLUTION OF BANKING ACTIVITY
Sources: Central Bank of Qatar, Bank Audi’s Group Research Department
BANKING SECTOR ASSET COMPOSITION
Sources: Central Bank of Qatar, Bank Audi’s Group Research Department
13June 08, 2015
ECONOMICS
QATAR
JUNE 10, 2015
In parallel, and with the aim of lengthening the duration of liabilities as part of Basle III requirements,
banks are also resorting to the issuance of long-term bonds to alleviate the structural asset-liability
duration mismatch due to the maturity gap between usually short-term deposit funding and long-term
project financing.
Higher liquidity at hand and a healthy economic momentum have translated into accrued lending activity
for banks operating in Qatar. As a matter of fact, total credit facilities grew by 13.0% in 2014 and by a
further 2.9% in the first four months of 2015 to reach US$ 183.9 billion at end-April 2015.
But a look at the detailed breakdown of those facilities reveals that similarly to developments on the
funding side, lending activity to the public sector contracted both in 2014 and during the first four
months of this year. This trend has started towards the last few months of 2014 and practically coincided
with the start of the fall in hydrocarbons prices globally, and comes within the context of greater scrutiny
of public sector borrowing by Qatari authorities which are also focusing on increasing prudence in debt
management.
The surge in credit facilities to the private sector last year and so far this year is mostly attributed to
the retail, general trade, services, and real estate and contracting sectors, which have contributed to the
increased financial intermediation activity on behalf of banks operating in the country and to fuelling
the non-hydrocarbons sector activity. Non-resident credit facilities also picked up some pace, accounting
for around 29% of total credit facilities growth in 2014 and 49% of the increase registered so far this year.
Their share out of total credit facilities outstanding has grown, but remains rather narrow at barely 11%
of the total at end-April 2015.
Even though lending activity has been growing more or less faster than deposits throughout most of the
covered period, liquidity buffers in the sector remain quite adequate, though seemingly slightly less so
over the covered period, as private sector lending grew noticeably and bank placements declined. On the
one hand, the credit facilities to deposits ratio reached 108.0% at end-April 2015, almost the same level as
in 2014 and only slightly increasing from 104.9% at end-2013. Furthermore, the Central Bank announced
during 2014 a cap of 100% on the loan-to-deposit ratio, with banks exceeding the limit required to reduce
it over a period of three years or face a penalty.
On the other hand, banks’ core readily available liquidity, consisting of reserves and placements at banks,
reached 23.1% of total deposits at end-April 2015. While this ratio slightly declined this year due to a
contraction in placements at banks abroad and domestically, it still remains sufficient to provide banks
with a rather comfortable liquidity cushion should liquidity pressures arise.
Along the same lines, banks operating in Qatar maintain remarkably good asset quality ratios. Only 1.7%
of total loans were classified by the sector regulator as non-performing ones at end-2014 as per the latest
available figures, down from 1.9% at the end of the previous year, although it is worth noting that this
also reflects non-negligible risk-free government-related lending and healthy growth in total loans (i.e.
INTEREST RATES ON TERM DEPOSITS & CREDIT FACILITIES
Sources: Central Bank of Qatar, Bank Audi’s Group Research Department
CREDIT FACILITIES BY ECONOMIC ACTIVITY*
Sources: Central Bank of Qatar, Bank Audi’s Group Research Department
14June 08, 2015
ECONOMICS
QATAR
JUNE 10, 2015
the ratio’s denominator). Provisioning was further bolstered, with the loan provisions to non-performing
loans ratio reaching 99.1% at year-end 2014.
Banks in Qatar also boast strong capitalization metrics. Banks are currently operating according to Basle
III regulations, and major players reinforced their capitalization through hybrid issuances. The Basle III
regulations, effective as of early 2014, introduced a minimum capital adequacy ratio of 12.5% (including
a capital conservation buffer) and a new capital charge from 2016 for systemically important institutions.
The regulatory capital to risk weighted assets ratio stood at a solid 16.3% at year-end 2014 as per the
most recent IMF disclosures, bearing in mind that most of the regulatory capital consists of Tier 1 capital.
Last but not least, despite the relatively low interest rate environment and ensuing rather tight margins,
the healthy quantity-effect driven by higher lending activity amid a solid economic momentum helped
banks operating in Qatar maintain one of the highest profitability ratios in the region. Central Bank
statistics indeed show that the sector-wide return on average assets ratio stood at 2.1% last year, and that
the return on average shareholders’ equity ratio reached 16.5% in 2014, both sticking to their previous
year’s levels and mirroring the increase in banks’ bottom lines accompanying continued growth in activity
and capitalization.
1.4.3. Equity and Bond Markets
Mixed price movements in capital markets
Qatar’s capital markets saw mixed price movements over the first five months of 2015. The equity market
registered price declines following the strong price rally observed over the past couple of years, with
Qatari stocks posting the highest earnings multiple in the MENA region by year-end 2014. On the other
hand, the fixed income market in Qatar witnessed mostly upward price movements, given the ample
liquidity in the market and in the absence of new bond issues over the first five months of 2015.
In details, the Qatar Exchange general index declined by 1.9% during the first five months of 2015 to close
at 12,048.26 at end-May 2015, mainly driven by some profit-taking operations after a strong price rally
(+18.4%) observed over the year 2014, and given relatively less attractive market pricing ratios as Qatari
stocks traded at a P/E of 15.45x at end-2014 as compared to an average P/E of 12.95x in the MENA region.
Also, sustained low oil prices and news of high profile arrests and corruption probes at FIFA’s governing
body on suspicion of mismanagement and money laundering related to the award of rights to host the
2022 soccer World Cup in Qatar, triggered further price declines in the stock market. Price falls occurred
despite the addition of two stocks (Ezdan Holding and Qatar Insurance) to the MSCI Qatar index in May
2015.
Within this context, it is worth highlighting that many drivers were behind the price rally in 2014: first,
Qatar raised the foreign ownership limit on the Qatari bourse to 49% at end-May 2014; second, MSCI
upgraded Qatar from “frontier market” status to “emerging market” status on June 2, 2014; third, MSCI
increased in August 2014 the weightings of three Qatari companies (QNB, Industries Qatar and Qatar
Islamic Bank) in its emerging market index; fourth, MSCI removed at end-November 2014 the adjustment
factor for four stocks in its Emerging Markets index, and added Gulf International Services to the index.
On the backdrop of price declines over the first five months of 2015, the Qatar Exchange traded at end-
May 2015 at a P/E of 13.24x as compared to 15.45x at end-2014. Also, it traded at a P/BV of 2.01x against
2.05x at end-2014. In addition, the Qatar Exchange registered at end-May 2015 a dividend yield of 4.21%
against 3.72% at end-2014.
The market capitalization decreased by 5.1% during the first five months of 2015, moving down from
US$ 185.9 billion at end-2014 to US$ 176.5 billion at end-May 2015. This came within the context of price
declines and stability in the number of listed companies at 43 companies. The market capitalization as a
percentage of GDP moved consequently down from 88.5% in 2014 to 86.3% at end-May 2015.
The total trading value amounted to US$ 14.5 billion during the first five months of 2015, dropping by
43.2% relative to the corresponding period of the previous year. On the backdrop of a higher decline in

15June 08, 2015
ECONOMICS
QATAR
JUNE 10, 2015
the total trading value than market capitalization, the annualized turnover ratio reached 19.7% during
the first five months of 2015, down from 30.2% during the corresponding period of 2014.
At the level of the fixed income market, sovereign papers, high grade names and papers issued by financial
institutions saw mostly upward price movements across the board during the first five months of 2015
within the context of ample liquidity at hand and in the absence of new issues, while also tracking rises in
US Treasuries after the US Federal Reserve announced that “it will be appropriate to raise the target range
for the federal funds rate when it has seen further improvement in the labor market and is reasonably
confident that inflation will move back to its 2% objective over the medium term”.
In details, sovereign papers maturing between 2020 and 2042 registered price rises between 0.88 pt and
7.00 pts over the first five months of 2015, with the highest price increases seen on the longer-end of
the curve. Amongst quasi-sovereigns, Qatari Diar’20 was up by 1.75 pt. Prices of Qtel papers maturing
between 2021 and 2043 rose by up to 3.00 pts. Also, financials like QNB and CBQ registered price increases
between 0.19 pt and 2.88 pts. Within this context, sovereigns, quasi-sovereigns and financials witnessed
year-to-date z-spread contractions across the board between 6 bps and 133 bps.
Qatar’s five-year CDS spreads stood at 68 basis points at end-May 2015, down by 14 basis points since
year-end 2014, following a 23 bps expansion in 2014, which underlines its low risk of default, noting that
the Qatar CDS spreads are the third lowest in the region after Saudi Arabia (63 bps) and Abu Dhabi (60
bps), and are much below the average CDS spreads in the Middle East (213 bps) and emerging markets
(486 bps).
Regarding credit ratings, Standard & Poor’s affirmed in March 2015 the “AA” long-term and “A-1+” short
term foreign and local currency sovereign credit ratings on the State of Qatar. The outlook is “stable”. In
2013-2014, Qatar’s oil and gas sector expanded by about 2%, and the non-oil sector by 12%, resulting
in average annual real GDP growth of about 6%, as per S&P. The rating agency projects slower real GDP
growth of about 4% during 2015-2018 because the hydrocarbon sector would likely continue to stagnate.
The non-oil sector, on the other hand, would remain buoyant, due to public investment and supported
by the growing population. The “stable” outlook reflects S&P’s view that Qatar’s high economic wealth
levels and strong external and fiscal positions would balance its institutional shortcomings and limited
monetary flexibility over the next two years.
Going forward, the development of an active debt market in Qatar would have far-reaching benefits in
deepening the financial infrastructure in Qatar. It would help to attract institutional investors to the State,
and provide an important incentive for local investors to better manage their asset allocation process
and therefore retain capital in the country. A well-developed debt market would also allow companies
to diversify their sources of funding and reduce the cost of borrowing. A deep and liquid government
securities market facilitates monetary policy transmission, finances infrastructure projects and promotes
financial market development. In the absence of any fiscal imperative for a government to mobilize
resources, regular issuance of government debt is nonetheless necessary to support the development
of the debt market. The lengthening of the maturity profile of debt issuance will also encourage the
emergence of a risk-free yield curve across the term structure, while the risk-free benchmark rate helps in
turn in the pricing of other financial instruments.
CAPITAL MARKETS INDICATORS
Sources: Qatar Exchange, IMF, Bank Audi’s Group Research Department
CAPITAL MARKETS PERFORMANCE
Sources: Qatar Exchange, Bank Audi’s Group Research Department

16June 08, 2015
ECONOMICS
QATAR
JUNE 10, 2015
2. CONCLUSION
Qatar is undoubtedly in a relatively good position to weather the recent fall in energy prices. The impact
of lower oil prices in Qatar is mitigated by the primacy of LNG production in the hydrocarbon sector. While
it is true that LNG prices are correlated to oil prices with a certain lag, production and sales volumes are
assured by long term offtaker contracts.
In addition, there are important foreign reserves and QIA assets of above US$ 300 billion to cover deficits
whenever needed. Although the precise scale of the country’s net international investment position is not
known reflecting limitations in the coverage and quality of official statistics, the undeniably large external
assets should allow the ambitious capital projects to continue, although a growing focus on prudence
and prioritization is necessary. Under a downside scenario of a prolonged period of low energy prices that
would impact natural gas prices eroding the government’s fiscal position, Qatar’s prudent budgeting and
a relatively low debt burden somewhat mitigate these risks.
Having said that, the oil price collapse is set to have adverse spillover on growth as lower hydrocarbons
export prices would have adverse effects on government revenue, which would somehow curb
government spending at large. The annual IMF Article IV assessment of the Qatari economy issued in
April 2015 cut the medium-term growth outlook to a range of 4%-5% against a range of 6%-7% made
in June 2014. The relatively lower growth will be driven by the falls in oil-related activity in the wake of
the sharp fall in global oil prices. The significant change is likely to provide the government with further
incentives to diversify the economy away from the hydrocarbon sector through further improvements in
the business environment, higher education quality and labor market reforms.
It is worth mentioning that Football’s World governing body, FIFA, released a report in November 2014
that cleared Qatar of corruption allegations. Still, dawn raids by US and Swiss authorities on FIFA’s annual
congress in Zurich, where officials recently converged for a presidential vote, herald a period of uncertainty
regarding the prospects of the 2022 World Cup. While it is more likely that games will go ahead as planned
for the 2022 event, the risk of Qatar being stripped of the event is also not trivial especially within the
context of recent crisis at FIFA.
An analysis of strengths and weaknesses are necessary for the assessment of Qatar’s short to medium
term outlook. At the level of strengths, we mention the significantly high level of wealth with GDP per
capita at the World’s highest level of over US$ 100,000, the vast hydrocarbon reserves, the sustained
macroeconomic stability, the low unemployment rate at less than 1%, the large net external creditor
position, the relatively low fiscal breakeven oil price and the continuing economic diversification away
from the hydrocarbon sector offsetting the growing weakness in the contribution to GDP growth of the
oil and gas sector.
At the level of weaknesses, we mention the vulnerability to regional geopolitical turmoil, the relatively
weak institutional transparency, the growth in government spending which could erode fiscal flexibility,
the continuing slowdown in crude oil output, the relatively elevated inflation volatility and the possible
spillovers of the current FIFA crisis on the 2022 World Cup prospects. But we believe that on the back
of significant economic strength, institutional strength and fiscal strength along with a moderate
susceptibility to event risks, Qatar’s strengths outpace weaknesses and opportunities outweigh threats,
suggesting a favorable outlook to Qatar’s economic prospects.
To appropriately build on its strengths, Qatar has a number of challenges to face looking ahead. The current
environment actually calls for the intensification of diversification efforts and some fiscal consolidation
in the medium term. In its last Article IV mission report, the IMF praises the ongoing budget reform
efforts, though such efforts need to be deepened further with a growing need for a clear medium-term
fiscal framework. There is also scope for further upgrading the business environment, further stimulating
private sector activity through fostering privatization and introducing labor market reforms for ensuring
inclusive growth at large.

17June 08, 2015
ECONOMICS
QATAR
JUNE 10, 2015
DISCLAIMER
The content of this publication is provided as general information only and should not be taken as an
advice to invest or engage in any form of financial or commercial activity. Any action that you may take
as a result of information in this publication remains your sole responsibility. None of the materials herein
constitute offers or solicitations to purchase or sell securities, your investment decisions should not
be made based upon the information herein. Although Bank Audi Sal considers the content of this
publication reliable, it shall have no liability for its content and makes no warranty, representation or
guarantee as to its accuracy or completeness.
Bank Audi sal - Group Research Department - Bank Audi Plaza - Bab Idriss - PO Box 11-2560 - Lebanon - Tel: 961 1 994 000 - email: [email protected]