qatar university college of engineering simulation of
TRANSCRIPT

QATAR UNIVERSITY
COLLEGE OF ENGINEERING
SIMULATION OF SULFUR RECOVERY PROCESS AND
OPTIMIZATION OF THE MAIN OPERATIONAL PARAMETERS
BY
FADI MOHAMED
A Project Submitted to the Faculty of
the College of Engineering
in Partial Fulfillment
of the Requirements
for the Degree of
Master of Engineering Management
June 2016
© 2016 Fadi Mohamed. All Rights Reserved.

ii
COMMITTEE PAGE
The members of the Committee approve the master project of Fadi Mohamed defended
on 5th of June, 2016
(Dr. Essa Al-Musleh)
Project Supervisor
(Dr. Farid Benyahia)
Committee Member
(Dr. Mert Atilhan)
Committee Member

iii
ABSTRACT
Strict environmental regulations has pushed sulfur emissions from natural gas and crude
oil refining plants to very low levels. The current and most widely used method for
reducing those emissions is the Claus sulfur recovery process, which is not sufficient to
satisfy stringent air pollution requirement as the typical standards limit sulfur emission
from sulfur recovery plants to 250 ppm.
Hydrogen sulfide, which is a byproduct of natural gas and crude oil processing plants, is
very poisonous gas and its presence requires great deal of attention in order to meet
environmental regulations and pipeline specifications. The most widely used method to
treat the acid gas is by absorbing it by amine solvent in an amine sweetening unit
followed by sulfur recovery unit. This is essentially recover up to 98 percent sulfur from
the acid gas feed. However, with more strict regulations additional processes are required
to treat the tail gas by the addition of tail gas treatment unit. The overall sulfur recovery
from the integrated Claus sulfur recovery and tail gas treatment units is in the excess of
99.9 percent.
ProMax process simulation software was used to model the integrated sulfur recovery
process and tail gas treatment unit. The model was then compared and validated against
industrial data and a close match was found. Several operating parameters and conditions
was then investigated and optimized in order to determine their sensitivity on the
performance of the system. Those parameters include but not limited to factors such as
the ratio of H2S/SO2 in the tail gas, CO2 slippage, steam stripping ratio, and Claus
converters temperature.

iv
The addition of SCOT process raised the sulfur recovery efficiency to 99.93% with some
modification to operational parameters that have the most influence on the process. The
output of the project is to provide a platform for effectively managing the operations of
the sulfur recovery process in terms of improving sulfur recovery while minimizing
energy and operating cost in order to meet sulfur emission regulations.

v
TABLE OF CONTENTS
LIST OF TABLES ............................................................................................................ vii
LIST OF FIGURES ......................................................................................................... viii
LIST OF ABBREVIATIONS ............................................................................................ ix
ACKNOWLEDGEMENT .................................................................................................. x
Chapter 1 Introduction ........................................................................................................ 1
1.1 Hydrogen Sulfide ...................................................................................................... 2
1.2 Sulfur......................................................................................................................... 3
1.3 Process Improvement ................................................................................................ 3
Chapter 2 Literature Review and Methodology.................................................................. 5
Chapter 3 Available Technologies ...................................................................................... 7
3.1 Claus Technology ..................................................................................................... 7
3.2 Tail Gas Conditioning ............................................................................................. 10
3.2.1 Cold Bed Adsorption Process ....................................................................... 11
3.2.2 Shell Claus Offgas Treating Process............................................................. 11
Chapter 4 Process Modelling and Simulation ................................................................... 13
4.1 Comparison and Validation of the Model ............................................................... 14
4.2 Addition of SCOT Process...................................................................................... 15
4.3 Base Case Operating Conditions ............................................................................ 17

vi
Chapter 5 Process Optimization........................................................................................ 19
5.1 Sulfur Recovery Unit Optimization ........................................................................ 19
5.1.1 Reaction Furnace .......................................................................................... 19
5.1.2 Claus Converters Optimization ..................................................................... 22
5.1.3 Claus Condensers Optimization .................................................................... 28
5.1.4 Energy Recovery for the Claus Process ........................................................ 29
5.2 Hydrogenation Unit Optimization .......................................................................... 30
5.3 Quench Unit Optimization ...................................................................................... 32
5.4 Amine Sweetening Unit Optimization .................................................................... 33
5.4.1 CO2 Slippage ................................................................................................. 36
5.4.2 Amine Circulation Rate ................................................................................ 38
5.4.3 Lean Amine Temperature ............................................................................. 40
5.4.4 Regeneration Parameters .............................................................................. 42
5.5 Incineration Unit Optimization ............................................................................... 44
5.6 Optimized Operating Conditions ............................................................................ 45
Chapter 6 Conclusion ........................................................................................................ 48
References ......................................................................................................................... 50

vii
LIST OF TABLES
Table 4.1 Acid gas feed specifications and Claus unit operating conditions .................... 13
Table 4.2 Comparison of actual data with the model prediction ...................................... 14
Table 4.3 Outlet waste gas compositions from Claus plant .............................................. 15
Table 4.4 Comparison of plant data with model prediction for SCOT rector outlet ........ 17
Table 4.5 Base case operating conditions ......................................................................... 18
Table 5.1 SRU acid gas feed specifications ...................................................................... 20
Table 5.2 Input tail gas condition to amine sweetening unit ............................................ 34
Table 5.3 Current base case operating data and conditions .............................................. 34
Table 5.4 Energy consumption comparison in amine sweetening unit ............................ 42
Table 5.5 Optimal operating condition for SRU and energy recovery ............................. 46

viii
LIST OF FIGURES
Figure 3.1 Three Claus beds sulfur recovery configuration ............................................... 8
Figure 5.1 SRU reaction furnace flowsheet ...................................................................... 20
Figure 5.2 Effect of tail gas ratio on sulfur recovery ........................................................ 21
Figure 5.3 Claus reaction stage flowsheet ........................................................................ 23
Figure 5.4 Effect of Claus bed outlet temperature on conversion .................................... 24
Figure 5.5 H2S conversion as a function of second Claus bed temperature ..................... 26
Figure 5.6 Sulfur production as a function of second Claus bed temperature .................. 27
Figure 5.7 Variation of second Claus bed temperature with reheat temperature .............. 28
Figure 5.8 Hydrogenation unit flowsheet ......................................................................... 31
Figure 5.9 Quench unit flowsheet ..................................................................................... 32
Figure 5.10 Amine sweetening unit flowsheet ................................................................. 35
Figure 5.11 CO2 slippage as a function of amine (wt%) at 170 (gpm) ............................. 37
Figure 5.12 CO2 slippage as a function of amine circulation rate at 20 (wt%) ................ 38
Figure 5.13 H2S concentration and energy requirement variations with the amine rate .. 39
Figure 5.14 Treated gas H2S content versus lean amine temperature ............................... 41
Figure 5.15 Steam stripping ratio effect on reboiler duty ................................................. 43
Figure 5.16 Incineration unit flowsheet ............................................................................ 44

ix
LIST OF ABBREVIATIONS
AG Acid gas
CO2 Carbon dioxide
COS Carbonyl sulfide
CS2 Carbon disulfide
EPA Environmental protection agency
gpm Gallon per minutes
H2S Hydrogen sulfide
MDEA Methyl diethanolamine
ppm Parts per million
RF Reaction furnace
SCOT Shell Claus offgas treating
SRU Sulfur recover unit
TGTU Tail gas treatment unit
TRS Total Reduced Sulfur
WHB Waste heat boiler

x
ACKNOWLEDGEMENT
I would like to place on record my deep sense of gratitude to Dr. Essa Al-Musleh, for his
constant supervision, advice, and generous guidance throughout the course duration as
well as for providing necessary information regarding the project.
We have taken all efforts and responsibilities to make this project a success story since
day one. Nevertheless, it would not have been without each member’s dedication and
determination.

1
Chapter 1 Introduction
Long time ago, the production of sulfur was thought of as producing a low value
byproduct. However today, emitting sulfur dioxide in the atmosphere is not questionable
and must be controlled. Pollution reduction is now equally important as making profit.
Natural gas and crude oil reserves contain sulfur components, which must be treated and
removed before further processing. Strict regulations and requirements for sulfur
recovery are now in the excess of 99.9% in many countries and industries [1]. The
traditional method for treating hydrogen sulfide is by amine sweetening unit, which
absorbs H2S from the gas stream and sends it to the Claus plant. In the Claus sulfur
recovery plant, H2S is converted to elemental sulfur and the residual unreacted H2S is
burned and incinerated. H2S is unstable in the presence of SO2 or O2 and easily converted
to elemental sulfur [2]. Recovery of 85% could be achieved in one stage Claus reactor, up
to 95% could be achieved in two stages Claus plants, and up to 98% is achievable in three
stages Claus plants [1].
With more emphasis on achieving higher recovery in the sulfur plants, the addition of tail
gas treatment unit is often needed. Most countries now demand sulfur recovery efficiency
in the range of 99% to 99.9% [2]. The tail gas is the outlet stream of the conventional
Claus plant, which must be further treated to reduce sulfur content before being
incinerated. This involves passing the tail gas to a catalytic process to convert sulfur
components back to H2S. Then, passes this stream to a low pressure amine sweetening
unit, which selectively absorbs H2S and recycles it back to the front of the Claus plant.

2
The overall recovery from this process could possibly reached +99.9% if the integrated
units are fully optimized [1].
Sulfur recovery units is not meant to generate profit for plants operators, however, it’s a
crucial processing step as releasing of sulfur compounds is strictly prohibited.
Consequently, the main concern for oil and gas operators is to maximize the recovery and
production of sulfur at minimum cost. This means debottleneck the process and find the
most suitable operating conditions that improve the performance [3].
1.1 Hydrogen Sulfide
Hydrogen sulfide is a chemical compound that is found naturally in natural gas and crude
oil and has a chemical formula of H2S. It is a colorless gas with rotten egg odor,
extremely poisonous, flammable, explosive and very corrosive. When H2S is present in a
gas stream, the gas is called acid or sour gas. Of course, other species such as CO2 and
mercaptans may also be present and contribute to its acidity. However, here acid gas
stream refers to a gas stream with H2S content.
There are many reasons that dictate the removal and treatment of H2S from process
stream. This is due to it being very poisonous and flammable. It is heavier than air and
will settle down in the proximity of the leaking area. Though it has a pungent smell,
nevertheless, it quickly damages the nasal functions and the victim will be left
unconscious and eventually die [4]. Moreover, due to its corrosiveness, its presence in the
process pipelines leads to many problems such as corrosion of equipment and pipelines

3
as well as catalysts deactivation [1]. The product of burning H2S is sulfur dioxide (SO2),
which is also regulated by environmental standards due to its contribution to the acid rain
and potential risk to people’s health [5].
1.2 Sulfur
Though Sulfur as a product does not have a profitable value, producing it is mandatory
for controlling air pollution and complying with environment. It has a low marketable
price. However, great deal of attention in research is progressing in order to develop
useful applications to benefit from its wide availability in the market and enhance its
value. Sulfur usefulness comes from its wide range of applications and end-uses. Its
prevalent application is for fertilizers manufacturing. Rubber industries also uses sulfur in
the rubber vulcanization processes. Other users of sulfur include pharmaceuticals,
cosmetics, and cement as well as chemical preparations such as sulfuric acid and
explosives [6].
1.3 Process Improvement
Engineers around the world are constantly looking for ways to enhance existing processes
and systems, performing regular analysis to test the operational efficiency and process
requirement, as well as recommending the proper modification plans and design changes
that improve the process performance.
The main goal of process simulation is process optimization. The simulation models
facilitate in finding process bottlenecks and underperforming equipment as well as

4
defining the steps needed to optimize process performance. Process simulation models
help in understanding the capabilities and limitations of the new design as well as the
optimum operating conditions. They also help in predicting process behavior and
response for given changes in process conditions [3].
The primary focus of the project will be to optimize the sulfur recovery process and find
the optimum operational parameters that enhance the performance while minimizing the
cost and processing difficulties.
ProMax [7] software will be used for process modelling and simulation along with
sensitivity analysis tools, excel spreadsheets and literature. ProMax is a powerful process
simulation software and is being used by engineers around the globe for the past 30 years.
The software offers very helpful tools to design and optimize gas, refining, and chemical
processes [8].

5
Chapter 2 Literature Review and Methodology
Sulfur recovery process is a well-known and well-established process with a history of
many decades. A literature review was conducted to obtain a general overview of the
process and the current situation in the industry. The process flowsheets and components
are readily available in literature (i.e., refer to [2] [9] [1]).
The key motivation for this project was to study the sulfur recovery process and to
optimize the operational parameters and variables in order to maximize the sulfur
recovery efficiency. Having this in mind and with the aid of the ProMax process
simulator, several scenarios and cases can be conducted and evaluated.
Research methodology consists of reviewing the Claus sulfur recovery process with tail
gas treatment and studying the various effects that affect the performance. In order to
study the performance of the process, a typical industrial Claus unit is studied. The
process flowsheet and data for the sulfur recovery process is taken from [2] and will be
considered as the base case or benchmark for the project. Simulation of the base case
flowsheet will be carried out by the commercial ProMax process simulation software.
The software will be used to get a preliminary model by matching the data for the sulfur
recovery unit and the results will then be compared. The model will then be modified to
include the tail gas clean up unit and to investigate how improvement could be made.
ProMax software was selected due to its exceptional capabilities in modelling sulfur
recovery and gas sweetening processes.

6
Sensitivity analysis provides the most effective method to examine the performance of
chemical processing plants with respect to changes in process conditions. Scenario tools
and parametric studies will be implemented in ProMax software and excel spreadsheets
and then, the results will be discussed and evaluated. The ultimate goal of process
simulation is process optimization. The output of this study is an optimized integrated
process for sulfur recovery.

7
Chapter 3 Available Technologies
Numerous alternatives are available when attempting to design and select the primary
sulfur recovery unit configuration for processing rich acid gas that contains H2S and CO2.
The selection is based on many factors such as the acid gas content in the feed gas and
the degree of sulfur removal required.
H2S concentration in the feed gas varies and depends on the upstream process used to
sweeten the acid gas, where the most used method is absorption by amine solvents. For
small quantities of H2S in the sour gas, scavengers and direct oxidization are usually used
[10]. For large concentration of H2S and relatively high quantity, Claus process is the
most widely selected method for sulfur recovery and it is the most well-established [2].
3.1 Claus Technology
The Claus process is the best-known sulfur production process in industry, which is the
modification for the first process used in 1883. It is applicable for acid gas containing
from about 20-100% H2S [2].
Carl Friedrich Claus, an English scientist, who first invented the Claus process in 1883
[9]. He mixed oxygen with the hydrogen sulfide and passed the products into a catalyst
bed. The resulting products were water and elemental sulfur. The reaction in the gas
phase is exothermic and releases a considerable amount of heat and due to this nature,
only small quantity of H2S was processed without overheating the reactor. Improvement
was made in 1938 by a German company, by adding free flame oxidization step before

8
the reactor to prevent the catalyst bed from overheating and to increase sulfur conversion.
This improvement has greatly enhanced the efficiency of the sulfur recovery and formed
the basis for the majority of sulfur recovery units found today in the industry.
Figure 3.1 Three Claus beds sulfur recovery configuration
Figure 3.1 (above) shows a typical configuration for the straight-through three bed Claus
unit [11].It consists of a thermal stage where part of the H2S is converted to SO2 in the
reaction furnace according to the following reaction:
H2S + 1½ O2 ↔ SO2 + H2O (1)

9
The above reaction is exothermic and occurs in the gas phase during which one third of
H2S is burnt with the stoichiometric quantity of air. The remaining H2S in the feed gas is
reacted with the SO2 produced in the furnace to form elemental sulfur in the subsequent
catalytic reactors stage according to the following reaction:
2H2S + SO2 ↔ 3S + 2H2O (2)
This reaction above is thermodynamically limited and, therefore, two or more catalytic
converters are usually needed for high conversion [10]. It is important to note that part of
this reaction also happens in the reaction furnace. The above two reactions are the main
reactions that happen in the SRU or Claus unit, as the acid gas feed usually contain other
components such as hydrocarbons, carbon dioxide, ammonia, and mercaptans, so that the
actual reactions set is usually very complex [11]. Combining equation (1) and (2), the
overall Claus reaction can be written as:
2H2S + O2 ↔ 2S + 2H2O (3)
The combustion products from the reaction furnace, usually at 1000 oC to over 1400 oC
depending on the acid gas composition [12], pass in the waste heat boiler to cool the
gaseous products and produce medium to high pressure steam. The gas mixture then goes
to the first sulfur condenser, where it is further cooled and the sulfur will be condensed
and separated, which is then flows by gravity to the sulfur collection pit.
The outlet stream from the sulfur condenser enters a heat exchanger where the
temperature is raised to prevent sulfur from condensing in the subsequent catalyst beds.

10
In the catalytic reactor, H2S and SO2 will again react and produce sulfur vapor, which
will then flows to the second sulfur condenser and separates from the tail gas as liquid
sulfur.
Subsequent two heating, catalytic reactions, and cooling steps will be followed so that
most of the H2S is converted to elemental sulfur. The outlet tail gas from this Claus unit
is sent to the tail gas treatment unit to convert most of the unreacted sulfur components to
H2S and recycle it back to the front of the SRU.
3.2 Tail Gas Conditioning
A standalone Claus sulfur recovery unit cannot attain the minimum requirement of the
global environmental protection rules for sulfur emission. Hence, further cleaning process
for the tail gas outlet stream from the SRU is often required [9]. Current environmental
regulations limit total sulfur emission to 250 ppm from all new and existing sulfur
recovery process [13].
The primary function of tail gas treatment unit is to increase sulfur conversion and
consequently minimize the amount of sulfur-based constituents discharged to the
atmosphere. Many variations and alternatives are available for this purpose such as the
Cold Bed Adsorption (CBA) process and the Shell Claus Offgas Treating (SCOT)
process [2].

11
3.2.1 Cold Bed Adsorption Process
Because Claus reaction is thermodynamically limited, adding one or more Claus reactors
will not increase the efficiency of sulfur recovery unit beyond the maximum achievable
recovery [9]. CBA process can achieve higher recoveries by operating the Claus reactors
in the sulfur sub-dew point region. This greatly enhances the conversion of H2S to sulfur
as the reaction favors the low temperature operation and this will shift the equilibrium to
the right towards more sulfur products.
In this facility, at least two CBA reactors are used. One is used for low temperature Claus
reaction with sulfur adsorption on the catalyst, while the other is to be regenerated and
cooled [2]. Accordingly, sulfur product is adsorbed on the catalyst, and this reduces its
partial pressure in the vapor and allow additional H2S and SO2 to react and produce
sulfur. The condensed sulfur in the reactor would eventually occupy all the active sites of
the catalyst, and the catalyst would have to be regenerated.
3.2.2 Shell Claus Offgas Treating Process
The Shell Claus Offgas Treating (SCOT) process was developed by Shell Dutch
Company. It is the most widely used tail gas treatment process in the industry with over
100 plants currently in operation [2]. The process is reliable as long as the upstream SRU
is operated with the proper conditions. However, it is sensitive to changes in Claus tail
gas composition.

12
The SCOT process includes four sections [10]:
1) Tail gas reduction section, where the tail gas is mixed with reducing gases
(hydrogen and carbon monoxide) over a catalyst bed to convert and reduce all
sulfur component to H2S.
2) Conditioning section, where the outlet hot gas from the reduction unit is cooled in
a waste heat boiler and followed by a direct quench by cooling water.
3) Amine sweetening section, which consists of a typical contactor and regenerator
towers with selective amine solvent such as MDEA. The MDEA is more selective
towards H2S, which absorbs it and recycle it back to SRU.
4) Incineration section, where the waste gas from the top of the contactor is burned
and incinerated to the atmosphere.
The SCOT process gives superior design features and stability, which can nearly recover
almost all the unrecovered sulfur compounds produced in the Claus SRU.
13
Chapter 4 Process Modelling and Simulation
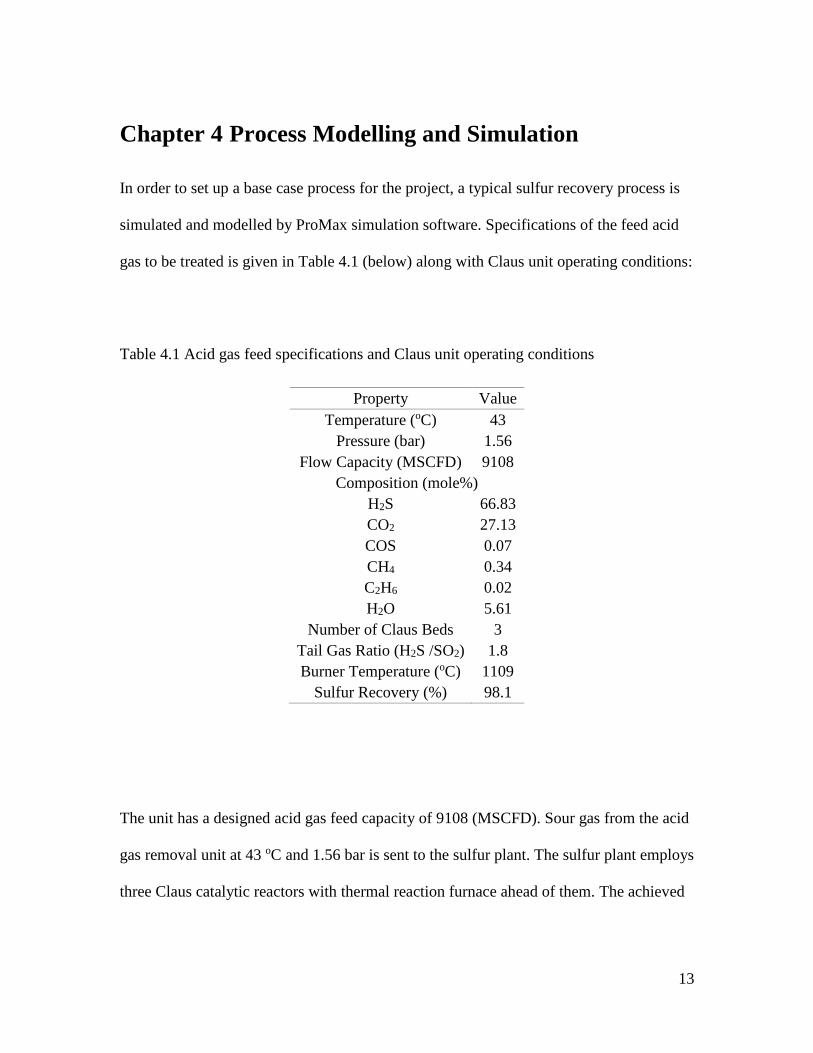
In order to set up a base case process for the project, a typical sulfur recovery process is
simulated and modelled by ProMax simulation software. Specifications of the feed acid
gas to be treated is given in Table 4.1 (below) along with Claus unit operating conditions:
Table 4.1 Acid gas feed specifications and Claus unit operating conditions
Property Value
Temperature (oC) 43
Pressure (bar) 1.56
Flow Capacity (MSCFD) 9108
Composition (mole%)
H2S 66.83
CO2 27.13
COS 0.07
CH4 0.34
C2H6 0.02
H2O 5.61
Number of Claus Beds 3
Tail Gas Ratio (H2S /SO2) 1.8
Burner Temperature (oC) 1109
Sulfur Recovery (%) 98.1
The unit has a designed acid gas feed capacity of 9108 (MSCFD). Sour gas from the acid
gas removal unit at 43 oC and 1.56 bar is sent to the sulfur plant. The sulfur plant employs
three Claus catalytic reactors with thermal reaction furnace ahead of them. The achieved
14
sulfur efficiency is 98.1% and the outlet tail gas stream is sent directly to the incinerator
to be burned and flared.
4.1 Comparison and Validation of the Model
To match the simulation with the base case data, the air flow rates fed to the reaction
furnace is manipulated to ensure that H2S to SO2 ratio in the tail gas is 1.8. Additionally,
the reported burner temperature was also manipulated to obtain a very close result.
Iteration was performed until reasonable and very close results were achieved in the
waste heat boiler effluent composition. A controller was set to ensure that the outlet
temperature of the first bed is set at 310 oC.
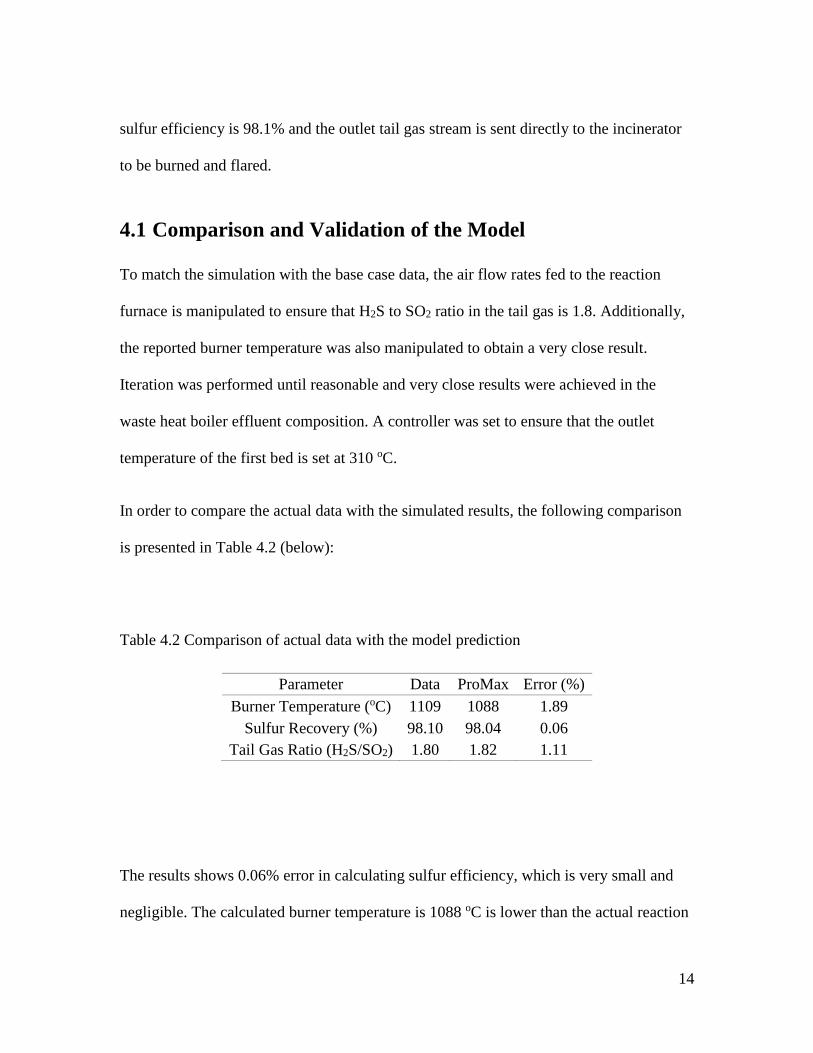
In order to compare the actual data with the simulated results, the following comparison
is presented in Table 4.2 (below):
Table 4.2 Comparison of actual data with the model prediction
Parameter Data ProMax Error (%)
Burner Temperature (oC) 1109 1088 1.89
Sulfur Recovery (%) 98.10 98.04 0.06
Tail Gas Ratio (H2S/SO2) 1.80 1.82 1.11
The results shows 0.06% error in calculating sulfur efficiency, which is very small and
negligible. The calculated burner temperature is 1088 oC is lower than the actual reaction

15
furnace temperature by 21 oC, which can be neglected as it resulted in small error of
1.89%. All compositions and flow rates showed good agreement with the original data.
Now that the model have successfully converged and matched the base case data,
alternatives now for improving the performance of the process are explored.
4.2 Addition of SCOT Process
As noted in the discussion above that the current sulfur recovery is around 98%, which is
not compatible with the current environmental regulations and allows for huge sulfur
dioxide emission to the atmosphere. Table 4.3 (below) shows the outlet waste gas
compositions after the last sulfur condenser and before being incinerated:
Table 4.3 Outlet waste gas compositions from Claus plant
Component Composition (mol%)
H2 1.67
Ar 0.64
N2 53.18
CO 0.61
CO2 11.81
H2S 0.30
COS 0.02
CS2 0.01
SO2 0.17
H2O 31.58
S 0.01

16
In the current plant operation, this stream is burned in the sulfur incinerator and this
corresponds to sulfur emission level of 4900 ppm. This is why a tail gas cleanup unit has
to be installed to treat this waste gas stream and reduce the total sulfur emission to below
250 ppm.
The current strict environmental regulations dictate higher amount of sulfur recovery
beyond the capability of the standalone sulfur recovery unit. This is because complete
conversion of hydrogen sulfide to elemental sulfur is constrained by the equilibrium
relationship of the Claus process chemical reaction [9]. Another limitation of the
conversion is the formation of carbonyl sulfide and sulfur dioxide in the thermal stage of
the Claus process due to the presence of carbon dioxide and light hydrocarbons in the
acid gas feed [9]. Those compound are stable and pass the Claus reactors unchanged,
thereby reducing the overall conversion and the basic Claus would not be able to satisfy
air pollution rules.
Thus to meet those requirement, the base case flowsheet is to be modified by the addition
of tail gas treatment unit after the fourth sulfur condenser in place of incinerator. The
modifications include the use of SCOT type [2] process for tail gas treatment. It involves
the use of a hydrogenation reactor to convert all sulfur based compound back to hydrogen
sulfide, followed by amine sweetening process to recycle back H2S to the Claus plant.
It is important to note all this modification is really expensive to install. However, as said
in the beginning, that complying with environment is a number one priority. SRU and
TGTU are not typically considered economical, in the sense that they do not directly

17
increase the net profit of plants. They are built for the purpose of controlling air pollution.
Thus, the aim of this project is to increase the recovery to reach the 99.9% target by
adding TGTU and to perform the full simulation of the integrated process. Therefore, the
model has to modified to represent the integrated sulfur recovery unit plus a tail gas
treatment unit. Then, the only concern would be to optimize the process and choose the
operating parameters that minimize operating cost and enhance the efficiency.
4.3 Base Case Operating Conditions
The developed model in the previous section has been validated only for the Claus
process. However, the addition of SCOT process has to be included in the base case
model. For this purpose, the model was modified and a comparison is given in Table 4.4
(below):
Table 4.4 Comparison of plant data with model prediction for SCOT rector outlet
Hydrogenation Reactor Effluent Actual Data Model Data
Temperature (oC) 369.8 370
Pressure (kPa) 144.5 144.6
Composition (mol%)
N2 40.237 40.322
H2S 0.846 0.832
H2 1.473 1.501
CO 0.141 0.142
CO2 35.400 35.041
H2O 21.901 22.091
COS Conversion (%) 40.0 41.4
18
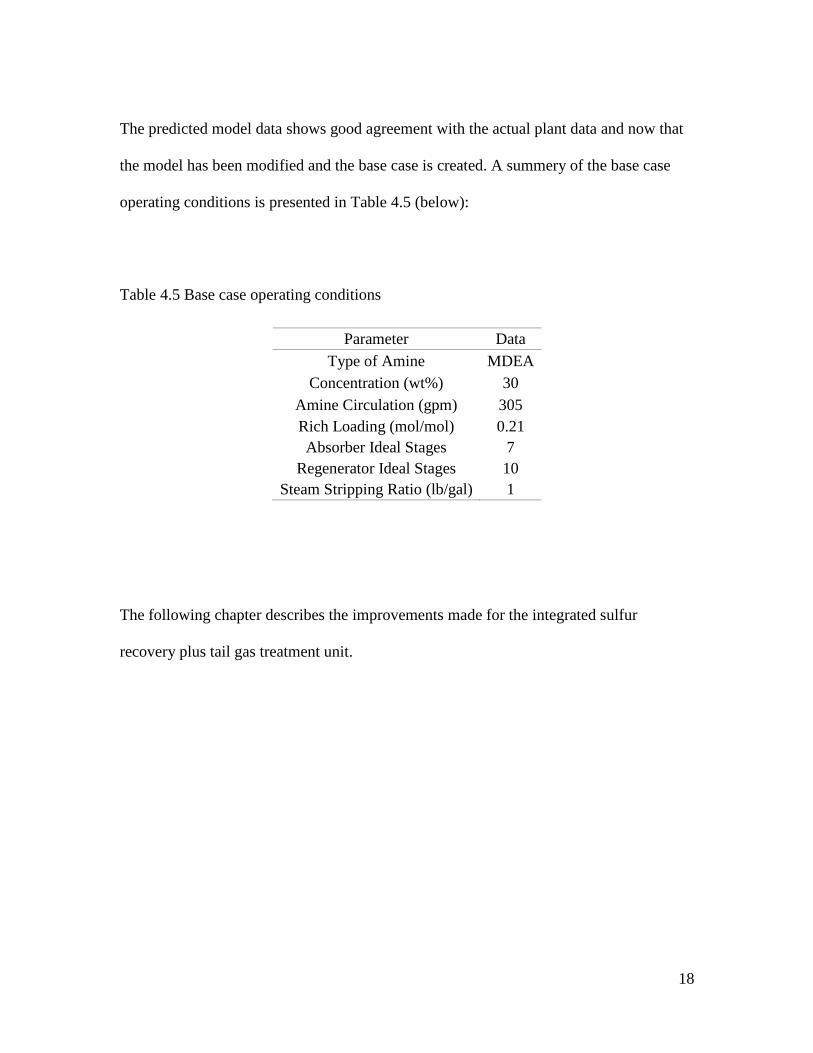
The predicted model data shows good agreement with the actual plant data and now that
the model has been modified and the base case is created. A summery of the base case
operating conditions is presented in Table 4.5 (below):
Table 4.5 Base case operating conditions
Parameter Data
Type of Amine MDEA
Concentration (wt%) 30
Amine Circulation (gpm) 305
Rich Loading (mol/mol) 0.21
Absorber Ideal Stages 7
Regenerator Ideal Stages 10
Steam Stripping Ratio (lb/gal) 1
The following chapter describes the improvements made for the integrated sulfur
recovery plus tail gas treatment unit.

19
Chapter 5 Process Optimization
Several problems encountered in the sulfur plants can be avoided by the use of process
simulation and sensitivity analysis. Developing an envelope of operating regions for
important process parameter is of great value for controlling the process and increasing
the production efficiency [3]. The process simulator (ProMax) will be used to investigate
the effects of various operating parameters on the performance of the sulfur recovery
process. A series of simulations will be performed to set the operating parameters in the
points that yield the highest recovery. In the following sections, a series of cases will be
conducted to set the operational parameters that enhance the sulfur recovery process.
5.1 Sulfur Recovery Unit Optimization
Significant amount of energy in the form of steam can be recovered from the sulfur
recovery unit, as well as the possibility of minimizing fuel consumption in the subsequent
tail gas cleanup unit if proper optimization methods have been implemented for the
integrated sulfur recovery and tail gas treatment process.
5.1.1 Reaction Furnace
The main function of the reaction furnace and waste heat boiler is to thermally oxidize
one third of hydrogen sulfide to form sulfur dioxide. The flowsheet of the reaction
furnace and the waste heat boiler is given in Figure 5.1 (below):

20
Figure 5.1 SRU reaction furnace flowsheet
Feed to the thermal furnace and SRU is coming from the acid gas removal unit with the
following conditions.
Table 5.1 SRU acid gas feed specifications
Property Value
Temperature (oC) 43
Pressure (bar) 1.56
Molar Flow (kmol/h) 454
Composition (mole%)
H2S 66.83
CO2 27.13
COS 0.07
CH4 0.34
C2H6 0.02
H2O 5.61

21
The second feed is the recycle stream from the tail gas treatment unit, where they are
mixed together along with the combustion air stream before entering the furnace. The gas
leaving the reaction furnace at around 1070 oC is cooled in the waste heat boiler by
generating steam. The gas passes through the tube side of the waste heat boiler and the
boiling water is maintained in the shell side of the boiler. Medium pressure steam (10 to
40 bar) is generated and the hot gas now is cooled to about 316 oC before sending it to
sulfur condenser to eliminate sulfur condensation in the boiler.
The primary control of this process is the inlet air flowrate. Air flow rate has to be
controlled in such a way to oxidize only one third of inlet hydrogen sulfide. According to
the Claus reaction as given in equation (2) in section (3.1), the ratio of H2S/SO2 is 2.
The importance of maintaining tail gas ratio at around 2 can be seen in Figure 5.2
(below):
Figure 5.2 Effect of tail gas ratio on sulfur recovery
97
97.3
97.6
97.9
98.2
98.5
90
190
290
390
490
590
690
0.4 0.8 1.2 1.6 2 2.4 2.8
Sulf
ur
Rec
ove
ry (
%)
Blo
wer
En
ergy
(kW
)
Tail Gas (H2S/SO2) Ratio
Blower Energy (kW)
Sulfur Recovery (%)

22
At around 2 for the H2S/SO2 molar ratio in the tail gas, the maximum sulfur recovery
could be obtained. This is because there is always a guarantee that all Claus reactors
inlets enough reactants (H2S and SO2) for the reaction to proceed and produce sulfur.
Moreover, at this ratio, the air flow rate is optimized and consequently the energy needed
in air blowers are less compared to the base case ratio of 1.82 as shown in Figure 5.2
(above). Therefore, for better operating conditions, the flowrate of air has to be calculated
to ensure that the ratio of tail gas H2S/SO2 is maintained at around 2 for the whole
process.
ProMax solver was used to perform this iterative simulation and the air flowrate was
determined to be 680 kmol/h and the power for driving the air blower was found to be
346 kW. This represents a 22.9% reduction in energy requirement from the base case.
The resulted sulfur conversion has increased by 0.96%. Though may not seem
significant, but it has huge impact when considering the overall emission reduction
obtained due to this tiny increase in sulfur recovery.
5.1.2 Claus Converters Optimization
Waste heat boiler outlet product at 316 oC, stream 5 in Figure 5.3 (below), enters the first
sulfur condenser to remove liquid sulfur formed in the reaction furnace. The outlet gas
stream 6 flows to the first reheat exchanger in order to heat the gas to the required
conversion temperature needed in the first Claus converter. Low pressure steam is
generated in sulfur condensers. This process is repeated in a number of cooling, heating,
and reaction stages until the tail gas exits last condenser number 4. The tail gas stream is

23
now routed to the tail gas treatment unit, which will be discussed in the subsequent
sections.
Figure 5.3 Claus reaction stage flowsheet
First Claus converter temperature:
The formation of carbon disulfide (CS2) and carbonyl sulfide (COS) in the reaction
furnace and waste heat boilers is always present and difficult to control. These
compounds adversely disturb the subsequent Claus converters catalyst due to sulfate
formation and must be destroyed by hydrolyzing them to H2S in the first converter. The

24
first Claus bed or converter employs a special type of catalysts to hydrolyze and destroy
those compounds according to the following two hydrolysis reactions:
COS + H2O ↔ CO2 + H2S (4)
CS2 + 2H2O ↔ CO2 + 2H2S (5)
The hydrogen sulfide formed from those hydrolysis reactions is then converted to
elemental sulfur. The top section of the reactor bed employs aluminum-based catalyst,
where H2S is oxidized and elemental sulfur is produced. The lower part of the bed is
operated with titanium based catalyst, which is used to hydrolyze COS and CS2
molecules [12].
The following case study was implemented to study the effect of the first converter
temperature on the conversion of H2S, COS, CS2.
Figure 5.4 Effect of Claus bed outlet temperature on conversion
30
40
50
60
70
80
90
100
265 285 305 325 345 365
Co
nve
rsio
n (
%)
Claus First Bed Outlet Temperature (oC)
H2S Conversion
COS Conversion
CS2 Conversion

25
As can be seen from Figure 5.4 (above), that increasing the reactor temperature leads to
increase in COS and CS2 conversion at the expense of H2S conversion, which decreases
due to its thermodynamic reaction behavior. The current plant operating temperature is
set at 310 oC and produces COS and CS2 conversion of 82.4% and 53.5%, respectively.
Increasing the temperature to 350 oC, for example, gives better conversion for these
compounds at around 91.2% and 69.5%, respectively. However, this increase would be
accompanied by an increase in the amount of reheat needed before the reactor in the
excess of 17%, which is not feasible. Thus, the current operating temperature set seems to
be optimal and we can compensate for the loss of efficiency due to the presence of these
compounds in the TGTU.
Second and third Claus converters temperature:
After hydrolyzing great amount of COS and CS2 compounds in the first Claus reactor, the
primary objective for the second and third reactors is to produce elemental sulfur
according to reaction (2). The reaction is favored at low temperature, however, not very
low so that the reaction won’t be able to proceed due to the reaction kinetic limitation and
reduced reaction rate. Other important constraint is the expected reactor temperature
should be higher than sulfur dew point to prevent liquid sulfur from forming inside the
reactor and damaging the catalyst. Thus, a safety margin of (5-15) oC above the dew
point temperature is usually used in industry.
It is important to accurately calculate the dew point, because an increase in the operating
temperature above the safety margin or an error in dew point calculations will result in

26
SRU energy loss and reduction of the overall energy efficiency. Higher operating
temperature requires higher energy input in the reheat exchanger ahead of the reactors.
For this purpose, the variation of the catalytic converters with temperature is investigated.
Figure 5.5 H2S conversion as a function of second Claus bed temperature
High H2S conversion can be obtained as can be seen in Figure 5.5 (above) by operating
the second Claus bed at lower temperature due to the reaction being exothermic.
Lowering the temperature shifts the equilibrium reaction to the right towards production
of elemental sulfur. Figure 5.6 (below) shows the increase of liquid sulfur formed by
decreasing reactor temperature.
45
50
55
60
65
70
75
80
85
90
180.0 200.0 220.0 240.0 260.0 280.0
H2S
Co
nve
rsio
n (
%)
Claus Second Bed Outlet Temperature (oC)

27
Figure 5.6 Sulfur production as a function of second Claus bed temperature
While low temperature is good from an economic point of view, in terms of less amount
of heating requirement in the heat exchanger and more liquid sulfur production.
However, we cannot go too low for two reasons:
1) The reaction won’t proceed at very low temperature due to kinetic limitations.
2) Sulfur will condense in the reactor and poison the catalyst if we operate at lower
than the dew point temperature.
Therefore, the optimum operating condition for the second Claus bed temperature is as
shown in Figure 5.7 (below). This corresponds to 236 oC in the reactor outlet and 210 oC
in the reheat exchanger before the reactor. The sulfur dew point at this condition is 226
oC. Hence, 10 oC is added above the dew point to ensure no liquid sulfur will form inside
the catalytic reactor. Operating in this region corresponds to 7.8% reduction of energy
from the base case.
600
700
800
900
1000
1100
180.0 200.0 220.0 240.0 260.0 280.0
Sulf
ur
Pro
du
ctio
n (
kg/h
)
Claus Second Bed Outlet Temperature (oC)

28
Figure 5.7 Variation of second Claus bed temperature with reheat temperature
A very similar analysis was carried out in order to determine the reheat temperature of
the third Claus bed. The results showed that liquid sulfur starts to form at the dew point
temperatures of 196 oC. Thus, using the safety margin criterion, operating the third
reactor at 206 oC is the optimum for the effluent temperature by heating the tail gas in the
reheat exchanger to about 193 oC, which is also represent an improvement of 10.2% in
heating requirement from the base case.
5.1.3 Claus Condensers Optimization
The controlling parameter for sulfur condenser is the cooling temperature needed to
condense and remove the liquid sulfur, which is determined by the balance between the
amount of required liquid sulfur removal and the energy supply in the subsequent reheat
exchangers. Hence, the cooling temperature would be as such that all sulfur vapor from
145
160
175
190
205
220
235
250
265
140 150 160 170 180 190 200 210 220 230 240 250 260 270 280
Tem
per
atu
re (
oC
)
Reheat 2 Temperature (oC)
Dew Point Temperature
Converter 2 Temperature

29
the reactors has to condense and flow out of the condensers to the sulfur collection pit. In
this cooling process, low pressure steam (3 to 10 bar) is produced.
5.1.4 Energy Recovery for the Claus Process
Claus sulfur recovery units in general produce energy in the form of steam more than
what they consume by employing waste heat boilers to recover the huge amount of heat
generated in the reaction furnace as well as recovering low pressure steam in sulfur
condensers. The produced steam has many uses in the plant such as driving steam
turbines and generate electricity that drive air blowers and pumps as well as for the
heating purposes. Moreover, steam is also used in heat tracing for the sulfur pipeline to
prevent sulfur from solidifying.
Energy inputs for SRU include:
The energy associated with the inlet acid gas.
The energy needed for the reheaters as fuel or steam.
Combustion air blowers energy as electricity or steam.
Energy outputs for SRU include:
Generation of different pressure steam.
The energy associated with the produced sulfur and offgas sent to the incinerator.
Reaction furnace, WHB, and other equipment heat losses.

30
Energy optimization involves attempts to reduce energy input and heat losses, while
maximizing recovery of energy. Optimizing sulfur recovery by increasing the amount of
produced sulfur will generally results in less flow of residual sulfur compounds to the
incinerator. This will result in less amount of fuel needed to burn these compounds and
will save the energy. To put it in other words, any optimization efforts to increase sulfur
recovery will also optimize the efficiency of energy.
5.2 Hydrogenation Unit Optimization
The purpose of the hydrogenation unit is to reduce all residual sulfur compounds such as
COS, CS2, SO2, and sulfur vapor back to H2S, which is then recycled back to the Claus
plant. The reducing gas burner generates the reducing gas (H2) that is needed to
hydrolyze sulfur components by burning fuel gas. The tail gas enters the unit and mixes
with the burner exhaust gases and its temperature would rise before entering the
hydrolyzing bed. Some of the reactions that occur in hydrolyzing reactor are given by
equations (4) and (5), as well equation (6) and (7) below:
3H2 + SO2 ↔ H2S + 2H2O (6)
H2 + S ↔ H2S (7)
As can be seen from the reactions above, hydrogen is required to hydrogenate and
convert the unreacted sulfur components so that later on H2S is recycled back to the
Claus plant. Therefore, a burner is installed in this unit to generate the hydrogen. The
flowsheet of the unit is as given in Figure 5.8 (below):

31
Figure 5.8 Hydrogenation unit flowsheet
Analysis of the current plant operation indicates that only 41.4% conversion is achieved
for carbonyl sulfide compound. Increasing this value will yield high sulfur recovery and
lower emission in the incinerator, because the residual sulfur components will pass
unchanged to the amine unit and then to the incinerator if not practically hydrolyzed in
this unit. In order to solve this problem, the fuel and air flowrates was manipulated by
operating the reducing gas burner with sub-stoichiometric air to maintain an excess of the
hydrogen throughout the process. In other word, maintaining an excess of H2 ensures that
nearly all sulfur compounds are converted to H2S. Running this simulation resulted in 1%
mole composition for H2 in the effluent gas and consequently the conversion has
increased to 96%. The fuel consumption in the incinerator was reduced due to this
improvement.

32
5.3 Quench Unit Optimization
Quench tower is used to condense and remove excess water from the tail gas to prevent
the accumulation of water in the amine absorber. The condensate is then sent to sour
water stripper for further treatment. The flowsheet of the simulated unit is as given in
Figure 5.9:
Figure 5.9 Quench unit flowsheet
Other benefit of the quench column is to cool the acid gas up to the temperature required
for the absorber operation. Moreover, the quench column acts as barrier that prevents SO2
to breakthrough to the amine absorber, as SO2 degrades the amine solvent. The important
parameter to control in this unit is the quench tower overhead temperature.

33
Quench unit was modified to operate with top overhead product temperature set at 40 oC
instead of the current 50.2 oC as it decreased the amount of water produced in RF, which
is passed to the amine unit, by absorbing it in the stream that flows to sour water
treatment unit. In addition, this was very helpful in the amine sweetening unit operation
as it enhanced the absorption efficiency. Air cooling requirement has increased from 1.12
MW to 1.38 MW by 23.2%. However, this increase will be appreciated by the huge
benefit in the amine sweetening operation as will be seen in following sections.
5.4 Amine Sweetening Unit Optimization
Optimizing the amine sweetening unit involves the interactions of different variables and
parameters that are most likely to be connected and depend on each other. Any change in
upstream process conditions will have its impact on the performance of the unit. Hence,
the unit should be able operate within optimum operating conditions for various cases
and scenarios.
The main objective of the amine sweetening unit is to selectively absorbs hydrogen
sulfide from the tail gas and recycle it back to the Claus SRU. Thereby, increasing the
overall conversion to sulfur product. H2S content of the treated sweet gas has to be below
250 ppm before sending it to the incinerator in order to comply with environmental
regulations. Input tail gas to the amine sweetening unit specification is given in Table 5.2
(below):
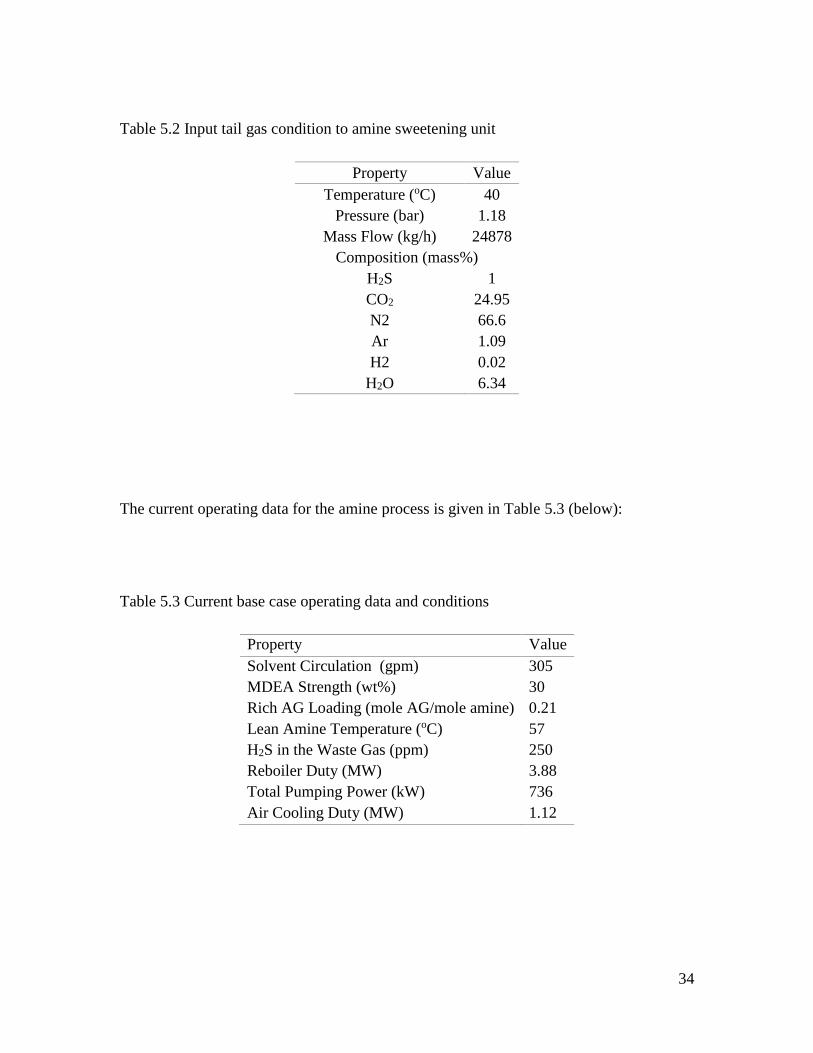
34
Table 5.2 Input tail gas condition to amine sweetening unit
Property Value
Temperature (oC) 40
Pressure (bar) 1.18
Mass Flow (kg/h) 24878
Composition (mass%)
H2S 1
CO2 24.95
N2 66.6
Ar 1.09
H2 0.02
H2O 6.34
The current operating data for the amine process is given in Table 5.3 (below):
Table 5.3 Current base case operating data and conditions
Property Value
Solvent Circulation (gpm) 305
MDEA Strength (wt%) 30
Rich AG Loading (mole AG/mole amine) 0.21
Lean Amine Temperature (oC) 57
H2S in the Waste Gas (ppm) 250
Reboiler Duty (MW) 3.88
Total Pumping Power (kW) 736
Air Cooling Duty (MW) 1.12

35
The flowsheet of the simulated amine unit is given in Figure 5.10 (below):
Figure 5.10 Amine sweetening unit flowsheet
The cooled gas from the quench tower overhead, stream 16 in Figure 5.10, enters the
bottom of the contactor tower and flows upwards. The lean amine MDEA solvent enters
the tower from top and counter-currently flows downwards. H2S is selectively get
absorbed by the circulating amine and exit the tower from the bottom, where this rich
stream now flows to the regenerator tower to strip H2S out of the solution and recycle it

36
back to SRU. The treated waste gas from the top of the contactor is sent to the
incineration unit.
5.4.1 CO2 Slippage
An important factor to consider is the ability of amine solvent to reject most of the CO2
and to absorb most of the H2S. This is important because recycling CO2 to the Claus plant
will have great impact on the size of equipment and will reduce the overall efficiency to
some degree because CO2 is a diluent in the unit. Furthermore, carbon dioxide promotes
the formation of COS and CS2 in the Claus RF. The main solution to this problem is to
operate the absorber with high selective amine solvent such as MDEA as well as to select
the operating conditions that slip most of the inlet CO2 in the tail gas with the overhead
waste gas sent to the incinerator.
Amine concentration and circulation rate have the greatest effect on the CO2 slippage. As
can be seen in Figure 5.11 (below), the circulation rate has been kept constant at 170
gpm, and the effect of amine concentration was monitored. Lower amine concentration is
good for high CO2 slippage, which is in this case the 20 (wt%) MDEA amine solution.

37
Figure 5.11 CO2 slippage as a function of amine (wt%) at 170 (gpm)
Figure 5.12 (below) depicts the variation of CO2 slippage with circulation rate for the 20
(wt%) MDEA. Higher amine flow rate increases the absorption of CO2 into the MDEA,
which will then be recycled back to the Claus plant. This will cause dramatic impact on
the sulfur recovery as it decreases the reaction furnace temperature and leads to poor
conversion.
76
80
84
88
92
96
5 15 25 35 45 55
CO
2Sl
ipp
age
(%)
MDEA wieght percentage (wt%)

38
Figure 5.12 CO2 slippage as a function of amine circulation rate at 20 (wt%)
Therefore, for high selectivity applications as in this case, MDEA concentration and
circulation has to be maintained at low levels, in order to avoid the risk of sending CO2 to
the Claus plant, which promotes the formation of COS and CS2 as well as overloading the
unit.
5.4.2 Amine Circulation Rate
Acid gas absorber or contactor is the main equipment that is found in gas sweetening
units. It facilitates the interactions between the acid gas and the solvent to occur, where
the acid gas (H2S and CO2) will react and get absorbed by the amine solution. High
pressure and low temperature are usually preferred operating conditions for absorbers
operation.
One of the factor to consider is the concentration of absorbed acid gas (H2S and CO2) in
the amine solvent circulated in the unit, which is known as rich loading. High acid
1000
1500
2000
2500
3000
88
90
92
94
96
90 120 150 180 210 240
Reb
oile
r D
uty
(kW
)
CO
2Sl
ipp
age
(%)
MDEA Circulation Rate (gpm)
CO2 Slippage %
Reboiler Duty (kW)

39
loading increases the efficiency of the unit. However, not very high which causes
corrosion and foaming.
High amine circulation flowrate dictates the use of high pumping energy needed to pump
the amine solvent and high steam rate in the reboiler due to more heat that is necessary to
regenerate the amine as in shown in Figure 5.13 (below):
Figure 5.13 H2S concentration and energy requirement variations with the amine rate
The foaming tendency will also be high because of the increased liquid velocity in the
tower. Over circulation, also leads to increased degree of tear and wear on pipes and
equipment, which cause corrosion. Thus, it is necessary to operate the unit with the
optimum circulation rate to maintain stable operating condition, which will result in
significant amount of cost saving without sacrificing on performance.
2200
2700
3200
3700
4200
4700
90
590
1090
1590
2090
90 120 150 180 210En
ergy
Req
uir
men
t (k
W)
H2S
Co
nce
ntr
atio
n (
pp
m)
MDEA Circulation Rate (gpm)
ppm
kW

40
5.4.3 Lean Amine Temperature
Determining the optimum lean amine temperature is not always straightforward. Most
plant operators and gas processing textbooks suggests that lean amine temperature to be 5
oC above feed temperature in order to prevent hydrocarbons condensation in the tower
and related foaming issues [10]. It was obviously important to investigate the sensitivity
of varying the lean amine temperature on operating parameters such as treated gas H2S
amount, pumping duty, water vapor content in waste gas, and dew point temperature.
The current plant operation indicates:
Lean amine temperature of 57 oC.
Tail gas feed temperature inlet to the absorber of 40 oC.
Amine circulation rate of 305 gpm.
Therefore, a case study was conducted by varying the lean amine temperature and
monitoring the effects on the system performance.

41
Figure 5.14 Treated gas H2S content versus lean amine temperature
Reducing lean amine temperature leads to less H2S content in the waste gas as shown in
Figure 5.14 (above), which is as expected. This explains the preference of low
temperature absorption operation, because the chemical of acid gas with MDEA is
exothermic in nature, meaning that heat is released in the process, and by lowering
temperature more H2S will be absorbed by the solvent. For all circulation rates of 300
gpm and above, decreasing the temperature does not improve the process since all
temperatures produce gas within specification (i.e., below 250 ppm).
On the other hand, operating the unit with 150 gpm and lower amine flowrates produce
off-spec waste gas. Therefore, the optimum amine flowrate should be kept at 170 gpm for
all lean amine temperatures below 47 oC. For summer plant operation, where it is difficult
to maintain this temperature by air cooler, we can increase the circulation rate to 200 gpm
and still produce a treated gas within specification. Provided that temperature of lean
75
225
375
525
675
825
975
38 40 42 44 46 48 50 52 54 56 58 60 62
H2S
Co
nte
nt
(pp
m)
Lean Amine Temperature (oC)
150 (gpm)
170 (gpm)
200 (gpm)
300 (gpm)

42
amine does not exceed 52 oC. Performing this modification has resulted in pumping
duties to decrease from the current 736 kW to 521 kW by 29%.
5.4.4 Regeneration Parameters
Table 5.4 (below) shows the energy consumption in the amine sweetening process.
Significant amount of energy is consumed in the reboiler as compared to other energy
required in the pumps and aerial coolers.
Table 5.4 Energy consumption comparison in amine sweetening unit
Property Value
Reboiler Duty (MW) 3.88
Air Cooler Power (MW) 1.38
Therefore, the regeneration process offers a potential area of optimization in the amine
sweetening unit. The rich amine flows from the absorber to the regenerator tower, where
steam is used to heat the amine to its boiling point to strip H2S out from the solution.
Once regenerated, the amine is routed back to the absorber via lean amine pump. The
regeneration process requires maintaining the amine at its boiling point in order to strip
H2S. The required energy in the form of steam can be optimized by supplying enough
steam to the regenerator.

43
Steam ratio, which is defined as steam mass flow rate per amine circulation volumetric
flow rate, as recommended by [14] and many other sources varies from (0.9 – 1.2) lb
steam/gallon amine. The current plant operation uses steam stripping ratio of 1 lb
steam/gallon amine and the corresponding reboiler duty is 3.88 MW. Conducting a
sensitivity analysis to test the effect of changing the steam ratio on system performance,
and particularly on reboiler duty is essentially required. The steam ratio was varied from
(0.6 to 1.5) lb steam/gallon amine and the amine circulation was kept at the minimum
required to achieve H2S specification in the waste gas. The case study is presented in
Figure 5.15 (below):
Figure 5.15 Steam stripping ratio effect on reboiler duty
0123456789
10111213
0.5 0.7 0.9 1.1 1.3 1.5
Reb
oile
r D
uty
(M
W)
Steam Ratio (lb steam/gallon amine)

44
From the conduced case study, it is obvious that the recommended steam ratio rule is
valid as the reboiler duty is in the minimum possible range for (0.9 – 1.2) lb steam/gallon
amine. However, improvement still can be made by lowering the steam ratio from the
current 1 lb steam/gallon to 0.87 lb steam/gallon. As the reboiler duty will decrease from
3.88 MW to 3.47 MW, which amounts for 10.6% reduction in reboiler duty while still
produce a treated gas within specification.
5.5 Incineration Unit Optimization
Figure 5.16 Incineration unit flowsheet
All residual sulfur components not recovered in the process will be sent to SRU
incinerator. Those compounds include H2S, COS, CS2, and sulfur vapor (all together are

45
known as Total Reduced Sulfur, TRS). The incinerator works by burning and oxidizing
the tail gas that includes TRS to SO2 prior to release them to atmosphere. Proper air to
fuel ratio has to be controlled to ensure all TRS are oxidized and to eliminate pluming
from the stack of the incinerator.
5.6 Optimized Operating Conditions
The preceding analysis in previous sections revealed variety of operational changes that
resulted in improving the sulfur recovery process. The addition of SCOT process to treat
the outlet tail gas from the SRU has resulted in improving the overall sulfur recovery
from 98% to 99.93%. This has resulted in reducing the total sulfur emission from 4900
ppm down to 250 ppm in order to comply with air regulation.
Some of the modifications for operating parameters of the SRU are found in Table 5.5
(below):

46
Table 5.5 Optimal operating condition for SRU and energy recovery
Equipment Controlling
Factor
Base
Case Optimized Potential Advantage
Reaction
Furnace
Tail Gas Ratio
(H2S/SO2) 1.82 2
0.96% Increase in Sulfur
Recovery and 22.9% Decrease
in Air Blower Power
Converter 1
Reheat
Temperature
(oC)
232 232 –
Converter 2
Reheat
Temperature
(oC)
216 210 7.8% Reduction in Reheat
Duty
Converter 3
Reheat
Temperature
(oC)
204 193 10.2% Reduction in Reheat
Duty
The production of steam in the WHB and has also increased and overall, SRU can be
considered as a net exporter of energy in the form of steam and usually the required fuel
consumption is reasonable and not very high.
Studying the hydrogenation unit current operating conditions revealed that there is a
deficiency of the reducing gas (H2). Consequently, the inline burner was modified to
operate in an air deficient mode to raise the H2 content in the effluent gas. This resulted in
increasing the conversion of carbonyl sulfide from 41.4% to 96%. Considerable amount
of fuel reduction, around 7%, was noticed in the tail gas incinerator due to lower TRS
compounds being sent there.
Other studies included the quench unit operation by lowering the overhead temperature to
40 oC. Air cooling requirement has increased from 1.12 MW to 1.38 MW by 23.2%, as
47
expected. However, considerable gains were noticed in the amine sweetening unit
operation such as the ability to increase the rich loading from 0.21 to 0.34 mol AG/mol
amine and the ability to reduce the amine circulation rate and reboiler duty by applying
little modification to key operational parameters.

48
Chapter 6 Conclusion
Sulfur recovery process is an essential and integral part of any crude and natural gas
plants processing sour streams. Its importance originates from the need to meet
environmental air regulation regarding sulfur emissions. The plant for the study was
modified by adding a tail gas treatment unit to raise the sulfur recovery from 98% to
99.93%. This was done because the current plant sulfur emission was around 4900 ppm
and in order to lower this value, some sort of cleanup process for the waste gas had to be
implemented. As a result, sulfur emission has decreased below the 250 ppm standard
value in the incinerator stack and the emission is now fulfill air pollution regulation.
The project presented the study of key sulfur recovery parameters and their impact on the
efficiency of the system. The aim was to achieve the optimum operating points for each
parameters. Key factors that affect the performance of the sulfur recovery process had
been investigated by the aid of ProMax process simulator. First by developing the steady
state model for the whole process. Then, the model was tested and evaluated to determine
the sensitivity of the operational parameters that might affect performance of the process.
In this project, the performance of the sulfur recovery process was simulated and
evaluated. Followed by optimization in order to improve the efficiency. Especially, those
related to operational parameters because they are easy to implement in existing
processes without additional capital investment and results in huge savings in terms of
energy and operating cost. Operating at optimum conditions is a key factor for process
improvement.

49
Amine circulation rate has the biggest effect on energy consumption among other
parameters. Over circulation often leads to high energy consumption in the reboiler
without significant improvement in the treated tail gas composition. Therefore, it’s
essential to maintain the circulation rate at optimum minimum value without
compromising on product specifications. The amine circulation rate was lowered by
34.4%, which offered great improvement of throughput of the system. The 10.6%
reduction in reboiler duty can be considered as a reduction of operating cost and
improvement in system performance. The hydrogenation unit inline burner was modified
to operate in an air deficient mode to raise the H2 content in the effluent gas. This resulted
in increasing the conversion of carbonyl sulfide from 41.4% to 96%. Considerable
amount of fuel reduction, around 7%, was noticed in the tail gas incinerator due to lower
TRS compounds being sent there.
These are very reasonable modifications and variations but they provide great
enhancement and improvement of plant operation under study. Lastly, every plant and
case is different and necessitates different analysis and rigorous investigations in order to
optimize the performance and process.

50
References
[1] N. P. Lieberman, Troubleshooting Process Operations, PennWell Books, 1991 .
[2] R. Maddox and J. Morgan, Gas Conditioning and Processing, Gas Treating and
Sulfur Recovery, vol. 4, Campbell Petroleum Series, 2006.
[3] T. F. Edgar, D. Himmelblau and L. Lasdon, Optimization of Chemical Processes,
McGraw-Hil, 2001.
[4] P. E. Services, Hydrogen Sulfide in Production Services, The University of Texas
at Austin, 1996.
[5] D. Vallero, Pollution, Fundamentals of Air, Academic Press, 2007, p. Daniel
Vallero.
[6] G. Kutney, Sulfur, History, Technology, Applications & Industry, ChemTec
Publishing, 2013.
[7] ProMax 3.2, Texas: Inc., Bryan, 2014.
[8] BRE, "Bryan Research & Engineering," [Online]. Available: https://www.bre.com/.
[Accessed 3 January 2016].

51
[9] A. Kohl and R. Nielsen, Gas Purification, 5th Edition, Houston TX: Gulf
Publishing Company, 1997.
[10] A. Bahadori, Natural Gas Processing, Massachusetts: Gulf Professional Publishing,
2014.
[11] R. Street and M. Rameshni, "Sulfur Recovery Unit Expansion," Worley Parsons.
[12] F. Manenti, D. Papasidero, G. Bozzano and S. Pierucci, "Total Plant Integrated
Optimization of Sulfur Recovery," in 23rd European Symposium on Computer
Aided Process Engineering, Lappeenranta, 2013.
[13] J. DeLong, Out of Bounds Out of Control Regulatory Enforcement at the EPA,
Washington DC: CATO Institute, 2002.
[14] GPSA Engineering Data Book, Oklahoma: Gas Processors and Suppliers
Association, 2012.