qb 1979 q3 pp249-265 - bank of england
TRANSCRIPT
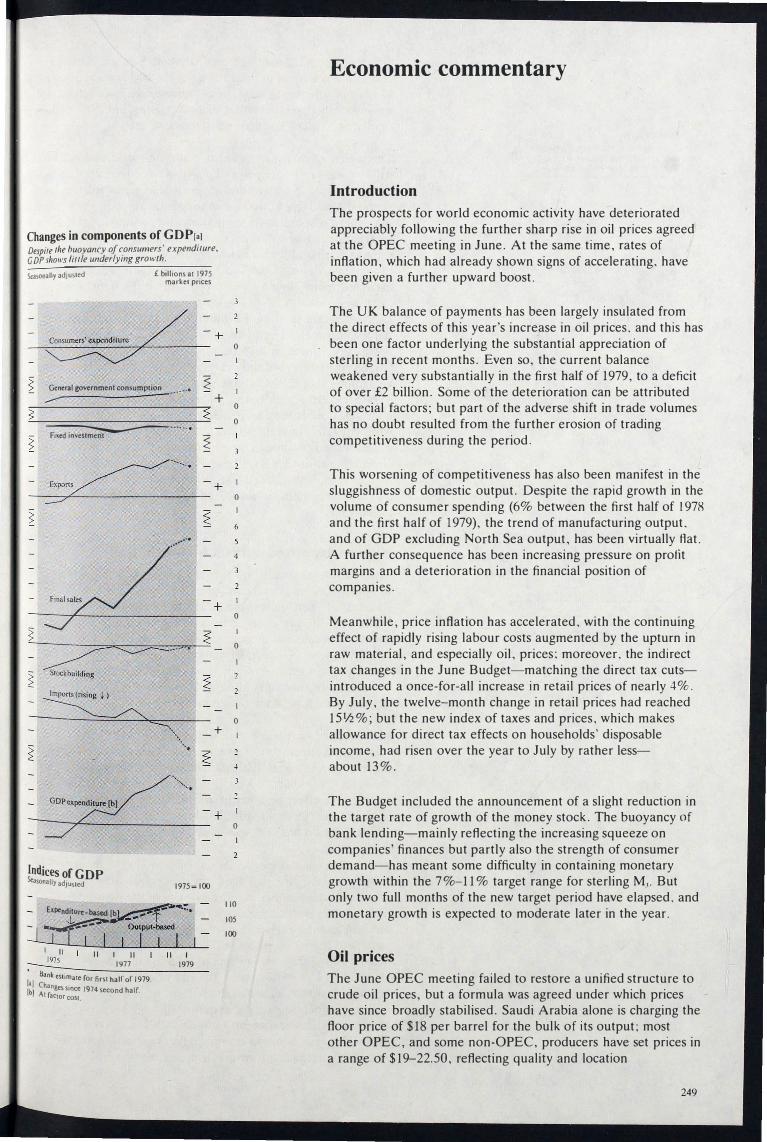
Changes in components of GDP [a]
Despite the buoyancy of consumers' expenditure,
GDP sho\l's /il/le underlying gro,vth.
Seasonally adjusted £ bill ions at 1975 market prices
�
�
�
General government consumplion �P' __ '.
...--
�.-.--.. Fixed investment
.......•
�-----. Stock bu ild ing
Imports(rising t)
� c::::::::: '\.
" .
'" «'
f
Indices of GDP
� � �
�
�
�
�
Seasonally adjusted 1975= 100
Expenditure-based [b _ ...L_----LJ I
I 11 11 I 11 � 1977
[t Bank estimate ror first half of 1979. '1 Chang . [bl
esSlnce 1974 second half. At ractor Cost
11 I 1979
+
+
+
+
+
+
0
0
0
0
0
0
0
0
110
105
100
Economic commentary
Introduction
The prospects for world economic activity have deteriorated appreciably following the further sharp rise in oil prices agreed at the OPEC meeting in June. At the same time, rates of inflation, which had already shown signs of accelerating, have been given a further upward boost.
The UK balance of payments has been largely insulated from the direct effects of this year's increase in oil prices, and this has been one factor underlying the substantial appreciation of sterling in recent months. Even so, the current balance weakened very substantially in the first half of 1979, to a deficit of over £2 billion. Some of the deterioration can be attributed to special factors; but part of the adverse shift in trade volumes has no doubt resulted from the further erosion of trading competitiveness during the period.
This worsening of competitiveness has also been manifest in the sluggishness of domestic output. Despite the rapid growth in the volume of consumer spending (6% between the first half of 1978 and the first half of 1979), the trend of manufacturing output, and of GDP excluding North Sea output, has been virtually flat. A further consequence has been increasing pressure on profit margins and a deterioration in the financial position of companies.
Meanwhile, price inflation has accelerated, with the continuing effect of rapidly rising labour costs augmented by the upturn in raw material, and especially oil, prices; moreover, the indirect tax changes in the June Budget-matching the direct tax cutsintroduced a once-for-all increase in retail prices of nearly 4%. By July, the twelve-month change in retail prices had reached 1 5 V2%; but the new index of taxes and prices, which makes allowance for direct tax effects on households' disposable income, had risen over the year to July by rather less-about 13% .
The Budget included the announcement of a slight reduction in the target rate of growth of the money stock. The buoyancy of bank lending-mainly reflecting the increasing squeeze on companies' finances but partly also the strength of consumer demand-has meant some difficulty in containing monetary growth within the 7%-1 1 % target range for sterling M,. But only two full months of the new target period have elapsed, and monetary growth is expected to moderate later in the year.
Oil prices
The June OPEC meeting failed to restore a unified structure to crude oil prices, but a formula was agreed under which prices have since broadly stabilised. Saudi Arabia alone is charging the floor price of $18 per barrel for the bulk of its output; most other OPEC, and some non-OPEC, producers have set prices in a range of $19-22.50, reflecting quality and location
249

1.4
1.2
1.0
0.8
0.6
0.4
250
Oil prices Oil prices have risen rapidly this year, and in real terms are now over 45% higher than at/he end of last year.
Logarilhmic scales
1975= 1.0
S per barrel
R.cat {a]
Nommal{b]
lal The dollar price of crude oil divided by the dollar price of world exports of manufactures.
Ib I Average contract price.
25.0
20.0
10.0
8.0
6.0
4.0
differentials; while the high-quality' North Sea and African crudes are selling at or near the agreed OPEC ceiling price ef $23 .50. For the time being, prices on average have settled down some 23% higher than in the second quarter, and 60% higher than at the end of last year (see chart).
The course of oil prices over the rest of this year and in 1980 will depend on the success of measures to reduce t he demand for oil, and on the speed and severity of any downturn in world economic activity, as well as on supply factors. On the demand side, there is some evidence that member countries of the International Energy Agency are making progress towards reducing demand for oil below projected levels. In the first half of the year, demand was some 1 % lower than previously expected, but following the Tokyo summit the hope was expressed that the 5% savings target would be reached by October rather than by the end of the year. The outlook for supply, meanwhile, remains uncertain. Saudi Arabia increased production by one million barrels per day (mbpd) from the beginning of July, but only for a temporary unspecified period, and some other OPEC members have announced their intention of either cutting back output or reducing contract supplies. In addition, doubts have increased about Iran's ability or willingness to maintain production at its official announced rate of four mbpd. Although, during the third quarter, stocks in the consuming countries have been rapidly approaching normal, memories of last winter's disruption remain strong, and the oil market will remain vulnerable to any shortfall in supplies later in the year.
A more depressed outlook for world trade
The substantial and abrupt increase in oil prices has worsened the prospects for growth, inflation and trade in the world economy. In certain respects, the United Kingdom will be better protected from the effects of higher oil prices than other countries because of its near self-sufficiency in oil, and because,
initially at least, UK export markets may be less hard-hit than world trade in general (see below). Nevertheless, these markets will probably grow only about half as fast over the next two years as they have done on average since 1975 .
In money terms, the increase in the price of OPEC oil so far this year has been almost as large as in 1973 (around $7 per barrel). Proportionately, however, the increase has been very much less (see chart). Even so, higher oil prices will have an appreciable effect on a world in which the modest growth rate of recent years was already showing signs of declining, and in which inflation has remained stubbornly high.
As the first chart opposite shows, inflation in the main overseas
economies had already begun to turn up early in 1979, rising to
about 8% at an annual rate on average in the first quarter, mainly as a result of the sharp rise in raw material prices last
autumn and the early effects of rising oil prices. Most of the . impact of higher oil prices will be felt in the second half of thiS
year, pushing the average rate of inflation into double figures.
By the first half of next year, the rise in consumer prices should
be slowing down, although the pattern from country to country
will vary depending on the response of wage earners. Overall,
the wage/price spiral seems unlikely to be as marked as in 1974-75, partly because labour markets are now much slacker
and partly because governments appear to be taking a tougher

Costs and prices in major overseas countries[.) Consumer price inflation is likely to accelerate further following the increases in oil and other commodity prices.
Percentage increase - latest three months on previous three
30
25
- 20
M s 1978
o M J 1979
laJ United States, Canada, Japan, France, Ilaly and Western Germany: in national currencies GNP.weighted. The last plot shown is in �ach case a Bank estimate.
[b] Based on the Economist all-items dollar commodity price index, used with permission.
[c) Average OPEC price. [d) Adjusted for cyciical influences: based on IMF indices available only quarterly.
+
Domestic demand in major overseas countries [a) Despilea marked check to personal consumption, Iherecession ill economic activity is unlikely 10 be as severe as in /974-75.
Percentage change over previous period at an annual rate
�--------���----------- +
1 1 1973 1974
11
11
11
I 1975
I __ 1978 1979 1980 la) Uni'ed...-:S:--------.:.:..:..:...---.:..:..=--
We tales, Canada, Japan, France, Italy and forec
Slern Germany. First hair 1979 partly estimated; a Sls thereafter.
15
10
o
4
o
stand against inflation. Moreover, in some countries-perhaps Western Germany and particularly Japan-labour forces are likely to be relatively restrained in their attempts to resist a decline in real wages, so that the higher average rate of inflation could well be accompanied by a widening of inflation differentials between countries.
Although wages are expected to respond moderately over the coming year, and this will help to mitigate the longer-term inflationary impact of higher oil prices, the consequence is likely to be a significant squeeze on real personal incomes and expenditure. Moreover, business confidence is likely to weaken, and there seems little prospect that the authorities in the major countries (with the possible exception of France) will take sizable action to offset the depressive effects of the increase in oil prices. The growth of real domestic demand in the main overseas economies could thus slow down sharply-to perhaps only 1j2% between the first halves of 1 979 and 1980, compared with forecasts at the beginning of the year of 2%, itself less than half the 41/4 % achieved in the preceding year. The slowdown is likely to be most marked in North America and Japan. The United States reached the peak of an exceptionally long and sustained growth cycle at the beginning of this year. Higher oil prices have simply reinforced other influences in slowing the economy down, and have boosted an inflation rate that was already accelerating for domestic reasons. Information for the second quarter of this year suggests that domestic demand in the United States has begun to weaken, and it is expected to fall significantly between the first halves of 1979 and 1980. Although net exports are likely to make a positive contribution, GNP too is likely to decline over the same period. In Japan, the prospective weakness of real personal incomes and spending seems likely to restrain the recovery that began last year; and business confidence could also prove fragile. In Europe too, growth may slow down, but should be better sustained than elsewhere.
The initial impact of higher oil prices on current balances will be widely spread; the OPEC surplus is likely to be running at an annual rate of nearly $50 billion between mid-1979 and mid-1980, the main counterpart of which will be found in deteriorating current account positions in the OECD area. However, the early emergence and the depth of the recession among the major countries may soon shift the deficits towards the smaller members of the OECD and the non-oil developing countries.
The slowdown in the major countries is unlikely to be as marked as in 1974-75 (see chart). Apart from the smaller size of the latest oil price increase in real terms, it has not come in the wake of a strong synchronised upturn; nor is there a speculative build-up of stocks to be reversed. On the other hand, the world economy may receive less support this time from the smaller developed and non-oil developing countries. In contrast to 1974-75, these countries may not be able to avoid restraints on domestic activity. On that occasion, they were able to borrow extensively abroad (especially from the international banking system), but this time they are faced with the substantial external debts they have already accumulated.
Recession is likely to bring the growth of imports into the OECD area (about three quarters of world trade) to a virtual standstill in volume terms between mid-1979 and mid- 1980.
251

World trade and UK export markets la] In the early stages of the recession, UK export markets may hold up better than world trade in general.
Percentage change over previous period at an annual rate
11 1978 1979
1 1 I 1980
la] First half of 1979 partly estimated; forecasts therearter.
[b) Growth of other countries' imports weighted by their share of UK exports.
Output and productivity in manufacturing industry Despite the recent recovery,manufacturing output shows little underlying strength.
Seasonally adjusted 1975= 100
,. / ,
� I
; I
Productivity [a) 1\ : f,\ ( \ I " I .
III " I I I III " 11 I III " I I! I1 [ 1974 1976 1978
[a] Measured as output per person employed.
252
10
1 15
1 10
105
100
Elsewhere, although higher oil prices will permit a faster rise in OPEC imports, the effect of this may be largely offset as the non-oil developing countries attempt to curb their growing current account deficits. The growth of UK export markets will, therefore, slow down sharply this year, but probably not as markedly as world trade in general (see chart). The countries likely to experience the sharpest checks to import growth-the United States and Japan-account for a smaller proportion (one eighth) of UK markets than of world trade, while the United Kingdom has had an above-average share of the OPEC market. In addition, the expected restriction of imports into the smaller developed countries, which are important UK export markets, is not likely to have a significant impact until late in 1980. This means, however, that, looking further ahead, the United Kingdom is unlikely to benefit as much as most other major countries from any pick-up in world trade as the world economy recovers.
UK output: no underlying growth
GDP increased by 3% in the second quarter, as industry recouped some of the production lost earlier in the year because of strikes and bad weather. In the first half of 1979 as a whole, however, output was only 1/2% higher than in the second half of last year. The same comparisons for manufacturing industry show, respectively, a rise of 4% and no change (see chart). One factor helping to sustain some growth in GDP has been the increasing output of North Sea oil. This has contributed about 1 % to the rise in GDP over the last year and may well be the only component of output to grow in the remainder of 1979.
Despite the recovery in manufacturing production in the second quarter, the underlying trend appears to be almost flat. Recent
surveys of business confidence suggest that the prospect is judged to be no better. This picture, at a time when consumer spending has been growing exceptionally fast (almost 6% higher in the first half of the year than in the corresponding period in 1978), reflects in part the present weakness of manufacturing competitiveness. Import penetration has been rising for several categories of manufactured goods over a number of years (see chart opposite) but seems likely to have increased further, perhaps quite sharply, in the first half of 1979. The problem has been especially acute for some industries, notably vehicles and
textiles. Between 1975 and 1978, however, the rise in gross import penetration for manufacturing as a whole was largely matched by a higher proportion of output going to exports, leaving net trade in 1978 at almost the same proportion of total
demand as three years earlier. Indeed, some sectors have improved their trade performance over the last few years, e.g·
electrical machinery; and since their experience in terms of domestic costs cannot have differed greatly from that of other
parts of industry, this serves to underline the importance to
competitiveness of factors other than costs and prices.
As well as inducing higher imports, the buoyancy of consumer
spending was probably one factor leading to the fall in manufacturing industry's stocks of finished goods in the second
quarter. With the prospect of a serious deterioration in companies' financial position (see page 257), this run-down may be allowed to continue. Stocks of raw materials, on the other
hand, rose substantially-rather surprisingly given the poor
prospects for output and the apparent weakening of businesS
confidence.

Import penetration in manufacturing industry (selected industries) Import penetration continued to rise in 1978 for mallyindustrial sectors.
Per cent
_ Imports as a percentage of total demand [a]
-- Net imports as a percentage of total demand [b)
25
20
-+ 15
�- 10
Textiles
-------------,/
Electrical macrunery
" \ " \ \ \
\ \ ---------
//
15
20
25
20
� 15
+ 0
15
15
20
25
20
15
- + 10
----
Total manufacturing
" ............. -
--------�_-I���--�-L�� _ 1974 1976 1978
lal Total d d' . i
eman IS defined as manufacturers' sales plus e���;:: which is equal to home demand plus
{b] �et imports are defined as imporls minus exports.
20
+ o
Some weakening likely in the labour market ...
The number of employees in employment is estimated to have fallen by 35,000 during the first three months of this year, compared with average quarterly increases of around 50,000 in 1978. Part of the fall was associated with the severe weather and industrial disruptions of the winter but, even allowing for this, it seems unlikely that last year's upward trend in employment has been, or will be, sustained. Employment growth in 1978 took place despite a fall of about 50,000 in the number of people covered by the special employment and training schemes. In contrast, the flatter or downward trend in employment so far this year has emerged despite a net rise of around 65,000 in the numbers covered by these schemes, mainly the Small Firms Employment Subsidy, the Short Time Working Compensation Scheme, and the Job Release Scheme. All three schemes are concentrated in manufacturing. Their recent expansion may explain the somewhat slower decline in this sector's workforce so far this year; yet equally it provides confirmation that the underlying trend remains downward. A further scheme, the Temporary Employment Subsidy, is now being phased out and will disappear completely before the middle of next year. The other schemes remain operative, but the expenditure cuts announced in the Budget will reduce projected spending in this area and require the introduction of more stringent qualifying procedures. Expenditure cuts are also likely to involve some reversal of recent employment growth in the public sector. In the year to March, local authority employment was particularly buoyant. The temporary freeze on recruitment imposed on the Civil Service between May and August may already have led to a net loss of jobs in the public sector as a whole.
Granted the weakness of output, even the modest strengthening of the labour market so far this year seems surprising. Nevertheless, the average monthly reduction in unemployment in the eight months to August (7,000), has been somewhat less than the monthly average fall in 1978 (8,500). And more recently, the figures for vacancies notified to employment offices may indicate some tailing off in the demand for labour. After reaching a peak in June, notified vacancies had by August fallen by some 17,000. Both unemployment and vacancies figures are. however, particularly hard to interpret during the summer months, when the labour market receives the main influx of school-leavers. Recent movements should therefore be interpreted with caution as indicators of the underlying trend.
... but shortages of some skills?
Ont! of the consequences of prolonged recession is that the changing requirements of industry in different areas and trades are not fully reflected in the demand for, and supply of, suitable skilled workers. This may exacerbate mismatches in the labour market during a subsequent upturn in activity. The existence of surplus labour may also remove the immediate incentive to devote resources to training and weaken market signals on pay relativities. Inadequate apprentice recruitment in the late 1960s and early 1970s, coupled with narrowing skill differentials and lack of job security, are among the major factors which have been leading to potentially damaging shortages of skilled craftsmen in key industries.[l] The problem is particularly acute in engineering: for the strong links between activity in most manufacturing, and many service, industries and demand for
ill See the June 1978 Bulletin. pages 158-9.
253

Ratio of notified vacancies to registered unemployment in a selection of skilled engineering occupations
March 1973 1974 1975 1976 1977 1978 1979
Occupatlon Pattern makers 0.74 2.76 1.30 0.36 0.66 1.08 1.17 E1ectro-platers 0.88 0.97 0.39 0.18 0.28 0.22 0.29 Machine tool setter-operators 1.44 3.65 2.05 0.29 0.75 1 .10 1.08 Tool makers and tool fitters 0.98 2.43 1.21 0.25 0.81 1.17 1.52 Precision instrument makers 0.58 1.39 1.36 0.32 0.57 0.82 1.31 Maintenance fitters (non-electrica1) 0.52 0.81 0.53 0.17 0.32 0.48 0.53 Motor vehicle mechanics 1.32 1.12 0.58 0.23 0.43 0.54 0.65 Instrument mechanics 0.30 0.51 0.78 0.15 0.69 1.32 1.1 I Electricians (plant and machinery) 0.75 0.99 0.50 0.18 0.35 0.43 0.56 Sheet-metal workers 1.41 2.00 1.01 0.33 0.62 0.78 0.88 Welders (skilled) 0.43 0.47 0.41 0.12 0 . 1 5 0.14 0.15
Ratio of notified vacancies to registered unemployment in engineering occupations by region
March 1973 1974 1975 1976 1977 197R 1979 ----------
Region London and South East 1.72 2.48 1.32 East Anglia 2.45 3.1 I 0.74 South West 1.28 1.18 0 .54 West Midlands } 0 88 1.36n� East Midlands Yorkshire and Humberside 0.52 0.77 0.68 North West 0.30 0.59 0.30 North 0.20 0.33 0.51 Scotland 0.22 0.38 0.71 Wales 0.30 0.32 0.28
Great Britain 0.73 1.10 0.66
Skilled workers' earnings [a)
There has been a marked narrowing of skill differentials in recent years.
Ratio
1970 1972 1974 1976 1978
[a) The ratio of average gross weekJy earnings in two sldlled engineering occupations to the average for all manual occupations.
254
0.30 0.57 0.86 1.1.1 0.26 0.39 lI.n 11.71
0.16 0.21 0.39 0.57 0.09 0.33 0.42 OAI 0.22 0.511 0.62 1I.6B
0 . 1 8 0.42 0.48 II.4Y
0.10 0.18 11.26 11.28 0.19 0.28 0.21 0.19 0.75 0. 23 0.26 11.23
0.12 0.24 0.23 0.34
0.19 0.35 0.44 0.511
1.24
1.20
J.16
1.12
1.08
the products of the engineering sector mean that this sector is especially sensitive to general recession. Since engineering also has the highest concentration of skilled craftsmen, these workers are correspondingly most exposed to the threat of redundancy. Shortages of skilled workers seem to have emerged, even though manufacturing output has been very subdued. Unless the loss of craftsmen from industry in recent years can be substantially reversed, a renewed expansion of engineering output might run into supply constraints quite quickly.
The ratio of notified vacancies to registered unemployment in an occupation provides a rough measure of scarcity. [1] The first table suggests a general tightening in the supply position for most skills over the last three years, especially in the important categories of tool makers and tool fitters-although the position still appears a good deal easier than at the previous peak in the labour market in 1973-74. There are, however, marked regional disparities. For engineering occupations as a whole, the second table suggests that the serious shortages in the South East continued to worsen, while in the North an already slack market for skilled engineering workers weakened further.
The problem of regional variations emerges even more clearly from studies of local labour markets conducted recently by the Manpower Services Commission (MSC). These show that in relatively tight labour markets, where industry is expanding, serious shortages of key engineering craftsmen have already resulted in lost orders, and that a disproportionate amount of management time is devoted to the renegotiation of delivery dates and to recruiting. The occupations affected are not simply those which appear to be in general shortage such as tool makers and machine tool setter-operators but also, for example, skilled welders where, despite nearly seven unemployed men for every notified vacancy in the country as a whole, geographical variations have meant that some vacancies have remained unfilled for more than three months. The efforts of the MSC to encourage unemployed craftsmen to move to vacancies in other regions have had only limited success.
The danger is that skilled craftsmen who find no suitable local employment will move into other occupations and be lost to the industry. A major study conducted jointly by the MSC and the National Economic Development Council discovered serious disillusionment among engineering craftsmen leaving the industry between 1974 and 1975 because of poor prospects, low
status, poor financial incentives and the recurring cycle of redundancy within the industry. A second survey among engineering craftsmen leaving employers in 1978, revealed that
more than a third had left their original occupation and more than 10% were in non-engineering occupations outside the engineering industry. The same reasons explained most of the
occupational changes. As the chart shows, pay differentials between skilled and unskilled work have narrowed appreciably
in the past ten years. An improvement in relative earnings would presumably attract some skilled workers back into the
industry, but the survey results suggest that firms will also have
to tack!e the equally important issues of job security and status.
ll1 Accor�ng to a s�rvey conducted by the Manpower Services Commission only about a third o� vacancies are notified to employment offices. though the proportion varies from region to regIOn. �ro� .occupati�n to occupation and with the degree of shortage. A further difficulty is thal many me 111 �ndlvlduals registered under one occupation may be seeking. or may be willing to accept. employ In another.

Earnings and prices Price inflation has accelerated recently.
Wholesale selling prices
I�-\ I \
/' \ \ \ \ \ \ \ \ \ \ \ \ \ , ,
Earnings (whole economy)
Percentage increase on year earlier
25
- 20
- 15
- 10
1 •• 1 .• 1:.1 •• 1 •• 1 •• 1 •• 1 •• 1 •• 1 •. 1. 1977 1978 1979
Contributions to changes in retail prices June 1978 to June 1979 Housing and transport costs contributed over 40% of the rise in retail prices in the year to June 1979.
Per cent
Cl Percentage change I Contribution 10 lotal percentage change
10 15 20 25
� 10 15 20 25 --------------------
No slowdown in earnings ...
The increase in money earnings in the last pay round (i.e. over the year to July) was little different from that during stage three. Some claims have still to be settled, however-in particular that of the engineering workers, who have not reached a national agreement-and there have been a number of well-publicised commitments to further increases in the· present pay round. The rise in average earnings during the spring and early summer was held back because some settlements were delayed, and with the acceleration in retail prices this meant that for a time real earnings were probably falling. Towards the end of the round, however, the pace of settlements increased, and earnings rose by 2'12% in June and probably by a further 1 %-2% in July.
... and inflation accelerates
In the months leading up to the June Budget, the rate of increase of retail prices quickened markedly, though the change in prices over twelve months remained well below the rise in earnings (see chart). In the six months from December to June, retail prices rose by 71f2%, and the twelve-month change increased on average by half a percentage point per month, to stand at 111f2% in June. Higher housing and transport costs accounted for almost half this increase, compared with their combined weight in the retail prices index (RPI) of just over a quarter (see chart). The rise in oil prices contributed directly to the increase in transport costs-though the indirect effects on the economy generally will eventually be more important. Housing's disproportionate contribution to the rise in prices principally reflected the rapid rise in house prices, higher interest rates and the reduction in tax relief on mortgage interest payments (resulting from the cut in the basic rate of income tax announced in the Budget); these factors combined to raise the index for owner-occupiers' mortgage interest payments by 65% between June 1978 and June 1979.
The measures announced in the Budget-principally the unification of VAT at 15%, but also the higher prescription charges and the reduction in tax relief on mortgage interest noted above-may eventually add about 4% to the RP!. Over three quarters of this increase had probably fed through to the index by July. Reflecting this, the twelve-month change in prices jumped to 15'12%. This step-change in prices will probably be matched by a similarly abrupt fall in the twelvemonth change in July next year.
While the RPI provides an adequate measure of the prices of goods and services purchased by households, it does not reflect direct tax changes, which also have an important influence on post-tax spending power. With the intention of taking account of such changes, the Government has introduced the new Tax and Prices Index (TPI).[1] In contrast to the RPI, the twelvemonth change in the TPI fell in July, to just over 13%, the rise in indirect taxes and the underlying rise in prices from June to July being wholly offset by the announced reductions in income tax.
The upward trend in manufacturers' output prices has accelerated, largely because of the sharp rise in commodity
[I] See Economic Trends. August 1979. page 81.
255
130
120
110
100
90
256
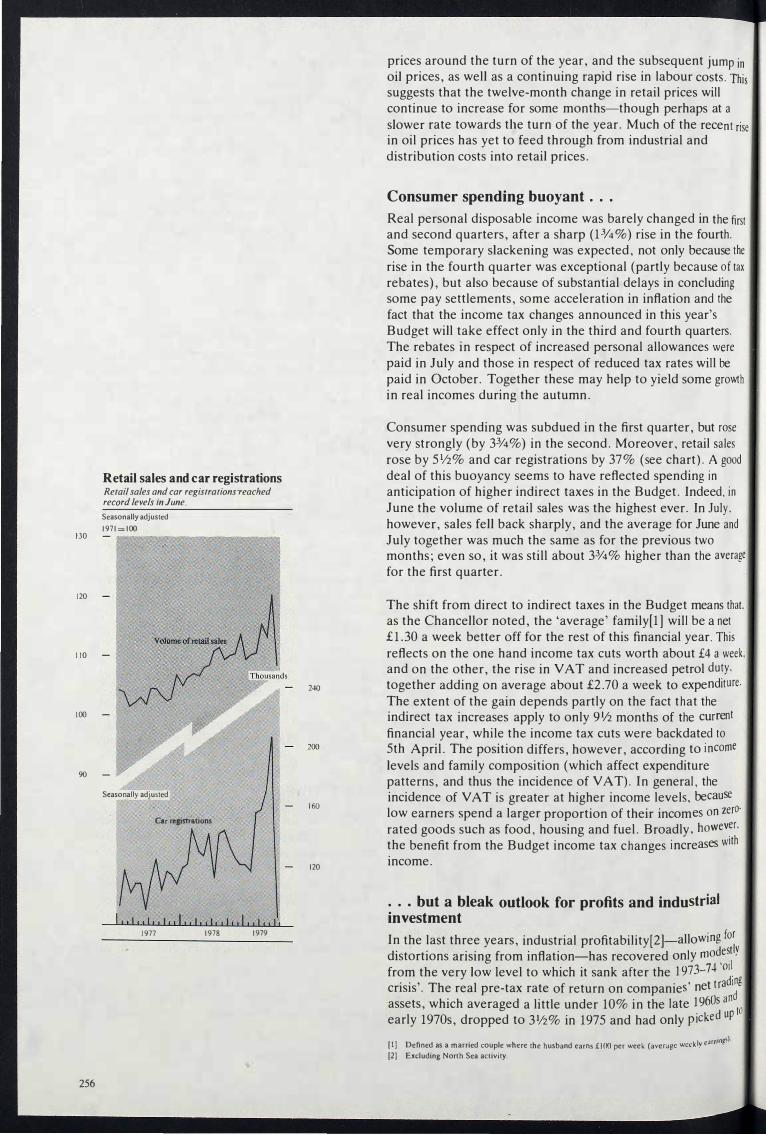
Retail sales and car registrations Retail sales and car registrations'reached record levels in June.
Seasonally adjusted
197 1= 100
Seasonally adjusted
Car registrations
1 • .1,,1 •• 1 •• 1.,1,.1,.1,,1 . .( •. 1, 1977 1978 1979
240
160
120
prices around the turn of the year, and the subsequent jump in oil prices, as well as a continuing rapid rise in labour costs. This suggests that the twelve-month change in retail prices will continue to increase for some months-though perhaps at a
slower rate towards tlJe turn of the year. Much of the recen t rise in oil prices has yet to feed through from industrial and distribution costs into retail prices.
Consumer spending buoyant ...
Real personal disposable income was barely changed in the first and second quarters, after a sharp (13/4%) rise in the fourth. Some temporary slackening was expected, not only because the rise in the fourth quarter was exceptional (partly because of tax rebates), but also because of substantial delays in concluding some pay settlements, some acceleration in inflation and the fact that the income tax changes announced in this year's Budget will take effect only in the third and fourth quarters. The rebates in respect of increased personal allowances were paid in July and those in respect of reduced tax rates will be paid in October. Together these may help to yield some growth in real incomes during the autumn.
Consumer spending was subdued in the first quarter, but rose very strongly (by 3%%) in the second. Moreover, retail sales rose by 51f2% and car registrations by 37% (see chart). A good deal of this buoyancy seems to have reflected spending in anticipation of higher indirect taxes in the Budget. Indeed, in June the volume of retail sales was the highest ever. In July, however, sales fell back sharply, and the average for June and July together was much the same as for the previous two months; even so, it was still about 3%% higher than the average
for the first quarter.
The shift from direct to indirect taxes in the Budget means that, as the Chancellor noted, the 'average' family[1] will be a net £ 1.30 a week better off for the rest of this financial year. This
reflects on the one hand income tax cuts worth about £4 a week ,
and on the other, the rise in V A T and increased petrol duty, together adding on average about £2.70 a week to expenditure.
The extent of the gain depends partly on the fact that the indirect tax increases apply to only 91/2 months of the current
financial year, while the income tax cuts were backdated to 5th April. The position differs, however, according to income
levels and family composition (which affect expenditure patterns, and thus the incidence of V A T). In general, the incidence of VAT is greater at higher income levels, because
low earners spend a larger proportion of their incomes on zero'
rated goods such as food, housing and fuel. Broadly, however,
the benefit from the Budget income tax changes increases with
income.
... but a bleak outlook for profits and industrial
investment
In the last three years, industrial profitability[2]-allowing for
distortions arising from inflation-has recovered only modestly
from the very low level to which it sank after the 1973-74 'od crisis'. The real pre-tax rate of return on companies' net tradl�g
assets, which averaged a little under 10% in the late 1960s an early 1970s, dropped to 31f2% in 1975 and had only picked up
III Defined as a married couple where the husband earns £100 per week (average weekly earningS).
[2) Excluding North Sea activity.

Company profitability laJ
Profitability has weakened since the end of last year.
Seasonally adjusted Logarithmic scale
Seasonally adjusted
£ billions
Per cent
III dill I I 1 " I 1 1 I1 till 1 1 I1 1974 1976 1978
lal Excludes North Sea activities.
Manufacturing investment Manufacturing investment may weaken from now on.
/ /
£ billions (1975 prices)
[al / •••••••.••
.• [bJ
A#// .. "' / ' .. ./
-L_�I ������.�I_ _ 1974 1976 1978 1980 la] Including leased assets. Ib] The forecast for 1979 and 1980 is from the Department of Industry investment intentions
Survey of June 1979.
4.0
3.5
3.0
2.5
2.0
1.5
1.0
10
5.0
4.5
4.0
3.5
about 41f2% by 1978. Moreover, income gearing-broadly, the proportion of companies' income pre-empted by interest payments-remains appreciably higher than it was at any time in the decade up to 1973; and liquidity is barely as strong as in 1973. If anything, the position of the manufacturing sector seems to be worse-especially in terms of profitability-than that of the service trades and other sectors.
From this weak base, industrial companies may now be faced with a financial squeeze as severe, if not as abrupt, as in 1974-75.There is likely to be a further erosion of real profitability; and, at least for a time, high interest rates on a growing stock of borrowing will also contribute. The first signs of a deterioration in profitability have already appeared (see chart), though the sudden weakening in profits in the first quarter must be attributed partly to strikes and to the bad weather. Three factors suggest a depressed outlook for profits and, consequently, a marked widening in the financial deficit of the company sector.
First, demand, both at home and abroad, is likely to remain subdued. The slow growth in prospect for UK export markets has already been noted, as has been the weakening of both consumers' and public spending. In addition, companies' own spending on fixed investment and stocks seems likely to decline from now on. Industrial investment in the first half of this year was 21f2% higher than in the second half of 1978, but for this year as a whole it now seems unlikely that either total industrial investment or manufacturing investment alone will rise as much as was suggested by the Department of Industry's June survey of investment intentions. Next year, investment will probably fall (see ch art) .
Secondly, cost pressures have worsened appreciably over the first half of this year. Though money wages have been rising no faster than in 1978, the advance in commodity and, particularly .. oil prices has been unexpectedly rapid. During the first half of 1979, manufacturers' buying prices rose by about 10% after more than a year of relative stability.
Thirdly, UK trading competitiveness-at least as represented by the standard measures based on costs and prices-is now weaker than at any time in the last ten years. One important factor underlying this is the chronically poor productivity performance of UK industry, which has deteriorated further in recent years. Output per man in manufacturing industry has risen by barely 1/2% a year on average over the last five years. This has been combined with pay increases in money terms which, although they may not have accelerated, have nevertheless been much higher than for many of the United Kingdom's principal competitors. Recently, too, an important factor has been the marked strengthening of the exchange rate (about 10% in effective terms since the beginning of the year).
All in all, real profitability for industrial and commercial companies outside the North Sea sector could this year fall appreciably below the 31/2% recorded in 1975.
In so far as companies remain attached to historic cost measures of performance, the full extent of this decline in profitability may not be apparent, and their resistance to excessive wage demands may be correspondingly limited. Consequently, much of the burden of adjustment will come later, in the form of
257

Export competitiveness(a] Effective cost competitiveness has nolV begun to deteriorate.
1975= 100
- �J -
S
Cunenl relative costs [cl
- � ..•
• Bank estimate for second quarter.
la] Except for �e1ative. export profitability. a downward
movem��t In a series IOdicates an improvement in competluveness.
[b] Ratio of UK export prices of manufactures (excluding erratic itc!ms) to prices of manufacturing output (excluding food. drink and tobacco).
le] Ratio ofUK normalised unit labour costs to those of competitor countries: IMF series.
Id] Effective competitiveness is a weighted avera$c of cur�ent and past rel�tive t?Osts, the w�ights bemg derived from coeffiCients In an equauon explaining the volume of manufactured exports.
258
110
100
90
120
110
100
90
80
110
100
90
reduced investment, destocking, slower dividend growth and labour-shedding. There will probably be some reaction in all these areas, but it is difficult to predict the magnitudes involved at all precisely. On the assumption that fixed investment is cut back as suggested above, and with no stockbuilding, and dividends rising only in line with inflation, the financial deficit for industrial companies which could emerge in 1979/80 could be about the same size in 'real' terms as in 1974175, i.e. roughly double in money terms. In 1980/81 the position might be no better.
Housebuilding remains depressed
House prices have risen sharply over the last year, but this has so far stimulated little recovery in private sector housebuilding after the disruptions suffered by the construction industry during the winter. In the first three months of the year, private housing starts were some 25% lower than in the corresponding period of 1978; and even after some improvement in each of the months April, May and June, total starts in the second quarter were still nearly 12% lower than a year earlier. All in all, with new work beginning on just 63,000 private dwellings in the first half of the year, the final outcome for 1979 seems likely to fall well short of the 157,000 starts achieved last year. New orders received by contractors for private dwellings have also remained depressed, and in the first four months of 1979 averaged only around 70% of the average monthly rate for 1978. One reason for this sluggishness may be that builders see a rather uncertain prospect for the availability of housing finance. High competing interest rates have put pressure on building societies' inflows. Although net advances have remained steady at around the average for 1978, in real terms (i.e. taking account of the rise in
house prices) new lending this year has fallen. Even so, there has been some erosion of the societies' liquidity: their average liquidity ratio, now 17%, is at its lowest for nearly five years. Although the societies are still at a competitive disadvantage for large deposits, the increase in the ordinary share rate on 1st August to 8%% (net of tax) should permit lending to be maintained at the same rate in nominal terms for the rest of this
year.
Public sector housebuilding was also affected by the severe winter, although new work was already declining rapidly. Total
approvals were exceptionally depressed in 1978 so that starts this year were expected to fall well short of the 107,000 achieved last year. The impact of the Budget is difficult to assess: local authorities' housing allocations have been reduced
in the current financial year, but because the effects of the winter disruption and last year's low approval rates were already leading to significant under-spending, the final outcome
may be little affected. In the first half of the year, work began
on around 38,000 public sector dwellings, while just 35,000
approvals were granted.
Overseas trade: a switch into heavy deficit
Forecasts made in the early part of this year suggested that the
current account would continue to show a surplus, at least for
the first half of the year, of about the same size as in the latter
part of 1978. In the event, a deficit of over £2 billion was , recorded in the first half of 1979 (see table). This deterioratIOn
reflected a widening of the visible trade deficit from about £Od4 billion in the second half of last year to about £2.7 billion, an a

Current balance
!millions: seasonally adjusted
1977
Year
Visible balance - 1 ,744 ,/which:
Oil balance -2, 791 SNAPS balancela] - 59 Underlying non·oil balance +1,106
Invisible balance +2,037
Cumnt balance + 293
1978
Year
- 1 , 175
-2,015 + 322
+ 518
+2.207
+ 1 ,032
1979
3rd 4th 1st 2nd qtr qtr qtr qtr
-367 - 39 -1 .600 -1 .100
-501 -480 - 237 - 210 - 38 +213 }
- 1,363 - 890 +172 +228
+666 +653 + 439
+299 +614 - 1 , 161 - 1 , 100
[.] Ships, North Sea production installations. aircraft and precious stones.
Import competitiveness [a]
Both cost and price competitiveness have lVorsened in the last six months.
1975= lOO
Cunenl relative COSI4 [cl .I
/'*
J1111111111111111111111111111 1 974 1 976 1978 :-Sank estimate for second quarter.
<
�
la1 � downward movement in a series indicates an lb Imp�ovement in competitiveness. } �atlo of UK prices of manufacturing output lO ImpO,rt prices of finished manufactures (excluding erratlCltems). le) Ratio orUK . .
of . normahsed unit labour costs to those
Id} co�pelJtor countries : I M F series. Effethve competitiveness is a weighted average of �
��ghrent an� past relative costs and prices, the I .ts bemgderived from coefficients in an ��ahtlon explaining the volume of imports of nlS ed manufactures.
1 10
lOO
90
120
1 10
l OO
90
80
1 1 0
l OO
90
weakening of the invisibles surplus from some £1 .3 billion to £0.4 billion. Because of an industrial dispute in the Civil Service, only incomplete information is at present available in respect of an estimated £900 million of imports, but it seems that volume, rather than price, movements were mainly responsible for the worsening of visible trade.
About £ 1 billion of the difference between forecasts and outturn can be attributed to lower export volume-exports (excluding fuels) in the first half of 1979 were about 41/2% lower in volume terms than in the second half of 1978. Around half of the shortfall reflected the disruption of exports to Iran and Nigeria. On top of this, the growth of other UK export markets was probably somewhat less than expected. Again, the road haulage dispute affected exports in the first half of the year, perhaps to the extent of £200 million (net) at current prices. Although the competitive position of UK exporters has worsened somewhat in recent months (see chart on the previous page), this has probably not yet had a significant effect on export volume.
A further £ 1Y2 billion of the shortfall was due to an unexpected surge in imports. The rise in import volume between the second half of 1978 and the first half of this year is provisionally estimated to have been around 11 %. Because of the problems with the data, it is difficult to determine in which categories the sharpest rises in imports occurred, though the proportion of finished manufactures within the 'missing' imports was probably greater than in imports as a whole. On the information so far available, however, two categories stand out. Imports of road vehicles rose by over a third in volume in the first half of 1979 compared with the second half of 1978; and the volume of imports of inorganic chemicals rose by almost two thirds over the same period. The general growth in imports of road vehicles is not unexpected, though the levels reached in the second quarter were surprising. Changes in competitiveness appear to influence the volume of imports of finished manufactures more rapidly than that of exports; recent movements in prices and costs are therefore reflected to a greater extent in effective import competitiveness (see chart). The position on imports of industrial materials is less easy to understand, because these have in the past seemed to be less sensitive-both in the short run and over longer periods-to changes in competitiveness. Part of the explanation may be the effect of the oil price rises on chemicals; this benefits those producers, mainly in the United States, whose feedstock is priced below world levels. There also seems to have been heavy industrial stockbuilding of raw materials, perhaps as a response to recent exchange rate movements.
The invisible balance
First estimates for the second quarter suggest a sudden weakening in the invisible account, to rough balance, compared with a revised surplus of £439 million in the first quarter. On the other hand, the surplus for 1978 has now been revised upwards by £0.6 billion to £2,2 billion (see below).
Most of the deterioration in the second quarter was in interest, profits and dividends. While the strength of the pound depressed the sterling value of foreign currency receipts, payments rose considerably: overseas oil companies' profits were boosted by the rise in oil prices, and payments on public sector borrowing overseas and on sterling liabilities also rose
259

Capital ftows £ millions: not seasonally adjusted
1978 1979
3rd 41h Jst 2nd qtr qtr qlr qlr
Current balance +441 + 596 - 1 ,241 - 1 ,003
Official sterling balances: Countries + 1 - 181 + 135 + 155 International or�anisations + 8 + 124 + 6 - 63
Private sterling ha ances + 1 59 +356 + 474 + 347 Overseas investment in UK
public sector - 13 - 50 + 226 + 67 Olher capilal flows (nel) -386 -860 + 1 .085 + 1 .255
8aJance for official financing +210 - 15 + 685 + 758
External ftows to the non-bank private sector £ millions: not seasonally adjusted
External and foreign currency finance (columns 8.9 and 10 of Table 1 1 . 3 in the statistical annex)
plus: UK bank lending in sterling
to overseas Increase in private sector
foreign currency deposits net of foreirc currency borrowing Tom UK banks
Increase in public sector foreign currency deposits
Non·bank private sector balance
1978
3rd qtr
+ 10
+ 46
-320
- 37
41h qtr
- 29
+ 73
- 8
+ 43
1979
1st qtr
-
-
-
+
493
76
441
1 0
2nd qtr
- 193
- 25
+244
+ 4
.( payments [aJ -301 + 79 - 1 ,000 + 30
(al Also includes net contribution to the PSBR of public sector external transactions (payment overseas -) and some investment overseas by UK banks (increase in investment + ) .
260
sharply. In addition, the government transfers and services deficit worsened; not only was there an upturn in UK contributions to the EEC budget, but aid payments and military expenditure abroad also rose.
The private sector services balance declined slightly. Despite some improvement in miscellaneous services, most other components continued to weaken, probably because of some loss of competitiveness.
The latest figures for past years contain significant revisions, particularly for 1978; the invisibles surplus for last year is now put at £2.2 billion, against £ 1.4 billion in March and £1.6 billion in June. The likelihood of revisions was discussed in a n earlier Bulletin [1] and is analysed further in the August 1979 edition of Economic Trends, page 109. The revisions in 1978 were especially large and were spread across the whole invisibles account.
Capital flows and the relaxation of exchange control
The large current account deficit in the first half of the year was more than matched by capital inflows (see table). While private
sterling balances rose rapidly and there were net overseas purchases of gilt-edged stocks, there were also substantial net inflows to the non-bank private sector. The second table shows an estimate of the combined flow to the non-bank private sector on both current and capital accounts derived from the effect on sterling MJ• In the first quarter, the non-bank private sector's balance of payments was in deficit by about £ 1 billion, reflecting the large current account deficit; net capital flows were small. In the second quarter, net capital inflows roughly matched the current account deficit, leaving the overall non-bank private sector's external position more or less in balance.
Since taking office, the Government has virtually abolished exchange controls on the financing of direct investment and has made a start on the relaxation of controls on outward portfolio
investment.[2] The likely effect of such relaxations is diffi cult to assess precisely, partly because controls have been in force for
forty years.[3] While official exchange is now freely available for
direct investment, it is likely that many companies will continue to limit their foreign currency exposure by matching overseas
assets with borrowing denominated in the same currency. Abolition of the rule requiring UK-controlled companies to
remit to the United Kingdom two thirds of post-tax earnings,
may lead to a smaller net cash inflow, although in the past some
companies have remitted a higher proportion of earnings than
was required under the exchange control rules. Portfolio investment outside the Scheduled Territories has had to be financed with investment currency or with the proceeds of
foreign currency borrowing. Neither method involves a cost to
the official reserves. Indeed, between April 1965 and December
1977 there were inflows to the reserves arising from premium
financed transactions, because of the requirement that 25% of the proceeds of disinvestment had to be sold at the official rate d of exchange. The relaxations in this area announced in June an
July are relatively modest and are not expected to lead to a
large net outflow.
[1 1 See Ihe March issue, page 1 5 . [ 2 J See also page 274. [3) Apart from a brief period in the 1950s when controls on direct investment were relaxed.

Net public sector foreign borrowing ra)
S billions 1974 1975 1976 1977 1978 1979rb)
HM Government 1 .4 0.8 2.8 4.1 - 1 .8 - 1 . 1 Other public sector 2.9 0.8 3.2 1 .7 -0.9 -0.3 o[which: under tM achange
cover scheme 2.5 0.8 3.3 0.4 -0.7 -0.2
4.3 1 .6 6.0 5.8 -2.7 - 1 .4
ra) Foreign borrowing in this context is as described in the additional noles to Table 16.2 in the statistical annex, Le. it includes all external borrowings but excludes domestic securities which may have been bought by non-residents.
Ib) fusl balf.
Monetary objectives The recent grolVth of sterling MJ has been a /il/le abave the announced targets.
Seasonally adjusted Percentage change since mid-October 1978
n Slerling M, Oclober 1978 targel � Sterling Ml June 1979 target
1 4
1 2
1 0
4
External debt management
The Government's policy of reducing the total external debt outstanding and of smoothing the 'hump' of repayments was carried further in the first half of 1979 (see table). Total debt outstanding was reduced from $23.3 billion to $22.0 billion, and the proportion falling due for repayment during the 'hump' between 1979 and 1984 fell from 69% to 62%.[1] This chiefly resulted from further early repayments, notably of $ 1 billion to the International Monetary Fund in April, $0.5 billion by the Electricity Council in March and April and $0.25 billion by the Greater London Council in June (with a further $0.25 billion in July). In all, early repayments totalled $ 1.8 billion in this period, while a further $0.8 billion of scheduled repayments were also made. New borrowing was $1. 1 billion, of which $0.8 billion came from the European Investment Bank and the European Coal and Steel Community, and a further $0.3 billion from the British Gas and Post Office commercial paper issues in New York.
Monetary developments
The pace of monetary growth accelerated last winter to a rate above that implicit in the previous Government's target. It has remained fairly strong, along the top of the new 7%-11 % target range in recent months (see chart). From mid-October to midAugust, sterling M3 grew at an annual rate of some 121j2%, with both narrower and wider measures of monetary growth showing continued buoyancy. The main reason was a sharp increase in bank lending to the private sector, which, despite high nominal interest rates, rose at an annual rate of more than 20% over these ten months. For part of this period, the public sector borrowing requirement (PSBR) was also running rather above both the average for 1978179 as a whole and the rate implied by the projected outcome for 1979/80 (£81/4 billion). Heavier government borrowing was, however, broadly matched by substantial sales of public sector debt, so that the net expansionary effect of public sector transactions on domestic credit expansion (DCE) was small (see table overleaf). The effect of external and foreign currency flows on the money supply over these ten months was slightly contractionary, despite a sizable increase in the reserves.
The Budget included measures to restrain the rate of monetary growth. Minimum lending rate (MLR) was increased by two percentage points, to 14% , primarily to moderate bank lending but also to maintain financial conditions in which large sales of public sector debt could be continued. The fiscal measures were designed to bring the PSBR down during the course of the year, though they will not have their full effect on the public sector's cash flow for some time. The effect of higher interest rates on demand for bank credit is also likely to be subject to a considerable lag.
In the meantime, the rate of growth of sterling M3 was somewhat more rapid than that indicated by the present monetary target. Bank lending remained the major factor, and although lending grew more slowly in July, the rebound in August suggests that the underlying demand for credit is still strong. Moreover, in addition to recorded lending, increasing pressure from the supplementary special deposits scheme
rl) See Table 16.2 in Ihe stalistical annex.
261

DCE and the money stockla] £ miJlions: sea.sonally adjusted
Apr. 78- July 78- act. 78- Jan. 79- Apr. 79-Mid-month July 78 act. 78 Jan. 79 Apr. 79 July 79
Central sovemment +2.049 +2.162 +2.239 +2.082 +2.889 borrowing re1uirement
Net purchases -) of central �overnment debt by non- ank private
- 2.262 - 1 .412 - 1 .982 -3.579 -2.813 sector Other public sectorlb] + 156 - 552 + 366 + 766 + 37 Bank lending to:
+ 1 .400 +2.393 +2 .226 UK private sectorlc] + 1 .725 + 724 Overseas + 158 4 + 82 - l ID - 14
Domestic credit ellpansion + 1,826 + 918 +2, 105 + 1 ,552 +2.325 External and foreign
currency finance 22 62 4% 1 5 1 (increase - ) - 157 - + - -
Other - 80 - 325 - 155 - 271 - 4 1 6
Sterling MJ + 1 ,589 + 571 +2,012 + 785 + 1 .758 Percentage change in
3.4 1.2 4.1 1.6 3.4 sterling M3 + + + + + MJ + 885 + 636 + 841 + 1 ,015 + 468 Percentage change in M 1 + 3.8 + 2.6 + 3.4 + 3.9 + 1 . 7
la] Further details are shown in Table 11 in the statistical annex. Ibl Contribution to the PSBR by the rest of the public sector. less purchases of
local authority and public corporation debt by the non-bank pnvate sector. Ic] Including commercial bills held by the Issue Department of the Bank of
England.
262
encouraged further disintermediation through acceptances. [ l ] During the three months to mid-July, this 'leak' expanded by some £400 million, and there was a further increase of about £300 million in August. Special factors (strikes and bad weather) may account for the initial acceleration of bank lending, but the company sector's continuing demand for credit probably reflects more fundamental pressure on profitability and cash flow (see page 257). A further impetus came from the sharp rise in consumer spending around the time of the Budget, although this was partly offset by repayments of borrowing by retailers.
The central government borrowing requirement (CGBR) in the three months to mid-July remained rather higher than the average implied in the forecast published with the Budget. It was unusually small in banking August, and over the next few
months it is likely that central government borrowing will become extremely erratic from one month to another, as the effects of higher indirect, and oil-related, tax receipts are offset in individual months by lump-sum repayments arising from the reductions in income tax. This in turn may cause the money stock to vary more erratically than normal from month to month during the autumn. Market borrowing by the rest of the public sector was lower in the three months to mid-July than in the previous three, though this may have partly reflected higher on-lending by the central government. The need for the rest of the public sector to borrow has been temporarily increased by the Post Office strike which has reduc;ed telecommunications receipts by around £200 million a month. The repercussions of the strike on the PSBR are likely to continue until, and even beyond, the end of the current financial year.
Sales of central government debt to the non-bank private sector during the three months to mid-July were £2.9 billion, not far
short of the £3 .6 billion achieved during the previous three months. In particular, the authorities continued to make substantial net sales of gilt-edged stocks (£2 .6 billioncompared with £2 .4 billion in the previous three months) , and calls on new issues made during the period have sustained a
continuing high rate of cash receipts in August and early September. On the other hand, sales of certificates of tax deposit were negligible, with surrenders to meet petroleum revenue tax in May and advance corporation tax in August.
Purchases fell back as rates became less competitive. Net receipts from national savings were also lower. External factors
were slightly contractionary over the three months to mid-July.
and ... ery much so in August.
After a fall in both the total and in the main components of MI in the previous two months, there was a sharp increase during
banking July, followed by a small fall in August. The underlYIng
growth of MI and its components now seems to be somewhat
slower than during the winter and spring, when it had been . significantly above what might have been expected on the baSIS
of earlier econometric studies. These suggested that a rise In
nominal interest rates during 1 978 would have reduced its rate
of growth significantly below that of nominal incomes.
Reserve assets and the 'corset'[2] .
The banks remained well within the penalty-free limit under the
supplementary special deposits scheme during the winter and
1 1 ] See December 1978 Bulletin. page 499. [2J These paragraphs are based on non-seasonally-adjusted figures.

early spring, but their interest-bearing eligible liabilities (IBELs) rose sharply in May and further in June; they fell back somewhat in July, but rose again in August. This tightening of their position under the scheme reflected the continuing buoyancy of lending, a slower rate of growth of non-interestbearing eligible liabilities and also the continued rapid growth of non-resident sterling balances, which are included within eligible liabilities but not in sterling M3• Thus, during the summer, a number of banks were at times above or very close to their limits.
The banks were not able to offset the pressure from the 'corset' by placing significantly more funds on a not-at-call basis with the discount houses-which would qualify as an offset against deposits in the calculation of their IBELs-since reserve asset pressure remained tight during the period, with the CGBR being broadly financed by sales of public sector debt. Indeed, the pressure on reserve assets became at times so great that market interest rates were forced up out of line with MLR. In consequence, the authorities once again varied the rate of call for special deposits (see page 267), in order to relieve pressure on short-term interest rates and on the banks' reserve asset positions.
Assessment It is now widely expected that the world economy will move into some degree of recession-that output in the United States next year will show a fall, and that growth in the other industrial economies will slow down. It has been less clearly recognised that the situation in prospect will contain some unusually intractable elements. Governments, both in this and other countries, are likely to have less room for manoeuvre in their economic policy than in the past-and less, perhaps, than is widely assumed. It also needs to be recognised that the industrial outlook, in this country at least, could be much affected by how people-employers and workers-react to the developing situation.
Before the latest round of oil price increases, the prospect seemed to be for a slowdown in the United States, but for a satisfactory, though moderate, expansion of demand in other industrial countries. The world prospect has now worsened. At one level, this can be attributed to the automatic effect of higher oil prices in deflating real purchasing power in consuming countries-in the short term, at least, not offset by increased spending in producer countries. At a deeper level, it can be attributed to the fact that governments, faced with worsened inflationary trends, feel unable to take stimulatory action to offset this reduction in demand. Most countries believe that inflation is the main danger, and that such action would exacerbate it; that, in turn, would be likely to discourage private spending. Stimulatory action, if it were taken, would therefore seem unlikely to have the desired effect, and in present circumstances could be largely dissipated in higher inflation.
At the most fundamental level, both the inflation now in prospect, and the slow growth likely to accompany it, can ultimately be attributed to the rigidity of the relative price and wage structure of industrial countries-a rigidity at least as marked in the United Kingdom as elsewhere. If the increase in
263

264
one important price were less liable to provoke a rise in the general level of prices than is now the case, the situation would be very much easier to handle. Indeed, unless this rigidity can be softened, it may be difficult to look forward with any confidence to a resumption of world expansion at a reasonably satisfactory rate.
In this country, the effectiveness of economic policy is further restricted by poor performance on the supply side. In the last eighteen months, total spending has expanded fairly sharply. Consumer spending, which rose rapidly, has been the predominant force, although private investment has also risen, while exports were on an expanding trend until this was interrupted in the first half of this year. The supply response to this increase in demand has taken a particularly disturbing form.
Only about one third of the increased demand was met by domestic output. Excluding North Sea production, output rose slowly and in the case of manufacturing industry scarcely at all. Most of the increase in demand was met by higher imports. Moreover, in spite of the slow pace of output, the labour market seems to have become tighter: throughout the last eighteen months unemployment has been falling and, until recently, unfilled vacancies rising; and shortages of labour, though not universal , are widespread. The growth of productivity, which has been very poor for the last five years, seems-temporarily at least-to have weakened even further.
The present prospect is that the recent very slow growth in output in this country will fall away. But much will depend on how rapidly inflation is contained, and on the response of the economy, more generally, to the new situation. For example, forecasts made in the Bank suggest that unless there is a good response, GDP will fall next year , and that unemployment could begin to rise again. The volume of consumer spending may show little further rise; and business spending, both on fixed investment and on stocks, seems likely to be curtailed .
With little growth in world trade, and with difficult competitive conditions, exports are likely to grow only slowly. The current balance of payments, after the large deficit of the first half of
this year, may, however, return to approximate balance.
A special factor recently has been the strength of the exchange
rate. This is a powerful force moderating the rise in prices, at a time when world commodity prices have been rising steeply.
But until the slower rate of price increase is reflected more . generally in costs, it is also creating difficulties for exporters ID
world markets and at the same time encouraging higher imports. The strength of sterling has been due to several factors. Nominal interest rates are relatively high in this country-for reasons of domestic monetary control. Sterling,
well as being affected by the weakening of the US dollar, .has
also been greatly strengthened by this country's approachIllg
self-sufficiency in oil supplies-plainly a factor which will
continue.
Given the prospects for demand, the financial position of
industrial and commercial companies seems likely to come. under further pressure in the course of next year. Compantes ,
however, may be now more prepared than they were in
somewhat similar circumstances in 1 974 . Moreover, to the

extent that they are able to secure early moderation in pay settlements, they will be able to mitigate difficulties that lie ahead. Nevertheless, real rates of return on investment are already low. In the face of a renewed deterioration of their financial position-and, more fundamentally, profitabilitymany companies could be confronted with increasing pressures to cut back their labour force and their investment expenditure.
The room for manoeuvre in economic policy will-in this as in other countries-inevitably continue to be circumscribed until inflationary tendencies have been substantially reduced. The first priority must clearly be to reduce inflation. Measures to increase demand would stand to be largely frustrated by a continuation of strong inflationary pressures; and could not be envisaged until such pressures have been contained, and until there is evidence also of improvement in the response of the supply side of the economy. The maintenance of monetary control-necessary for the reduction of inflation-is also likely to require the continuance of high interest rates until the rate of inflation becomes lower. The resolution of the difficulties facing the economy depends therefore not only on economic policy, but-more perhaps than has been customarily accepted---on the reaction of management and unions.
For the situation that develops may, as already suggested, depend very much on how people react to the problems which industry will face. The difficulties could be greatly eased if either-or preferably both-of two things happen; if wage increases stay low, or if productivity is greatly improved. If wage increases are small, the process of bringing inflation down will be quicker, and will be achieved at less cost in terms of output and employment. It is clear, however, that what is relevant here is labour costs per unit of output. The economic situation would be transformed if a much higher level of productivity could be achieved; and because, over wide areas, productivity is now so very low, the possibilities for improvement are great indeed. Where sufficient productivity gains are assured, pressure on labour costs could be reduced even if pay settlements were quite sizable. That way of keeping wage costs down would clearly be more beneficial all round-both in the economy at large, and in individual firms. The future of some individual firms, and thus of the jobs they provide, could well depend on the willingness of all who work in them to co-operate in keeping down wage costs and getting better results as regards efficiency and competitiveness.
The relative industrial decline of this country, is now widely seen as a matter of grave concern. If allowed to continue, it would seem only too likely to lead to growing impoverishment and unemployment in years to come. To get the economy back to a healthier state-to re-establish stability and regain the conditions for resumed expansion-will require, not only continued firmness in monetary policy, but changes in attitude in the country generally. The more fully this is recognised the earlier economic recovery is likely to be.
265