qiang huang statistical predictive modeling hadis nouri ... · qiang huang daniel j. epstein...
TRANSCRIPT
Qiang HuangDaniel J. Epstein Department of Industrial and
Systems Engineering,
University of Southern California,
Los Angeles, CA 90089
e-mail: [email protected]
Hadis NouriDaniel J. Epstein Department of Industrial and
Systems Engineering,
University of Southern California,
Los Angeles, CA 90089
Kai XuDaniel J. Epstein Department of Industrial and
Systems Engineering,
University of Southern California,
Los Angeles, CA 90089
Yong ChenDaniel J. Epstein Department of Industrial and
Systems Engineering,
University of Southern California,
Los Angeles, CA 90089
Sobambo SosinaDepartment of Statistics,
Harvard University,
Cambridge, MA 02138
Tirthankar DasguptaDepartment of Statistics,
Harvard University,
Cambridge, MA 02138
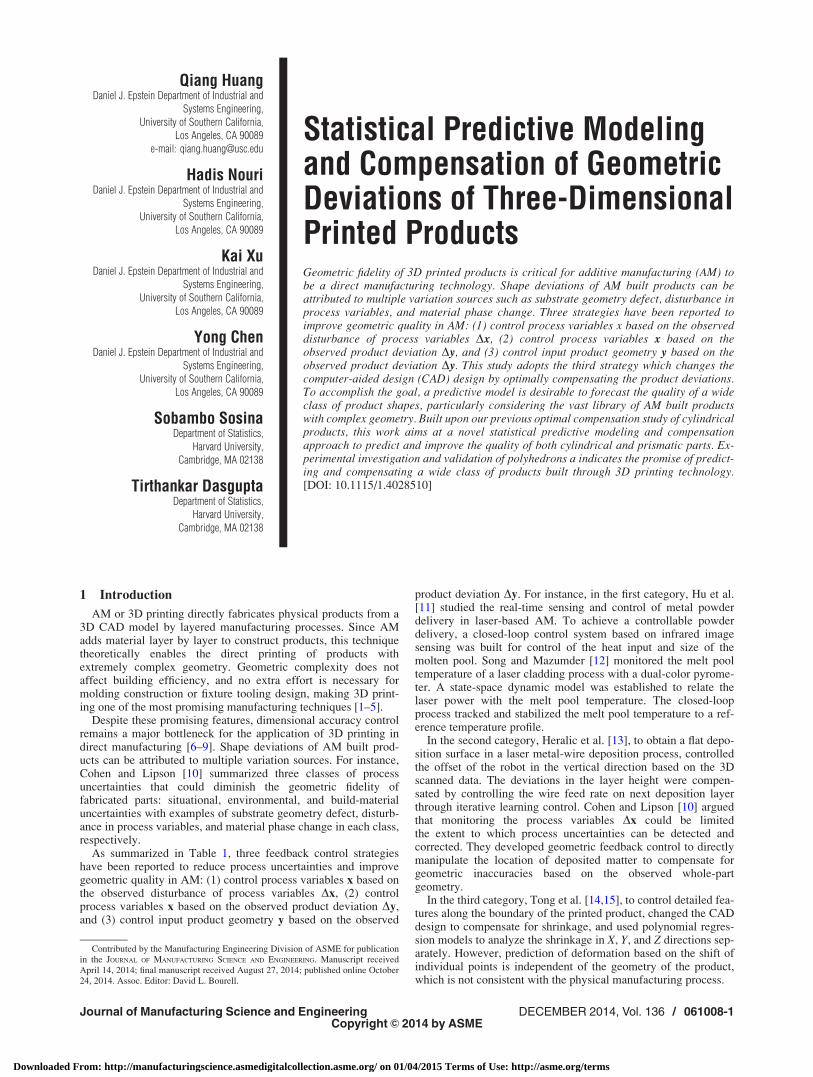
Statistical Predictive Modelingand Compensation of GeometricDeviations of Three-DimensionalPrinted ProductsGeometric fidelity of 3D printed products is critical for additive manufacturing (AM) tobe a direct manufacturing technology. Shape deviations of AM built products can beattributed to multiple variation sources such as substrate geometry defect, disturbance inprocess variables, and material phase change. Three strategies have been reported toimprove geometric quality in AM: (1) control process variables x based on the observeddisturbance of process variables Dx, (2) control process variables x based on theobserved product deviation Dy, and (3) control input product geometry y based on theobserved product deviation Dy. This study adopts the third strategy which changes thecomputer-aided design (CAD) design by optimally compensating the product deviations.To accomplish the goal, a predictive model is desirable to forecast the quality of a wideclass of product shapes, particularly considering the vast library of AM built productswith complex geometry. Built upon our previous optimal compensation study of cylindricalproducts, this work aims at a novel statistical predictive modeling and compensationapproach to predict and improve the quality of both cylindrical and prismatic parts. Ex-perimental investigation and validation of polyhedrons a indicates the promise of predict-ing and compensating a wide class of products built through 3D printing technology.[DOI: 10.1115/1.4028510]
1 Introduction
AM or 3D printing directly fabricates physical products from a3D CAD model by layered manufacturing processes. Since AMadds material layer by layer to construct products, this techniquetheoretically enables the direct printing of products withextremely complex geometry. Geometric complexity does notaffect building efficiency, and no extra effort is necessary formolding construction or fixture tooling design, making 3D print-ing one of the most promising manufacturing techniques [1–5].
Despite these promising features, dimensional accuracy controlremains a major bottleneck for the application of 3D printing indirect manufacturing [6–9]. Shape deviations of AM built prod-ucts can be attributed to multiple variation sources. For instance,Cohen and Lipson [10] summarized three classes of processuncertainties that could diminish the geometric fidelity offabricated parts: situational, environmental, and build-materialuncertainties with examples of substrate geometry defect, disturb-ance in process variables, and material phase change in each class,respectively.
As summarized in Table 1, three feedback control strategieshave been reported to reduce process uncertainties and improvegeometric quality in AM: (1) control process variables x based onthe observed disturbance of process variables Dx, (2) controlprocess variables x based on the observed product deviation Dy,and (3) control input product geometry y based on the observed
product deviation Dy. For instance, in the first category, Hu et al.[11] studied the real-time sensing and control of metal powderdelivery in laser-based AM. To achieve a controllable powderdelivery, a closed-loop control system based on infrared imagesensing was built for control of the heat input and size of themolten pool. Song and Mazumder [12] monitored the melt pooltemperature of a laser cladding process with a dual-color pyrome-ter. A state-space dynamic model was established to relate thelaser power with the melt pool temperature. The closed-loopprocess tracked and stabilized the melt pool temperature to a ref-erence temperature profile.
In the second category, Heralic et al. [13], to obtain a flat depo-sition surface in a laser metal-wire deposition process, controlledthe offset of the robot in the vertical direction based on the 3Dscanned data. The deviations in the layer height were compen-sated by controlling the wire feed rate on next deposition layerthrough iterative learning control. Cohen and Lipson [10] arguedthat monitoring the process variables Dx could be limitedthe extent to which process uncertainties can be detected andcorrected. They developed geometric feedback control to directlymanipulate the location of deposited matter to compensate forgeometric inaccuracies based on the observed whole-partgeometry.
In the third category, Tong et al. [14,15], to control detailed fea-tures along the boundary of the printed product, changed the CADdesign to compensate for shrinkage, and used polynomial regres-sion models to analyze the shrinkage in X, Y, and Z directions sep-arately. However, prediction of deformation based on the shift ofindividual points is independent of the geometry of the product,which is not consistent with the physical manufacturing process.
Contributed by the Manufacturing Engineering Division of ASME for publicationin the JOURNAL OF MANUFACTURING SCIENCE AND ENGINEERING. Manuscript receivedApril 14, 2014; final manuscript received August 27, 2014; published online October24, 2014. Assoc. Editor: David L. Bourell.
Journal of Manufacturing Science and Engineering DECEMBER 2014, Vol. 136 / 061008-1Copyright VC 2014 by ASME
Downloaded From: http://manufacturingscience.asmedigitalcollection.asme.org/ on 01/04/2015 Terms of Use: http://asme.org/terms

For complete control of all local features around the perimeterof a AM built part, Huang et al. [8] established a generic approachto model and predict part deviations and subsequently derived anoptimal compensation plan to achieve dimensional accuracy. Theessence of this new modeling approach is to transform in-plane(x–y plane) geometric errors into a functional profile defined onthe polar coordinate system (PCS). This representation decoupledthe geometric shape complexity from the deviation modeling anda generic formulation of shape deviations can thus be achieved.The developed approach was demonstrated both analytically andexperimentally in a stereolithography process (SLA). Experimen-tal results demonstrate the ability of the proposed compensationapproach to achieve an improvement of one order of magnitude inreduction of geometric errors for cylindrical products. However,this study did not demonstrate how the established method can beextended to noncylindrical products.
Huang et al. [9] attempted to connect the model for cylindricalshape with the model for polygon shapes in a unified modelingframework. The proposed model contains a basis function for cy-lindrical shape and a cookie-cutter basis function to carve out thepolygon shape from the cylindrical shape. Experimental and ana-lytical studies of square, pentagon, and dodecagon shapes wereconducted to verify the unified model. However, the model fittingresults, though good for square and pentagon shapes, needimprovement for polygons with large number of sizes. In addition,individual models were fitted for each shape in Ref. [9], asopposed to a single integrated model. No compensation studieswere provided to validate the proposed models.
This study follows the work in Refs. [8] and [9] to establish ageneric system-level approach to statistically predict the qualityof a wide class of product shapes, particularly considering the vastlibrary of AM built products with complex geometry, and to com-pensate the geometric deviations of AM built products. FollowingSec. 1, Sec. 2 briefly reviews the previously developed modelingapproach and results in Refs. [8] and [9]. In Sec. 3, polygon shapedeviations are experimentally re-investigated in order to establisha consistent model beyond Ref. [9]. Section 4 presents the system-level modeling approach to predict and compensate the quality ofproduct for a wide class of products. A compensation experimentis conducted to validate for the proposed modeling method aswell. Conclusion and future work are given in Sec. 5.
2 Deviation Modeling of Cylindrical Products—
Summary of Our Previous Work
In our previous study to describe the deviation of a 3D printedproduct from its intended shape [8], we chose the PCS usingðr; h; zÞ over the cartesian coordinate system (CCS) using coordi-nates (x, y, z). As shown in Fig. 1 [8], the product is specified bythe function rðh; r0ðh; zÞ; zÞ at the boundary, and the shape devia-tion is represented as
Drðh; r0ðhÞ; zÞ ¼ rðh; r0ðh; zÞ; zÞ � r0ðh; zÞ (1)
The cartesian representation has been previously studied in the lit-erature [14,15]. It faces a practical issue of correctly identifying
shape deviation. As shown in Fig. 1(b), for a given nominal pointA(x, y, z), its final position A0 is difficult to identify after deforma-tion. A practical solution is to fix the x or y coordinate and studythe deviation of the other coordinate (Dx or Dy in Fig. 1(b)).Choice of either direction could lead to different deformationresults. Another method is to study deformation along three direc-tions separately [14,15]. But the apparent correlation of deforma-tion among the three directions cannot be captured, potentiallyleading to prediction error.
In contrast, our definition of radius deviation naturally capturesgeometric errors and is convenient for visualizing patterns, asshown in Fig. 2(a) the in-plane geometric errors of cylindricalproducts built by the SLA processes [8].
The essence of this representation is to transform in-plane (x–yplane) geometric errors into a functional profile defined on theinterval ½0; 2p�. This representation decoupled the geometric shapecomplexity from the deviation modeling, and a generic formula-tion of shape deviations can thus be achieved.
Since the ultimate goal of the third strategy of feedback con-trol is to change the CAD input r0ðh; zÞ to compensate for prod-uct deviations, we modeled the functional dependence of in-plane error Dr(h, Dr0(h)) (denoted as f(h, Dr0(h)) hereafter) on hand r0(h) as
f ðh; r0ðhÞÞ ¼ f1ðwÞ þ f2ðh; r0ðhÞÞ þ �h (2)
where function f1ðwÞ represents average deviation or trend inde-pendent of location variable h, which is often related to the volu-metric change of the product. Function f2ðh; r0ðhÞÞ is the location-dependent deformation in addition to the trend. Term �h representshigh frequency components that add on to the main harmonictrend.
We interpreted f1ð�Þ as a lower order term and f2ð�; �Þ as a higherorder component of the deviation function. With the data shownin Fig. 2, it is natural to conduct Fourier series expansion of f2ð�; �Þ
f ðh; r0ðhÞÞ ¼ cþX
k
ak cosðkhÞ þ bk sinðkhÞf g þ �h (3)
and the deviation of cylinders with various sizes at location h isgiven as
E½f ðh; r0ðhÞÞjh� ¼ x0 þ b0ðr0 þ x0Þa þ b1ðr0 þ x0Þb cosð2hÞ (4)
where x0 is a constant effect of over exposure for the process westudy, which equivalent to a default compensation x0 applied toevery angle in the original CAD model. Note that the in-plane(x–y) deformation error is of primary interest and the coordinate zis ignored.
Model (4) is fit to our data for 0:5 in:; 1 in:; 2 in:, and 3 in: radiuscylinders, and we adopt a Bayesian approach with a weakly in-formative prior for x0 of logðx0Þ � Nð0; 1Þ a priori. The posteriorpredictive distribution of the deformations generated by thismodel is presented in Fig. 2(a) (dashed lines).
The optimal compensation x�ðhÞ to reduce deviation around theperimeter of cylindrical products in SLA processes is
Table 1 Feedback control strategies in AM
Variables observed Variables actuated Sample literature
1. Process variables x Process variables x
— substrate or nozzle position — substrate or nozzle position— envelope temperature — envelope temperature Ref. [11]— deposition tool temperature — deposition tool temperature Ref. [12]— laser power — laser power— material feed rate, etc — material feed rate, etc
2. Product deviation Dy Process variables x Refs. [13,10]3. Product deviation Dy Design input of product geometry y Refs. [14,15] and [8,9]
061008-2 / Vol. 136, DECEMBER 2014 Transactions of the ASME
Downloaded From: http://manufacturingscience.asmedigitalcollection.asme.org/ on 01/04/2015 Terms of Use: http://asme.org/terms

x�ðhÞ ¼ � x0 þ bb0ðr0 þ x0Þa þ bb1ðr0 þ x0Þb cosð2hÞ1þ aaðr0 þ x0Þa�1 þ b bb1ðr0 þ x0Þb�1
cosð2hÞ(5)
This model is predictive and the validation experiment on thecompensation strategy shows that the deviation of a cylinder with2:5in: radius can be dramatically reduced (Fig. 2(b)). Note that noexperiment on the cylinder with 2:5in: is done before compensation,which demonstrates the predictability of the developed model.
3 Experimental Study of Polygon Shape Deviations
Although model (2) is quite generic and model (3) seems easilyextendable beyond cylinders, in this section we will first experi-mentally investigate the deviations of AM built products with (in-plane) polygon shapes. There are two reasons to choose polygonshapes: (1) Polygons have sharp corners causing more significantmanufacturing challenge than cylinders; (2) When the number ofpolygon sides increases, the polygon model should approach to
the cylinder model defined in Eq. (4); and (3) Combination of sec-tions of cylindrical and polygon shapes will lead to a wider classesof products. Polygon experiments, therefore, provide an opportu-nity to test the generality and validity of the proposed approach.
3.1 AM Experiments—SLA Process. The AM process usedin this work is a variant of the SLA process, called mask imageprojection SLA (MIP-SLA) [16]. As can be seen in Fig. 3, theMIP-SLA machine has liquid resin stored in a tank configuredwith a platform that can move vertically with precision. Duringthe printing process, the surface of the resin is exposed to light,which triggers the resin solidification. Control of light exposurearea and intensity is achieved through a digital micromirror device(DMD) that receives commands from the sliced cross section ofstereolithography (STL) files for each layer. The platform in thetank moves down with the predefined thickness for printing thenext layer when the previous layer is solidified. This building pro-cess is repeated until the last layer is built. MIP-SLA is considered
Fig. 1 Deformation representation under the PCS [8]. (a) Polar coordinate representation and(b) deformation under polar coordinates.
Fig. 2 In-plane error of cylindrical parts with r0 5 0:5 in:; 1 in:; 2 in:; 3 in: and validation for 2:5 in: cylinder [8]. (a) Observed andposterior predictive distribution and (b) validation result of 2:5 in. cylinder.
Journal of Manufacturing Science and Engineering DECEMBER 2014, Vol. 136 / 061008-3
Downloaded From: http://manufacturingscience.asmedigitalcollection.asme.org/ on 01/04/2015 Terms of Use: http://asme.org/terms

as an inexpensive fast AM technique, since it is capable of build-ing multiple objects simultaneously.
In this experiment, we are interested to further investigate theshape deviation of polygon parts with sharp corners. We are usinga commercial MIP-SLA platform, the ULTRA
VR
machine fromEnvisionTec, to conduct all experiments. The material used in thisprocess is SI500 resin that shrinks approximately 2% in eachphase transition. Specification of the manufacturing process isshown in Table 2.
3.2 Experimental Design and Observations. The experi-mental factors considered for polygon experiments include thenumber of sides and the size of a polygon. When the number ofsides increases, the corner angles of a polygon vary. The polygonsize is defined as the radius of its circumcircle (see examples inFig. 4). The purpose of using a circumcircle is to connect the poly-gon experiments with cylinder experiments done before.
Three polygon shapes are investigated: square, regular penta-gon, and dodecagon. As shown in Table 3, four squares with sidelengths of 1 in:; 2 in: (before and after repair), and 3 in: (with cir-cumcircle radii of 1 in:=
ffiffiffi2p
; 2 in:=ffiffiffi2p
, and 3 in:=ffiffiffi2p
), two regularpentagons with circumcircle radii 1 in: and 3 in:, and one regulardodecagon (polygon with 12 sides) with circumcircle radius of3 in: are designed and fabricated in a MIP-SLA machine. The pur-pose of fabricating a dodecagon is to check how well a model canbe generalized to different polygons and how well a polygonmodel can be approximated by a cylindrical shape when the
number of polygon sides is large. Since we discovered in Ref. [9]that the MIP-SLA machine settings were changed after repair,new experiments on cylindrical parts are also included for experi-mentation in this study with r ¼ 1 in: and 2 in.
To facilitate the identification of the orientation of test partsduring or after the building process, a nonsymmetric cross withline thickness of 0:02 in: is added on the top of them (seeFig. 4(b)). All test parts have height of 0:25 in. The 3D CAD mod-els are exported to STL format files, which are then sent to theSLA machine.
After the building process, all test parts are measured using aMicro-Vu precision machine. In order to reduce human errors, wefollow the same measuring procedure for each test part. For simplic-ity of measurement, we choose the center of the cross to be the ori-gin of the measurement coordinate system in the Micro-Vu machine.The boundary profile is fitted using the splines in the metrology soft-ware associated with the Micro-Vu machine. The obtained measure-ment data are then converted to polar coordinates for deviationmodeling and analysis. It must be noted that the part orientation iskept the same during the building and measurement processes. Fig-ures 5–7 show the measured deviation profiles (solid lines) for threekinds of polygons and cylinders presented in the PCS.
By comparing the deviation profiles of cylindrical and squareshape before and after the machine repair (Fig. 2 versus Fig. 5), itis clear that (1) the repaired the MIP-SLA machine tends to over-compensate the product shrinkage and lead to positive shape devi-ation; and (2) The systematic deviation patterns in square shapeclearly differ before and after the machine repair. Therefore, inSec. 4, we intended to identify basic deviation patterns consistentacross different shapes and provide an integrated model for pre-diction and compensation.
4 Statistical Predictive Modeling of Geometric
Deviation of AM Built Parts
Following the same notation in model (2), we denotef ðh; r0ðhÞÞ as the in-plane shape deviation of 3D printed productpresented in the PCS. The Fourier expansion of f ðh; r0ðhÞÞ, thoughworks well for the cylindrical shape, clearly encounters the
Fig. 3 An illustration of the MIP-SLA process [17]
Table 2 The specific parameters in MP-SLA process
Height of the product 0:25 in:Thickness of each layer 0:00197 in:Resolution of the mask 1920� 1200Dimension of each pixel 0:005 in:Illuminating time of each layer 7 sAverage waiting time between layers 15 sType of the resin SI500
Fig. 4 Polygon experimental design. (a) Regular polygon with circumcircle radius r and (b)irregular polygon with circumcircle radius r.
061008-4 / Vol. 136, DECEMBER 2014 Transactions of the ASME
Downloaded From: http://manufacturingscience.asmedigitalcollection.asme.org/ on 01/04/2015 Terms of Use: http://asme.org/terms

difficulty of model fitting for polygon shapes, i.e., too many high-order Fourier basis terms have to be included in order to capturethe sharp transition at the polygon vertices. There are two disad-vantages: (1) model overfitting which causes poor predictability;and (2) lack of physical insights gained from the model.
Xu et al. [18] studied the experimental data of Figs. 2 and 5 andproposed the hypothesis of shape deviation due to differentshrinkage factors along different directions. Xu et al. [18]explained the mechanism considering (i) over or under exposure,(ii) light blurring, and (iii) phase change induced shrinkage orexpansion. A shape deviation model based on shrinkage factors
was established to quantify the effects of three sources for bothcylindrical and square shapes with various sizes. The attemptassists to understand the physical insights of the AM processes.Since our objective is to control input product geometry y basedon the observed product deviation Dy, we aim at identifying thestatistical patterns in the deviation profiles, rather than the specificphysical mechanisms contributing to the deviation profiles.
4.1 Statistical Modeling Strategy. Our main strategy of con-necting the cylindrical shape model to polygon models is to treat apolygon as being cut from its circumcircle as shown in Fig. 4.This modeling strategy implies that a generic deviation profilemodel for cylinders or polygons contains at least two major basisfunctions: (1) basis model g1 for cylindrical shape deviation pro-file and (ii) basis model g2 for a cookie-cutter function. This con-cept extends our previous model in Eq. (2) into
f ðh; r0ðhÞÞ ¼ g1ðh; r0ðhÞÞ þ g2ðh; r0ðhÞÞ þ g3ðh; r0ðhÞÞ þ �h (6)
where g3 term denotes the remaining feature not captured by g1
and g2, if there is any.Following the updated model (6), we will identify g1 and g2,
respectively.
Table 3 Polygon experimental design
Cross sectiongeometry Circumcircle radius Process condition
Square r ¼ 1 in:=ffiffiffi2p
;2 in:=
ffiffiffi2p
; 3 in:=ffiffiffi2p Before machine repair
Square 2 in:=ffiffiffi2p
After machine repairRegular pentagon r ¼ 1 in:; 3 in: After repair, settings changedRegular dodecagon r ¼ 3 in: After repair, settings changedCircle r ¼ 1 in:; 2 in: After repair, settings changed
Fig. 5 Deviation profiles (solid lines) of cylinders with r0 5 1 in:; 2 in: and square shapes with side length 5 1 in:; 2 in:; 3 in: (a)Cylinders and square after repair and (b) square shapes before repair.
Fig. 6 Observed deviation profiles for pentagons. (a) Two regular pentagon deviation profiles with circumcircle radii 5 1 in., 3in. (solid lines) and (b) printed regular pentagon with circumcircle radius 5 3 in.
Journal of Manufacturing Science and Engineering DECEMBER 2014, Vol. 136 / 061008-5
Downloaded From: http://manufacturingscience.asmedigitalcollection.asme.org/ on 01/04/2015 Terms of Use: http://asme.org/terms

4.1.1 Cylindrical Basis Model. Huang et al. [8] conductedthorough investigation of the cylindrical basis model g1ðh; r0ðhÞÞ,where g1 was represented in Eq. (4) or g1ðh; r0ðhÞÞ¼ x0 þ b0ðr0 þ x0Þa þ b1ðr0 þ x0Þb cosð2hÞ. When extending thisbasis model to generic shape, there is a danger of over-parameterization, that is, the total number of unknown parametersin g1 and g2 will be more than that can be estimated from the data.Therefore, we adopt an alternative model studies in Ref. [8]
g1ðh; r0ðhÞÞ ¼ b0ra0 þ b1rb
0 cosð2hÞ (7)
A Bayesian procedure was implemented to draw inferences onall parameters b0; b1; a; b, and r. We calculated the posterior dis-tribution of the parameters by Markov Chain Monte Carlo(MCMC) and summarized the marginal posteriors by taking themean, median, standard deviation, and 2.5% and 97.5% quantilesof the posterior draws in Table 4.
Due to apparent pattern change presented in Fig. 5(a), the cy-lindrical basis model g1ðh; r0ðhÞÞ after machine repair isexpected to have different coefficients b0 and b1. On the otherhand, we tend to keep a and b as the same values in Table 4 fortwo reasons (i) ra
0 and rb0 in Eq. (7) represent the volumetric
shrinkage varying with size r0. For the same material, thechange after MIP-SLA machine repair might be small. (2) Con-cern of overparameterization limits the number of unknown pa-rameters in the model. Therefore, the cylindrical basis functionused is
Fig. 7 Observed deviation profile for a dodecagon. (a) Regular dodecagon deviation profile (solid line) with circumcircle radi-us 5 3 in. and (b) printed dodecagon with circumcircle radius 5 3 in.
Table 4 Summary of posterior draws [8]
Mean SD 2.5% Median 97.5%
b0 �0.0047 4:063� 10�5 �0.0048 �0.0047 �0.0047b1 0.0059 6:847� 10�5 0.0058 0.0059 0.0060a 1.56 0.0084 1.5498 1.566 1.5819b 1.099 0.0120 1.0755 1.099 1.1232r 0.0019 2:503� 10�5 0.00185 0.0019 0.00195
Fig. 8 Square wave functions with square, pentagon, and dodecagon deviationprofiles
061008-6 / Vol. 136, DECEMBER 2014 Transactions of the ASME
Downloaded From: http://manufacturingscience.asmedigitalcollection.asme.org/ on 01/04/2015 Terms of Use: http://asme.org/terms

g1ðh; r0ðhÞÞ ¼ b0r1:5660 þ b1r1:099
0 cosð2hÞ (8)
4.1.2 Cookie-Cutter Basis Model for Polygon Shapes. Byobserving the polygon deviation profiles before and after themachine repair, we propose two alternatives of cookie-cutter basismodels: (i) square wave model and (ii) sawtooth wave model.
Square wave mode: A square wave is a nonsinusoidal periodicwaveform in which the amplitude alternates at a steady frequencybetween fixed minimum and maximum values. One of its func-tional forms is sign½cosðhÞ� with sign½�� being a sign function.Since the number of polygon sides n should change the period ofthe square wave function, we propose the cookie-cutter functionto trim a polygon from a cylinder as
g2ðh; r0ðhÞÞ ¼ b2ra0sign½cosðnðh� /0Þ=2Þ� (9)
where /0 is a phase variable to shift the cutting position in the PCS.It is determined by the smallest angular distance from the vertex ofa polygon to the axis of the PCS. For instance, /0 is p=4 for a squareshape and ð1=2� 2=5Þp for a pentagon with a polar axis being hori-zontal in Fig. 4. Here, coefficients b2 and a are to be estimated.
We plot the cookie-cutter functions for polygons with n¼ 4, 5,6, 8, 12, and 60 sides. Meanwhile, we scale the magnitudes of thedeviation profiles observed for a square, pentagon, and dodecagonand superimpose the profiles on their corresponding cookie-cutterfunctions. As shown in Fig. 8, the cookie-cutter model in Eq. (9)perfectly captures the sharp transitions around the vertices of pol-ygons in the deviation profiles. Furthermore, when n approachesto infinity and a polygon is supposed to become a circle, thecookie-cutter function approaches to white noise. The limitingproperty makes sense.
Sawtooth wave model: An alternative cookie-cutter model issawtooth wave model. One observation from the pentagon anddodecagon deformation is the presence of some sort sawtooth-likewave form. We define the sawtooth function formally as
saw:tooth ðh� /0Þ ¼ ðh� /0ÞMOD ð2p=nÞ
where we use MOD function in the usual sense to obtain remain-ders (as in x MOD y¼ remainder of (x/y)).
Figure 9 illustrates examples of sawtooth functions. Comparingthe definition of square wave function, it is clear that sawtooth
wave function will also capture the sharp transitions around thevertices of polygons in the deviation profiles. It preserves the lim-iting property when n approaches to infinity.
To control the direction of each sawtooth (flipping upsidedown), we introduce an indicator function
Iðh� /0Þ ¼ fsign½sinðnðh� /0Þ=2Þ� þ 1g=2 (10)
The alternative cookie-cutter basis using sawtooth wave functionis therefore given as
g2ðh; r0ðhÞÞ ¼ b2ra0Iðh� /0Þsaw:toothðh� /0Þ
¼ b2ra0fsign½sinðnðh� /0Þ=2Þ� þ 1g=
2½ðh� /0ÞMODð2p=nÞ� (11)
4.1.3 Residual Pattern Along Polygon Sides. If cylindricalbasis g1ðh; r0ðhÞÞ and cookie-cutter basis g2ðh; r0ðhÞÞ cannot fully
Fig. 9 Sawtooth wave functions
Table 5 Individual model estimation for polygons
Polygon Parameter Estimate Std. Error P-value Residual r�
1 in: square b0 1.5149� 10�3 1.313� 10�4 �0 0.003207b1 5.706� 10�4 3.571� 10�4 0.11b2 2.343� 10�3 2.173� 10�4 �0b3 1.561� 10�3 1.733� 10�4 �0
2 in: square b0 �5.470� 10�3 8.924� 10�5 �0 0.002568b1 �8.053� 10�4 2.618� 10�4 0.00217b2 7.856� 10�3 1.678� 10�4 �0b3 2.071� 10�3 1.211� 10�4 �0
3 in: square b0 �9.763� 10�3 8.771� 10�5 �0 0.002597b1 �2.776� 10�3 2.640� 10�4 �0b2 1.266� 10�2 1.714� 10�4 �0b3 2.797� 10�3 1.204� 10�4 �0
1 in: pentagon b0 1.317� 10�3 2.160� 10�5 �0 0.001812b1 8.255� 10�4 3.173� 10�5 �0b2 8.739� 10�4 2.314� 10�5 �0b3 1.178� 10�3 3.245� 10�5 �0
3 in: pentagon b0 1.310� 10�2 2.062� 10�5 �0 0.002768b1 3.584� 10�4 3.158� 10�5 �0b2 2.546� 10�4 2.251� 10�5 �0b3 2.012� 10�4 3.003� 10�5 �0
3 in: dodecagon b0 1.391158� 10�2 1.496537� 10�5 �0 0.002138664b1 �1.417587� 10�4 2.089859� 10�5 �0b2 7.680937� 10�5 1.494737� 10�5 2.7925� 10�7
b3 3.338678� 10�4 2.033879� 10�5 �0
Journal of Manufacturing Science and Engineering DECEMBER 2014, Vol. 136 / 061008-7
Downloaded From: http://manufacturingscience.asmedigitalcollection.asme.org/ on 01/04/2015 Terms of Use: http://asme.org/terms
capture the patterns in the deviation profiles, we could introduceadditional g3ðh; r0ðhÞÞ term if necessary. Then individual sidesof a polygon may have a higher-order deviation pattern aftertrimming by the cookie-cutter, we could have another termcos½nðh� /0Þ� or sin½nðh� /0Þ� which also has the consistentlimiting property.
4.2 Statistical Model Estimation
4.2.1 Initial Model Fitting for Individual Polygon Shapes. Totest the proposed modeling strategy and cookie-cutter function,we first fit a statistical model for individual product shapesobserved in the experiment. Given a cookie-cutter function, e.g.,
square wave function, the model (6) can be simplified by mergingvariables as
f ðh; r0ðhÞÞ ¼ b0 þ b1cosð2hÞ þ b2sign½cosðnðh� /0Þ=2Þ�þ b3cosðnhÞ þ � (12)
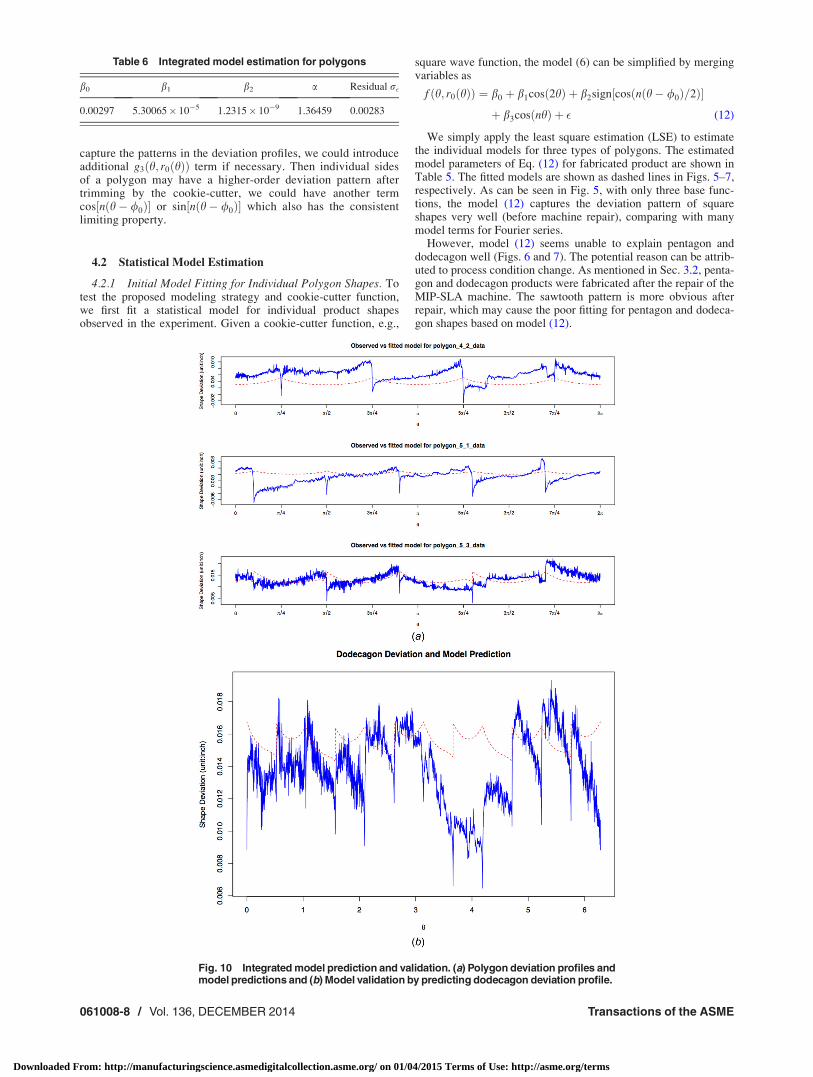
We simply apply the least square estimation (LSE) to estimatethe individual models for three types of polygons. The estimatedmodel parameters of Eq. (12) for fabricated product are shown inTable 5. The fitted models are shown as dashed lines in Figs. 5–7,respectively. As can be seen in Fig. 5, with only three base func-tions, the model (12) captures the deviation pattern of squareshapes very well (before machine repair), comparing with manymodel terms for Fourier series.
However, model (12) seems unable to explain pentagon anddodecagon well (Figs. 6 and 7). The potential reason can be attrib-uted to process condition change. As mentioned in Sec. 3.2, penta-gon and dodecagon products were fabricated after the repair of theMIP-SLA machine. The sawtooth pattern is more obvious afterrepair, which may cause the poor fitting for pentagon and dodeca-gon shapes based on model (12).
Table 6 Integrated model estimation for polygons
b0 b1 b2 a Residual r�
0.00297 5.30065� 10�5 1.2315� 10�9 1.36459 0.00283
Fig. 10 Integrated model prediction and validation. (a) Polygon deviation profiles andmodel predictions and (b) Model validation by predicting dodecagon deviation profile.
061008-8 / Vol. 136, DECEMBER 2014 Transactions of the ASME
Downloaded From: http://manufacturingscience.asmedigitalcollection.asme.org/ on 01/04/2015 Terms of Use: http://asme.org/terms

4.2.2 An Integrated Model Fitting for Polygons. The initialmodel fitting for individual polygon shapes suggests the use of saw-tooth wave function as cookie-cutter basis model after the machinerepair. In this section, we attempt to fit one integrated model (6) forall polygons fabricated after machine repair. We will use squareshape with side length 2 in. and pentagons with circumcircle radii1 in. and 2 in. to fit one model and validate the model using 3 in:dodecagon data. Specifically, the model after the machine repair is
f ðh; r0ðhÞÞ ¼ g1ðh; r0ðhÞÞ þ g2ðh; r0ðhÞÞ þ �¼ b0r1:566
0 þ b1r1:0990 cosð2hÞ
þ b2ra0Iðh� /0Þsaw:toothðh� /0Þ þ � (13)
Here, we start without high-order term g3ðh; r0ðhÞÞ.To fit this nonlinear model, we use Bayesian approach to find pa-
rameter estimation will maximize the log-likelihood function. Theoptimization routine optim() in R is implemented. The estimatedmodel parameters and residual standard deviation are given in Table 6.
The observed data and model prediction for three polygons areillustrated in Fig. 10(a). Figure 10(b) shows the prediction fordodecagon shape. Note that dodecagon data are not used in themodel training date set.
4.3 Optimal Compensation and Experimental Validation.Following the compensation method proposed in Huang et al. [8],we denote f ðh; r0ðhÞ; xðhÞÞ the profile deviation at angle h when
compensation x(h) is applied. Since x(h) is small, it is reasonablyto believe that the dynamics of the manufacturing and shrinkageprocesses remain the same under compensation as comparedto the entire process without compensation. The objective ofoptimal compensation strategy is find x�ðhÞ such thatE½f ðh; r0ðhÞ; x�ðhÞÞjh� ¼ 0.
Huang et al. [8] derived the optimal amount of compensationx�ðhÞ as
x�ðhÞ ¼ � gðh; r0ðhÞÞ1þ g0ðh; r0ðhÞÞ
(14)
where gð�; �Þ is defined as E½f ð�; �Þjh� and g0ðh; r0ðhÞÞ is the deriva-tive with respect to r0ðhÞ. Notice that the optimal compensation isnot simply apply �gðh; r0ðhÞÞ, i.e., the negative value of the ob-servation deviations.
For a polygon with n sides and circumcircle radius r0, the pre-dicted deviation gðh; r0ðhÞÞ of model (13) is
gðh; r0ðhÞÞ ¼ b0r1:5660 þ b1r1:099
0 cosð2hÞþ b2ra
0Iðh� /0Þsaw:toothðh� /0Þ (15)
and the corresponding optimal amount of compensation x�ðhÞ is
x�ðhÞ ¼ � b0r1:5660 þ b1r1:099
0 cosð2hÞ þ b2ra0Iðh� /0Þsaw:toothðh� /0Þ
1þ 1:566b0r0:5660 þ 1:099b1r0:099
0 cosð2hÞ þ ða� 1Þb2ra�10 Iðh� /0Þsaw:toothðh� /0Þ
(16)
The optimal amount of compensation x�ðhÞ for 3in: dodecagon isillustrated in Fig. 11(a). We conducted compensation experimentby applying compensation x�ðhÞ to a 3 in: dodecagon. Figure11(b) compares the deviation profiles before and after the com-pensation. The validation and compensation experiments indicatethat
• The average profile deviations are reduced from 0:01389 in:to 0:00357 in:, an average of 75% reduction is achieved. Themodeling strategy given in Eq. (6), statistical predictivemodel (13), optimal compensation model (16) are generallyrobust and predictive.
• The training data for establishing polygon model (13) and opti-mal compensation model (16) only include square and pentagonshapes. The validation experiment conducted for dodecagon istherefore not within the experimental range of polygon sides.This provides greater confidence in the model robustness.
• The deviation profile after compensation still shows system-atic patterns in Fig. 11(b). The possible aspects for modelrefinement could include: (1) improving cylindrical basismodel g1ðh; r0ðhÞÞ in Eq. (8) by collecting more cylinder dataafter machine repair and (2) introducing g3ðh; r0ðhÞÞ toimprove the prediction along polygons sides.
5 Conclusion
This study greatly extends our previous work on the modelingand optimal compensation of 3D printed products by developing aunified modeling and compensation method for cylindrical shapeand polygon shapes. The novel statistical predictive model con-sists of cylindrical basis, cookie-cutter basis, and residual patternalong polygon sides. Our experimental validation and analysisshow that this unified model, satisfying the limiting property ofpolygon shape, can predict the cylindrical shape and polygonshapes well. With training data of square and pentagon shapes, the
Fig. 11 Optimal compensation and experimental validation. (a)Optimal compensation x*(h) and (b) Dodecagon deviation pro-files before and after compensation.
Journal of Manufacturing Science and Engineering DECEMBER 2014, Vol. 136 / 061008-9
Downloaded From: http://manufacturingscience.asmedigitalcollection.asme.org/ on 01/04/2015 Terms of Use: http://asme.org/terms

statistical model and optimal compensation model successfullypredicted and compensated roughly 75% of the deviation of adodecagon shape. The robustness and predictability of the model-ing and compensation strategy can be further enhanced byimproved model fitting and more experimental data. The developedstatistical modeling and compensation methods hold the promise toextend the study to wider classes of AM built products.
Acknowledgment
The work of Professor Huang and Chen was supported byOffice of Naval Research with Grant No. N000141110671. Thework of Dasgupta and Sosina was partially supported by NSFgrant number CMMI 1334178.
References[1] Gibson, I., Rosen, D., and Stucker, B., 2009, Additive Manufacturing Technolo-
gies: Rapid Prototyping to Direct Digital Manufacturing, Springer Verlag,New York.
[2] Hilton, P., and Jacobs, P., 2000, Rapid Tooling: Technologies and IndustrialApplications, CRC, New York.
[3] Melchels, F., Feijen, J., and Grijpma, D., 2010, “A Review on Stereolithogra-phy and Its Applications in Biomedical Engineering,” Biomaterials, 31(24), pp.6121–6130.
[4] Campbell, T., Williams, C., Ivanova, O., and Garrett, B., 2011, Could 3D Print-ing Change the World? Technologies, Potential, and Implications of AdditiveManufacturing, Atlantic Council, Washington, DC.
[5] Pan, Y., Zhou, C., Chen, Y., and Partanen, J., 2014, “Multitool and Multi-AxisComputer Numerically Controlled Accumulation for Fabricating ConformalFeatures on Curved Surfaces,” ASME J. Manuf. Sci. Eng., 136(3), p. 031007.
[6] Navangul, G., Paul, R., and Anand, S., 2013, “Error Minimization in LayeredManufacturing Parts by Stereolithography File Modification Using a VertexTranslation Algorithm,” ASME J. Manuf. Sci. Eng., 135(3), p. 031106.
[7] Paul, R., Anand, S., and Gerner, F., 2014, “Effect of Thermal Deformation onPart Errors in Metal Powder Based Additive Manufacturing Processes,” ASMEJ. Manuf. Sci. Eng., 136(3), p. 031009.
[8] Huang, Q., Zhang, J., Sabbaghi, A., and Dasgupta, T., 2014, “Optimal OfflineCompensation of Shape Shrinkage for 3D Printing Processes,” IIE Trans. Qual-ity Reliability (in press).
[9] Huang, Q., Nouri, H., Xu, K., Chen, Y., Sosina, S., and Dasgupta, T., 2014,“Predictive Modeling of Geometric Deviations of 3D Printed Products—A Uni-fied Modeling Approach for Cylindrical and Polygon Shapes,” Finalist of BestApplication Paper, the Tenth IEEE International Conference on AutomationScience and Engineering (CASE 2014), Taipei, Taiwan, Aug. 18–22, pp.25–30.
[10] Cohen, D. L., and Lipson, H., 2010, “Geometric Feedback Control of Discrete-Deposition Sff Systems,” Rapid Prototyping J., 16(5), pp. 377–393.
[11] Hu, D., Mei, H., and Kovacevic, R., 2002, “Improving Solid Freeform Fabrica-tion by Laser-Based Additive Manufacturing,” Proc. Inst. Mech. Eng., Part B.,216(9), pp. 1253–1264.
[12] Song, L., and Mazumder, J., 2011, “Feedback Control of Melt Pool Tempera-ture During Laser Cladding Process,” IEEE Trans. Control Syst. Technol.,19(6), pp. 1349–1356.
[13] Heralic, A., Christiansson, A.-K., and Lennartson, B., 2012, “Height Control ofLaser Metal-Wire Deposition Based on Iterative Learning Control and 3DScanning,” Opt. Lasers Eng., 50(9), pp. 1230–1241.
[14] Tong, K., Joshi, S., and Lehtihet, E., 2008, “Error Compensation for FusedDeposition Modeling (FDM) Machine by Correcting Slice Files,” Rapid Proto-typing J., 14(1), pp. 4–14.
[15] Tong, K., Lehtihet, E., and Joshi, S., 2003, “Parametric Error Modeling andSoftware Error Compensation for Rapid Prototyping,” Rapid Prototyping J.,9(5), pp. 301–313.
[16] Zhou, C., Chen, Y., and Waltz, R. A., 2009, “Optimized Mask ImageProjection for Solid Freeform Fabrication,” ASME J. Manuf. Sci. Eng., 131(6),p. 061004.
[17] Pan, Y., Chou, Z., and Chen, Y., 2012, “A Fast Mask Projection Stereolithogra-phy Process for Fabricating Digital Models in Minutes,” ASME J. Manu. Sci.Eng. 134(5), p. 051011.
[18] Xu, L., Huang, Q., Sabbaghi, A., and Dasgupta, T., 2013, “Shape DeviationModeling for Dimensional Quality Control in Additive Manufacturing,” ASMEPaper No. IMECE2013-66329.
061008-10 / Vol. 136, DECEMBER 2014 Transactions of the ASME
Downloaded From: http://manufacturingscience.asmedigitalcollection.asme.org/ on 01/04/2015 Terms of Use: http://asme.org/terms