qnb group united arab emirates economic insight 2013
TRANSCRIPT

Qatar National Bank S.A.QP.O. Box 1000Doha, Qatar
Tel: (+974) 4440 7407Fax: (+974) 4441 3753
qnb.com.qa
UAE Economic Insight2013
1
Contents
Executive Summary
Background 2
Recent Developments 3
Macroeconomic Outlook 5
Key Macroeconomic Indicators 7
A. Recent Macroeconomic Developments (2012)
Real GDP registered the strongest growth (4.4%) since
2006. This was driven by an expansion in oil and gas (6.3%)
and a recovery in the non-oil sector (3.5%), particularly in
real estate and business services (6.3%). On the demand
side, there was particular strength in private consumption
(9.4%) and investment (12.5%). Inflation was subdued at
0.7%, kept low by a third year of falling rents.
The 2012 fiscal outturn is not yet available, but we estimate
that a significant consolidation (3% of GDP) has taken place
in capital expenditures. This, together with stronger oil
exports, is estimated to have boosted the consolidated
national surplus to 5.9% of GDP.
The current account surplus rose to 17.3% of GDP, given
higher oil and non-oil exports.
The banking sector witnessed deposits growing at their
strongest pace since 2008 (8.6%). However, lending growth
was more muted (3.4%) and the non-performing loans ratio
rose to 8.4% at end-2012, reflecting the lingering effects of
the real estate crisis of 2009-10.
B. Macroeconomic Outlook (2013-14)
We forecast real GDP growth will slow to 4.0% in 2013 and
3.8% in 2014 as further strengthening in the non-oil sector
is offset by a slowdown in oil and gas.
Oil production growth is expected to slow because of delays
in issuing contracts and uncertainty over the 2014
expiration of the 35yr concession on Abu Dhabi’s onshore
oil fields. The non-oil sector will be buoyed by continued
strong private sector consumption growth (averaging 6.6%)
and large construction projects more than offsetting a
slowdown in government expenditure. This will help raise
non-oil growth to an average of 4.7% in 2013-14. Downside
risks to this scenario include lower global economic activity
and further declines in oil prices. Inflation is expected to
remain moderate over the medium term.
Lower oil revenues will also lead to a narrowing of the
national fiscal surplus to 5.0% in 2013 and 3.5% of GDP in
2014.
The current account surplus is expected to narrow slightly
in 2013-14 (to an average 14.7% of GDP), owing to lower oil
prices and import growth, linked to rising domestic demand.
The banking sector is expected to see stronger lending
growth than in recent years, particularly in the
construction sector. Lending to the public sector will be
impacted by a final decision by the central bank on new
lending limits to Government-Owned Enterprises (GREs).
On the deposit side, banks are likely to focus increasingly
on higher net-worth depositors.
Economics Team [email protected]
Mohamad Moabi
Assistant General Manager
+974 4453 4638
Joannes Mongardini
Head of Economics
+974 4453 4412
Justin Alexander
Senior Economist
+974 4453 4642
Roy Thomas
Senior Economist
+974 4453 4648
Rory Fyfe
Economist
+974 4453 4643
Ehsan Khoman
Economist
+974 4453 4423
Hamda Al-Thani
Economist
+974 4453 4646
Editorial closing, 15th July 2013

2
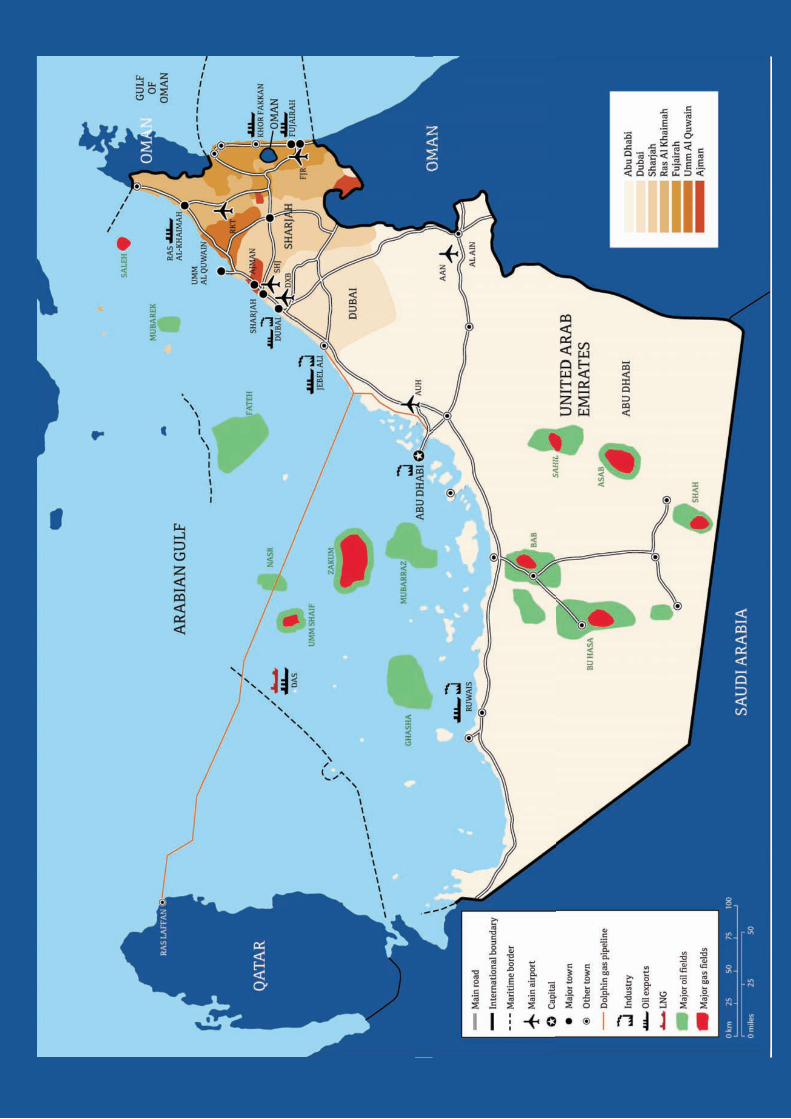
Background
Abu Dhabi is pre-eminent among the emirates
because of its oil reserves and size
Uniquely amongst the Gulf Cooperation Council
(GCC) states, the United Arab Emirates (UAE) is a
federation of seven largely autonomous emirates who
joined together in 1971 after independence. They
vary significantly in size, population, economic
structure and hydrocarbon resources. Abu Dhabi has
a dominant role as it holds most of the UAE’s oil and
gas reserves, as well as 87% of the land area and 43%
of nationals. Abu Dhabi’s hydrocarbon revenue per
national is US$232,000, the highest in the GCC. As a
result, Abu Dhabi has a per capita GDP of US$82,000,
more than double the UAE average.
Oil and Gas Wealth Per National (2012)
Source: BP and QNB Group estimates; excludes emirates with little oil or gas
Dubai has become a regional trade, manufacturing
and services hub
Dubai still has significant hydrocarbon reserves and
revenue, relative to its population, but its production
has declined since the late 1990s. In response to this
decline, Dubai has invested heavily in infrastructure
development to diversify its economy. It drew on a
long tradition of international commerce to create an
unrivalled regional hub for trade and manufacturing,
now focused on the Jebel Ali port and free zone, as
well as a broader services economy. As a result, it has
achieved a similar level of development to Abu Dhabi
and a per capita GDP more than twice as high as the
five northern emirates. Although it was weakened by
a debt and real estate crisis in 2009, its economy is
now recovering.
GDP Per Capita (2012) (US$k)
Source: National and emirate sources and QNB Group estimates
Sharjah and Ajman serve as residences for workers in
Dubai; other emirates rely on federal funding
Sharjah is the third largest emirate and has some oil
and gas reserves, although production is down
sharply from the peak. It is situated next to Dubai
and, along with Ajman, the smallest but most densely
populated emirate, forms part of a continuous coastal
metropolis. Cheaper rents in these emirates mean
that hundreds of thousands of workers commute from
them into Dubai daily. The other three emirates have
smaller expatriate populations. They are subsidized
by revenue transfers from the federal government.
Umm al-Quain, the smallest emirate, has recently
begun producing gas from a small offshore field. Ras
al-Khaimah, at the UAE’s northern tip, is the fourth
largest emirate, with a little offshore gas, although its
Saleh field has been largely depleted. Finally, Fujairah
is the only emirate situated on the east coast. It is
rising in importance as the terminus of a strategic
new pipeline bypassing the Straits of Hormuz, and
associated downstream industries.
Population by Emirate and Nationality (2012) (m, % share shown)
Source: QNB Group estimates based on National Bureau of Statistics (NBS) data
6
8
16
22
27
95
137
301Abu Dhabi
Qatar 724
Hydrocarbon reserves(k boe / national)
Oman
Bahrain
Saudi
Sharjah
Dubai
Kuwait
UAE
13
11
11
2
13
90
102
232
213
Hydrocarbon revenue(US$k / national)
Emirates
GCC states
12242525
3040
48
82
105
5 n
ort
he
rne
mir
ate
s
Ba
hra
in
Sa
ud
i Ara
bia
Om
an
Du
ba
i
UA
E
Ku
wa
it
Ab
u D
ha
bi
Qa
tar
GCC av.32.6
Emirates
GCC states
3.0
94%
Umm alQuain
0.1 81%
Fujaira
0.3
74%
RAK
0.4
75%
Ajman
0.4
90%
Sharjah
1.8
91%
Abu Dhabi
2.8
85%
Dubai
ExpatriatesNationals
7.8m (89%
1.0m
Total = 8.8m

3
Recent Developments (2012)
The private sector took the lead in the recovery in
2012...
Real GDP registered the highest growth since 2006
(4.4%) as the oil sector saw a second year of strong
expansion (6.3%) and the non-oil sector grew by
3.5%, the strongest rate since 2008. Oil production
reached a new record of 3.4m barrels/day (including
crude, condensates and NGLs), according to BP data,
although this only represented a 1.8% rise compared
with 2011. In addition, marketable gas production
actually declined slightly. On the demand side, the
private sector showed a marked uptick after a period
of weak performance. On top of very strong private
consumption growth (9.4%), the surge in investment
(12.5%) was driven by the private sector, more than
offsetting a contraction in government investment.
Real GDP Growth with Selected Components (2008-12) (% change)
Source: NBS and QNB Group analysis
...boosted by a turnaround in the real estate sector
The real estate sector (combined with business
services) grew at its strongest rate in five years
(6.3%), providing the largest contribution (28%) to
non-oil growth. This real estate recovery was most
evident in Dubai which was ranked as the world’s
second hottest real estate market of 2012 in Knight
Frank’s global house price index, with average
residential prices up 19% over the year. Price rises
have fed into Dubai rents which bottomed out in late
2012, after four years of decline. Average UAE rental
inflation was still -2.6% on average over 2012,
keeping overall inflation at a muted 0.7%.
Government and financial services also provided a
significant contribution to growth in 2012. Less
positively, domestic trade, the largest non-oil sector,
grew by just 0.6%. The construction sector stabilized
(0.1%) following two years of contraction.
Sector Contributions to Non-Oil Real Growth (2012) (length of bars is % change, area of bars is share in non-oil real GDP growth)
Source: NBS and QNB Group analysis
Expenditure consolidation boosts the fiscal surplus
The 2012 fiscal outturn is not yet available, but we
estimate that expenditure consolidation (3% of GDP)
led to a significant increase in the fiscal surplus. The
expenditure consolidation was concentrated in capital
expenditures, where project implementation and the
start of new projects were delayed. Overall current
expenditure is estimated to have grown in line with
GDP, notwithstanding a significant hike in federal
wages. Oil and other revenue remained broadly
unchanged in percent of GDP. As a result, the overall
fiscal surplus is estimated to have increased to 5.9%
of GDP, the highest in the last four years.
Consolidated Fiscal Outturn (2008-12) (% of GDP, balance shown at top/bottom of columns)
Source: IMF and QNB Group analysis
4.43.2
1.73.9
10
35
5
0
-5
-20
20102009
-4.8
2008 20122011
InvestmentNon-oil
Total Government Consumption
Private ConsumptionOil
0 2 86 144
Hospitality 3.6
Trade
1.2
Construction
Transport & Comms
13.4Financial services 6.0
Government Services
2.4
Real Estate &Business Services
6.328%
Social services
21%
18%
Agriculture 0.5
0.1Domestic Services
5.9Utilities
3.0
Manufacturing
0.6
9.2
Services
Industry
Agriculture
840
20
0
-20
-40
2012e
6
-8
-19
27
7
2011
3
2010
-2
2009
-13
2008
17
-7
-15
31
Capital expenditure
Current expenditure
Oil and gas revenues
Other revenues

4
The economic recovery led to reduced CDS spreads
The economic recovery, together with a broader
repricing of emerging market debt, helped reduce bond
yields and credit default swap (CDS) spreads to historic
lows in Abu Dhabi and by over a half in Dubai.
Concerns remain about the debt of Government-
Related Enterprises (GREs) and the Dubai government,
but the market seems to expect that the sizable
tranches of debt coming due in the next few years,
including a key US$20bn bailout loan from Abu Dhabi
and the central bank to Dubai, will be rolled over
successfully.
Dubai CDS Spread (Jan 2012 – Jun 2013) (basis points above US Treasuries for a 5yr bond)
Source: Bloomberg and QNB Group analysis
A record trade surplus swelled the current account
surplus
The current account surplus rose to the highest level
(17.3% of GDP) since 2000. Higher oil and non-oil
exports delivered a record trade surplus (33.4% of
GDP), despite strong import growth (13.5%). The other
components of the current account (services, income
and transfers) remained stable in relative terms. In the
capital and financial account, foreign direct
investments picked up significantly. Portfolio
investment data is only available in net terms and
showed only a small increase (US$1bn) making it hard
to identify the reported US$8bn of safe haven capital
inflows that were received in 2012 in response to
regional instability. The overall balance of payments
surplus boosted reserves to US$45.8bn at end-2012,
equivalent to 4.4 months of domestic import cover (the
IMF recommends a minimum of three month cover for
pegged exchange rate regimes like the UAE).
Balance of Payments (2008-12) (% of GDP, overall balance shown at top/bottom of columns)
Source: Central Bank and QNB Group analysis
Bank deposits rose but lending remained muted
The banking sector witnessed deposits growing at
their strongest rate (8.6%) since 2008, partly due to
safe haven capital inflows from countries in the region
with political instability. This provided a boost to
liquidity and eased interbank lending rates (three
month rates fell to 1.3% by end-2012). Lending grew
more gradually (3.4%), and new lending was
concentrated mainly in the government and
construction sectors. The 2009 real estate and debt
crisis has contributed to this moderation in lending and
rising non-performing loans levels (8.4% at end-2012).
New central bank rules, increasing liquid asset
coverage requirements, may have reduced the pool of
loanable funds. All but one of the local banks saw a rise
in profits in 2012, and their aggregate profit growth
was 17.4%, despite pressure on margins. Contributions
to the uptick included lower growth in provisioning
and greater fee income, including from trade financing.
Bank Loan and Deposit Growth (2009-2012) (% change on LHS, loans as % of deposits on RHS)
Source: Central Bank and QNB Group analysis
200
250
300
350
400
450
500
Jan-12 Mar-12 Jun-12 Sep-12 Dec-12 Mar-13 Jun-13
-30
-20
-10
0
10
20
2012
3
-4
-10
17
2011
1
2010
3
2009
-2
2008
-15
-4
-18
7
Errors & omissions
Capital & financial account
Current account
101.3
88.3
27.4
7.7 8.6
0
20
40
60
80
100
0
10
20
30
40
50
3.7
2009 2012
3.4
201120102008
47.5
Loan/Deposit ratio (RHS)
Loans
Deposits
5
Macroeconomic Outlook (2013-14)
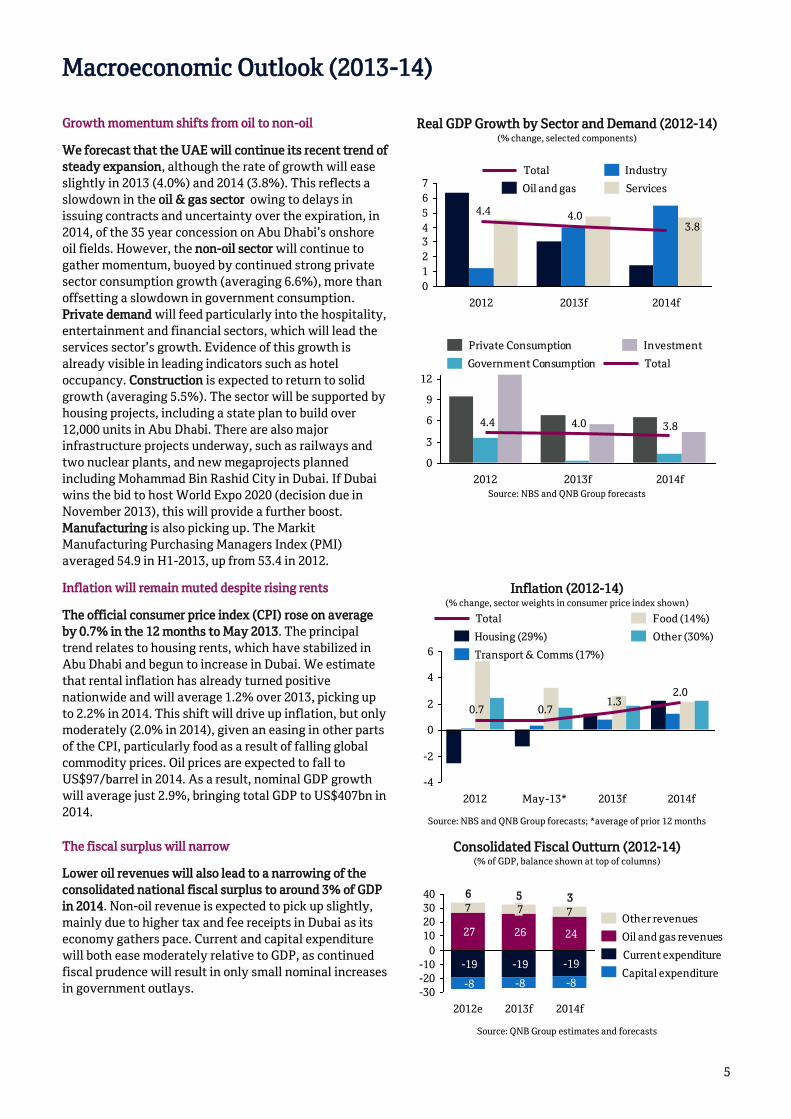
Growth momentum shifts from oil to non-oil
We forecast that the UAE will continue its recent trend of
steady expansion, although the rate of growth will ease
slightly in 2013 (4.0%) and 2014 (3.8%). This reflects a
slowdown in the oil & gas sector owing to delays in
issuing contracts and uncertainty over the expiration, in
2014, of the 35 year concession on Abu Dhabi’s onshore
oil fields. However, the non-oil sector will continue to
gather momentum, buoyed by continued strong private
sector consumption growth (averaging 6.6%), more than
offsetting a slowdown in government consumption.
Private demand will feed particularly into the hospitality,
entertainment and financial sectors, which will lead the
services sector’s growth. Evidence of this growth is
already visible in leading indicators such as hotel
occupancy. Construction is expected to return to solid
growth (averaging 5.5%). The sector will be supported by
housing projects, including a state plan to build over
12,000 units in Abu Dhabi. There are also major
infrastructure projects underway, such as railways and
two nuclear plants, and new megaprojects planned
including Mohammad Bin Rashid City in Dubai. If Dubai
wins the bid to host World Expo 2020 (decision due in
November 2013), this will provide a further boost.
Manufacturing is also picking up. The Markit
Manufacturing Purchasing Managers Index (PMI)
averaged 54.9 in H1-2013, up from 53.4 in 2012.
Real GDP Growth by Sector and Demand (2012-14) (% change, selected components)
Source: NBS and QNB Group forecasts
Inflation will remain muted despite rising rents
The official consumer price index (CPI) rose on average
by 0.7% in the 12 months to May 2013. The principal
trend relates to housing rents, which have stabilized in
Abu Dhabi and begun to increase in Dubai. We estimate
that rental inflation has already turned positive
nationwide and will average 1.2% over 2013, picking up
to 2.2% in 2014. This shift will drive up inflation, but only
moderately (2.0% in 2014), given an easing in other parts
of the CPI, particularly food as a result of falling global
commodity prices. Oil prices are expected to fall to
US$97/barrel in 2014. As a result, nominal GDP growth
will average just 2.9%, bringing total GDP to US$407bn in
2014.
Inflation (2012-14) (% change, sector weights in consumer price index shown)
Source: NBS and QNB Group forecasts; *average of prior 12 months
The fiscal surplus will narrow
Lower oil revenues will also lead to a narrowing of the
consolidated national fiscal surplus to around 3% of GDP
in 2014. Non-oil revenue is expected to pick up slightly,
mainly due to higher tax and fee receipts in Dubai as its
economy gathers pace. Current and capital expenditure
will both ease moderately relative to GDP, as continued
fiscal prudence will result in only small nominal increases
in government outlays.
Consolidated Fiscal Outturn (2012-14) (% of GDP, balance shown at top of columns)
Source: QNB Group estimates and forecasts
3.84.04.4
0
1
2
3
4
5
6
7
2014f2013f2012
Oil and gas
Industry
Services
Total
3.84.04.4
0
3
6
9
12
2012 2013f 2014f
Investment
Government Consumption
Private Consumption
Total
2.0
-4
-2
0
2
4
6
1.3
2013f 2014f
0.70.7
May-13*2012
Transport & Comms (17%)
Total Food (14%)
Other (30%)Housing (29%)
7 7
-30
-20
-10
0
10
20
30
40
24
-8
-19
-8
7
26
-19
2014f
3
2013f
5
2012e
6
-8
-19
27Other revenues
Current expenditure
Oil and gas revenues
Capital expenditure

6
Debt levels are expected to fall to sustainable levels
Public debt levels are expected to continue to fall to
below 60 percent of GDP by 2014. The consolidated stock
of public debt, including GRE borrowing, is expected to
remain roughly constant in nominal terms in the coming
years. Some of the maturing Dubai GRE debt will be paid
off through asset disposals, and some stronger GREs will
issue additional debt, but the balance of debt is unlikely
to change significantly. This means that the level of debt
will fall relative to GDP to about 57% of GDP by 2014.
Yields have increased since the US Federal Reserve began
discussing a tapering of quantitative easing in June, in
particular the yields on benchmark Dubai bonds and
sukuk are up over 100bps. This will increase the cost of
refinancing. We expect that higher yields will remain
manageable as they are at par with mid-2012 levels.
Public Debt (2010-14) (% of GDP)
Source: IMF and QNB Group forecasts
The balance of payments surplus will continue to register
a significant surplus
A small narrowing in the current surplus is forecast to be
offset by similar reductions in financial outflows over the
next two years, maintaining a relatively steady balance
of payments surplus (averaging 2.2% of GDP). This will
boost international reserves to around US$64bn,
equivalent to just over 5 months of domestic import
cover (excluding imports destined for re-export). The
narrowing of the current surplus (to an average of 14.7%
of GDP) will mainly be driven by rising imports of both
consumer and capital goods, drawn in by strong growth
in private consumption and investment. Lower oil prices
are expected to reduce hydrocarbon exports.
Current Account Balance (2012-14) (% of GDP, overall balance shown at top of columns)
Source: Central Bank and QNB Group forecasts; *re-export trade excluded
The banking sector will continue to expand in line with
the growth in the deposit base
The growth in the banking sector will continue to be
driven by its deposit base. Loan and advances growth has
been picking up to 5.2% y-o-y in May 2013. It is expected
to accelerate further during 2013-14. New central bank’s
restrictions on lending to GREs are on hold as further
consultations are underway with the banking sector.
Their final form will significantly affect lending trends to
the public sector. Deposits are growing faster than loans
(10.8% in May 2013). As a result, the loan/deposit rate
has been declining steadily. This provides banks with
room to increase their lending portfolios, such as in
construction (up 9.1% in March 2013). Growth in this
sector is likely to pick up further, given the increase in
ongoing projects. Personal loans are also growing
strongly on the back of rising private consumption. In
terms of deposits, banks are likely to focus on higher net-
worth depositors as they face some competition from
shadow banking in lower income segments.
Bank Loan and Deposit Growth (Jan 12-May 13) (% change YoY)
Source: Central Bank; Loan by sector data only available until Mar-13
57616570
81
2013f 2014f20122010 2011
-4-4-3
110
-20
60
-40
0
40
2029
26
2012
17
27
-22
14
-13
-24
2014f
-23
25
31 27
2013f
-13 -13
15
Transfers balance
Domestic imports*
Hydrocarbon exports
Income balance
Services balance
Other exports*
5.2
9.110.8
15
10
5
0
-5
Jan-13Jul-12Jan-12 Apr-13Apr-12 Oct-12
Deposits
Loans (construction)
Loans & advances (total)

7
Key Macroeconomic Indicators
2008 2009 2010 2011 2012 2013f 2014f
Real sector indicators
Real GDP growth (%) 3.2 -4.8 1.7 3.9 4.4 4.0 3.8
Oil & gas sector -2.4 -8.9 3.8 6.6 6.3 3.0 1.4
Non-oil sector 6.0 -2.9 0.7 2.6 3.5 4.5 4.9
Government consumption 5.5 32.1 0.1 2.5 3.6 0.3 1.3
Private consumption 9.6 -19.5 2.3 -0.3 9.4 6.7 6.5
Fixed investment 3.0 -1.3 -0.1 4.6 12.5 5.5 4.4
Net exports -56.7 202.0 4.8 25.5 -28.8 -14.2 -17.1
Nominal GDP (US$ bn) 315.5 254.8 287.4 348.6 383.8 395.9 406.6
Growth (%) 22.3 -19.2 12.8 21.3 10.1 3.2 2.7
Oil & gas sector (% of GDP) 36.9 26.9 31.4 39.3 40.2 38.2 35.3
Consumer price inflation (%) 12.3 1.6 0.9 0.9 0.7 1.3 2.0
Food 16.3 0.8 4.5 5.9 5.2 2.6 2.1
Housing 13.4 0.4 -0.3 -2.4 -2.6 1.2 2.2
Budget balance (% of GDP) 16.7 -13.1 -2.2 3.0 5.9 5.0 3.5
Revenue (oil) 31.1 18.6 22.2 28.3 26.7 25.6 23.6
Revenue (non-oil) 7.8 8.7 7.5 6.1 6.9 6.7 7.0
Expenditure 22.2 40.4 31.8 31.4 27.7 27.3 27.1
Public debt 45.9 87.7 81.0 69.8 65.1 60.6 56.6
External sector (% of GDP)
Current account balance 7.1 3.1 2.5 14.6 17.3 15.4 14.2
Trade balance 19.9 16.5 17.0 30.6 33.4 31.5 29.5
Exports 75.8 75.3 74.3 86.6 91.2 91.5 91.7
Imports -55.9 -58.8 -57.3 -56.1 -57.8 -60.0 -62.2
Services balance -10.7 -10.7 -10.6 -12.5 -12.7 -13.2 -12.6
Income balance 1.2 1.3 0.0 0.0 0.1 0.7 1.0
Current transfers balance -3.4 -4.0 -3.9 -3.5 -3.4 -3.5 -3.7
Capital account balance -17.5 -3.8 1.7 -8.5 -10.3 -10.1 -9.0
International reserves 10.0 9.8 11.0 10.4 11.9 13.6 15.7
External debt 43.2 48.4 47.2 39.6 37.5 36.1 34.8
Monetary indicators
Interbank interest (%, 3 months) 4.3 1.9 2.1 1.5 1.3 - -
Exchange rate US$:AED (av) 3.673 3.673 3.673 3.673 3.673 3.673 3.673
Banking sector indicators (%)
Average return on assets 1.4 1.4 1.3 1.5 1.5 - -
Average non-performing loans ratio 2.3 4.3 5.6 7.0 8.4 - -
Deposit growth 27.4 7.7 6.8 1.9 8.6 - -
Credit growth 47.5 3.7 1.4 2.1 3.4 - -
Memorandum items
Population (m) 8.07 8.20 8.26 8.47 8.75 9.05 9.39
Growth (%) 29.8 1.6 0.8 2.5 3.3 3.4 3.8
Oil production ('000 bpd) 2,572 2,242 2,324 2,565 2,657 2,750 2,780
UAE crude price (US$/barrel) 93.7 70.6 78.3 106.6 105.4 103.0 97.0
Gas production (m cu ft/day) 4.9 4.7 5.0 5.1 5.0 5.1 5.2
Source: NBS, Central Bank, IMF and QNB Group estimates and forecasts; Data as at 15th July 2013
8
Publications and QNB Group’s International Network
Recent Economic Insight Reports
Kuwait 2013 Qatar 2013 Oman 2013 Jordan 2012
Qatar reports
Qatar Monthly Monitor
Recent Weekly Economic Commentaries
GCC inflation has accelerated but should stabilize
QE tapering in the US could act as a brake on global growth
Emerging Markets Enter a Difficult Period of Weaker Growth, Capital Flight, and Tighter Monetary Policy
Credit Squeeze May Dampen Economic Growth in China, According to QNB Group
QNB Group Branches
France: +33 1 53 23 0077, [email protected]
Kuwait: +965 2226 7023, [email protected]
Lebanon: +961 1 762 222, [email protected]
Mauritania: +222 4524 9651, [email protected]
Oman: +968 24 725 555, [email protected]
Singapore: +65 6499 0866, [email protected]
South Sudan: [email protected]
Sudan: +249 183 480000, [email protected]
UK: +44 207 6472600, [email protected]
Yemen: +967 1 517 517, [email protected]
QNB Group Subsidiaries
Egypt: NSGB, +202 2770 7000, [email protected]
India: QNB (India) Private, launching Q3-2013
Indonesia: QNB Kesawan, +62 21 515 5155, www.qnbkesawan.co.id
Iraq: Mansour Bank, +964 1 717 5586, www.mansourbank.com
Switzerland: QNB Banque Privée (Suisse) SA, +41 22 907 7070, [email protected]
Syria: QNB Syria, +963 11 2290 1000, [email protected]
Tunisia: QNB Tunisia, +216 71 750 000, www.tqb.com.tn
QNB Group Associates
Jordan: The Housing Bank for Trade and Finance, +962 6 500 5555, www.hbtf.com
Libya: Bank of Commerce and Development, +218 619 080 230, www.bcd.ly
UAE: Commercial Bank International, +971 4227 5265, www.cbiuae.com
Disclaimer and Copyright Notice
All the information in this report has been carefully collated and verified. However, QNB Group accepts no liability whatsoever for any direct
or consequential losses arising from its use. Where an opinion is expressed, unless otherwise cited, it is that of the authors which does not
coincide with that of any other party, and such opinions may not be attributed to any other party.
The report is distributed on a complimentary basis to valued business partners of QNB Group. It may not be reproduced in whole or in part
without permission