qrbd - homepage - international academy of business ...iabdnet.org/qrbd/volume 1/issue 1/quarterly...
TRANSCRIPT

QRBD QUARTERLY REVIEW OF BUSINESS DISCIPLINES
May 2014 Volume 1 Number 1
A JOURNAL OF INTERNATIONAL ACADEMY OF BUSINESS DISCIPLINES ISSN 2334-0169 (print) ISSN 2329-5163 (online)

Inside cover – Blank page
QRBD - QUARTERLY REVIEW OF BUSINESS DISCIPLINES A JOURNAL OF INTERNATIONAL ACADEMY OF BUSINESS DISCIPLINES
FROM THE EDITORS This first issue of the Quarterly Review of Business Disciplines (QRBD) is
somewhat of a milestone for the International Academy of Business
Disciplines (IABD). Although we have many publications that are
associated with IABD, this is the first journal that is truly an IABD
journal. We thank IABD President, Dr. Paul Fadil, Coggin College of
Business, University of North Florida, for his insight in the creation of
QRBD and the IABD Board of Directors for their support of this new
journal. It is through their dedication and desire to continuously improve
IABD that we are able to evolve into a stronger more creative
organization. We also thank the many members of our Editorial Review
Board for the time they each take to scrupulously review papers for
inclusion in QRBD. This journal has already been approved by Cabell’s
Directory of Publishing Opportunities.
As Educators we are always interested in the ways that students think and
how we can reach them in interesting and innovative ways. We encourage
them in their ability to learn by offering opportunities to study and conduct
research. The articles that are included in this premier issue of QRBD
highlight some of the research currently being conducted in the field.
Margaret A. Goralski, Quinnipiac University, Editor-in Chief
Kaye McKinzie, University of Central Arkansas, Associate Editor
QRBD - QUARTERLY REVIEW OF BUSINESS DISCIPLINES A JOURNAL OF INTERNATIONAL ACADEMY OF BUSINESS DISCIPLINES
The Quarterly Review of Business Disciplines (QRBD) is published by the International Academy
of Business Disciplines quarterly in February, May, August, and November. Manuscript Guidelines/Comments. QRBD is a blind peer-reviewed journal that provides
publication of articles in all areas of business and the social sciences that affect business. The Journal welcomes the submission of manuscripts that meet the general criteria of significance and business excellence. Manuscripts should address real-world phenomena that highlight research that is interesting and different – innovative papers that begin or continue a line of inquiry that integrate across disciplines, as well as, those that are disciplinary. The Journal is interested in papers that are constructive in nature and suggest how established theories or understandings of issues in business can be positively revised, adapted, or extended through new perspectives and insights. Manuscripts that do not make a theoretical contribution to business studies or that have no relevance to the domain of business should not be sent to QRBD. Submissions to QRBD must follow the journal’s Style Guide for Authors, including length, formatting, and references. Poorly structured or written papers will be returned to the authors promptly. Manuscript length is approximately 16 – 20 pages. Acceptance rate is 25-28%.
Description. The Quarterly Review of Business Disciplines is a quarterly publication of the
International Academy of Business Disciplines (IABD); a worldwide, non-profit organization established to foster and promote education in all of the functional and support disciplines of business. The objectives of QRBD and IABD are to stimulate learning and understanding and to exchange information, ideas, and research studies from around the world. The Academy provides a unique global forum for professionals and faculty in business, communications, and other social science fields to discuss and publish papers of common interest that overlap career, political, and national boundaries. QRBD and IABD create an environment to advance learning, teaching, and research, and the practice of all functional areas of business. Quarterly Review of Business Disciplines is published to promote cutting edge research in all of the functional areas of business.
Submission Procedure. An electronic version of the manuscript must be submitted in MS Word
to the Editor-in-Chief, Dr. Margaret A. Goralski at [email protected]. Upon completion of a review by expert scholars who serve on the QRBD Editorial Review Board, the first author will be informed of acceptance or rejection of the paper within a one to two month timeframe from the submission date. If the paper is accepted, the first author will receive a formal letter of acceptance along with the QRBD Style Guide for Authors. IABD members and authors who participate in the IABD annual conference are given first priority as a matter of courtesy. For additional information, please visit www.iabd.org.
Subscription. The annual subscription price for QRBD is US$100 plus postage and handling.
Single issue price is $35 per issue plus postage and handling.
The data and opinions appearing in the articles herein are the responsibility of the contributing authors. Accordingly, the International Academy of Business Disciplines, the Publisher, and Editor-in-Chief accept no liability whatsoever for the consequences of inaccurate or misleading data, opinions, or statements.
QRBD - QUARTERLY REVIEW OF BUSINESS DISCIPLINES A JOURNAL OF INTERNATIONAL ACADEMY OF BUSINESS DISCIPLINES
EDITOR-IN-CHIEF
ASSOCIATE EDITOR
EDITORIAL REVIEW BOARD
Margaret A. Goralski, Quinnipiac University
Email: [email protected] Kaye McKinzie, University of Central Arkansas
Email: [email protected]
Accounting History Darwin L. King, St. Bonaventure University
Accounting - Managerial Majidul Islam, Concordia University
Accounting Theory Rodney A. Oglesby, Drury University
[email protected] Communication & Technology John C. Tedesco, Virginia Tech University
[email protected] Communication – Cross-Cultural Raquel Casino, Istanbul Turkey
Communication – Health & Public Policy J. Gregory Payne, Emerson College
Communication – Organizational & Crisis Management Reza Eftekharzadeh, St. John’s University
Economics Dale Steinreich, Drury University
[email protected] Emotional Intelligence & Mindfulness Chulguen (Charlie) Yang, Southern Connecticut State
University, [email protected]
Entrepreneurship & Small Business Marty Mattare, Frostburg State University
[email protected] Ethical & Social Issues Kellye Jones, Clark Atlanta University
Finance Phillip Fuller, Jackson State University
[email protected] International Business Philemon Oyewole, Howard University
[email protected] Information Systems & E-Learning
Saurabh Gupta, University of North Florida
[email protected] Interdisciplinary Studies Nada Farhat, Tufts University
[email protected] Instructional & Pedagogical Issues Amiso M. George, Texas Christian University
[email protected] Leadership John Fisher, Utah Valley University
[email protected] Manufacturing & Service Mohammad Z. Bsat, National University
[email protected] Management – Applied Science & Decision Support
Systems Zahid Y. Khairullah, St. Bonaventure University

Management of Diversity Chynette Nealy, University of Houston – Downtown [email protected]
Management – Human Resources Kaushik Chaudhuri, Symbiosis International University
SCMHRD, India [email protected]
Management – Operations Shakil Rahman, Frostburg State University [email protected]
Management – Project & Knowledge Michael Baechle, Baden Wuerttemberg Cooperative
State University, Germany
[email protected] Arthur Kolb, University of Applied Sciences – Kempten
Germany, [email protected] Management – Strategic Crystal L. Owen, University of North Florida
[email protected] Marketing
Felix Abeson, Coppin State University
[email protected] Marketing – Advertising & Communication
Louis K. Falk, University of Texas @ Brownsville
[email protected] Marketing – Cross-Cultural
Ziad Swaidan, University of Houston, Victoria
[email protected] Marketing – Political Communication & Public Affairs John Mark King, East Tennessee State University
[email protected] Marketing Research
Talha D. Harcar, Penn State, Beaver [email protected]
Marketing – Service
Paloma Bernal Turnes, Universidad Rey Juan Carlos
[email protected] Marketing – Strategic
Harold W. Lucius, Rowan University
[email protected] Organizational Behavior & Organizational Theory Kayong Holston, Ottawa University
[email protected] Psychology – Cross-Cultural
Dominik Guess, University of North Florida
[email protected] Public Relations & Corporate Communications Bonita Dostal Neff, Valparaiso University
[email protected] PR – Global Corporate/Responsibility & Culture Enric Ordeix-Rigo, Ramon Llull University, Spain
[email protected] Social Media Karin Reinhard, Baden Wuerttemberg Cooperative State
University, Germany, [email protected] Kaye McKinzie, University of Central Arkansas
[email protected] Sport Business Brian V. Larson, Widener University
[email protected] Sustainability Gregory Robbins, Southern Connecticut State University
[email protected] Tourism, Travel, & Hospitality Nathan K. Austin, Morgan State University

QRBD - QUARTERLY REVIEW OF BUSINESS DISCIPLINES A JOURNAL OF INTERNATIONAL ACADEMY OF BUSINESS DISCIPLINES
VOLUME 1 NUMBER 1 MAY 2014 ISSN 2329-5163 (online) ISSN 2334-0169 (print) CONTENTS ARTICLES Promoting Campus Activities: Encouraging Student Participation 1
Charles A. Lubbers, Teddi A. Joyce The Myth of the Overpaid, Underworked and Underqualified Business Professoriate: A Case Study 15
James E. Weber, Paula S. Weber, Martin Breaker
Is Management the Real Problem? Negligent Retention and Performance Management 27 Diane Bandow, Dennis Self, Terry Self
Millennial Job Placement in the Hospitality Industry: What Your Students Don’t Know May Hurt You 37
Miranda Kitterlin, Mohan Song, Nathan E. Dodge Website and Mobile Usability 50
Louis K. Falk, Hy Sockel IT Disconfirmation Judgments, Satisfaction and Trust 63
Liqiong Deng
The Value of Social Media for Pushing Activist Organizations Social Agendas: Implications for Public Relations Theory and Practice 76
Maureen Taylor, Michael Kent Hit or Miss? The Impact on a Public Figure from One News Item 88
Aimee J. Shelton, Caitlin Fisher
Kin Altruism, Psychological Contract and Commitment in Immigrant Businesses: Some Theoretical Propositions 99
Chulguen (Charlie) Yang
Papers in this journal are posted online ahead of the print issue on the
International Academy of Business Disciplines website (www.iabd.org).
INTERNATIONAL ACADEMY OF BUSINESS DISCIPLINES
MISSION STATEMENT
The organization designated as the International Academy of Business Disciplines
is a worldwide, non-profit organization, established to foster and promote education
in all of the functional and support disciplines of business.
WWW.IABD.ORG
Quarterly Review of Business Disciplines – Volume 1, Issue 1, May 2014
Page 1
PROMOTING CAMPUS ACTIVITIES: ENCOURAGING STUDENT PARTICIPATION
Charles A. Lubbers, University of South Dakota [email protected]
Teddi A. Joyce, University of South Dakota
ABSTRACT
Like any business, colleges and universities must build relationships with new students and retain relationships with current students to enhance their chances for economic success. More recent studies continue to demonstrate that participation in campus activities encourages greater student retention rates as well as personal growth and satisfaction. Campus (experiential) events promote interaction between students and the university, helping to build longer-term bonds between the student and the college or university. Thus, campus events begin to develop relationships with the students and reinforce the brand through interaction and the qualities of the events themselves.
However, offering programs and events that help to cement this relationship only works
if those students know about and attend the events. A survey of 516 students at a Great Plains, public university was conducted to find out about student attitudes toward the current program offerings, what they would like to see in the future, as well as suggestions for what prevents and encourages them to attend the events. Results of the survey suggest that student participation in campus activities was extremely low, a small percentage of students on the campus were likely to attend these events, and that these students were likely involved in other campus organizations. Differences were also found based on the students’ year in school and whether they lived on campus or commuted. The major reasons that students identified for not attending, being motivated to attend and suggestions for preferred program types are also discussed.
Keywords: Promotion, Campus, Activities, Student, Participation
INTRODUCTION
Like any business, colleges and universities must build relationships with new students and retain relationships with current students to enhance their chances for economic success. American College Testing (ACT) data (2013) demonstrate that the national dropout rate from first-year to second-year is 34.2% representing the potential for significant loss of institutional revenue. There is a large body of research focusing on individual, institutional, and environmental factors that influence student retention. Institutional commitment to retention plays a significant role in the student experience. In

Quarterly Review of Business Disciplines – Volume 1, Issue 1, May 2014
Page 2
his seminal work, Astin (1977) examined how institutional environmental factors translate into student satisfaction noting that purposeful student involvement increases student connections to the institution. Enhancing the student experience through academic programs, faculty interactions, financial assistance and student services and activities is considered an essential undertaking for both recruitment and retention. More recent studies continue to demonstrate that participation in campus activities encourages greater student retention rates as well as personal growth and satisfaction. Extensive longitudinal literature highlights how active campus involvement benefits college student development (Pascarella & Terenzini, 2005). The literature suggests that students who are involved in out-of-class activities are more satisfied with their experiences and relationships with each other as well as with the institution. Kuh, Kinzie, Schuh, and Whitt (2005) proposed "what students do during college counts more for what they learn and whether they will persist in college than who they are or even where they go to college" (p. 8). Thus, academic activities and social activities are significant opportunities for student involvement and critical factors in retention.
REVIEW OF LITERATURE
Babcock and Marks (2011) noted that during the past 50 years, the amount of time a typical college student spends studying or doing homework has declined, shifting the campus culture to place a greater emphasis on social life and activities. Tieu and Pancer (2009) determined that a successful adjustment to college was associated with participation in out-of-class activities that students assessed as being high quality—which was defined as activities that elicited positive feelings for the student and that provided the student with a sense of connection to others. Campus programming traditionally associated with learning and academics can create an important touch point of academic involvement, yet with more student time being spent on social life and activities, institutions need to provide a broad range of student-orientated activities to attract and retain students. Student activities or campus activities are frequently a collection of non-instructional events developed by student programmers to engage, entertain, and involve students outside of the classroom and increase satisfaction and enjoyment of the campus experience. Campus Event Marketing and Promotion
Campus events, where students interact with each other and the college, can be called experiential events (Wood, 2009). These experiential events can be powerful as they can generate short-term impact but also build longer-term changes in attitude and belief (Sneath, Finney, & Close, 2005). Thus, for colleges and universities, events have the potential to secure or enhance their bonds with their students (target market). Participation in student activities impacts student retention and campus events offer a means to develop relationships with the students and reinforce the institutional brand through social interaction and the qualities of the events themselves.
Creating and securing the programs and events that provide worthwhile experiences will
Quarterly Review of Business Disciplines – Volume 1, Issue 1, May 2014
Page 3
work only if those students know about the events. Once considered standard promotional materials, campus posters and flyers are no longer sufficient means of effective event marketing, public relations and advertising. Instead, much of the current discussion about promotional activities is focused on using promotional tools and brand identity as a way to attract students to events and enhance their experiences at those events.
Effective promotional materials require more than sufficient program information and being error free. Consistency of promotional materials reflects the need for programming boards to be conscious of design elements, logos and copy every time an event is promoted, and that promotion should be coupled with the strategic, planned placement of promotional materials. Clear, consistent campus activities board promotional materials will strengthen event recognition and the activities programming board identity (Borgmann, 2013; Corces-Zimmerman, 2011; Hilson, 2013). As Campbell, Keller, Mick, & Hoyer (2003) note, “a crucial communication task for unknown brands is to build the knowledge in consumers’ minds necessary to become established” (p. 292). Once a student population is able to recognize specific promotional materials and tie them to consistent event experiences, brand expectations are developed. Thus, consistency of marketing materials, message and brand identity is critical to continued attendance (Arias & Micalone, 2013). The advice of programming professionals guiding student programmers to build a strong brand image for the organization is not surprising. A strong brand image helps consumers develop positive attitudes and can enhance the brand value (Aaker, 1996). Strong branding will help intensify social and emotional value and brand student activity programming boards’ events (Chen, Chen, & Huang, 2012). Technology options are predominant on most campuses. While access to electronic flyers, blogs and websites, and the dominance of various social media communities is likely to change from campus to campus, repetitive messages that reach students where they actively seek information are important to successful event promotion (Corces-Zimmerman, 2011). Social media, often termed Web 2.0 applications, allow for direct engagement with consumers through creating, collaborating and sharing content (Thackeray, Neigler, Hanson, & McKenzie, et al., 2008). And, with the widespread use of social media on college campuses, there seems to be a clear directive that social media should not only be used, but also actively integrated into all promotional materials. Social media content, comprised of text, pictures, videos and networks, are easy to access and can reach large numbers (Berthon, Pitt, Planger, & Shapiro, et al., 2012). Fully integrating social media as a marketing and promotional opportunity goes beyond simply posting events on Facebook and Twitter. Social media moves interaction beyond traditional promotion. Its active nature allows organizations to seek a more long-term relationship and affords greater communication than the one-way nature of posters and flyers (Papasolomou & Melanthiou, 2012). The interactive nature of social media is a way to help students experience the events. For example, promotion via social media allows for the generation of short-term impact with the creation of contests and special prizes (Borgmann, 2013). Also, social media and viral videos can offer students a chance to experience aspects of the entertainment prior to the campus events with embedded links. Videos allow students to see and hear performers building anticipation and other social platforms can extend the dialogue after an event ends.

Quarterly Review of Business Disciplines – Volume 1, Issue 1, May 2014
Page 4
The final promotional strategy commonly recommended is collaborating or co-sponsoring events with other student groups. Collaboration can maximize exposure and create greater word-of-mouth promotion. A common theme suggested developing promotional teams that consist of influential students who can help spread the message or those who have interests relevant to the event. When members of different organizations were able to come together to cross-promote, those teams were frequently representative of different target audiences (Espino, 2008). Adding diverse student interests to a singular event can add a personal dimension to event communication. By bringing diverse groups together, the collaborative effort serves to enhance event visibility by reaching new target markets and to provide opportunities to build new social relationships and event affinity. As Papasolomou & Melanthiou (2012) note “people in groups share information because they trust one another” (p. 321). Collaborating or co-sponsoring activities relies on social networks that exist outside of Web 2.0 applications and can create awareness through personal relationship building.
RESEARCH QUESTIONS
The previous review of literature leads to several research questions that the current investigation was designed to answer.
RQ 1 – Which students are attending events sponsored by the University’s activities program? RQ 1a – Are there differences in student participation based on the student’s living situation? RQ 1b – Are there differences in student participation based on the student’s year in school? RQ 1c – Are there differences in student participation based on the student’s membership in
the University’s Greek system? RQ 1d – Are there differences in student participation based on the student’s membership in
a university-recognized organization? RQ 2 – What events or programs would students like to see brought to campus? RQ 3 – What discourages students from attending events sponsored by the University Activities
Board? RQ 4 – How can we promote the sponsored events to increase attendance?
METHOD
A self-administered, print survey questionnaire was used in the current investigation in an
attempt to answer the research questions posed. In addition to demographic questions for classification purposes, one section attempted to determine if various information/communication sources may influence the decision to attend. Additionally, questions asked about their past participation in programs and events sponsored by the university’s program committee. Finally, closed- and open-ended questions were used to determine what encourages and discourages student attendance and how we might better promote these events.
Students in an undergraduate research class were tasked with the collection of survey
responses. The students completed the university’s ethical treatment of human subjects training and received instructions and guidelines on survey administration. Survey administrators were

Quarterly Review of Business Disciplines – Volume 1, Issue 1, May 2014
Page 5
asked to seek a balance in respondent sex, academic class/year and to seek responses from multiple degree programs at the university. The sampling technique used a nonprobability, available sampling frame. A filter question in the survey assured that all the respondents were currently attending the university. The surveys were administered during the fall 2013 term.
Data were analyzed using SPSS-PC. In addition to basic descriptive statistics for
frequency and measures of central tendency, crosstabulations were conducted to determine the relation between variables. Pearson chi square and Cramer’s V were used to determine the level of significance for the observed frequency counts versus expected frequency counts in the crosstabulations.
RESULTS
Respondent Profile
Using the methods described above, a total of 516 students completed the survey, representing 5% of the total student enrollment of the university. In an attempt to generate a sample that would be as representative of the student body as possible, data collectors were asked to attempt to have their sample match the university numbers in terms of student sex and race/ethnicity. On both measures the data collectors did an excellent job of making the percentages very similar to the full university. In the survey sample, 62.5% of the respondents were female and the university student population is 61.4% female. Additionally, the racial/ethnic breakdown was very similar to that of the university. The university student population is 89% white, and the sample had 87.4% white respondents. Information related to the breakdown of the sample by academic rank/year will be discussed below.
Research Questions
The remainder of the results section will provide the results related to the research questions presented earlier. RQ 1 – Which students are attending events sponsored by the University’s activities program?
Of the 516 respondents to the survey, only 228 (44.1%) indicated that they had participated in at least one program, while 173 (33.5%) indicated that they knew about the activities but had never attended any programs. An additional 115 (22.3%) indicated that they did not know about the programs and, presumably, had not attended any. Of the 228 who had attended at least one program, the vast majority had attended only one (84, 36.8%), two (68, 29.8%) or three (39, 17.1%) programs. Clearly the level of participation in the students surveyed was extremely low. In an attempt to determine if there are student characteristics that could be connected with past participation in programs, five sub-questions were proposed. Given the small number of students who had participated in four or more events, the variable was recoded so that all who had participated in four or more events would be placed in the same category. The results of the recoding would mean that the 401 students who answered these questions would be classified as

Quarterly Review of Business Disciplines – Volume 1, Issue 1, May 2014
Page 6
having attended 0, 1, 2, 3, or 4+ programs.
RQ 1a – Are there differences in student participation based on the student’s living situation?
Of the 516 students surveyed, the vast majority lived either on campus (229, 44.4%) or off campus, but still within the city (263, 51%). The remaining students either commuted from outside the city (21, 4.1%) or had some other living arrangement (3, .6%). The small number of respondents who were commuting from outside the city required that those respondents be collapsed into a category with local commuters. Thus, on table 1 the two classifications are for those living on campus and those who live off campus.
Table 1. Housing Location by Number of Events Attended Crosstabulation
Housing Location Number of Events Attended
Total 0 1 2 3 4+
On Campus N 47 32 30 20 20
149 Exp. N 64.0 31.1 25.5 14.6 13.9
Off Campus N 124 51 38 19 17
249 Exp. N 107.0 51.9 42.5 24.4 23.1
Total 171 83 68 39 37 398 Pearson Chi-Square = 16.124, 4 df, p< .003; Cramer's V = .201, Sig= .003
The chi square and Cramer’s V significance levels were .003, indicating that the differences between the observed and expected frequencies would have been extremely unlikely to have happened by chance. A comparison of the observed and expected frequency counts in the cells demonstrates a clear result – students who live on campus were significantly more likely to have attended events than those who live off campus. Additionally, many of the on campus students are freshman, who have the lowest level of participation because of their short time on campus. Thus, the strong level of attendance among the on campus students is particularly important. It is also important to note that some of the off campus students who reported participating in events, may have done so while they still lived on campus.
RQ 1b – Are there differences in student participation based on the student’s year in school?
The year of study was compared between the sample and the university population. While the number of respondents at the four years of undergraduate study are similar to the overall university undergraduate population, graduate students represented a much smaller percentage of the sample (6.6%) as compared to the population at the university (20.2%). The percentage of freshmen in the sample is purposely smaller than their percentage in the university, since at the time of data collection they would have only been on campus for three months.
Quarterly Review of Business Disciplines – Volume 1, Issue 1, May 2014
Page 7
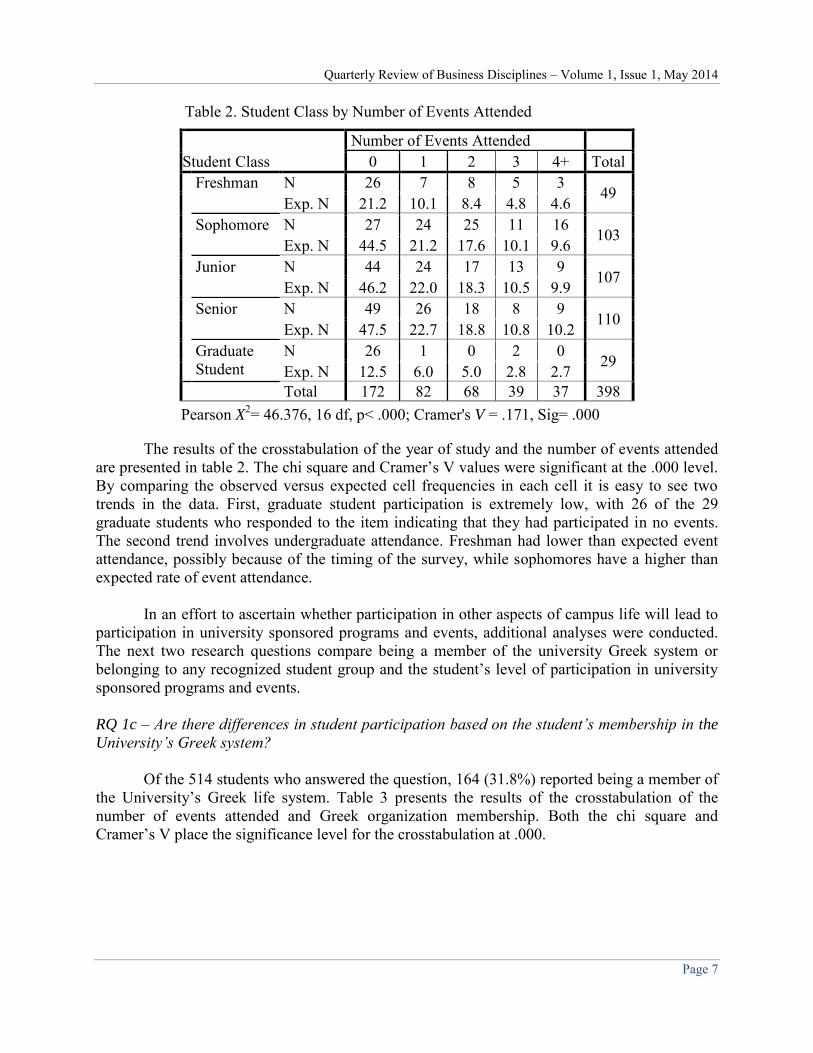
Table 2. Student Class by Number of Events Attended
Student Class Number of Events Attended
0 1 2 3 4+ Total Freshman N 26 7 8 5 3
49 Exp. N 21.2 10.1 8.4 4.8 4.6
Sophomore N 27 24 25 11 16 103 Exp. N 44.5 21.2 17.6 10.1 9.6
Junior N 44 24 17 13 9 107
Exp. N 46.2 22.0 18.3 10.5 9.9 Senior N 49 26 18 8 9
110 Exp. N 47.5 22.7 18.8 10.8 10.2
Graduate Student
N 26 1 0 2 0 29 Exp. N 12.5 6.0 5.0 2.8 2.7
Total 172 82 68 39 37 398 Pearson X2= 46.376, 16 df, p< .000; Cramer's V = .171, Sig= .000
The results of the crosstabulation of the year of study and the number of events attended are presented in table 2. The chi square and Cramer’s V values were significant at the .000 level. By comparing the observed versus expected cell frequencies in each cell it is easy to see two trends in the data. First, graduate student participation is extremely low, with 26 of the 29 graduate students who responded to the item indicating that they had participated in no events. The second trend involves undergraduate attendance. Freshman had lower than expected event attendance, possibly because of the timing of the survey, while sophomores have a higher than expected rate of event attendance. In an effort to ascertain whether participation in other aspects of campus life will lead to participation in university sponsored programs and events, additional analyses were conducted. The next two research questions compare being a member of the university Greek system or belonging to any recognized student group and the student’s level of participation in university sponsored programs and events. RQ 1c – Are there differences in student participation based on the student’s membership in the
University’s Greek system?
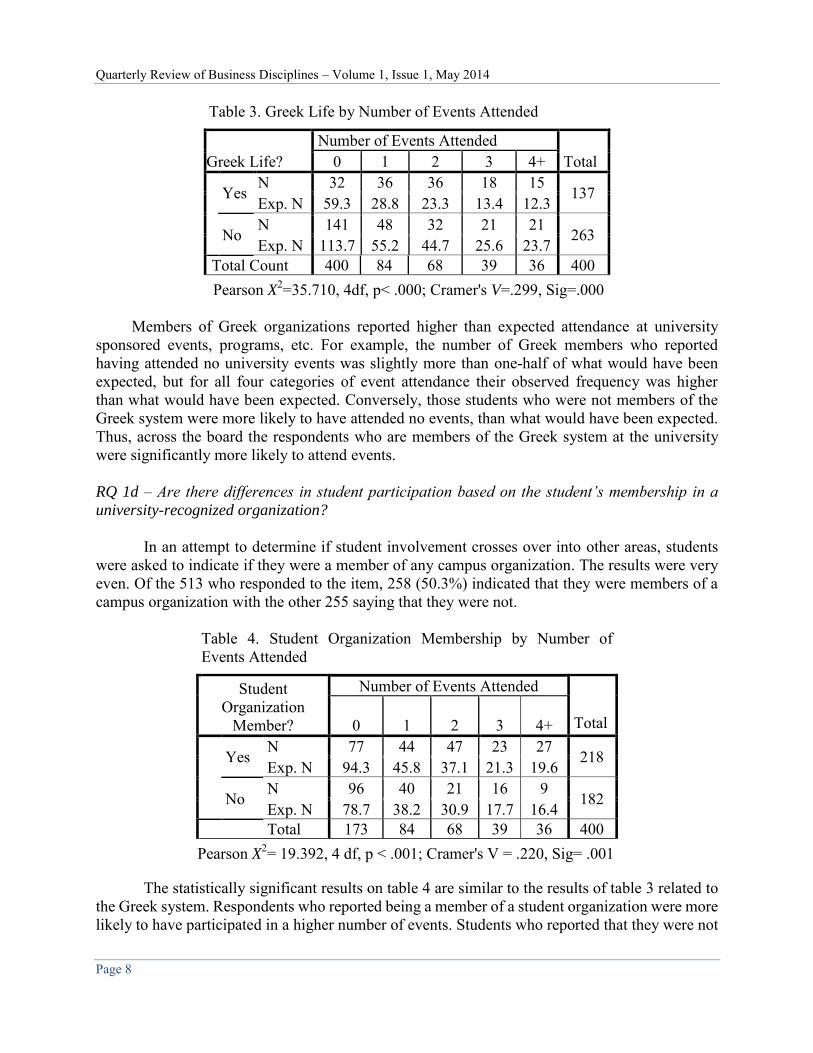
Of the 514 students who answered the question, 164 (31.8%) reported being a member of the University’s Greek life system. Table 3 presents the results of the crosstabulation of the number of events attended and Greek organization membership. Both the chi square and Cramer’s V place the significance level for the crosstabulation at .000.
Quarterly Review of Business Disciplines – Volume 1, Issue 1, May 2014
Page 8
Table 3. Greek Life by Number of Events Attended
Greek Life? Number of Events Attended
Total 0 1 2 3 4+
Yes N 32 36 36 18 15
137 Exp. N 59.3 28.8 23.3 13.4 12.3
No N 141 48 32 21 21 263 Exp. N 113.7 55.2 44.7 25.6 23.7
Total Count 400 84 68 39 36 400 Pearson X2=35.710, 4df, p< .000; Cramer's V=.299, Sig=.000
Members of Greek organizations reported higher than expected attendance at university
sponsored events, programs, etc. For example, the number of Greek members who reported having attended no university events was slightly more than one-half of what would have been expected, but for all four categories of event attendance their observed frequency was higher than what would have been expected. Conversely, those students who were not members of the Greek system were more likely to have attended no events, than what would have been expected. Thus, across the board the respondents who are members of the Greek system at the university were significantly more likely to attend events.
RQ 1d – Are there differences in student participation based on the student’s membership in a
university-recognized organization?
In an attempt to determine if student involvement crosses over into other areas, students were asked to indicate if they were a member of any campus organization. The results were very even. Of the 513 who responded to the item, 258 (50.3%) indicated that they were members of a campus organization with the other 255 saying that they were not.
Table 4. Student Organization Membership by Number of Events Attended
Student Organization
Member?
Number of Events Attended Total 0 1 2 3
4+
Yes
N 77 44 47 23 27 218
Exp. N 94.3 45.8 37.1 21.3 19.6
No N 96 40 21 16 9
182 Exp. N 78.7 38.2 30.9 17.7 16.4
Total 173 84 68 39 36 400 Pearson X2= 19.392, 4 df, p < .001; Cramer's V = .220, Sig= .001
The statistically significant results on table 4 are similar to the results of table 3 related to the Greek system. Respondents who reported being a member of a student organization were more likely to have participated in a higher number of events. Students who reported that they were not
Quarterly Review of Business Disciplines – Volume 1, Issue 1, May 2014
Page 9
a member of a campus group reported lower levels of attendance at events than what would have been expected. RQ 2 – What events or programs would students like to see brought to campus?
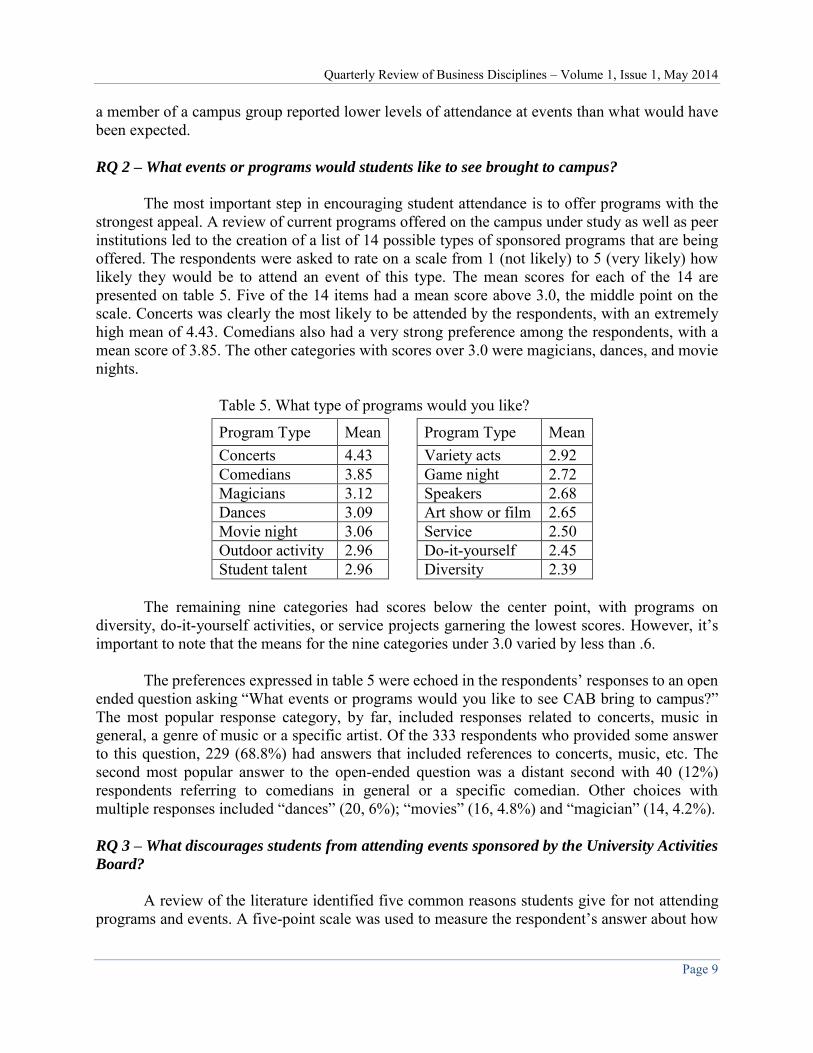
The most important step in encouraging student attendance is to offer programs with the strongest appeal. A review of current programs offered on the campus under study as well as peer institutions led to the creation of a list of 14 possible types of sponsored programs that are being offered. The respondents were asked to rate on a scale from 1 (not likely) to 5 (very likely) how likely they would be to attend an event of this type. The mean scores for each of the 14 are presented on table 5. Five of the 14 items had a mean score above 3.0, the middle point on the scale. Concerts was clearly the most likely to be attended by the respondents, with an extremely high mean of 4.43. Comedians also had a very strong preference among the respondents, with a mean score of 3.85. The other categories with scores over 3.0 were magicians, dances, and movie nights.
Table 5. What type of programs would you like?
Program Type Mean Program Type Mean Concerts 4.43 Variety acts 2.92 Comedians 3.85 Game night 2.72 Magicians 3.12 Speakers 2.68 Dances 3.09 Art show or film 2.65 Movie night 3.06 Service 2.50 Outdoor activity 2.96 Do-it-yourself 2.45 Student talent 2.96 Diversity 2.39
The remaining nine categories had scores below the center point, with programs on diversity, do-it-yourself activities, or service projects garnering the lowest scores. However, it’s important to note that the means for the nine categories under 3.0 varied by less than .6. The preferences expressed in table 5 were echoed in the respondents’ responses to an open ended question asking “What events or programs would you like to see CAB bring to campus?” The most popular response category, by far, included responses related to concerts, music in general, a genre of music or a specific artist. Of the 333 respondents who provided some answer to this question, 229 (68.8%) had answers that included references to concerts, music, etc. The second most popular answer to the open-ended question was a distant second with 40 (12%) respondents referring to comedians in general or a specific comedian. Other choices with multiple responses included “dances” (20, 6%); “movies” (16, 4.8%) and “magician” (14, 4.2%). RQ 3 – What discourages students from attending events sponsored by the University Activities
Board?
A review of the literature identified five common reasons students give for not attending programs and events. A five-point scale was used to measure the respondent’s answer about how
Quarterly Review of Business Disciplines – Volume 1, Issue 1, May 2014
Page 10
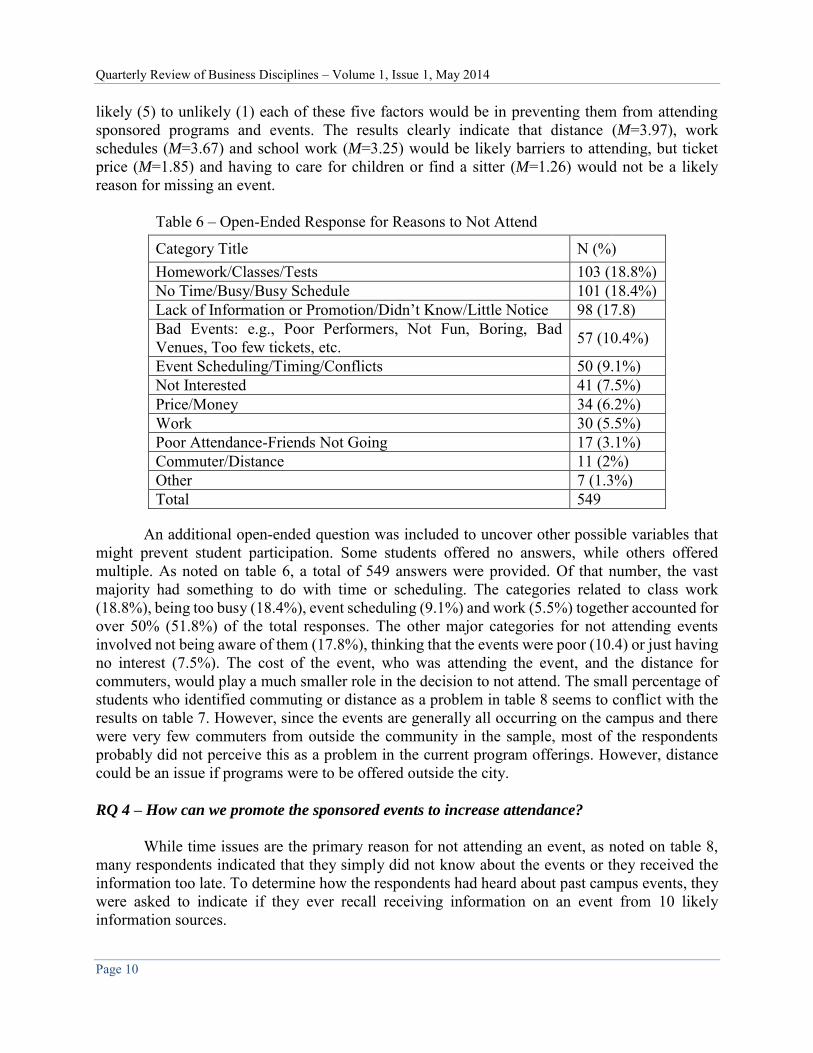
likely (5) to unlikely (1) each of these five factors would be in preventing them from attending sponsored programs and events. The results clearly indicate that distance (M=3.97), work schedules (M=3.67) and school work (M=3.25) would be likely barriers to attending, but ticket price (M=1.85) and having to care for children or find a sitter (M=1.26) would not be a likely reason for missing an event.
Table 6 – Open-Ended Response for Reasons to Not Attend
Category Title N (%) Homework/Classes/Tests 103 (18.8%) No Time/Busy/Busy Schedule 101 (18.4%) Lack of Information or Promotion/Didn’t Know/Little Notice 98 (17.8) Bad Events: e.g., Poor Performers, Not Fun, Boring, Bad Venues, Too few tickets, etc. 57 (10.4%)
Event Scheduling/Timing/Conflicts 50 (9.1%) Not Interested 41 (7.5%) Price/Money 34 (6.2%) Work 30 (5.5%) Poor Attendance-Friends Not Going 17 (3.1%) Commuter/Distance 11 (2%) Other 7 (1.3%) Total 549
An additional open-ended question was included to uncover other possible variables that might prevent student participation. Some students offered no answers, while others offered multiple. As noted on table 6, a total of 549 answers were provided. Of that number, the vast majority had something to do with time or scheduling. The categories related to class work (18.8%), being too busy (18.4%), event scheduling (9.1%) and work (5.5%) together accounted for over 50% (51.8%) of the total responses. The other major categories for not attending events involved not being aware of them (17.8%), thinking that the events were poor (10.4) or just having no interest (7.5%). The cost of the event, who was attending the event, and the distance for commuters, would play a much smaller role in the decision to not attend. The small percentage of students who identified commuting or distance as a problem in table 8 seems to conflict with the results on table 7. However, since the events are generally all occurring on the campus and there were very few commuters from outside the community in the sample, most of the respondents probably did not perceive this as a problem in the current program offerings. However, distance could be an issue if programs were to be offered outside the city. RQ 4 – How can we promote the sponsored events to increase attendance?
While time issues are the primary reason for not attending an event, as noted on table 8,
many respondents indicated that they simply did not know about the events or they received the information too late. To determine how the respondents had heard about past campus events, they were asked to indicate if they ever recall receiving information on an event from 10 likely information sources.

Quarterly Review of Business Disciplines – Volume 1, Issue 1, May 2014
Page 11
As noted on figure 1, word of mouth, or friends, was the clear leader in communicating event information, followed by flyers and Facebook postings. Flyers were the only traditional communication source that appears to be effective with the respondents in this study. Other traditional advertising/promotion communications vehicles (radio, television, table tents and newspaper) were found at the bottom of the effectiveness list. Computer mediated communications (CMC) (Twitter, website, and Facebook) were all in the top half of communication sources.
DISCUSSION
Many colleges and universities are seeing an increasing number of students seeking educational opportunities, yet the national retention rate is 65.8% (ACT, 2013). The body of literature on factors impacting student retention notes that student involvement in campus activities is one of the critical elements. From a business perspective, retention pays—for students in terms of future employment and for institutions in terms of revenue. The purpose of this investigation is to determine student preferences for both campus activities and the ways in which student activities programming boards can communicate event information. Babcock and Marks (2011) found students are spending more time on their social life and activities outside the classroom. However, the current research found that, approximately one-third of the students surveyed knew about these social programs yet never attended, and 22.3% indicated that they were not aware of any University activity programming board options. Students are doing something with their time, but it may not be with campus activities designed to enhance involvement and thus retention. The student programming literature seems to align with brand and consumer behavior literature by suggesting that to increase student interest and attendance, University activities boards should look not only at what is being offered for entertainment but also incorporate creative marketing strategies to develop brand familiarity (awareness) and enhance social media to reach students in a competitive environment. A lack of knowledge and limited participation are lost opportunities for connecting with other students in out-of-class activities.
6.4 6.7
19.1 19.1 19.9 25 25.1
38.6 42.8
58.3 Figure 1. Percentage of respondents who indicated hearing about events from each of these communication sources?

Quarterly Review of Business Disciplines – Volume 1, Issue 1, May 2014
Page 12
Even the most appealing program may not have the attendance desired, and also be a missed opportunity to make and reinforce organizational, institutional, and social connections. Program preferences in table 6 demonstrated students had the most interest in concerts and comedians. However, no matter the event, the statistical results in figure 1 indicate that word-of-mouth, or friends, and flyers/posters are the primary way students learned about student activity programming board events. Social networks continue to be an essential aspect of a strong promotional strategy. These results are closely aligned with those of Lubbers and Joyce (2013) who found that the top information sources preferred by undergraduates for information on University sporting events were the University website, social media, flyers, and word of mouth. The importance of word of mouth and computer mediated communications found in the current investigation is consistent with the research of Fall and Lubbers (2010).
The statistical results indicate that only 44.1% of the students surveyed had participated in at least one activities board event. Also, the students most likely to participate in any activities board event are members of the University’s Greek life community (table 3), and/or a member in some student organization (table 4). These results seem to speak to the need of collaboration as a means of promoting and generating greater interest that may contribute to the likelihood of attending events.
According to the 2012 National Survey of Student Engagement (NSSE) first-year students who frequently interacted with peers, faculty, and campus units using social media were more engaged. Figure 1 notes that the respondents value social media as a source for information about campus events. Technology and Web 2.0 applications are an important way to directly reach and engage students. For example, Thackeray et al. (2008) note that customers who are active participants are more likely to talk to their friends about it. Social media’s active nature and multiple channels facilitate interaction between individuals and organizations (Berthon et al., 2012). The creative use of these applications then becomes crucial for organizations to develop two-way brand relationships utilizing new media channels (Papasolomou & Melanthiou, 2012). This study investigated student preferences for campus activities and the ways in which student activities programming boards can communicate event information. Future research might include examining how University activities boards can build brand identity, how social activities contribute to brand identity and students’ perception of institutional affiliation.
REFERENCES
Aaker, D. A. (1996). Building strong brands. New York: Free-Press.
American College Testing (ACT). (2013). National collegiate retention and persistence to
degree rates. Retrieved from http://www.act.org Arias, A., & Micalone, G. (2013). Building an impactful brand for your programming board.
Campus Activities Programming, 45(6), 23-25. Astin, A. W. (1977). Four critical years. San Francisco: Jossey-Bass.

Quarterly Review of Business Disciplines – Volume 1, Issue 1, May 2014
Page 13
Babcock, P., & Marks, M. (2011). The falling time cost of college: Evidence from half a century of time use data. The Review of Economics and Statistics, 93, 468-478.
Berthon, P. R., Pitt, L. F., Plangger, K., & Shapiro, D. (2012). Marketing meets web 2.0, social
media and creative consumers: Implications for international market strategy. Business
Horizons, 55, 261.271. Borgmann, R. (2013). Getting the most out of your program: Basic ideas for effective marketing.
Campus Activities Programming, 45(6), 38-41. Campbell, M. C., Keller, K. L., Mick, D. G., & Hoyer, W. D. (2003). Brand familiarity and
advertising repetition effects. Journal of Consumer Research, 30(2), 292-304. Chen, C. C., Chen, P. K., & Huang, C. E. (2012). Brands and consumer behavior. Social
Behavior and Personality, 40(1), 105-114. Corces-Zimmerman, C. (2011). Campus activities in the age of social media. Campus Activities
Programming, 44(4), 6-9. Espino, D. (2008). Power of marketing: Balancing classic and new media. Campus Activities
Programming, 41(2), 40-43. Fall, L. T., & Lubbers, C. A. (2010). Assessing an expanding niche market: Determining how
IMC information sources predict participation in agritourism activities among vacation travels. International Journal of Integrated Marketing Communications, 2, 17-28.
Hilson, K. (2013). The 5 most common public relations mistakes student programmers make.
Campus Activities Programming, 46(2), 26-27. Kuh, G. D., Kinzie, J., Schuh, J. H., & Whitt, E. J. (2005). Student success in college: Creating
conditions that matter. San Francisco: Jossey-Bass. Lubbers, C. A., & Joyce, T. A. (2013). The role of information source, scheduling and interest in
game day activities on attendance of collegiate sporting events. In M. A. Goralski and H. P. LeBlanc (Eds.), Business Research Yearbook, (511-518). International Academy of Business Disciplines and International Graphics, Beltsville, MD.
National Survey of Student Engagement (NSSE). (2012). Promoting student learning and
institutional improvement: Lessons from NSSE at 13. Bloomington, IN: Indiana University Center for Postsecondary Research.
Papasolomou, I., & Melanthiou, Y. (2012). Social media: marketing public relations’ new best
friend. Journal of Promotional Management, 18, 319-328.

Quarterly Review of Business Disciplines – Volume 1, Issue 1, May 2014
Page 14
Pascarella, E. T., & Terenzini, P. T. (2005). How college affects student, volume 2: A third
decade of research. San Francisco: Jossey-Bass. Sneath, J. Z., Finney, R. Z., & Close, A. G. (2005). An IMC approach to event marketing: The
effects of sponsorship and experience on consumer attitudes. Journal of Advertising
Research, 45(4), 373-371. Thackeray, R., Neigler, B. L., Hanson, C. L., & McKenzie, J. F. (2008). Enhancing promotional
strategies within social marketing programs: Use of web 2.0 social media. Health
Promotion Practice, 9(4), 338-343. Tieu, T. T., & Pancer, S. M. (2009). Youth involvement and first year students’ transition to
university: Quality vs. quantity of involvement, Journal of the First Year Experience and
Students in Transition, 21, 43-64. Wood, E. H. (2009). Evaluating event marketing: Experience or outcome. Journal of Promotion
Management, 15, 247-268. doi:10.1080/10496490902892580.
Quarterly Review of Business Disciplines – Volume 1, Issue 1, May 2014
Page 15
THE MYTH OF THE OVERPAID, UNDERWORKED AND UNDERQUALIFIED
BUSINESS PROFESSORIATE: A CASE STUDY
James E. Weber, St. Cloud State University
Paula S. Weber, St. Cloud State University [email protected]
Martin Breaker, St. Cloud State University
ABSTRACT
In the aftermath of the recent economic recession, many state supported institutions of
higher learning faced significant budget reductions. Among the ways to cope with these reductions were public calls for pay cuts for highly paid university professors, and business professors are typically among the highest paid faculty at many public colleges and universities. Moreover, there is often a general perception that business professors are not as qualified as other professors, work less and do less research, while producing poorer students than other campus units. While these perceptions were, and perhaps still are, widely held, the facts are less clear. This case study examined data from a single mid-sized Midwestern public comprehensive university with an AACSB accredited business program in order to explore the question of whether business professors there are overpaid, underworked and under-qualified. Results show that for this case, claims that business professors are overpaid, underworked and underqualified are not supported by the data.
Keywords: Faculty Workload; Faculty Qualifications; Faculty Salaries; Business Professor
Salaries
INTRODUCTION
In the aftermath of almost unprecedented economic times, many state supported institutions of higher learning faced significant budget reductions (Kelderman, 2011). There were public calls for pay cuts for university professors (Berrett, 2011; Milburn, 2011; Selix, 2009; "State…," 2011; "UA…," 2008) who have long been accused of being overpaid and underworked (Berrett, 2011). As business professors are typically among the highest paid faculty at many public colleges and universities, they are natural candidates for budget cuts ("Average…" 2013; "Faculty…," 2011; Finch, Allen, & Weeks, 2010; HayGroup, 2011).
In addition, there is a perception that business professors are not as qualified as other
professors (Surber, 2010). It has been argued that they work less and do less research, while
Quarterly Review of Business Disciplines – Volume 1, Issue 1, May 2014
Page 16
producing poorer students than other campus units (Glenn, 2011). The online comments associated with the Glenn article are especially instructive. The comments are anonymous, and the level of civility displayed is low. Comments include the comparison of business graduates to trained apes, a derisory statement that business schools (except for the top 50) are worthless, and a suggestion that economics in business is useless except as a cover story for theft on Wall Street. In the same vein, others suggest that business professors are often shunned by other disciplines and in return “sob all the way to Davos” (Hollinger, 2013, p. B6), the host of the World Economic Forum, implying that these professors are beholden to business and care nothing of academe. To paraphrase one commenter (Rabuzzi, 2001), the separate cultures of the humanities and business seem to either demonize or ignore each other.
The relative high pay of business professors, particularly new business professors, tends to
generate ill will with professors from other disciplines, even though salaries are typically based on market factors such as supply and demand (HayGroup, 2011; Mangan, 2001). Salary differentials tend to be a particularly sensitive issue with professors from other disciplines who believe that liberal arts professors are more highly educated than business professors (Surber, 2010). The academic literature has discussed a number of possible negative outcomes associated with differential pay, such as morale, organizational commitment, recruitment problems, equity and job comparability (Bellas, 1997; Scott & Bereman, 1992). Hearn (1999) supports limits to differential pay by providing nine policy choices that taken together would effectively eliminate professor salary based on discipline.
Generally, liberal arts faculty would prefer an approach such as Reed College uses that
pays all fields equally, versus the practice of paying differentially based on discipline (Marthers & Parker, 2008). Since there is some suggestion that unionization increases faculty influence over pay scales (Schmidt, 2011), it might be inferred that liberal arts professors would prefer a union environment that offers greater pay equity, particularly as liberal arts faculty vastly outnumber business faculty (by 2.8 times at the university used in this case study) and could potentially dominate union contract negotiations regarding pay scales and differential compensation for different disciplines.
At the study institution, the belief that business professors worked less was also prevalent.
At this institution, business professors who were actively engaged in research and maintained a level of research and preparation consistent with the universities mission received a one-course per semester release from teaching. All tenure track business faculty received this teaching reduction. Professors from disciplines outside of business with similar accomplishments did not receive this benefit, generating complaints of unfairness.
While perceptions of workload and pay differentials are widely discussed, supporting data
for these and other perceptions are somewhat lacking. Some of these beliefs are easily dismissed. In terms of qualifications, for example, in the 1950’s it was true that fewer business professors had PhDs as compared to other disciplines (Gordon & Howell, 1959; Pierson, 1959). That situation is no longer widely true. For example, in the dataset used for this case study 88% of business faculty possessed doctorates in 2010, compared to 84% of the rest of the university. In terms of student quality, the book Academically Adrift (Arum & Roksa, 2011) is widely cited as evidence of the
Quarterly Review of Business Disciplines – Volume 1, Issue 1, May 2014
Page 17
poor preparation of business students for the marketplace (c.f. comments attached to the 2011 Glenn article cited above). Limiting the usefulness of Arum and Roksa’s observations, however, is their methodology, which examined not what students learned in their business programs, but what they learned during the prior two years of their general education program. Regardless, business students’ poor preparation coming into a business program has little bearing on business faculty salaries, and although assurance of student learning is a relatively new aspect of business education, schools of business are hardly alone in needing to document positive student outcomes ("Purpose…," 2011). This paper focuses on data analysis to determine if the perceptions of business professors as overpaid and underworked are valid.
That business professors are highly paid is hardly debatable. In two recent studies
published in the Chronicle of Higher Education, full professors in Business Administration and Management earned more than Full professors in all but a few of the disciplines listed ("Average…," 2013; "Faculty…," 2011). While these data document the existence of salary differences, the reasons for these higher business salaries were not explored.
One reason for the differences is that business salaries are at least partially market driven
(Bellas, 1997; Hearn, 1999), and the long-term shortage of doctorally qualified faculty in business is also well known (Damast, 2009; "A few…," 2007; Mangan, 2001). In 1992 it was widely advertised that there were two openings for every PhD graduate in business (Kurst, 1992). When demand for business professors was higher than the supply, salaries increased (Mangan, 2001). Second, looking at simple salary differentials does not tell the full story. Other things being equal, a professor who teaches more students or publishes more would not be considered overpaid in comparison to others who lacked those responsibilities and accomplishments. Additionally, a fair comparison of workload should include credit hours taught. This paper examines data from a medium sized, unionized, Midwestern public comprehensive university (referred to hereafter as MPCU) with an AACSB accredited business program in an attempt to explore the issues of whether business professors are overpaid and underworked.
METHOD
Data for this study were collected from three primary sources. First, salary data for faculty members at MPCU were collected from a locally published State Worker Pay Database for the academic year 2009-2010. These data had been obtained from the state in an open records request. This database provided the official base pay for each state worker and pay for MPCU employees was extracted from these data. Second, the MPCU faculty union Seniority Roster for 2009-2010 was used to establish which faculty members were employed, their assigned department, and their employment status (full-time versus part-time). Third, an integrated statewide record system was queried to determine credit hour generation for each faculty member at MPCU. These sources were used to create a database containing faculty members’ names, base salary, credit hours generated, assigned department, college or other larger unit, and full-time versus part-time status.
Data were imported into SPSS and initial descriptive statistics were calculated.
Examination of the initial results led to the elimination of specialized single-person departments (which typically had extremely low credit hour generation) and non-academic departments from

Quarterly Review of Business Disciplines – Volume 1, Issue 1, May 2014
Page 18
further analysis. For example, the Athletics department was excluded from analysis during this step. In order to aid interpretation and avoid biasing the results, individuals who taught less than 90 credit hours (mostly higher-paid department heads) and those who taught more than 2,340 credit hours during the year (the professors teaching the few, large lecture sections offered at MPCU) were also eliminated from further analysis. Descriptive statistics used in this study for salary and semester credit hours generated per faculty members in each department in the university were calculated for the remaining sample.
The remaining sample was then analyzed to determine if significant differences existed
between business professors and the other university professors in terms of salary, credit hours taught, and salary per credit hour using SPSS’s General Linear Model (GLM).
Results
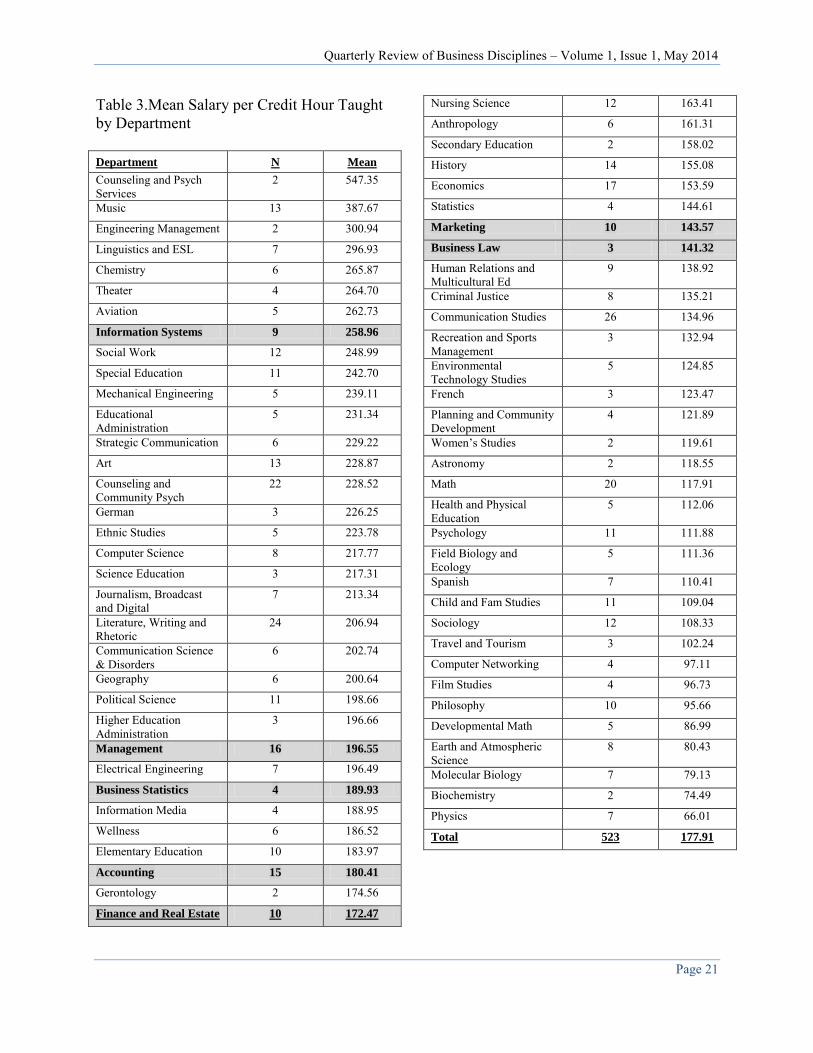
Average semester credit hours generated per faculty member in the department, salaries and salary per credit hour generated per faculty member in each of the sixty-seven departments at MPCU were calculated and appear in Tables 1-3. Results are sorted from high to low and departments within the business school are highlighted. The number of faculty within the department is listed in the column headed “N”. Results show that most business departments were above the median value of the table for average semester credit hours generated, all are above the median on salary, and results varied for salary per semester credit hour for business departments. The median value in each table is underlined.
Means for business professors versus the rest of the university on salary, credit hours
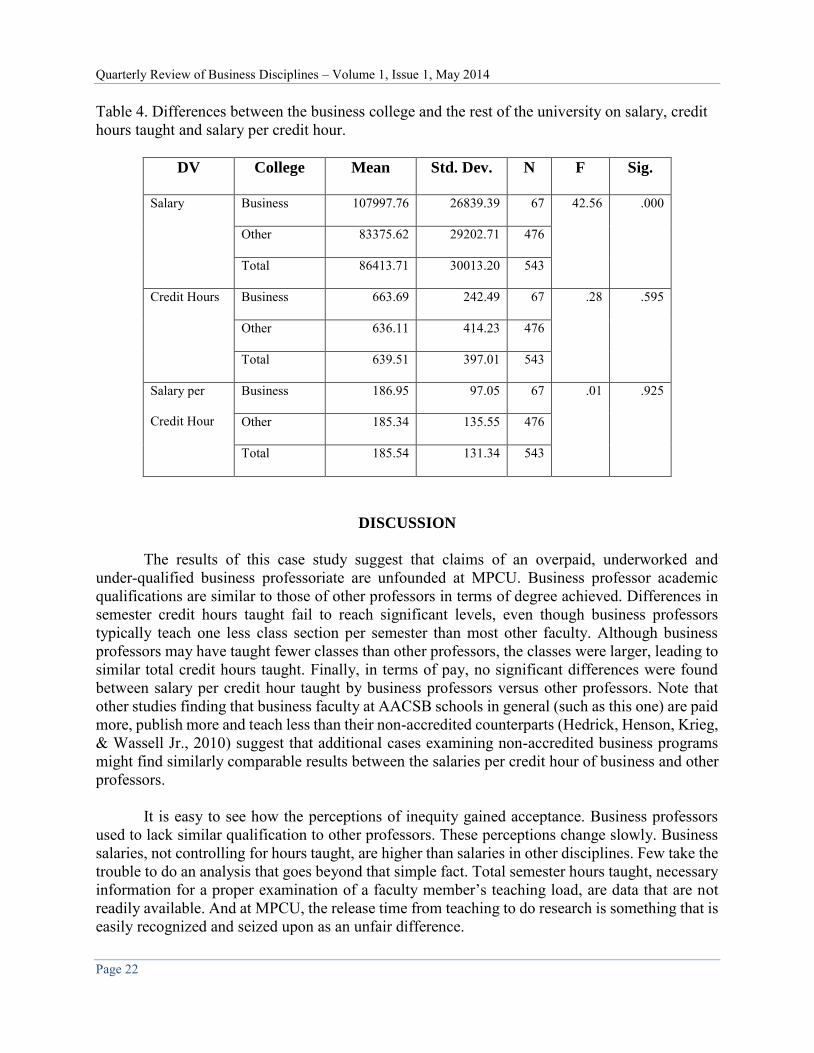
taught and salary per credit hour were examined using SPSS General Linear Model (GLM). GLM was used to simulate a Multivariate Analysis of Variance (MANOVA) with three dependent variables, in an effort to protect against Type I error by evaluating an overall multivariate F-test. Multivariate F-tests for all variables were identical and significant (F3, 539 = 21.16, p = .000). Since the overall F-tests indicated that further interpretation was appropriate, significance levels and marginal means for the individual dependent variables were examined. While salaries were significantly higher for business professors (p = .000), there were no significant differences between salary per credit hour taught for business professors versus the rest of the university. Although mean hours taught for business professors was higher than for other faculty (664 hours, n = 67,versus 636 hours, n = 476), analysis failed to show that these differences were significant (F1,
542 = 0.28, p = .595). Results appear in Table 4 and discussion follows.

Quarterly Review of Business Disciplines – Volume 1, Issue 1, May 2014
Page 19
Table 1. Average Semester Credit Hours Generated by each Faculty Member in a Department Department N Mean
Physics 7 1574.71 Molecular Biology 7 1530.29 Psychology 11 1247.64 Criminal Justice 8 1167.63 Earth and Atmospheric Science 8 1073.50
Field Biology and Ecology 5 1069.20 Child and Fam Studies 11 1022.00 Biochemistry 2 989.00 Philosophy 10 980.50 Astronomy 2 887.50 Math 20 816.10 Marketing 10 798.60 Business Law 3 773.00 Spanish 7 751.29 French 3 738.67 Health and Physical Education 5 737.20
Developmental Math 5 730.80 Computer Networking 4 726.50 Film Studies 4 704.75 Statistics 4 701.75 Sociology 12 691.92 Finance and Real Estate 10 685.40 Economics 17 679.88 Travel and Tourism 3 676.33 Management 16 676.31 Environmental Technology Studies 5 662.00
Human Relations and Multicultural Ed 9 636.00
Counseling and Community Psych 22 629.73
Business Statistics 4 625.75 Communication Studies 26 622.42 Womens Studies 2 615.50 Computer Science 8 615.13 Nursing Science 12 608.92 Planning and Community Development 4 605.75
Geography 6 595.17 Political Science 11 592.27 Accounting 15 587.40 History 14 584.21 Wellness 6 579.33 Information Systems 9 574.78 Journalism, Broadcast and Digital 7 560.00
Recreation and Sports Management 3 551.67
Electrical Engineering 7 545.29 Special Education 11 493.45 Strategic Communication 6 490.83 Literature, Writing and Rhetoric 24 486.13
Anthropology 6 477.33 German 3 449.67 Art 13 439.69 Elementary Education 10 433.00 Gerontology 2 433.00 Higher Education Administration 3 428.67
Information Media 4 415.00 Comm Science & Disorders 6 410.50
Mechanical Engineering 5 405.40 Educational Administration 5 402.80
Ethnic Studies 5 402.00 Science Education 3 397.00 Linguistics and ESL 7 391.43 Chemistry 6 376.33 Social Work 12 375.08 Secondary Education 2 364.50 Aviation 5 359.60 Theater 4 301.75 Engineering Management 2 297.00 Music 13 213.62 Counseling and Psych Services 2 158.50
Total 523 650.83

Quarterly Review of Business Disciplines – Volume 1, Issue 1, May 2014
Page 20
Table 2. Mean Salary by Department
Department N Mean
Criminal Justice 8 148175
Field Biology and Ecology
5 120034
Information Systems 9 118325
Psychology 11 113922
Management 16 113631
Counseling and Community Psych
22 113408
Finance and Real Estate 10 112912
Business Statistics 4 110761
Business Law 3 109662
Molecular Biology 7 109276
Physics 7 106138
Marketing 10 106054
Computer Science 8 98865
German 3 96768
Geography 6 95239
Electrical Engineering 7 93019
Accounting 15 92742
Statistics 4 92306
Educational Administration
5 91787
Strategic Communication 6 91562
Mechanical Engineering 5 89459
Astronomy 2 89295
Economics 17 89069
Wellness 6 87761
Special Education 11 86769
Science Education 3 85185
Math 20 84490
Higher Education Administration
3 83553
Engineering Management 2 83528
Journalism, Broadcast and Digital
7 82806
Linguistics and ESL 7 82102
Human Relations and Multicultural Ed
9 82040
Literature, Writing and Rhetoric
24 81415
Earth and Atmospheric Science
8 80042
Counseling and Psych 2 79397
Services
Nursing Science 12 79381
Ethnic Studies 5 79052
Health and Physical Education
5 78782
History 14 78512
Environmental Technology Studies
5 78200
Chemistry 6 77864
Recreation and Sports Management
3 77096
Information Media 4 76025
Gerontology 2 75554
Child and Family Studies 11 75318
Music 13 74764
Communication Studies 26 74296
Political Science 11 73359
Communication Science & Disorders
6 73086
Women’s Studies 2 72913
Planning and Community Development
4 72699
Elementary Education 10 72451
French 3 72116
Aviation 5 71473
Anthropology 6 70807
Computer Networking 4 70368
Biochemistry 2 70150
Travel and Tourism 3 69308
Social Work 12 68304
Philosophy 10 67684
Art 13 66371
Theater 4 66278
Spanish 7 65895
Sociology 12 65418
Developmental Math 5 59953
Secondary Education 2 57797
Film Studies 4 57643
Total 523 86535
Quarterly Review of Business Disciplines – Volume 1, Issue 1, May 2014
Page 21
Table 3.Mean Salary per Credit Hour Taught by Department Department N Mean
Counseling and Psych Services
2 547.35
Music 13 387.67
Engineering Management 2 300.94
Linguistics and ESL 7 296.93
Chemistry 6 265.87
Theater 4 264.70
Aviation 5 262.73
Information Systems 9 258.96
Social Work 12 248.99
Special Education 11 242.70
Mechanical Engineering 5 239.11
Educational Administration
5 231.34
Strategic Communication 6 229.22
Art 13 228.87
Counseling and Community Psych
22 228.52
German 3 226.25
Ethnic Studies 5 223.78
Computer Science 8 217.77
Science Education 3 217.31
Journalism, Broadcast and Digital
7 213.34
Literature, Writing and Rhetoric
24 206.94
Communication Science & Disorders
6 202.74
Geography 6 200.64
Political Science 11 198.66
Higher Education Administration
3 196.66
Management 16 196.55
Electrical Engineering 7 196.49
Business Statistics 4 189.93
Information Media 4 188.95
Wellness 6 186.52
Elementary Education 10 183.97
Accounting 15 180.41
Gerontology 2 174.56
Finance and Real Estate 10 172.47
Nursing Science 12 163.41
Anthropology 6 161.31
Secondary Education 2 158.02
History 14 155.08
Economics 17 153.59
Statistics 4 144.61
Marketing 10 143.57
Business Law 3 141.32
Human Relations and Multicultural Ed
9 138.92
Criminal Justice 8 135.21
Communication Studies 26 134.96
Recreation and Sports Management
3 132.94
Environmental Technology Studies
5 124.85
French 3 123.47
Planning and Community Development
4 121.89
Women’s Studies 2 119.61
Astronomy 2 118.55
Math 20 117.91
Health and Physical Education
5 112.06
Psychology 11 111.88
Field Biology and Ecology
5 111.36
Spanish 7 110.41
Child and Fam Studies 11 109.04
Sociology 12 108.33
Travel and Tourism 3 102.24
Computer Networking 4 97.11
Film Studies 4 96.73
Philosophy 10 95.66
Developmental Math 5 86.99
Earth and Atmospheric Science
8 80.43
Molecular Biology 7 79.13
Biochemistry 2 74.49
Physics 7 66.01
Total 523 177.91
Quarterly Review of Business Disciplines – Volume 1, Issue 1, May 2014
Page 22
Table 4. Differences between the business college and the rest of the university on salary, credit hours taught and salary per credit hour.
DV College Mean Std. Dev. N F Sig.
Salary Business 107997.76 26839.39 67 42.56 .000
Other 83375.62 29202.71 476
Total 86413.71 30013.20 543
Credit Hours Business 663.69 242.49 67 .28 .595
Other 636.11 414.23 476
Total 639.51 397.01 543
Salary per
Credit Hour
Business 186.95 97.05 67 .01 .925
Other 185.34 135.55 476
Total 185.54 131.34 543
DISCUSSION
The results of this case study suggest that claims of an overpaid, underworked and under-qualified business professoriate are unfounded at MPCU. Business professor academic qualifications are similar to those of other professors in terms of degree achieved. Differences in semester credit hours taught fail to reach significant levels, even though business professors typically teach one less class section per semester than most other faculty. Although business professors may have taught fewer classes than other professors, the classes were larger, leading to similar total credit hours taught. Finally, in terms of pay, no significant differences were found between salary per credit hour taught by business professors versus other professors. Note that other studies finding that business faculty at AACSB schools in general (such as this one) are paid more, publish more and teach less than their non-accredited counterparts (Hedrick, Henson, Krieg, & Wassell Jr., 2010) suggest that additional cases examining non-accredited business programs might find similarly comparable results between the salaries per credit hour of business and other professors.
It is easy to see how the perceptions of inequity gained acceptance. Business professors
used to lack similar qualification to other professors. These perceptions change slowly. Business salaries, not controlling for hours taught, are higher than salaries in other disciplines. Few take the trouble to do an analysis that goes beyond that simple fact. Total semester hours taught, necessary information for a proper examination of a faculty member’s teaching load, are data that are not readily available. And at MPCU, the release time from teaching to do research is something that is easily recognized and seized upon as an unfair difference.

Quarterly Review of Business Disciplines – Volume 1, Issue 1, May 2014
Page 23
Study Limitations
The results of this study come from a study of one university. Though not necessarily generalizable, they suggest a method for comparing business and other professor salary that appropriately considers credit hour workload. In this case, when workload in terms of semester credit hours taught is taken into account, differences in pay for a given amount of work disappear. Pay is demonstrated to be equitable from that perspective.
This study has no control for program-level accreditation. Although the business program
at MPCU is AACSB accredited and 23 other programs on campus possess similar accreditation in their disciplines, others do not. This study could not identify whether accreditation had an effect on salaries or workloads.
A similar limitation existed in terms of publications. All business professors were
academically qualified according to the AACSB, meaning they all met standards for quality and quantity of publications. Publication data for non-business disciplines were not readily available. Attempts to collect these data revealed a number of non-business professors who had no publication in the previous decade, but also led to complex questions of how what each discipline considers scholarly work could be compared. At the extreme, questions of “How is a dance recital compared to a journal article?” could become relevant.
Another consideration is that MPCU is unionized and it is possible that business salaries
are depressed and liberal arts inflated in comparison to other universities. This may mean that at other universities, salary per credit hour of business versus other professors might be different to some degree. Finally, examination of results shown in Tables 1-3 represent only one university. The small sample size in many departments may mean that averages shown in each table are extremely variable, and very sensitive to outliers, or in the case of salaries, to seniority effects.
CONCLUSION
This case study illustrates some of the considerations that must be taken into account during salary and pay equity debates that many states, colleges and universities are experiencing. In a time of tightening resources, professors need, now more than ever, to justify their performance. Nationally, there is a perception that business professors (in comparison to other professors) are under-qualified, underworked, and overpaid. This case study suggests that at MPCU these perceptions lack credibility and are not supported by the data.
In examining some of the issues involved in pay equity disputes at MPCU, this study
showed that business professor salaries, in conjunction with their credit hour work load, are consistent with those of other disciplines. Examining the metrics used in comparing salaries, job responsibilities and work load between disciplines is a worthwhile task. In this study, using salary per credit hour provides us with a different and perhaps more valid perspective on pay equity.
Quarterly Review of Business Disciplines – Volume 1, Issue 1, May 2014
Page 24
REFERENCES
A few good professors: U.S. business schools suffer a dearth of doctorates. (2007, June 6). [email protected]. Retrieved from http://knowledge.wpcarey.asu.edu/article.cfm?articleid=1426#
Arum, R., & Roksa, J. (2011). Academically adrift : limited learning on college campuses.
Chicago: University of Chicago Press. Average Salaries of Tenured and Tenure-Track Faculty at 4-Year Colleges, 2012-13. (2013).
Almanac of Higher Education 2013 Retrieved from http://chronicle.com/article/Average-Salaries-of-Tenured/137705/
Bellas, M. L. (1997). Disciplinary Difference in Faculty Salaries. Journal of Higher Education,
68(3), 299-321. Berrett, D. (2011). Turning on the faculty. Inside Higher Ed. Retrieved from
http://www.insidehighered.com/layout/set/print/news/2011/01/21/public_college_faculty_fer_loss_of_public_support
Damast, A. (2009, May 11). Business PhD Applications on the Rise. BusinessWeek, from
http://www.businessweek.com/print/bschools/content/may2009/bs20090511_815452.htm Faculty salaries vary by institution type, discipline. (2011, April 11). The Chronicle of Higher
Education. Retrieved from http://chronicle.com/article/Faculty-Salaries-Vary-by/127073 Finch, H. J., Allen, R. S., & Weeks, H. S. (2010). The Salary Premium Required for Replacing
Management Faculty: Evidence From a National Survey. Journal of Education for
Business, 85(5), 264-267. Glenn, D. (2011, April 14). Business educators struggle to put students to work. The Chronicle of
Higher Education, 33(57), Retrieved from http://chronicle.com/article/Business-Educators-Struggle-to/127108/
Gordon, R. A., & Howell, J. E. (1959). Higher Education for Business. New York: Columbia
University Press. HayGroup. (2011). Minnesota state colleges and universities: Paying professors equitably is a
learning experience Retrieved from http://www.haygroup.com/ww/Downloads/Details.aspx?ID=1110
Hearn, J. C. (1999). Pay and Performance in the University: An Examination of Faculty Salaries.
The Review of Higher Education, 22(4), 391-410.
Quarterly Review of Business Disciplines – Volume 1, Issue 1, May 2014
Page 25
Hedrick, D. W., Henson, S. E., Krieg, J. M., & Wassell Jr., C. S. (2010). The Effects of AACSB Accreditation on Faculty Salaries and Productivity. Journal of Education for Business,
85(5), 284-291. Hollinger, D. A. (2013). The Rift: Can STEM and the humanities get along? Chronicle of Higher
Education, 60(7), B6-B9. Kelderman, E. (2011, January 24). State spending on higher education edges down, as deficits
loom. The Chronicle of Higher Education Retrieved from http://chronicle.com/article/State-Spending-on-Colleges/126020
Kurst, C. (Ed.). (1992). Guide to Doctoral Programs in Business and Management. St. Louis, MO:
American Assembly of Collegiate Schools of Business. Mangan, K. S. (2001). A Shortage of Business Professors Leads to 6-Figure Salaries for New
Ph.D.'s. Chronicle of Higher Education, 47(34), 12-13. Marthers, P., & Parker, J. (2008). Small Colleges and New Faculty Pay. Academe, 94(4), 45-49. Milburn, J. (2011, 3/21/2011). Kansas House panel resumes work on proposed budget. Bloomberg
BusinessWeek Retrieved from http://www.businessweek.com/ap/financialnews/D9M3RUHOO.htm
Pierson, F. C. (1959). The Education of American Businessmen: A Study of University-College
Programmes in Business Administration. New York: McGraw-Hill. Purpose of the North Central Association. (2011). Retrieved from
http://www.northcentralassociation.org/PURPOSE%20OF%20THE%20NORTH%20CENTRAL%20ASSOCIATION.htm
Rabuzzi, D. A. (2001). Business needs the Humanities. [journal]. Liberal Education, 87(1), 6. Schmidt, P. (2011). What Good do Faculty Unions Do? The Chronicle of Higher Education,
57(35), A1-A4. Scott, J. A., & Bereman, N. A. (1992). Competition versus Collegiality: Academe's Dilemma for
the 1990s. Journal of Higher Education, 63(6), 984-698. Selix, C. (2009, April 200. Pay cuts: New trend takes hold. MinnPost.com Retrieved from
http://www.minnpost.com/stories/2009/04/20/8160/pay_cuts_new_trend_takes_hold State pay cuts should be on the table. (2011). Retrieved from
http://www.thestate.com/2011/01/13/164293/state-pay-cuts-should-be-on-the.html

Quarterly Review of Business Disciplines – Volume 1, Issue 1, May 2014
Page 26
Surber, J. P. (2010, February 7). Well, naturally we're liberal. The Chronicle of Higher Education Retrieved from http://chronicle.com/article/Well-Naturally-Were-Liberal/63870/
UA provost suggests pay cuts. (2008, December 22). Retrieved from
http://www.azcentral.com/news/articles/2008/12/22/20081222uacosts.html
Quarterly Review of Business Disciplines – Volume 1, Issue 1, May 2014
Page 27
IS MANAGEMENT THE REAL PROBLEM?
NEGLIGENT RETENTION AND PERFORMANCE MANAGEMENT
Diane Bandow, Troy University [email protected]
Dennis Self, Troy University
Terry Self, Independent Scholar [email protected]
ABSTRACT
Managers are responsible for employees, yet some managers are reluctant to deal with underperformance, poor performance, and problem employees. When managers fail to manage these issues, they expose their organizations to the risk of losing productive employees, as well as, to incurring costs associated with keeping nonproductive workers on the payroll. In addition, U.S. courts are holding employers responsible for the acts of employees at state and federal levels. Liability has not been limited to the execution of job responsibilities, but also to employee behavior in general. The concept of negligent retention is reviewed in a management context, including performance issues for managers and employees. Organizational liability may be an issue if managers know about negative employee behavior and fail to act to protect stakeholders, including other employees and customers. Organizations are responsible for preparing and training managers to deal with employees and may need to further develop managers who can effectively and consistently evaluate and develop employees. Proactive management includes due diligence at all levels of management, not limited to training, addressing performance issues, addressing policies and procedures, establishing behavior standards, and enforcing accountability. Confronting poor management practices and poor performers immediately, when training and development of managers and employees may have a positive impact, may also reduce potential future legal problems, improve management practices, improve performance, and help retain productive employees.
Keywords: Poor performance, liability, management, development
INTRODUCTION
Courts at the state and federal level are finding employers liable for the acts of employees (Klaassen & Kleiner, 2001) performed while on the job. “Respondent superior” is the legal term that refers to acts performed on the job, which are considered normal and expected; employers are held responsible for such acts conducted by their employees (Nowak, 1999; Self & Self, 2014). However, other employee behaviors – such as being the workplace bully (Indvik &
Quarterly Review of Business Disciplines – Volume 1, Issue 1, May 2014
Page 28
Johnson, 2012), violence in the workplace (Lewis & Gardner, 2000), the use of company Internet to conduct criminal acts on third parties outside of the business (Nowak, 1999), acts of theft, and other acts performed in the workplace that are not related to job performance – may also place the employer at risk. Philbrick, Sparks, Hass and Arsenault (2003) discuss violence that can be incurred by outsiders, customers or clients, and current or former employees; for the purposes of this paper, the discussion is limited to current employees. Employer liability for employee acts of any kind in the workplace should be of paramount concern. Klaassen and Kleiner (2001) and Nowak (1999) explain that employers must understand between respondent superior, where the employer is responsible for behavior the employee conducted in the line of work, and the doctrine of negligent retention that may apply when employers “knew or should have known” not only of the possibility for undesirable behavior, but also for potentially criminal acts. What is more concerning is that there is a paucity of literature dealing with the need to manage effectively to avoid litigation related to negligent retention.
Kerr (1975) points out the poor practices and inconsistency of management when dealing
with employees.Von Bergen, Bandow, and Eppler (2012) also note that managers themselves are frequently the unintended cause of poor performance. Poor performance does not go unnoticed by other employees. For example, perceptions about a lack of justice, fairness, or both are not likely to contribute to improvements in employee commitment and to innovation in organizations (Eberlin & Tatum, 2008). Poor management practices continue to allow poor performance by employees. This was further supported by Atkinson (1992) who explained how managers are the real problem because they fail to take responsibility for employee behaviors and thus fail to achieve organizational goals and results necessary for success. Goodhew, Cammock, and Hamilton (2008) found significant inconsistencies in how managers deal with nonperforming employees in an organizational case study and found managerial behavior at fault. Although management may know there are employee behavior concerns, there is a lack of action to deal with employees; managers often do not know what to do or may fail to act appropriately or to act at all, thus non-performance remains “as is” in organizations (Lewis & Gardner, 2000) and continues to contribute to low performance, low morale, and low output. This lack of action also contributes to lower performance of other capable employees and, in general, reduces the effectiveness of the entire organization. Self and Self (2014) contend that the fiduciary responsibility of the organization compels a proactive approach in managing employees to avoid potential issues.
Reluctance to address these underperforming employees is often rationalized by
management as ‘giving them another chance’ (Usry & Mosier, 1991) when in reality it is another way for management to avoid dealing with a difficult situation. Atkinson (1992) estimated that 10 to 25% of all employees are poor performers; however, his primary concern was that managers do not take action on behalf of the organization to manage these poor performers. Atkinson (1992) questions the commitment of managers in general as some said they would do it differently if they owned the business. Where are managerial accountability, responsibility, and commitment to the organization? As Self and Self (2014) indicate, employers may be liable and underperforming employees may not only impair effectiveness and productivity, but also leave an opening for litigation related to negligent retention. The authors acknowledge that negligent retention may include the potential for criminal activities which may be included in the negligent
Quarterly Review of Business Disciplines – Volume 1, Issue 1, May 2014
Page 29
retention discussion, but the focus of this paper is on the role of management and how to improve the practice of management to reduce the potential for negligent retention. Criminal activities in this regard may or may not be predictable based on how managers supervise (or do not supervise) employees. This paper addresses the management approach to deal with nonperforming employees with the intent to avoid negative impact on the organization itself in terms of morale, performance, outcomes, and quality while at the same time noting likely issues in potential negligent retention situations. Negligent retention and background issues are discussed with applicable theory. Recommendations are provided for a more proactive approach to managing employees, followed by conclusions.
WHAT IS NEGLIGENT RETENTION?
Negligent retention is based in legal theory and is recognized in both federal and state courts (Klaassen & Kleiner, 2001; Nowak, 1999; Self & Self, 2014). Employers may create a liability by failure to see how potential actions can create injury or dangerous circumstances or events after hiring. This includes “…harmful acts of employees within the scope of employment, for acts ... by … employees inside or even outside that scope and foreseeable acts inside or even outside that scope by its existing employees” (Klaassen & Kleiner, 2001, p. 63). There is ample evidence of the lawsuits and negative impact on a business caused by violent employee actions. Klaassen and Kleiner (2001), Lewis and Gardner (2000), and Self and Self (2014) also identify other factors such as lower productivity and morale and increased attrition as a result of the perception of or real danger created by negative retention.
Violence and the threat of violence are prevalent in the workplace daily; according to
Hoolber and Swanberg (2006), an average of twenty workers are murdered and 18,000 assaulted weekly in the US. Philbrick, Sparks, Hass and Arsenault (2003) detail the potential legal costs to organizations and employers. Incidents of violence have created a rise in tort actions; because tort law is designed to support social policy, the four torts most often identified with employment decisions include negligent training, negligent retention, negligent supervision, and negligent hiring (Lewis & Gardner, 2000). This paper discusses negligent retention and the related aspects of negligent supervision. Both of these aspects would include having knowledge of the situation and failing to act either as a supervisor for training, discipline, or other relevant actions or as an employer by failing to discharge or remove an employee as a result of documentation supporting inappropriate behavior. Negligent retention would focus on the negligence of an employer after an employee is hired, including reassignment or termination (Lewis & Gardner, 2000). The employer is held accountable for taking action once inappropriate employee behavior has occurred. For example, negligent supervision may play a role in negligent retention because a supervisor may overlook occurrences of employee harassment or fail to intervene after evidence of failure to fulfill job responsibilities, or demonstration of inappropriate behavior, or evidence of alcohol and drug abuse. Employers may be charged with negligent retention and face lawsuits when failing to take suitable action. Managers must respond quickly to prevent danger to others once they “know or should have known” (Lewis & Gardner, 2000, p. 19). If the employer does not respond or responds inappropriately, the victim may suffer emotional or physical injury or both, thus managers need to be careful to provide freedom from harassment in the workplace.

Quarterly Review of Business Disciplines – Volume 1, Issue 1, May 2014
Page 30
There are two types of factors to identify in negative retention. These include elements in the workplace or the environment that can influence actions, which then lead to harm, and personal causes, such as employee skills, habits, personalities, and related personal circumstances (Klaassen & Kleiner, 2001). In the environment, interpersonal conflict or conflicts between supervisors and employees may create stress resulting in hostile behavior or hostile attitudes. Adversarial relationships, gender conflicts, and ineffective communication can all contribute to a hostile work environment. As a result, a hostile work environment may lead to injury or harm.
Indvik and Johnson (2012) described the potential legal liabilities possible for employers
if employees are exposed to bullying, even if this occurs unintentionally. Because employees are often afraid to report they have been bullied for fear of losing their jobs, bullies continue to thrive and torment others. Simply identifying or even reprimanding the bully may not be enough. Employers must make an effort to reduce their legal liability because bullying may contribute to a hostile work environment and discrimination beyond the negligent retention issue; it may also lead to emotional injuries, compensation claims and additional sick days, absenteeism or lost time at work, and employee assistant plan costs. At a minimum, bullying behavior may be an indication there is no respect in the workplace. Indvik and Johnson (2012) noted that the employers who claim the bully treats everyone the same way is not an adequate defense.
Aaron, Dry, and Porter (1990) explain the difficult situation an hotelier faces in
operational and legal problems because the right to terminate has been limited in some states. Although “at-will” employment is common in the United States, in recent years courts have restricted the right of the employer to terminate some employees. The employers must have evidence of such improper actions but they are also held responsible to use proper investigation methods or face civil liability; sometimes investigations may infringe, for example, on the right to privacy. In one case, the credibility of a hiring reference came into question as to whether or not that reference was knowledgeable or qualified to respond. However, the Court of Appeals in New Mexico required the party initiating the lawsuit to demonstrate that: (a) the employee was not fit based on the nature of the employment and the potential risk with associations, (b) the employer knew or is responsible to have known said employee was unfit, (c) the connection exists between the plaintiff and the employer’s business, and (d) the cause of the injury was due to negligent hiring or retention (Aaron et al., 1990). Good cause for termination was required in the same case because the terminated employee was led to believe, at hiring, that terminating permanent employees required good cause and this employee had been assured of long-term employment. Additionally, manuals on policies and insurance were inconsistent with at-will employment, thus the employer had to demonstrate good cause to terminate.
Liability for the employer generally occurs when the employee is in contact with the
public as a consequence of carrying out job responsibilities (Usry & Mosier, 1991). Once employers become aware of employee behavior issues, they must act rapidly to prevent or mitigate consequences for retaining such an employee because issues have now been identified. Small businesses, although they think they are giving an employee a ‘second chance’ (Usry & Mosier, 1991), must consider rationally and weigh between possible liability versus extending sympathy or rehabilitation when considering whether or not to continue employment for that

Quarterly Review of Business Disciplines – Volume 1, Issue 1, May 2014
Page 31
individual. Employee training should be ensured by the employer, including refresher courses. Liability can also develop as a result of failure to follow accepted or expected processes and practices within the profession or trade in question. Beyond this, effective and reasonable management practices, such as monitoring and evaluating employees on a regular basis and providing effective feedback to improve performance, are positive steps toward reducing liability.
THEORETICAL APPROACHES
Multiple theoretical perspectives may apply with negligent retention in addition to the legal theory of resplendent superior. Organizational justice is one possible approach to theory, as suggested by Self, Bandow and Heisler (2009) when discussing downsizing survivors where retained employees were expected to pick up extra work from the employees who were laid off. Employees who receive the extra work, yet receive no other consideration for the additional work requirements, may find little justice even though they were not laid off. Forret and Love (2008) use organizational justice to analyze the impact on worker relationships; organizational justice perceptions, as well as, perceived fairness in treatment by supervisors were related to coworker trust and morale. This suggests that employees are aware of and sensitive to differences, whether perceived or actual, in treatment by the organization, by the supervisors, and among themselves.
Understanding the perceptions of unfairness can be addressed through Adam’s equity
theory (Aidla, 2013). High-performing employees are aware and sensitive to whether or not everyone is carrying his or her own weight or meeting performance expectations and are especially aware of how management responds to perceived inequities based on performance expectations (Self et al., 2009). Applebaum, Lavigne-Schmidt, Peytchev, and Shapiro (1999) add that increases in absenteeism and turnover accompany decreases in morale and have important and negative financial impact while stress-related disorders increased.
Another potential approach might be the psychological contract: Employees are hired to
do a specific job and any nonproductive and inappropriate behavior for the employees may not fit the psychological contract in place at the time of hiring (i.e., Atkinson, 2006; Pardon & Kleiner, 2000). Atkinson (2006) explains that trust is the basic element for obligations and transactions, and if there is a violation of the psychological contact, this would indicate a broken obligation or perhaps the lack of the expected transaction. Robinson (1996) extended this concept of strong relationships and applied it to the breach of the psychological contract because trust influences employee perceptions and interpretations of the perceived contract or breach of a contract while limiting trust placed in management. Pate, Martin and Stains (2006) provide areas that may bring about perceptions of the psychological contract breach, such as a perception of unfair treatment held against either the supervisor or the organization or both or an unfair application of procedures, distribution of rewards, or other negative outcome. Pate et al (2000) point to lower levels of organizational commitment and job satisfaction as a result of the perception that their psychological contracts have been breached. Employees may feel less in control and see this breach of contract as a clear betrayal. Unfortunately, Robinson and Rousseau
Quarterly Review of Business Disciplines – Volume 1, Issue 1, May 2014
Page 32
(1994) explain how the violation of psychological contracts is not the exception because it occurs on a regular basis.
Expectancy theory (Vroom, 1964) frequently plays a role for both the employee and the
employer. The employer generally expects the employees to do the job for which they were hired; intentional or unintentional actions as a result of negligent retention may prevent this. For the employee, the expectation may be an environment in which he or she can successfully complete goals and objectives related to the job; an environment that includes nonperforming employees may not allow the employee to be successful in meeting goals that have been established. Negligent retention may endanger the same employee and prevent the organization from functioning effectively: may actually prevent some activities; and create an atmosphere where employees are afraid to come to work; afraid to perform their jobs; and afraid to discuss the issues for fear of being bullied, harassed, or victimized.
RECOMMENDATIONS
Proactive Management
Self and Self (2014) recommend a proactive approach to performance management through the recognition of the incapable, incompetent, unqualified, and unsuitable employees and discuss how a proactive approach may reduce emotional and financial harm in the organization. Although performance policies and procedures existed in their organizations, impacts of such policies and procedures were often not realized due to ineffective implementation. Supervisors simply failed to carry out their responsibilities and duties as managers, they failed to implement appropriate and suitable actions based on accurate performance assessments, and often did not like to deliver bad news.
Due diligence is necessary when seeking high performance in an organization which
includes managing strategic goals, as well as, human resource policies and practices which are in alignment (Aggarwal & Bhargava, 2009). Due diligence must also include training managers and supervisors as coaches to improve employee performance. This includes the necessity to maintain current and consistent documentation of any and all performance issues, as well as, employee evaluations and related training, counseling, and related efforts to improve or enhance employee performance. One of the ongoing issues in this area is the lack of training for managers relative to giving evaluations, giving feedback, and coaching. Stevens (2008) proposes talent audits as a way to manage talent and apply Total Quality Management (TQM) principles. One of the goals would be reducing unwanted turnover especially the loss of top talent. These two areas comprise threats to organizational performance. TQM is about creating a culture of quality (Stevens, 2008). The key focus is on performance and supporting people who deliver.
Policies, Procedures, Processes
Lewis and Gardner (2000) made a number of suggestions to prevent or reduce employer liability for negligent retention. Some of these include establishing standards of behavior, evaluating risk created by inappropriate behavior, investigating occurrences of inappropriate

Quarterly Review of Business Disciplines – Volume 1, Issue 1, May 2014
Page 33
behavior, and then taking measures that reduce or eliminate the risk. Such measures would need to be effective, and effective measures mean businesses must have a way to quantify the effectiveness. This may emphasize the need for clear policies, processes, and measures. For example, Philbrick et al (2003) recommend zero tolerance policies on specific behaviors in general as do Lewis and Gardner (2000), which would prohibit specifically identified behaviors and include sanctions at various levels including termination. The key is to remember that such policies require clear communication, applicable situations and clear definitions; employers need to consider methods to prevent inappropriate behaviors from developing into potentially dangerous acts. This may require confidential and easy-to-use reporting mechanisms for all stakeholders including any employees, vendors, clients/customers, and others who may visit the workplace. Information received cannot be unsubstantiated or created from vague or in accurate information; if people are concerned for personal safety in terms of possible retaliation or even peer pressure, the likelihood of receiving formal complaints may be diminished. Managers should promptly investigate all reports on any inappropriate behavior to determine if an employee causes or may cause unnecessary risk to others. This requires a proactive approach to all aspects of employee training, supervision, and evaluation (Lewis & Gardner, 2000; Philbrick et al, 2003) as well as updated policies and a procedure for dealing with angry customers as well as employees.
Managing the Evaluation Process
Managers are the real problem behind difficult employees (Atkinson, 1992; Kerr, 1975; Von Bergen et al., 2012). Atkinson (1992) found that managers completed less than 50% of appraisals on time; many were late and overdue for more than six months, and some supervisors had not been evaluated in years. In some cases appraisals were duplicated from the previous year and many frequently focused on technical issues and not on the management issues that needed to be addressed. Goodhew et al. (2008), in studying both management and the performance management process in a service organization, found significant inconsistencies in management practices in one organization. In developing a more effective approach, a script for managers to follow was developed to help managers learn not only how to be consistent among themselves, but how to deal with specific issues, initiate methods to deal with poor performance, and generally raise expectations for employees in performance reviews. To do this effectively, management needed to address people issues on a regular basis and make this part of the management culture. Not only would younger managers learn from the more experienced managers who developed the script, this would assume development of tacit knowledge and the application of experiential learning (Goodhew et al., 2008). Goodhew et al. (2008) discovered a lack of clarity was evident after poor performance had been identified. Managers needed a clear picture of what represented effective performance; this was seen as a key challenge in improving performance. The script developed as a result of the case study provided procedural steps, which made the evaluation process more consistent and effective and allowed managers to assume more accountability and responsibility for employee performance measures. Further, the developmental opportunities necessary to support managers in improving evaluation techniques must be provided by the organization to ensure consistency in the application of the process, as well as, the outcomes.
Quarterly Review of Business Disciplines – Volume 1, Issue 1, May 2014
Page 34
This suggests not only the need to train and calibrate managers on a regular basis within the organization when evaluating effective performance; it also speaks to the need to develop managers to recognize effective performance and have a consistent approach with all employees. Procedural steps, a flowchart, or a script to follow may enhance not only the effectiveness of the evaluation process, but the employee performance, as well as, the managerial performance. Atkinson (1992) sees this as a culture change focused on changing how managers think and behave; Stevens (2008) concurs. Atkinson (1992) also suggests the need to develop an effective measure for the appraisal system without which improvement would be hard to validate.
CONCLUSIONS
Goodhew et al. (2008) identify the two key themes that appear in the management literature relative to poor performance, and those are the reluctance of frontline managers to deal with poor employee performance and then the lack of consistency when they do. Managers may also be reluctant to act, but the constant pressures to compete in the marketplace bring pressure to bear on organizations to raise the standards and improve performance if they are to be competitive. Without accountability and responsibility for employee performance at the management level, legal cases involving performance are expected to increase even more as they have already done in the past several years.
Pardon and Kleiner (2000) note the high cost in terms of financial concerns, and
Philbrick et al (2003) and Hoobler and Swanbert (2006) discuss the potential emotional and psychological damage which may emerge if organizations proceed ‘as is’ with management., without appropriate preparations and actions. At a minimum, other costs may include considering the costs of losing qualified employees who are fed up with non-performers; keeping poor performers while passing up new recruits; covering expenses such as perks, bonuses, and travel for poor performers; and paying for delays and poor decisions for the organization, all point to the need for better management immediately. At the worst, organizations may experience violence – including various degrees of violence and trauma, and even homicide. Organizations must be more proactive in training managers to confront poor performance early and deal with it effectively; at the early stages training and development may be the best solutions. At the later stages, the option might be litigation.
REFERENCES
Aaron, T., Dry, E., & Porter, J. L. (1990). The grey box in employee relations. Cornell Hotel and
Restaurant Administration Quarterly, 31(1), 112-117. Aidla, A. (2013). Perceptions of negative inequity at work and the behavior of individuals. GTSF
International Journal on Business Review (GBR), 2(3), 234-239. doi: 10.5176/2010-4804_2.3.242
Applebaum, S. H., Lavigne-Schmidt, S., Peytchev, M., & Shapiro, B. (1999). Downsizing:
Measuring the costs of failure. The Journal of Management Development, 18(5), 436-463.
Quarterly Review of Business Disciplines – Volume 1, Issue 1, May 2014
Page 35
Aggarwal, U., & Bhargava, S. (2009). Reviewing the relationship between human resource practices and psychological contract and their impact on employee attitude and behaviours: A conceptual model European Journal of Training and Development, 33(1), 4-31. doi:10.1108/03090590910924351
Atkinson, C. (2006). Trust and the psychological contract. Employee Relations, 2(3), 227-246. Atkinson, P. (1992). Managing performance. Managing Service Quality, 2(3), 167-.169. Eberlin, R. J., & Tatum, B. C. (2008). Making just decisions: Organizational justice, decision
making, and leadership. Management Decision, 46(2), 310-329. Forret, M., & Love, M. S. (2008). Employee justice perceptions and coworker relationships.
Leadership & Organization Development Journal, 29(3), 248-260.doi:10.1108/01437730810861308
Goodhew, G. W., Cammock, P. A., & Hamilton, R. T. (2008). The management of poor
performance by front-line managers. The Journal of Management Development, 27(9), 951-962. doi:10.1108/02621710810901291
Hoobler, J. M., & Swanberg, J. (2006). The enemy is not us: Unexpected workplace violence
trends. Public Personnel Management, 35(3), 229-246. Indvik, J., & Johnson, P. R. (2012). Lawsuits walk-in on 2 feet: The bully in the workplace.
Journal of Organizational Culture, Communication and Conflict, 16(2), 63-67. Kerr, S. (1975). On the folly of rewarding A, while hoping for B. Academy of Management
Executive, 18, 769-783. Klaassen, M., & Kleiner, B. H. (2001). New developments concerning negligent retention.
Managerial Law, 43(1), 62-68. Lewis, K., & Gardner, S. (2000). Looking for Dr. Jekyll but hiring Mr. Hyde: Preventing
negligent hiring, supervision, retention, and training. Hospital Topics, 78(1), 14-22. Nowak, J. S. (1999). Employer liability for employee online criminal acts. Federal
Communications Law Journal, 51(2), 467-491. Pardon, M., & Kleiner, B. H. (2000). New developments concerning negligent retention.
Management Research News, 23(7), 39-43.Pate, J. (2006). The changing contours of the psychological contract unpacking context and circumstances of breach. Journal of
European Industrial Training, 30(1), 32-47.
Quarterly Review of Business Disciplines – Volume 1, Issue 1, May 2014
Page 36
Pate, J., Martin, G., & Staines, H. (2000). Exploring the relationship between psychological contracts and organizational change: a process model and case study evidence. Strategic
Change, 9(8), 481-493. Philbrick, J. H., Sparks, M. R., Hass, M. E., & Arsenault, S. (2003). Workplace violence: The
legal costs can kill you. American Business Review, 21(1), 84-90. Robinson, S. L. (1996). Trust and a breach of the psychological contract. Administrative Science
Quarterly, 41(4), 574-599. Robinson, S. L., & Rousseau, D. M. (1994). Violating the psychological contract: not the
exception but the norm. Journal of Organizational Behavior, 15(3), 245-259. Self, D. R., & Self, T. B. (2014). Negligent retention of counterproductive employees.
International Journal of Management and Law, 56(3), in press. Self, D., Bandow, D., & Heisler, W. (2009). He is heavy and he ain’t my brother (he's my
low-performing coworker): Organizational justice in the downsized workplace. In R. Fandrich and J. Keenan (Eds.), Association of Employment Practices and Policies
(AEPP) Conference Proceedings, (pp. 156-168). Stevens, H. P. (2008). Total Quality Management now applies to managing talent. The Journal
of Quality and Participation, 31(2), 15-18, 39-40. Usry, M. L., & Mosier, G. C. (1991). Negligent hiring: Headaches for the small businessperson.
Journal of Small Business Management, 29(1), 72. Von Bergen, C. W., Bandow, D., & Eppler, D. (2012). Reflective management past and future.
In M. A. Goralski and H. P. LeBlanc (Eds.), International Academy of Business
Disciplines Yearbook, 19(2), 472-480. Vroom, V. (1964). Work motivation. New York: Wiley.

Quarterly Review of Business Disciplines – Volume 1, Issue 1, May 2014
Page 37
MILLENNIAL JOB PLACEMENT IN THE HOSPITALITY INDUSTRY:
WHAT YOUR STUDENTS DON’T KNOW MAY HURT YOU
Miranda Kitterlin, Florida International University [email protected]
Mohan Song, Florida International University
Nathan E. Dodge, Florida International University [email protected]
ABSTRACT
Student job placement upon graduation is a persistent factor in the assessment of both
academic programs and individual student success. This study seeks to explore what strategies and actions can be taken to make hospitality students more competitive in the job search process. By identifying these strategies, attempts can be made to execute them in academic programs, resulting in an increase in student job placement success upon graduation. In-depth interviews with lodging industry recruiters yielded five emergent themes: (a) impression management; (b) interpersonal skills; (c) work experience value; (d) academic isolation; and (e) student accountability. Practical implications and remedies are explored for academics, industry, and the individual student. Further, the strategies offered may be applied to or modified for any student and/or job applicant in any job search situation. Possible benefits exist for academic programs, the individual student, the hospitality industry, and society as a whole.
Keywords: Job placement, industry recruiters, hospitality student, Millennial
INTRODUCTION
While the “Millennial” may be defined differently depending on the source, this term refers generally to individuals born in the 1980s or 1990s (Keith & Simmers, 2013) who have been shaped by a mixture of unique events and phenomena in society unlike those of previous generations (Kitterlin, 2013). This group is characterized as being tech savvy, self-confident (at times narcissistic) multi-taskers who enter the job market with significantly different work attitudes and expectations (Kitterlin, 2013). These generational differences may pose a challenge for both the job applicant and the potential employer, as they may result in communication gaps and misunderstandings during the interview process. One of the continuous elements in academic program assessments is the job placement of graduating students. Some accreditation bodies include job placement in order to evaluate success with respect to student achievement consistent within the institutes’ mission (Southern
Quarterly Review of Business Disciplines – Volume 1, Issue 1, May 2014
Page 38
Association of Colleges and Schools Commission on Colleges, 2012). Academics and industry professionals alike agree on the need for Hospitality and Tourism Management educators to command a thorough understanding of contemporary issues in the industry, so as to equip students with the skills, knowledge, and competencies essential to career success (Goodman & Sprague, 1991; Mayo & Thomas-Haysbert, 2005; Millar, Mao, & Moreo, 2010). With the unemployment rate of hospitality management students estimated at six percent (Carnevale, Cheah, & Strohl, 2013; United States Department of Labor Bureau of Labor Statistics, 2013), job placement and strategies to increase job placement success would certainly fall into this realm of contemporary issues.
Purpose of the Study
Many studies to determine gaps between what industry expects of college graduates and what academic institutions are teaching have been performed (Downey & DeVeau, 1988; Kwok, Adams, & Margaret, 2011; Paraskevas, 2000; Walo, 2000). Few academic studies, however, have sought to understand what can be done to help Millennial students market and display their qualities, thus making themselves more attractive to hospitality industry recruiters. The unique characteristics of Millennial job seekers, combined with the unemployment rate of hospitality management students, indicates a need to examine what factors are critical to the enhancement of job placement for this subgroup of the overall population. Thus, the purpose of this study is to identify strategies that will enable hospitality students to be more competitive in the job search process. By identifying these strategies, attempts can be made to execute them in academic programs, with the end result being a possible increase in graduate job placement success. Possible benefits exist for academic programs, the individual hospitality student, the hospitality industry, and society as a whole. Further, these strategies may be used as is or reasonably modified so as to assist any graduating student seeking job placement in any industry. Background
Hospitality Industry Recruitment. Recruitment is becoming increasingly multifarious and sophisticated (Ziegler, 2012), and industry is looking for graduates who have relevant internship or related work experience before interview (Zuber, 1997), and possess exceptional industry skills upon graduation (Chi & Gursoy, 2009). Moreover, recruiters expect students to be work-ready, they demand a range of qualities and capabilities of hospitality graduates (Spowart, 2011). Particularly, recruiters are demanding that student applicants to be able to take initiative, think for themselves, explore by asking questions, and have a willingness to learn (Yorke & Harvey, 2005).
University Job Placement Strategies. Hospitality and Tourism Management programs
steadily compete to improve job placement rates for their graduates (Mintzer, 2011). In order to assist students in their job-searching efforts, some of the programs or schools choose to build their own career service centers (Chi & Gursoy, 2009). Others rely on career fairs and recruiter campus visits, or alumni’s contribution (Spowart, 2011). For many Hospitality and Tourism Management programs, one of the best ways for students to enter the workforce is through the participation of an internship opportunity (Chuang, 2011); this also optimizes employment
Quarterly Review of Business Disciplines – Volume 1, Issue 1, May 2014
Page 39
opportunities through establishing long-term relationships (win-win) between the industry and the program (Walo, 2001). Similarly, management in training (MIT) programs offer additional choices for student job placement. This option is becoming increasingly important as Hospitality and Tourism Management programs attempt to reduce education and training costs and enhance profit while maintaining service quality (Huang & Lin, 2011).
Research Questions There are a number of hospitality industry-related web sites to assist candidates do the mock interviews by offering advice on resume writing, interviewing skills, and general appropriate behavior during meetings with prospective employers (Harris, Kwansa, & Lattuca, 2006). There is also a great deal of research highlighting gaps that exist between industry and academics, and what the hospitality and tourism industry is seeking in a quality graduate (Downey & DeVeau, 1988; Kwok, Adams, & Margaret, 2011; Paraskevas, 2000; Walo, 2000). However, little academic research has been conducted on how to help these graduates market and display their quality so as to be more attractive and competitive in the job market. Based on a review of the relevant literature, and the purpose of the study, the following research questions were formed:
1. What are hospitality industry recruiters looking for when interviewing hospitality graduates?
2. What do recruiters believe could be done to improve hospitality student job placement?
Methodology
The insufficiency of current information available on job placement strategies of hospitality students combined with the adoption of ineffective strategies to date indicated that a qualitative approach was appropriate for this study. Specifically, an inductive thematic analysis was employed to identify the experiences of industry recruiters with hospitality student job applicants using a data-driven and systematic process (Braun & Clarke, 2006). Contact information was obtained from a Hospitality and Tourism Management school career services center in South Florida for fifty potential interviewees who were currently working in recruiting positions in the hospitality industry. Twenty of these responded and agreed to participate in the study; twelve males and eight females, all from the lodging industry. Interviews lasted approximately thirty-sixty minutes, and were recorded after obtaining participants’ written consent. Interviews were performed in an open-ended and unstructured format. This allowed for the collection of foundational information, and prevented restriction of participants’ responses. Guiding questions were used, but interviews were performed in a conversational manner. Each participant was asked the following questions, related to the research questions: (a) What are hospitality industry recruiters looking for when interviewing hospitality graduates? (b) What can be done to improve hospitality student job placement? While these served as guiding questions, participants were also asked clarifying questions during the interview to expand upon their answers.
Quarterly Review of Business Disciplines – Volume 1, Issue 1, May 2014
Page 40
Each participant interview was read and inductively coded separately by three researchers. Code agreements, discrepancies, and differences were compared and discussed by the researchers. Similar codes were then grouped together into categories, which were compared in a cycling process for differences and similarities, the goal being continuous analysis and synthesis of categories into themes. This analysis process has been used previously across disciplines with interview data (Liu & Tsaur, 2014; Mattson, Torbiörn, & Hellgren, 2014; Papastavrou, Andreou, & Vryonides, 2014). Interpretive rigor was maintained during analysis through the use of within-design consistency, conceptual consistency, and consistency of inferences with each other within a study (Tashakkori & Teddlie, 2002). Validity was strengthened by establishing a clear research framework, and by pattern matching through the use of research questions that were developed from the underpinning literature and defining constructs of the study. Reliability was strengthened in three ways: protocol was developed prior to entry in the field, which ensured that the questionnaire items and interview questions/measures were consistently presented to all participants, inter-rater reliability and a rigorous coding procedure were established through the comparison of initial coding results from the first interview, as each interviewer coded the initial findings separately and compared responses for agreement, and multiple researchers evaluated the questionnaire responses and interview transcripts to further ensure inter-evaluator reliability, agreement, and consistency (Crawford, 2013). Data analysis resulted in the identification of five themes: (a) impression management; (b) interpersonal skills; (c) work experience value; (d) academic isolation; and (e) student accountability. Each will be discussed, with sample representative statements, in the following section. Findings
Impression Management. Many of the participant responses to this first question addressed behavior that one may initially perceive to be ‘common sense.’ For example, many participants noted that the first impression is a key factor when assessing hospitality students during a job interview. Specifically, recruiters look for professional appearance and dress, a polished one-page resume, confident and outgoing personalities, and prompt arrival to the interview session. Many participants indicated that these qualities were more important than most other qualifiers, including academic accomplishments and work experience. Supporting statements included:
The quality I am looking for is you…the way you are, the way you dress. You should be
very prepared. (Participant 6)
It’s about how professional they are. They don’t need to have experience for a lot of
positions because we are willing to train them. (Participant 19)
The aforementioned aspects largely relate to an applicant’s impression management tactics (Giacalone & Rosenfeld, 2013). The findings in this study agree with the long history of
Quarterly Review of Business Disciplines – Volume 1, Issue 1, May 2014
Page 41
practice and milieu of literature supporting applicants’ use of impression management tactics during interviews to give positive impressions to interviewers, resulting in recruiter hiring decisions (Chen & Lin, 2013; Kilduff & Day, 1994; Stevens & Kristof, 1995). Further, the development of impression management skills early on is a valuable trait that may benefit any individual who wishes to succeed in a customer service and people-oriented industry such as hospitality and tourism, as previous studies have found the use of impression management tactics to be positively related to hospitality job performance ratings (Su, Yang, Badaoui, & Cho, 2012).
Interpersonal Skills. Interestingly, every participant cited interpersonal skills, such as communication, as being of utmost importance. Interpersonal skills are those skills necessary for effective interaction with others, such as communication, oral presentation, telephone, conflict management, and negotiation (Sandwith, 1993; Sisson & Adams, 2013). Supporting statements include:
If you are in the frontline, definitely, communication skills will be a plus, you must know
how to express yourself. Writing skills as well. (Participant 2)
It’s all about your personality and how we get along. (Participant 5)
Attitude makes it different. Obvious teamwork, energy… (Participant 18)
Previous studies have also highlighted a need for the upcoming Millennial generation of workers to improve upon their interpersonal skills, especially in regards to communication, suggesting that communication style skills (i.e. style-typing and style-flexing skills), are the foundation for subsequent interpersonal skill development (Hartman & McCambridge, 2013). Studies of hospitality management graduates and professionals specifically have emphasized a need for strong interpersonal skills not just for obtaining a job, but for maintaining employment and excelling in the industry (Brownell, 1994; Lin, 2002; Sisson & Adams, 2013; Spowart, 2011; Tesone & Ricci, 2005). The findings of this study, similar to the aforementioned studies, indicate that greater value was placed in the hospitality industry on interpersonal skills than technical skills or the applicant’s educational background and achievements. This generational deficiency may speak to a need for greater training in the interpersonal skills area within the academic environment before students enter the job market (Hartman & McCambridge, 2013; Kitterlin, 2013).
Work Experience Value. Every participant interviewed indicated that while GPA and
education are important, they are not as important as work experience, thus work experience and work-related accomplishments should be emphasized over scholastic achievements:
Highlight your strength in your resume and recruiters can see it easier. GPA is not
important; I don’t look at it. (Participant 7)
Don’t put education on the top. Always put experience on the top. Skills are plus, but not
that necessary, but computer system skills is very necessary to have. (Participant 12)
Quarterly Review of Business Disciplines – Volume 1, Issue 1, May 2014
Page 42
This emphasis on the value of work experience for hospitality job seekers is not a novel concept; this finding concurs with that of similar research studies conducted with hospitality industry recruiters over the past decades that found GPA to rank at the bottom of a recruiter’s priorities, and should strengthen the message that students should not “rest upon their academic laurels during the interview process” (Jones, Izzolo, & Christianson, 1993, p. 77).
Academic Isolation. When asked the follow-up question, “What can be done to improve
hospitality student job placement,” two major themes emerged. First, participants felt that academia can become somewhat isolated; meaning, there is a disconnect between what is being taught in the classroom and what is actually valued in industry. In addition to gaining parity between academic and industry values, participants felt that even more can be done on the part of the university/college to increase hospitality students’ chances of job placement upon graduation. First, there was a consensus that students are graduating without having developed the professionalism expected of a job candidate. Suggestions for academics to help bridge this gap included increased opportunities to practice and develop professional behavior and interviewing skills:
Schools need to have more mock interviews. Also, make sure the school helps students to
do one-on-one practice. (Participant 3)
Another area generally agreed upon was the need for more opportunity to interact with and recruit students: [Programs] need a lot more job fairs. We don’t just hire twice a year. (Participant 1) Other recruitment and interaction opportunities cited by participants included classroom visits, improved career services interaction and support, and invited speaking engagements.
Student Accountability. While participants felt that more could be done on the part of the university, the general consensus was that job placement success lies more in the hands of the student. Again, while themes of professionalism emerged, universities can only offer so many opportunities for their students to refine themselves and to help the students learn the soft skills industry is looking for. It is imperative that students understand and identify the fact that they may be deficient in these soft skills and work to improve them by joining groups or visiting speech and writing labs. Supporting statements are as follows:
When you go to an interview, make sure you’re prepared. Don’t waste your time at a job
fair if you don’t prepare. Make sure you are the right candidate for the right position.
Know what the company is about, know the history of the company, and make sure you
have questions to ask. (Participant 11)
Students must also be realistic in their expectations for employment immediately
following graduation. I just want students to know when you graduate you can’t be a
manager immediately. You need to start from frontline, such as front desk and food
beverage. You should understand the hotel and should know how to sell the hotel.
(Participant 2)
Quarterly Review of Business Disciplines – Volume 1, Issue 1, May 2014
Page 43
Don’t expect to be a director without any experience when you just graduate. Worry first
about horizontal growth, not vertical growth. If I were going to build a house, I’m not
going to be worried about pretty granite counter tops before the foundation is done.
(Participant 14)
Another poignant subtheme that emerged in relation to student responsibility came from the participants’ insistence that students need to be more realistic in their job expectations upon graduation, as recruiters felt that this new generation of job applicants were under the impression that having a degree in Hospitality and Tourism Management would automatically rocket them to top positions within hospitality and tourism organizations without first working in and learning from foundational positions within the industry. The importance of realistic industry expectations for hospitality students has been documented in previous literature, as it will eventually impacts job satisfaction, turnover, and organizational and industry commitment (AlBattat & Som, 2013; Wan, Wong, & Kong, 2014).
Implications and Future Research
Practical implications can be drawn from these findings for both the university and the individual student. First, it is clear that Hospitality and Tourism Management students need to improve their professionalism and soft skills, especially communication skills (both written and verbal). In this regard, participant responses echoed those of recent studies on what qualities are important in a hospitality graduate (Chung-Herrera, Enz, & Laukau, 2003; Huang & Lin, 2011; Kwok, et al., 2011; Lin, 2002; Millar et. al., 2010; Raybould & Wilkins, 2005; Tesone & Ricci, 2006; Tsai, Goh, Huffman, & Wu, 2006). This development of professionalism and soft skills is an area that can be improved upon on the parts of both academia and the individual student. It should be noted that while many universities currently offer opportunities for this development and growth; the ultimate responsibility falls upon the individual student to reach out for help.
Other opportunities that universities can provide to assist with the development of students’ soft skills include classroom addresses or senior seminars in which academics and/or industry professionals educate students on professional behavior, with specific examples and emphasis on importance. Communication style classroom exercises focusing on style-typing and style-flexing abilities may also assist in the development of communication skills, while simultaneously providing a foundation for interpersonal skill development (see Hartman & McCambridge, 2011, for exercise examples). Other suggestions include increasing the opportunity for mock interviews, interviewing workshops, and workshops that offer students a glimpse into their own behaviors so as to increase self-awareness. Programs may also consider the inclusion of courses such as Organizational Behavior or Human Relations as a required part of their curriculum; as such courses address interpersonal skill sets.
Further, course professors may consider mandating that their students join groups such-as
Toastmasters International, or require that a specified number of hours be spent at the universities writing or speech labs. Groups such as Toastmasters International help to build confidence in students and teach them how to think quickly on their feet and talk about a plethora of subjects (Toastmasters International, 2013). Many universities offer writing or speech
Quarterly Review of Business Disciplines – Volume 1, Issue 1, May 2014
Page 44
labs that are staffed with doctoral students who can help polish papers and give tips on how to present more naturally. Of course, all of this will also require the student to comprehend and embrace the importance of these attributes, as well as the self-motivation to invest the time and effort to develop their professionalism and soft skills.
Another major practical implication centers around the proposition that students need to not only obtain hospitality work experience, but they must learn to communicate and emphasize that work experience during the job search process. While education is certainly not without its merit, Hospitality and Tourism Management programs may see a benefit in pushing for more work experience hours, and being flexible with course offerings so as to encourage and accommodate the working student. Instead of emphasizing academic achievements and scholastic accomplishments, students may find greater success in emphasizing their actual industry involvement. Students should also be prepared to articulate their strengths, and what value they can add to the organization. Additionally, academic programs may offer coaching workshops for students on how to communicate and express the skills they have gained during their work experiences to recruiters during the interview process. Of course, while internships are required in many Hospitality and Tourism Management programs, students could be encouraged to seek out additional internship or job shadowing opportunities, so as to develop a portfolio of well-rounded work experiences. Moreover, universities may consider increasing opportunities for industry to interact with and recruit their students. As was mentioned in the interviews, companies do not simply recruit and hire applicants on a biannual basis; thus, opportunities to interact with potential student job candidates should not be limited to once or twice a year. Hospitality and Tourism Management programs and university career services may realize great benefit in the regular offering of invitations to recruiters and industry professionals. These additional meetings and campus visits can help to increase communication between industry recruiters and hospitality faculty which may further help to bridge any existing gaps between education and industry. Correspondingly, faculty should be encouraging students to find a hospitality and tourism industry mentor, facilitate such connections, and assist with the attainment of mentee opportunities. Finally, there seems to be a strong need for students to be more realistic in their expectations for employment in the hospitality and tourism industry upon graduation. Academics can assist in this area by attempting to paint an accurate picture of career paths and job expectations for students in their hospitality courses. Students must be made aware that sometimes in order to attain promotion and desired positions that there is a necessity of relocation and horizontal movements inside and outside of the organization. The solution for this phenomenon may also tie into increased industry interaction; recruiters should express to students what they should expect during the first years of their career path. Ideally, students can be provided with hypothetical one year, three year, five year, and ten year career plans of where they should be in their professional growth following graduation. Of course, this study is not without limitations. The lodging-only representation makes it impossible to generalize findings to all hospitality industry recruiters. The qualitative nature of the study also lends itself to generalization limitations; future research should be conducted with
Quarterly Review of Business Disciplines – Volume 1, Issue 1, May 2014
Page 45
a larger sample, a sample more representative of each facet of the hospitality industry, and one which uses a quantifiable method. Further, future studies should seek to identify the method in which the aforementioned areas of student deficiency are being taught currently in Hospitality and Tourism Management curriculums, so as to identify any gaps or areas for improvement.
Next, it may be beneficial to investigate the Millennial generation’s perception of proper impression management and interpersonal skills. For example, this next generation of the hospitality industry workforce may have very different ideas as to what constitutes “professionalism” and “appropriate communication.” Thus, instead of there being a phenomenon of students failing to display appropriate behaviors during the job search process, perhaps this is indicative of a societal shift in behavior that will be seen across all facets of industry.
Finally, the finding that recruiters felt there was a disconnect between what academia was
teaching and what was actually valued in the industry (‘academic isolation’) may be in actuality due to a lack of knowledge on the part of industry as to what opportunities students are being offered at the university level. Simply put, recruiters seemed to believe that academia does not know what is going on in industry, but perhaps recruiters do not fully understand what is being done in academia. A comparison could be made to identify any gaps in the perception on both ends of the spectrum.
REFERENCES
AlBattat, A. R., & Som, A. P. (2013). Employee dissatisfaction and turnover crises in the Malaysian hospitality industry. International Journal of Business and Management, 8(5), 62-71.
Braun, V., & Clarke, V. (2006). Using thematic analysis in psychology. Qualitative Research in
Psychology, 3, 77-101. Brownell, J. (1994). Women in hospitality management: General managers’ perceptions of
factors related to career development. International Journal of Hospitality Management,
13(2), 101-117. Carnevale, A., Cheah, B., & Strohl, J. (2013). Hard times: College majors, unemployment and
earnings. Washington, DC: Georgetown Public Policy Institute. Chen, C., & Lin, M. (2013). The effect of applicant impression management tactics on hiring
recommendations: Cognitive and affective processes. Applied Psychology: An
International Review. doi: 10.1111/apps.12013 Chi, C., & Gursoy, D. (2009). How to help your graduates secure better jobs? An industry
perspective. International Journal of Contemporary Hospitality Management, 21(3), 308-322.

Quarterly Review of Business Disciplines – Volume 1, Issue 1, May 2014
Page 46
Chuang, N. K. (2011). Job-related barriers and coping behaviors in the career development of hospitality undergraduates. Journal of Human Resources in Hospitality & Tourism,
10(1), 14-31. Chung-Herrera, B., Enz, C., & Laukau, M. (2003). Grooming future hospitality leaders: A
competencies model. Cornell Hotel and Restaurant Administration Quarterly, 44(3), 17-25.
Crawford, A. (2013). Hospitality operators’ understanding of service: A qualitative approach.
International Journal of Contemporary Hospitality Management, 25(1), 65-81. Downey, J., & DeVeau, L. (1988). Hospitality internships: An industry view. The Cornell Hotel
and Restaurant Administration Quarterly, 29(3), 18-20. Giacalone, R., & Rosenfeld, P. (2013). Impression Management in the Organization. Hillsdale,
New Jersey: Lawrence Erlbaum Associates, Inc. Goodman, R., & Sprague, L. (1991). The future of hospitality education: Meeting the industry’s
needs. Cornell Hotel and Restaurant Administration Quarterly, 32(2), 66-70. Harris, K., Kwansa, F., & Lattuca, F. (2006). Recruiter opinion of hospitality programs: An
assessment of selected programs. Journal of Human Resources in Hospitality & Tourism,
5(1), 17-33. Hartman, J., & McCambridge, J. (2011). Optimizing millennials’ communication styles.
Business Communication Quarterly, 76(1), 252-265. Huang, Y., & Lin, C. (2011). Management trainee core competencies in the hospitality industry:
Differences between managers and scholars. Journal of Human Resources in Hospitality
and Tourism, 10(1), 1-13. Jones, T., Izzolo, A., & Christianson, D. (1993). Campus recruitment: A four-year program
profile. Hospitality Review, 11(2), 73-80. Keith, N. K., & Simmers, C. S. (2013). Adapting the marketing educational environment for
multi-cultural Millennials: the Chinese experience. Academy of Educational Leadership
Journal, 17(3), 83-92. Kilduff, M., & Day, D. (1994). Do chameleons get ahead? The effects of self-monitoring on
managerial careers. Academy of Management, 37(4), 1047-1060.
Kitterlin, M. (2013). Dealing with the millennial labor pool. Hotel Business Review:
Hotelexecutive.com.
Quarterly Review of Business Disciplines – Volume 1, Issue 1, May 2014
Page 47
Kwok, L., Adams, C., & Margaret, A. (2011). Factors influencing hospitality recruiters’ hiring decision in college recruiting. Journal of Human Resources in Hospitality & Tourism,
10(4), 372-399. Lin, S. (2002). Exploring the relationships between hotel management courses and industry
required competencies. Journal of Teaching in Travel and Tourism, 2(3/4), 81-101. Liu, J. S., & Tsaur, S. H. (2014). We are in the same boat: Tourist citizenship behaviors. Tourism
Management, 42, 88-100. Mattson, M., Torbiörn, I., & Hellgren, J. (2014). Effects of staff bonus systems on safety
behaviors. Human Resource Management Review, 24(1), 17-30. Mayo, C., & Thomas-Haysbert, C. (2005). Essential competencies needed by hospitality and
tourism management graduates as determined by industry professionals and hospitality educators. The Consortium Journal, 9(2), 5-16.
Millar, M., Mao, Z., & Moreo, P. (2010). Hospitality and tourism educators vs. the industry: A
competency assessment. Journal of Hospitality and Tourism Education, 22(2), 38-50. Mintzer, R. (2011). To start a hospitality student investment club at Schenectady County
Community College. (Master’s Thesis). Retrieved from UNLV Theses/Dissertations/Professional Papers/Capstones. (Paper 1155)
Papastavrou, E., Andreou, P., & Vryonides, S. (2014). The hidden ethical element of nursing
care rationing. Nursing Ethics, 0969733013513210. Paraskevas, A. (2000). Management selection practices in Greece: Are hospitality recruiters any
different? International Journal of Hospitality Management, 19(3), 241-259. Raybould, M., & Wilkins, H. (2005). Over qualified and under experienced: Turning graduates
into hospitality managers. International Journal of Contemporary Hospitality
Management, 17(3), 203-216. Sandwith, P. (1993). A hierarchy of management training requirements: The competency domain
model. Public Personnel Management, 22(1), 43-62. Sisson, L., & Adams, A. (2013). Essential hospitality management competencies: The
importance of soft skills. Journal of Hospitality and Tourism Education, 25(3), 131-145. Southern Association of Colleges and Schools Commission on Colleges. (2012). The principles
of accreditation: foundations for quality enhancement. (5th ed.). Decatur, Georgia: Southern Association of Colleges and Schools Commission on Colleges.
Quarterly Review of Business Disciplines – Volume 1, Issue 1, May 2014
Page 48
Spowart, J. (2011). Hospitality students’ competencies: Are they work ready? Journal of Human
Resources in Hospitality & Tourism, 10(2), 169-181. Stevens, C., & Kristof, A. (1995). Making the right impression: A field study of applicant
impression management during job interviews. Journal of Applied Psychology, 80(5), 587-606. doi: 10.1037/0021-9010.80.5.587
Su, C. J., Yang, J. H., Badaoui, K., & Cho, N. (2012). Tour leaders’ impression management and
job performance: Exploring the moderating role of tourists’ self-monitoring. Asia Pacific
Journal of Tourism Research, (ahead-of-print), 1-18. Tashakkori, A., & Teddlie, C. (2002). Handbook of mixed methods in social and behavioral
research. Thousand Oaks, CA: Sage. Tesone, D., & Ricci, P. (2005). Attributes of entry-level employees: Hospitality and tourism
managers seeking more than knowledge and skills. Journal of Applied Management and
Entrepreneurship, 10(2), 3-12. Tesone, D., & Ricci, P. (2006). Toward a definition of entry-level job competencies: Hospitality
manager perspectives. International Journal of Hospitality and Tourism Administration,
7(4), 71-86. Toastmasters International. (2013). Welcome to toastmasters international. Retrieved from
http://www.toastmasters.org/ Tsai, F., Goh, B., Huffman, L., & Wu, C. (2006). Competency assessment for entry-level lodging
management trainees in Taiwan. Chinese Economy, 39(6), 49-69. United States Department of Labor Bureau of Labor Statistics. (2013). Labor force statistics
from the current population survey. Retrieved from http://data.bls.gov/timeseries/LNS14000000
Walo, M. (2000). The contribution of internship in developing industry-relevant management
competencies in tourism and hospitality graduates’. (Masters’ thesis). Southern Cross University.
Walo, M. (2001). Assessing the contribution of internship in developing Australian tourism and
hospitality students’ management competencies. Asia-Pacific Journal of Cooperative
Education, 2(1), 12-28. Wan, Y. K., Wong, I. A., & Kong, W. H. (2014). Student career prospect and industry
commitment: The roles of industry attitude, perceived social status, and salary expectations. Tourism Management, 40(1), 1-14.

Quarterly Review of Business Disciplines – Volume 1, Issue 1, May 2014
Page 49
Yorke, M., & Harvey, L. (2005). Graduate attributes and their development. New Directions for
Institutional Research, 2005(128), 41–58. Ziegler, S. (2012, April 5). A hiring trend that’s here to stay: Recruitment process outsourcing
should be on your to-do list. Coloradobiz. Retrieved from http://www.cobizmag.com/articles/a-hiring-trend-that’s-here-to-stay
Zuber, A. (1997, September 8). Industry puts emphasis on academic experience. Nation’s
Restaurant News, 31(36), 1.

Quarterly Review of Business Disciplines – Volume 1, Issue 1, May 2014
Page 50
WEBSITE & MOBILE USABILITY
Louis K. Falk, University of Texas at Brownsville
Hy Sockel, DIKW Management Group [email protected]
ABSTRACT
Website Usability is often described as how easy a system is to learn, remember, and use. Making a website easy to use requires more than following a checklist of “best practices.” It is important that the purpose of the site be pre-determined prior to the start of the “design” process. In the past, users were tethered to a desk by power and communication cords in order to do their work. Advances in technology have enabled the development of “mobile computing.” Mobile devices no longer need to be chained to a desk. As a consequence, the constructs underpinning Usability have evolved. More emphasis is placed on the characteristics of hybrid devices such as: weight, size, battery life, reception (bars), number of buttons, and touch screen capability. Traditional themes to include load time, screen size, single hand operation, browser compatibility, color schemes, and contact links also need to be considered. For the most part, if all these elements are taken into account a website has a strong chance of being successful however, there is no guarantee.
Keywords: Usability, Websites, Web Usability, Web Design, Navigation
WHAT IS USABILITY
Strictly speaking, the term Usability has evolved from one of use to also include design and presentation aspects. A large amount of research has been conducted using this wider definition. These studies include everything from model development (Cunliffe, 2000), to the purpose of a website (Neilsen, 1999, 2000; Falk, 2000), and to website effectiveness (Fichter, 2005). Ultimately these topics are related to Usability and the success a website enjoys.
Usability is generally defined by five (5) quality components: Learnability: How easy is it for users to accomplish basic tasks the first time they encounter the design? Efficiency: Once users have learned the design, how quickly can they perform tasks? Memorability: When users return to the design after a period of not using it, how
easily can they reestablish proficiency?
Quarterly Review of Business Disciplines – Volume 1, Issue 1, May 2014
Page 51
Errors: How many errors do users make, how severe are these errors, and how easily can they recover from the errors? Satisfaction: How pleasant is it to use the design? Nielson (2012) expands the Usability construct to include utility, which he designates as
functionality. However, utility in and of itself is not enough, system features need to emphasize subjective satisfaction, low error rate, and high task performance (Calongne, 2001). Cheug and Lee (2005) add that Usability needs to support user satisfaction as well.
Usability is an important component of a variety of products and services from lawn mower instruction to website usage. In this vein, Usability is often measured by whether the product does what it claims to do, if the instructions are clear and if the instructions make sense. When it comes to software products (i.e. Healthcare.gov website) extra constraints are put in place to not only do what it is designed to do but also to be efficient and easy to use. Software products also need to be concerned with Human Machine Interfaces (graphical user interface).
The advent of online retail has forced organizations to consider consumers’ in a new
light. Organizations work hard to ensure a pleasant experience for the user. Shoppers want sites that have value and are easy to use. Slow loading web pages are consistently identified as one of the top annoying attributes of the Internet by online shoppers (eMarketer, 2006; Ewalt, 2002). Weinberg (2000) and Nah (2004) indicate that the perception of download delays is far more important to study than actual delays.
Features that aid the users can help retain visitors’ interests (Sockel, Falk, Warren, & Chen,
2007). Sockel et.al warn organizations to exercise caution and not to rely on the graphical user interface (GUI) as the sole factor in boosting online sales. Since these interfaces can be imitated, and the long-term competitive edge is less salient compared to factors, such as customer confidence in the Web business and relationship services (Kotha, Rajgopal, & Venkatachalam, 2004)
Evolution
Originally, “online systems” were not developed for a “generic user” but for the specialist - someone who had an underlying understanding of the system being developed. They were expensive to build, and labor intensive to design, and implement. Initial development projects were created to replace existing “paper-based” manual systems. In the end these systems provided limited enhancements. The systems were often considered a success under the most dubious factors - frequently it boiled down to “we got some usable result” and “it did NOT outright fail.” Early problems included limited “buy-in” by key sponsors, lack of understanding, fluctuating agreement in end goals, poor project management, turnover of key personnel, cost overruns and other issues. Additionally, the user community and technology development group utilized language and terms that were not well understood by others. This was a devastating process that created ill-will often enough to doom future projects.

Quarterly Review of Business Disciplines – Volume 1, Issue 1, May 2014
Page 52
The confusion was often the direct result of many things going askew. Developers overstating their capabilities, and users over demanding on what they would like, when they would like it, and what they were willing to pay. In the end, many projects failed because both sides did not communicate, were too ambitious, and neither wanted to compromise. Besides the normal typical people and political issues, technology was changing faster than the organizations could assimilate it.
Why It Matters
Errors seem to happen all by themselves, there is no need to compound them by confusing users on what is happening or what to do next. The Three Mile Island (TMI) incident is a prime example. According to the U.S. Nuclear Regulatory Commission (NRC) the most serious accident in U.S. commercial nuclear power plant operating history occurred at TMI, Dauphin County, Pennsylvania, on March 28, 1979. It was confusion over valve status that undermined TMI. Critical human factors and poor user interface engineering led operators to misinterpret the meaning of a “warning light.” The operators thought a critical valve was closed when it was actually open. It turned out the light they were concerned about did not indicate the position of the valve, only the status of the solenoid that controlled the valve. This confusion was a key contributor to the initial failure to recognize the accident as a loss-of-coolant accident, and led operators to turn off the emergency core cooling pumps due to fears the system was being overfilled (Walker, 2004).
While “the small radioactive releases had no detectable health effects on plant workers or
the public. Its aftermath brought about sweeping changes involving emergency response planning, reactor operator training, human factors engineering, radiation protection, and many other areas of nuclear power plant operations” (see NRC Factsheets, 2013).
The TMI incident permanently changed the nuclear industry and the NRC itself. In
addition to requiring upgrades, strengthening of the plant designs and equipment requirements they also addressed “the critical role of human performance in plant safety.” This led to revamping operator training and staffing requirements. “Followed by improved instrumentation and controls for operating the plant, and also an establishment of fitness-for-duty programs for plant workers to guard against alcohol or drug abuse” (see NRC Factsheets, 2013 para. 12). Further, TMI “inspired Charles Perrow’s (1982) Normal Accident Theory which suggests that accidents result from an unanticipated interaction of multiple failures in a complex system.
USABILITY GOALS
Pagani (2009) indicates that at one time, “Usability” was an afterthought and developers were rewarded for application features, and very little else. Nielsen (2000) indicates that Usability was a suppressed and barely tolerated oddity. Website Usability also includes a functionality component - how effective it is at permitting (and denying) access to information. In this expanded definition, website design needs to take into account the users characteristics, experience and context (Badre, 2002; Chen & Sockel, 2001, Rau, Liang, & Max, 2003).
People rely on their experience and use semantic models to make sense out of the

Quarterly Review of Business Disciplines – Volume 1, Issue 1, May 2014
Page 53
environment. What might seem an easy application for a design team member can be awkward and difficult for an end user (Marinilli, 2002). It is important that metrics and goals be set prior to design and production. If the aim is to produce high performance for data review, a sensible measure might refer to the speed in which the web pages load given a particular hardware and software combination (Calongne, 2001). On the other hand, if the aim is for data entry, then low error rate is the point of interest, click stream data and server logs might need to be analyzed to isolate patterns.
Usability Issues
Every web page has an address on the Internet. The more recognizable the address the easier it is for the user to become brand aware and the more often they might return to the site. Typically, the Web is used as a marketing tool that allows millions of potential customers to visit a site each day (Hart, Doherty, & Ellis-Chadwick, 2000). However, before that can happen, a person needs to be able to find the appropriate web page. In that regard, many individuals use and depend upon search engines to locate sites of interest. A serious problem is that a website’s reference may be buried so deep in a search result, that it will likely go unnoticed and not visited. The consequence is not only a Usability issue, it is also a visibility/profitability problem. To circumvent this issue, an organization should consider using meaningful web addresses (uniform resource locators), and descriptive meta tags (tags hidden in the web page design code - DHTML, XML – used to describe content). Additionally, key words should be placed in titles and paragraphs. Backward links (link referrals) should also be used to enhance placement of a website in search results. Domains - TLDs – Branding
The real name of a website is a number assigned by the Internet Corporation for Assigned Names and Numbers (ICANN). The problem is that humans have a hard time remembering large numbers, so to make it more convenient a unique mnemonic symbolic name is associated with this number. The symbolic name is typically composed of three parts: Top level Domain (TLD), the User Domain name, and a service/category/machine name. The group responsible, Internet Assigned Numbers Authority (IANA), for coordination of TLDs has defined over 300 TLDs which includes nearly 200 country codes. Examples from of these codes ICANN include: .com, .org, .gov, .uk, .ca, .jp, and others.
The actual domain name is chosen by the individual entity and is unique within a TLD.
While search engines use web-bots to find the pages on their own, it is better to register the site with the various search engines - so that search criteria can be tailored to the website. Studies show that a majority of website’s traffic is generated through search engines and directories. The website’s domain name becomes more meaningful to the user if it contains cognitive cues.
Design Issues
Nielson (2003) lists the top ten violated web page design guidelines. However, even though this study is somewhat dated, the basic guidelines should still be taken into account.
Quarterly Review of Business Disciplines – Volume 1, Issue 1, May 2014
Page 54
1. Emphasize what your site offers that's of value to users and how your services differ from those of key competitors 2. Use a liquid layout that lets users adjust the homepage size 3. Use color to distinguish visited and unvisited links 4. Use graphics to show real content, not just to decorate your homepage 5. Include a tag line that explicitly summarizes what the site or company does 6. Make it easy to access anything recently featured on your homepage 7. Include a short site description in the window title 8. Don't use a heading to label the search area - instead use a "Search" button to the right of the box 9. With stock quotes, give the percentage of change, not just the points gained or lost 10. Don't include an active link to the homepage on the homepage For the most part it seems that the focus of Usability has gravitated from traditional web
page development to Mobile Computing. The ever growing popularity of computer cell phone hybrids is the reason. There is a difference between mobile or nomadic computing and the use of hybrid devices. Mobile computing is the use of portable devices to access the Internet and data from work or home from anywhere in the world (Rouse, 2007). Hybrid devices are primarily designed to be used for entertainment, communications, shopping, and incidental work utilizing a cellular and / or other wireless networks (Markoff, 2007).
Designing sites toward hybrid computing products such as cell phones and tablets brings
up a host of new Usability issues. A lot of these devices are operated while multi-tasking. If a mobile device is to be truly usable, new elements need to be included. These elements/components have to be designed with the goal of minimizing attention so that other tasks such as driving, can be performed at the same time. As these hybrids try to incorporate the many functions that other devices are specifically designed for - such as, Talking (telephone), Texting, Global Positioning Satellite (GPS), and Internet browsing - Usability transitions from a secondary afterthought, to the major design concern.
Input and Queries
For products to work well in the hybrid environment certain design features need to be incorporated and enhanced. Traditionally a keyboard, mouse or touch pad were utilized to input data or conduct queries. In a truly mobile environment those input devices may not be effective. Within the ever growing evolution of the input and query function voice operation is at the top of the list. While the technology is not completely sound there are working elements that are in place. At this point GPS commands such as “find a location” and/or store are somewhat precise. Conducting voice searches and reading back messages (email or text) are also somewhat accurate. Sending text messages also works fairly well. Problems with this technology include user ascent, accurate data bases, and a user who still has to activate these features by touch. The fact that a user needs to touch a screen in a certain spot can also become an issue because the user has to look at the device. The next generation of Usability has to design systems to overcome these issues. A universal design needs to be created for web pages and apps.

Quarterly Review of Business Disciplines – Volume 1, Issue 1, May 2014
Page 55
Load Time
The overall goal of a web page should be to quickly deliver quality content in a fashion that does not cause the person to become hopelessly irritated. In this regard, time is a very big factor. Time becomes more of an issue when mobile computing on a hybrid device is considered. In the past a general rule of thumb is that a web page should load in less than eight seconds. More recent research suggests that business performance begins to decrease after a response time delay of 5.1 seconds. NetForecast’s APDEX uses 4.0 seconds as the dividing line as to where users become frustrated (Godskind, 2009). Some users include too many images which can cause three problems: cognitive disorientation, slow downloads, and excessive bandwidth use. Graphics should be used sparingly – only when they add clarity and have a point (Nygaard, 2003).
The primary element in making a website usable is its design. Unfortunately, many people
are anxious to skip steps and just go for a “product,” without considering the “basics.” As in the engineering field, the design has to be “defined” up front, along with the goals and objectives of the site. One cannot test quality into a product; it has to be designed in. However, designing interfaces is a complex problem quite different from typical engineering challenges because it deals with users’ behavioral aspects. Inadequate forethought, tight schedules, misconceptions, inappropriate attitudes: such as "Usability is a plus that we cannot afford” (Marinilli, 2002, p. 1), and lack of professionalism are responsible for many of the poor sites.
Screen Size
Like in any other medium the design should be aesthetically pleasing and balanced. To avoid optical confusion, the background needs to be just that, background. The site should use amble white space so that the site does not appear cluttered. A problem that developers face is that they do not know the screen size of the user. This Usability issue includes the fact that each version of each browser may interpret/render web pages slightly different, with some browsers not supporting specific features (Apple and Flash). Over time the size and density of the viewing screen has changed. Initially the standard pixel screen size was 480 x 600, followed by 800 x 600 and then 1024 x 768 to larger. The standard screen sizes allowed web developers to pick smaller sizes and to be confident that most users would be happy. This is no longer true, devices that connect to the network can accept data faster – allowing for higher resolution images. They can process these images faster and crisper with lower energy costs. Additionally, the number of devices set to higher resolutions is on the rise. This is further complicated by the large mix of disparate technologies: distinct browsers, various versions of software, and many machine based applications. Further, there is a variety of devices that are web enabled besides the standard PC including, TV’s, cell phones, watches, and tablets. Each technology is associated with a different set of characteristics that limit its ability to be usable. Most website systems were originally developed for viewing on “standard” monitors. This trend now skews toward mobile devices such as cell phones and tablets. A great deal of developmental effort is needed for the successful transition of traditional websites to smaller screen portable devices (Huang, 2003).
HARDWARE AND SOFTWARE ISSUES
Just as important as the change in the popularity of resolution size is the introduction of
Quarterly Review of Business Disciplines – Volume 1, Issue 1, May 2014
Page 56
new mobile devices. Newer equipment presents extra concerns for the website developers; different screen sizes and modes present information differently. The smaller the screen mode, the larger items appear on the screen, leaving less room (real estate) for information to be displayed. Differing mode sizes change the layout on the screen and can account for line shifts, sentences broken in midline, moved links, and many other irritating manifestations.
Another dilemma that can have an effect on the design is the browser selected by the
consumer. A browser is an application that retrieves, interprets and displays an online (or offline) document in its final web page format. Some the more popular browsers are Internet Explorer, Firefox, and Safari. Various browsers and versions (even within the same vendor) may display items on a website differently. In some cases, certain elements and features such as videos, marquees, and colors can be viewed on some browsers and not on others. Some sites are designed to use the features of a specific browser, therefore the consumer may not be able view the site as the developer intended, especially if they are using an updated or older version of the browser. To ensure that a site works correctly developers need to assess it using multiple browsers and settings.
Disabled Users
A relative recent phenomenon in the realm of communication is the vast number of disabled related users and computer Usability functions that need to be tweaked to accommodate these individuals. The Federal Government has led the way with the Americans with Disabilities Act (ADA). Section 508 of the Rehabilitation Act now requires, among other things, that all websites used by federal employees and members of the public seeking information and services from the federal government be ADA compliant (Gerber, 2002). Entities under the ADA constrains are required to provide effective communication, regardless of whether they generally communicate through print media, audio media, or computerized media such as the Internet. While the ADA requirement does not apply to everyone, is it good practice to incorporate the necessary accommodations for those with disabilities. With the growth of computing technology many special needs groups are using the web to make things easier. Since approximately “57 million people are classified as having a disability” (United States Census, 2012, p. 1), it makes sense for an organization to incorporate ADA adjustments into website design.
Navigation
There are many issues that need to be addressed when creating an easy to use website. The layout of the screen is central to the user’s ability to recognize information. Information must be placed in a logical order and its physical location should be taken into account. Web page content can be longer and wider than the visible portion on a screen, causing the user to turn the device sideways - or scroll down or across to see the rest of the content. Generally speaking, scrolling should be minimized and avoided on navigation pages because hyperlinks below the fold (browser bottom border) are less likely to be seen and chosen (Nielsen, 1999). The screen is typically considered to be divided into nine asymmetrical regions (similar to a tic-tac-toe board) with each region associated with its own prominent use characteristics. Typical “European” style languages read from left to right. Consequently, it is generally considered appropriate to put the more important information on the left side of the screen so that the viewer reads it first before interest withers.
Quarterly Review of Business Disciplines – Volume 1, Issue 1, May 2014
Page 57
The three click rule should also be utilized. The rule indicates that users should be able to obtain data from all content on the website within three clicks from the home page. The content of the information should also be fresh and up to date (Langer, 2000). Hyperlinks need to be accurate and clearly marked. They should be placed at the bottom of long pages. Once accessed these links should change color. Each level in the site should allow the viewer to go back to the previous level and forward to the next. As a viewer gets deeper into the site, a link should be present that allows the user to return to the opening page so that the navigation can begin anew if so desired. Nothing is worse than having a user become frustrated because a means to either exit or restart is not present or apparent.
It is very important, in any discussion of hyperlinks, to note that there should be no dead
links. It is annoying to go to a site and click on a link and have nothing happen, or to come back with a “404 error,” page not found. It is like reading a newspaper or magazine article and the continuation is not there. Some feel that a link that leads to a page that states “under construction” is equally annoying – if a page is not ready, do not post it.
The web page itself needs to cater to the needs of the user. Many developers feel that it is
extremely important that each web page contain contact information or at least link to a page that has the contact information. From a user’s perspective, it is extremely infuriating to want to place an order and run into problems and not be able contact anyone for assistance. Further, the responses generated by the site need to be monitored and responded to in a reasonable amount of time. The old “standard” was for organizations to respond within 48 hours. The new standard being adopted by many organizations is to respond within 24 hours. Failure to respond to contact inquiries can acerbate the situation.
A “site map” can also be helpful in making a site more user friendly. In its simplest form a
site map lists everything that is located on the website and provides navigational links to get to the information. This is important because it lets the viewer know what is and is not on the website (Krug, 2000).
Color
Color schemes play an important role in Usability, they help tie pages together and help with navigation. Color impacts the website in many ways, it can add to the value by helping to organize the site, or detract by making it harder to read the web pages. To help eliminate confusion, page colors and design should be consistent throughout the site. Radically changing a site’s “look and feel” may cause the user to question whether they continue to be on the same site. Within a web page, color can be used as an effective tool to help categorize products. In the past Amazon was a great example. The design was the same but by changing the color code of the web page depending on the product the viewer knew what category they are shopping in.
A website that would otherwise be “perfect” can be totally unusable if the colors are
inappropriately chosen. Color contrast is also important. Some sites are not readable (usable) because the background color or the design is as dark as the font color. Contrasting colors need to be used so that the viewer can read the information on the site. Dark fonts with any light background works well. Another issue is the effect of color on viewers with visual disabilities.
Quarterly Review of Business Disciplines – Volume 1, Issue 1, May 2014
Page 58
Some of the more progressive site developers give users the ability to select a color theme (foreground and background) that is easier to view. This is important because not all colors are displayed the same across different browsers or machines. There are a few simple color rules that can aid in the construction of a successful site (Cannon, 2012).
Developers should be aware that The World Wide Web Consortium (W3C) has identified
216 browser safe colors. Developers should stay away from red and green backgrounds, ensure high contrast between background and foreground colors, and avoid busy background patterns that interfere with reading. To avoid confusion, the default hyperlink colors (such as blue for unvisited links and red for links already visited) should not be altered. Standard hyperlink colors should be avoided for text.
USABILITY MODELS
Many developers prescribe to the idea that the first step in making a site usable is to think about Usability and the information architecture of the site before it is actually developed. Because the success of a site is based on the metaphor of how a site will be used, by whom, and in what environment - it is essential to define the purpose of the website and the expected audience (Rosen, Purinton, & Lloyd, 2004). This is an important issue because it determines the type of information, the breadth, as well as depth. Three basic website models (Falk, 2000) are: the Presence Model (often referred to as the “me too model,” Informational Model, and the E-Commerce Model).
Presence Model
These websites are designed to establish a presence on the web but not really to accomplish anything more than “I am on the web too.” They do not usually contain a lot of information, but they often point to other sites that may and are used by individuals to share pictures and such with their friends. Organizations have used this model in the past as a promotional tool to show that their organization is progressive. This type of site is used mostly by smaller organizations that either do not have the expertise to design a more in-depth site or the manpower to maintain it.
Informational Model
The web pages in this model are usually heavy with information. These web pages are set up so the user can get to specific information. A lot of software or computer companies use this model to provide access to Frequently Asked Questions (FAQ), so that they can limit the amount of traditional support that they might otherwise have to provide. Organizations that use this model, often refer telephone callers to their website, and consequently miss the opportunity for one-to-one sales.
E-Commerce Model
This model typically employs dynamic web pages and is designed to: create, support, and establish sales. There usually is enough information on these sites so that the viewer feels sufficiently comfortable to make a purchase. These sites are run by companies with the expertise to quickly update and maintain online inventories.
Quarterly Review of Business Disciplines – Volume 1, Issue 1, May 2014
Page 59
FUTURE
The future of website Usability is changing, not just because of our understandings of how people actually use websites, but also because organizations and consumers are demanding more from the web presence. New Internet accessible devices are being introduced, so the earlier semantic metaphor of a “desktop” is no longer viable. Many users of a network do not use desks. Numerous inventory control agents remotely report sales activity and volume. Delivery personnel use Internet accessible clipboards to report distribution and location. Among the cutting edge Internet devices are a new breed of portable equipment that enhance the issues associated with mobile commerce. Presentation platforms have grown to include Smartphone’s, Televisions, Wrist Watches, and portable marquees. Software tool vendors are continuously introducing new features and techniques. Entertainment is also a factor in Usability. It is not uncommon to see personal Laptop Computers, Smartphones, iPods, and Tablets using WIFI and cell networks in almost every location. These mobile devices are a tremendous force for expanding the previous technology as well as advancing it.
CONCLUSION
Website Usability is defined as how effective the website is at permitting access to the site’s information. The evolving nature of this field is what makes it difficult to master. What once was considered standard, has been shaken up by the application of emerging technologies. As these new technologies emerge or develop, the rules change. Designing an interface that takes advantage of multiple mobile formats and other new parameters can be challenging to say the least. It is not just the new technologies that make designing interfaces difficult but also the re-imagining and addition of common tasks across various equipment that adds to the complexity i.e: GPS availability on mobile devices. Each and every one of these apparatuses has their own parameters.
Certain generic steps need to be followed to ensure all of these gadgets have an easy and
effective interface. The first and probably the most important thing is the purpose. It should be determined before starting the design process. After the purpose is decided the following elements should be considered in the website’s blueprint so that it is easier to use: load time, aesthetically balanced, screen size, browser compatibility, contact information on each page, color schemes, and, clearly marked hyperlinks. The definition of the project is crucial to the effectiveness of the interface. Further, regardless of the amount of work that went into the process, all the operations must always be checked to make sure that everything works properly.
REFERENCES
Badre, A. (2002). Shaping web usability: Interaction design in context. Indianapolis: Addison-Wesley Professional.
Calongne, C. M. (2001). Designing for website usability. Journal of Computing Sciences in
Colleges, 16(3), 39-45.
Quarterly Review of Business Disciplines – Volume 1, Issue 1, May 2014
Page 60
Cannon, T. (2012). An introduction to color theory for web designers. Retrieved from http://webdesign.tutsplus.com/articles/design-theory/an-introduction-to-color-theory-for-web-designers/
Cheung, C., & Lee, M. (2005). The Asymmetric Effect of Web Site Attribute Performance on Web
Satisfaction: An Empirical Study. e-Service Journal, 3(3) pp. 65-86. Chen, K., & Sockel, H. (2001, August 3-5). Enhancing visibility of business websites: A study of
cyber interactivity. Proceedings of Americas Conference on Information Systems (AMCIS). 547-552.
Cunliffe, D. (2000). Developing usable websites – A review and model. Library Computing.
19(3/4), 222-234. eMarketer (2006, November 10). Online retailers face four-second barrier. Retrieved from
www.emarketer.com/Article.aspx?id=1004259 Ewalt, D. (2002, February 25). Web rage’ in real world. Retrieved from
www.informationweek.com/news/showArticle.jhtml?articleID=6500886 Falk, L. (2000, Winter). Creating a winning website. The Public Relations Strategist, 5(4) 37-40. Fitcher, D. (2005). Web Development over the Past 10 Years. Online, 29(6) pp 48-50. Gerber, E. (2002, March 18-23). Conducting usability research with computer users who are blind
or visually impaired. Retrieved from http://www.afb.org/info/accessibility/creating-accessible-websites/usability-research/235
Godskind, K. (2009). 5, 10, 15 seconds? How long will you wait for a web page to load? Retrieved
from http://blog.smartbear.com/software-quality/5-10-15-seconds-how-long-will-you-wait-for-a-web-page-to-load/
Hart, C., Doherty, N., & Ellis-Chadwick, F. (2000). Retailer adoption of the internet: Implications for retail marketing. European Journal of Marketing, 34(8), 954-974.
Huang, A. (2003). An empirical study of corporate website usability. Human Systems
Management, 22, 23-36. Kotha, S., Rajgopal, S., & Venkatachalam, M. (2004). The role of online buying experience as a
competitive advantage: Evidence from third-party ratings for e-commerce firms. Journal
of Business, 77(2), S109-S133. Krug, S. (2000). Don’t make me think: A common sense approach to web usability. Indianapolis:
New Riders Publishing
Quarterly Review of Business Disciplines – Volume 1, Issue 1, May 2014
Page 61
Langer, M. (2000). Putting your small business on the web. Berkeley: Peachpit Press. Marinilli, M. (2002). The theory behind user interface design. Retrieved from
http://www.developer.com/design/article.php/10925_1545991_1 Markoff, J. (2007). War for the 4
th screen. Retrieved from
http://www.nytimes.com/2007/01/07/business/worldbusiness/07iht-mobile.html?_r=0 Nah, F. (2004). A study on tolerable waiting time: How long are web users willing to wait?
Behaviour & Information Technology, 23(3), 153–163. Nielsen, J. (1999). User interface directions for the web. Communications of the ACM, 42(1)
65-72. Nielson, J. (2000). Designing web usability. Indianapolis: New Riders Publishing.
Nielson, J. (2003). The ten most violated homepage design guidelines. Retrieved from
http://www.nngroup.com/articles/most-violated-homepage-guidelines/ Nielson, J. (2012). Usability 101: Introduction to usability. NNGroup. Retrieved from
http://www.nngroup.com/articles/usability-101-introduction-to-usability/ NRC Factsheets (2013). Retrieved from
http://www.nrc.gov/reading-rm/doc-collections/fact-sheets/3mile-isle.html) Nygaard, V. (2003, September18). Top ten features of a good website. Retrieved from
http://www.webdesignbits.com/Web_Design/Web_Page_Design/6 Pagani, M. (2009). Encyclopedia of multimedia technology and networking 2ed. Information
science reference, 2, 533-38. Perrow, C. (1982). The president’s commission and the normal accident. In Sils, D., Wolf, C. &
Shelanski, V. (Eds), Accident at three mile island: The human dimensions. Westview, Boulder: 173–184.
Rau, P., Liang, P., & Max, S. (2003, January 15). Internationalization and localization: Evaluating and testing a website for Asian users. Ergonomics, 46(1-3), 255-271.
Rosen, D., Purinton, E., & Lloyd, S. (2004). Website design: Building a cognitive framework.
Journal of Electronic Commerce in Organizations, 2(1), 15-28. Rouse, M. (2007). Nomadic Computing (Mobile Computing). Retrieved from
http://searchmobilecomputing.techtarget.com/definition/nomadic-computing
Quarterly Review of Business Disciplines – Volume 1, Issue 1, May 2014
Page 62
Sockel, H., Falk, L., Warren, H., & Chen, K. (2007). A mental model to capture eCommerce atmospherics. Journal of International Business Disciplines, 1(2), 1-20.
United States Census Bureau News (2012). Profile America facts for features. Retrieved from https://www.census.gov/newsroom/releases/archives/facts_for_features_special_editions/cb12-ff16.html
Walker, J. S. (2004). Three mile island: A nuclear crisis in historical perspective. Berkeley:
University of California Press. Weinberg, B. (2000). Don’t Keep Your Internet Customers Waiting Too Long at the (Virtual)
Front Door. Journal of Interactive Marketing, 14(1), 30–39.

Quarterly Review of Business Disciplines – Volume 1, Issue 1, May 2014
Page 63
IT DISCONFIRMATION JUDGMENTS, SATISFACTION AND TRUST
Liqiong Deng, University of West Georgia [email protected]
ABSTRACT
The purpose of this study is to develop and test a research model that investigates the effects of different disconfirmation judgments about information technology (IT) on users’ satisfaction with and trust in the technology. The research model distinguishes between different disconfirmation judgments (i.e., expectation disconfirmation, desire disconfirmation, and norm disconfirmation) and examines their distinct effects on IT satisfaction and IT trust. A survey was conducted to test the research model and its associated hypotheses. The results indicated the predominant effect of desire disconfirmation on IT satisfaction. Desire disconfirmation was found to be a better predictor of IT satisfaction than expectation disconfirmation and norm disconfirmation. The results also revealed the significant effect of norm disconfirmation on IT trust and the full mediation effect of IT satisfaction between desire disconfirmation and IT trust. The findings of this study suggest that IT products/services should be designed to meet or exceed users’ desired performance and normative standards to foster IT satisfaction and trust.
Keywords: IT disconfirmation judgments, IT satisfaction, IT trust
INTRODUCTION AND MOTIVATION
The expectation disconfirmation theory (EDT), which was originated from customer
satisfaction research in marketing literature, has been widely applied in IS research (Jiang, Klein & Saunders, 2012). EDT has its origin in the discrepancy theory of satisfaction, which suggests that individuals compare their perceived performance of product/service against some standard of performance (e.g., expectations, desires, and norms), resulting in a disconfirmation/discrepancy judgment (Jiang et al., 2012; Niedrich, Kiryanova & Black, 2005). The disconfirmation judgment can be positive or negative. Positive disconfirmation will result when perceived product/service performance is better than the standard; while negative disconfirmation will occur if perceived product/service performance is worse than the standard (Cadotte, Woodruff & Jenkins, 1987). The more positive the disconfirmation judgment, the greater the satisfaction (Yi, 1990). Many studies have shown that disconfirmation judgment is perhaps the most important determinant of satisfaction (Bhattacherjee & Premkumar, 2004; Oliver, 1980; Spreng, Mackenzie & Olshavsky, 1996; Spreng & Page, 2003).
Prior research suggests that individuals may use multiple standards to form
disconfirmation judgments and evaluate product/service performance (Niedrich et al., 2005), however, it is not clear whether different disconfirmation judgments about an information technology (IT) product/service based on distinct standards have distinguishing effects on user

Quarterly Review of Business Disciplines – Volume 1, Issue 1, May 2014
Page 64
satisfaction with the IT product/service and which disconfirmation judgment is a better predictor of satisfaction. More recent research shows that disconfirmation judgment also predicts another important IS success factor – trust in IT (Lankton & McKnight, 2006). However, since satisfaction and trust are generally positively related, it is largely unknown whether disconfirmation judgments have separate impacts on IT satisfaction and IT trust.
The purpose of this paper is to develop and provide empirical validation for an IT
disconfirmation judgment model involving multiple standards for IT satisfaction and trust. The model emphasizes the distinctive roles of different disconfirmation judgments as predictors of user satisfaction with and trust in IT.
LITERATURE REVIEW AND HYPOTHESES DEVELOPMENT
Disconfirmation judgments are user judgments constructed by perceived performance of
product/service against comparison standards brought to mind at the time of judgment (Niedrich et al., 2005). Expectations, desires, and norms are the most commonly used comparison standards in the literature (Niedrich et al., 2005). Most IS studies adopt user expectations as the standard for disconfirmation judgment and performance evaluation (Jiang et al., 2012). Expectations are typically defined as beliefs or predictions about a product/service performance at some time in the future (Cadotte et al., 1987; Spreng et al., 1996). Such predictive expectations are mainly formed based on personal experience, existing knowledge, and communication with other people (Olson, Roese & Zanna, 1996; Zeithaml & Bitner, 2000). The impact of expectation disconfirmation on satisfaction however was found to vary widely in the literature (Churchill & Surprenant, 1982; Spreng et al., 1996). Some studies showed no relationship between expectation disconfirmation and satisfaction (Churchill & Surprenant, 1982), which is especially true when individuals hold extremely low expectations. In other words, an individual may be dissatisfied if he/she expects and receives poor performance (LaTour & Peat, 1979).
Some researchers suggested the use of desires instead of expectations as the standard in
the disconfirmation process leading to satisfaction/dissatisfaction response (Spreng et al., 1996; Suh, Kim & Lee, 1994). Unlike expectations that require an estimate of the likelihood of expected performance/attributes (or probability of occurrence), desires refer to inner emotional needs and wants that do not necessarily involve the assessment of probability of occurrence (Niedrich et al., 2005) and are not constrained by cognitive understanding of environmental circumstances (Jiang et al., 2012). An individual may develop distinctive expectations and desires toward the same object of evaluation. For example, a user may desire or want a technology to provide a high level of information security. However, he or she may not expect much according to his or her prior experience or understanding of current environment. Hence, positive disconfirmation of expectations resulting from perceived performance exceeding expectations may not lead to satisfaction if the perceive performance falls below desires.
Norm is another alternative comparison standard used in the formation of disconfirmation
judgment. Norms are the standards that reflect the performance individuals believe a product/service should provide. They represent category knowledge used to evaluate product

Quarterly Review of Business Disciplines – Volume 1, Issue 1, May 2014
Page 65
performance (Kahneman & Miller, 1986). Although norms and expectations are generated by similar sources of information, norms may include a larger set of attribute or performance information from similar products of the same type than predictive expectations (Niedrich et al., 2005). Hence, the disconfirmation of norm could be superior to the disconfirmation of expectation by accounting for prior experience with similar objects of evaluation (Jiang et al., 2012).
Expectations, desires, and norms are distinct constructs and individuals may use these
multiple standards of comparison in forming disconfirmation judgments (Niedrich et al., 2005). Prior satisfaction research has acknowledged the importance of avoiding confounding predictive expectations with judgments that implicitly involve other possible standards of comparison, such as desires and norms (Spreng et al., 1996). Among different disconfirmation judgments, desire disconfirmation seems to be the primary determinant of satisfaction. In consumer satisfaction research, a widely accepted definition of satisfaction is formulated as follows: “Satisfaction is the consumer’s fulfillment response.” It is a judgment that a product or service “provided a pleasurable level of consumption-related fulfillment, including levels of under- or over-fulfillment” (Oliver, 1997, p. 13). This definition suggests that satisfaction is a pleasurable fulfillment response resulting from an evaluation with respect to how well the consumption of a product or service meets a need, desire, or goal. Therefore, it is the performance in relation to desires, needs, and wants, rather than predictive expectations or norms that determines satisfaction (Westbrook & Reilly, 1983; Wirtz & Mattila, 2001).
Adopting Oliver’s definition of satisfaction (Oliver, 1997), IT satisfaction can be defined
as a fulfillment response resulting from the evaluation of an IT product/service. IT satisfaction is most likely to be determined by how well an individual perceives that the IT product/service performance fulfills his/her desires, needs, or wants. More specifically, a user is satisfied with an IT product/service when the performance of IT product/service meets or exceeds the user’s desires, and dissatisfaction occurs when the performance falls short of the user’s desires. Therefore, when compared with disconfirmation of expectations and disconfirmation of norms, disconfirmation of desires better captures user’s evaluation of IT performance leading to IT satisfaction/dissatisfaction. I propose that expectation disconfirmation and norm disconfirmation do not account for variance in IT satisfaction over and above desire disconfirmation. Hence, the following three hypotheses can be suggested:
Hypothesis 1: A user’s positive disconfirmation of desires about IT performance
positively influences his/her satisfaction with IT. Hypothesis 2: The inclusion of desire disconfirmation will reduce or may even eliminate
the observed direct link from expectation disconfirmation to IT satisfaction. Hypothesis 3: The inclusion of desire disconfirmation will reduce or may even eliminate
the observed direct link from norm disconfirmation to IT satisfaction. Satisfaction is also a function of perceived product/service performance (Oliver &
Wayne, 1988; Tse & Wilton, 1988). In addition to disconfirmation judgments, perceived IT
Quarterly Review of Business Disciplines – Volume 1, Issue 1, May 2014
Page 66
performance is a direct result of evaluation of IT performance during the technology usage experience. In general, one will be satisfied when the IT performance is favorable and dissatisfied when the IT performance is unfavorable. Therefore, I formulate the following hypothesis.
Hypothesis 4: A user’s perceived IT performance positively influences his/her satisfaction with IT.
Trust in IT is another important IS success factor that has received much attention in IS
research (McKnight, 2005; McKnight, Choudhury & Kacmar, 2002). Trust in IT reflects one’s willingness to depend on or be vulnerable to IT (McKnight, 2005). It is an attitude of willingness to rely on IT to perform actions that benefit oneself, together with a normative expectation: IT should perform in a particular way (Nickel, 2011). Trust is similar to satisfaction in the sense that they both represent the overall evaluation, feeling, or attitude about an object (Selnes, 1998). Thus, disconfirmation judgments about IT performance may also play an important role in the formation of trust in IT. According to Nickel’s definition of IT trust (Nickel, 2011), IT trust embodies a normative element, which characterizes the normative standard of IT performance. IT trust arises from the human-technology interaction in which technology does what one thinks it should do. Therefore, trust in IT is generated based on the disconfirmation of norms, which involves the use of norms as the comparison standard to evaluate whether IT performance meet or exceed normative standards. This suggests the following hypothesis.
Hypothesis 5: A user’s positive disconfirmation of norms about IT performance
positively influences his/her trust in IT. Prior research has suggested that satisfaction is an antecedent of trust (Flavian, Guinaliu
& Gurrea, 2005; Ribbink, Riel, Liljander & Streukens, 2004; Selnes, 1998). Trust in IT develops as a result of satisfactory experience with IT. Satisfied users are more willing to rely on IT to perform tasks in the future, while dissatisfied users are not as willing to depend on that technology. Given that satisfaction can act as an instrument to engender greater trust, the following hypothesis is formulated.
Hypothesis 6: A user’s satisfaction with IT positively influences his/her trust in IT.
RESEARCH METHOD
Sample, Design and Procedure
Microsoft Access software is used as the target technology to test the proposed research model and its associated hypotheses. A survey was conducted to collect data from undergraduate business students enrolled in an introductory management information systems course at a Southeastern U.S. University. The course offered instruction and practice with MS Access software. Students received extra credit for completing the survey in class during the last week of the semester. During the survey, the respondents were asked to evaluate the performance of MS Access software, compare the perceived performance of MS Access software against their
Quarterly Review of Business Disciplines – Volume 1, Issue 1, May 2014
Page 67
expectations, norms, and desires, and report their satisfaction with and trust in MS Access software. A total of 89 useable responses were received. There were 47 female respondents (52.81%) and 42 male respondents (47.19%).
Measures
Our survey instrument was developed by incorporating and adapting existing valid and reliable scales where appropriate. The perceived performance of MS Access software was measured as a second-order factor comprised of four dimensions: ease of use, usefulness, functionality, and reliability (Lankton & McKnight, 2011). The item scales measuring each of these four dimensions were adapted from the prior work on IT acceptance and trust (Lankton & McKnight, 2011). The measurement of expectation disconfirmation involved a comparison of perceived performance of MS Access software with originally predicted performance, using a 7-point Likert scale ranging from “much worse than I predicted” (1) to “much better than I predicted” (7). Different labels were used to measure desire disconfirmation using a scale ranging from “much worse than I wanted” (1) to “much better than I wanted” (7), and to measure norm disconfirmation with a scale ranging from “much worse than it should be” (1) to “much better than it should be” (7). The measurement scale of satisfaction with MS Access software was adapted from the work of Spreng at al. (1996) and Bhattacherjee and Premkumar (2004). Trust in MS Access software was measured using McKnight, Kacmar and Choudhury’s (2004) technology trusting intention scale.
DATA ANALYSIS AND RESULTS
Partial least square (PLS) – a component-based SEM (structural equation modeling) technique is used for data analysis. PLS is considered suitable for this study due to its superior prediction capability and minimal demands on sample size and residual distributions (Chin, 1998a; Chin, 1998b; Fornell & Bookstein, 1982). In addition, PLS allows us to test the psychometric properties of the measurement scales (the measurement model) and the relationships among the variables (the structural model) simultaneously. All the first-order constructs – the four dimensions of perceived performance, four dimensions of expectation disconfirmation, four dimensions of desire disconfirmation, four dimensions of norm disconfirmation, IT satisfaction, and IT trust were modeled using multiple reflective indicators. Perceived performance, expectation disconfirmation, desire disconfirmation, and norm disconfirmation were modeled as reflective second-order factors with their respective dimensions as first-order factors. The second-order factors were estimated using the hierarchical component model by repeated use of all the indicators of the first-order factors underlying the second-order constructs (Lohmoller, 1989).
Measurement Model
The psychometric properties of the measurement scales for the first-order factors were assessed in terms of convergent validity, discriminant validity, and reliability. The measurement scales have good convergent validity if each item’s loading on its corresponding construct exceeds 0.70 (Garver & Mentzer, 1999). All the factor loadings of the measurement items on

Quarterly Review of Business Disciplines – Volume 1, Issue 1, May 2014
Page 68
their corresponding constructs exceeded 0.70, indicating adequate convergent validity. To establish the discriminant validity, the measurement items should load higher on their respective constructs than the remaining constructs. The results show that all the items’ loadings on their own constructs were higher than the cross-loadings on other constructs. Another criterion for evaluating discriminant validity suggests that the average variance shared between the constructs and its indicators should be larger than the variance shared between the construct and other constructs (Fornell & Larcker, 1981). In other words, the square root of average variance extracted (AVE) of the constructs should exceed the inter-correlations among the constructs in the model (Chin, 1998b; Fornell & Larcker, 1981). The correlation matrix presented in Table 1 indicates that the square roots of AVE on the diagonal are greater than the corresponding off diagonal inter-construct correlations. Thus, the discriminant validity of all the first-order factors is supported.
Table 1. Inter-Construct Correlation and Square Root of AVE of First-Order Factors
ES FC RL US ED:
ES
ED:
FC
ED:
RL
ED:
US
ND:
ES
ND:
FC
ND:
RL
ND:
US
DD:
ES
DD:
FC
DD:
RL
DD:
US SA TT
ES 0.91
FC 0.61 0.91
RL 0.58 0.69 0.88
US 0.72 0.75 0.60 0.93
ED:
ES 0.58 0.46 0.41 0.51 0.93
ED:
FC 0.37 0.60 0.44 0.53 0.71 0.90
ED:
RL 0.24 0.42 0.47 0.37 0.56 0.69 0.88
ED:
US 0.45 0.54 0.36 0.65 0.73 0.79 0.55 0.92
ND:
ES 0.37 0.29 0.16 0.34 0.54 0.47 0.41 0.52 0.88
ND:
FC 0.20 0.31 0.32 0.37 0.48 0.69 0.60 0.64 0.65 0.93
ND:
RL 0.19 0.25 0.35 0.33 0.48 0.61 0.74 0.53 0.61 0.84 0.90
ND:
US 0.26 0.26 0.22 0.39 0.46 0.57 0.54 0.62 0.79 0.80 0.75 0.92
DD:
ES 0.48 0.47 0.38 0.52 0.74 0.68 0.63 0.67 0.66 0.63 0.59 0.56 0.88
DD:
FC 0.31 0.50 0.33 0.51 0.59 0.82 0.68 0.78 0.61 0.74 0.64 0.70 0.72 0.92

Quarterly Review of Business Disciplines – Volume 1, Issue 1, May 2014
Page 69
DD:
RL 0.25 0.41 0.46 0.45 0.56 0.73 0.78 0.67 0.49 0.70 0.78 0.62 0.70 0.83 0.90
DD:
US 0.37 0.43 0.34 0.52 0.60 0.77 0.62 0.77 0.59 0.69 0.58 0.67 0.78 0.81 0.70 0.90
SA 0.54 0.51 0.41 0.65 0.64 0.59 0.50 0.72 0.61 0.54 0.47 0.55 0.71 0.69 0.59 0.73 0.92
TT 0.31 0.42 0.37 0.45 0.47 0.56 0.61 0.58 0.58 0.58 0.58 0.64 0.59 0.64 0.64 0.66 0.74 0.93
ES = Ease of Use, FC = Functionality, RL = Reliability, US = Usefulness, ED = Expectation Disconfirmation, ND = Norm Disconfirmation, DD = Desire Disconfirmation, SA = Satisfaction, TT = Trust
The reliability of the measurement items was examined using the statistics of Cronbach’s
alpha (Cronbach, 1971), composite reliability (Chin, 1998a), and AVE (Fornell & Larcker, 1981). It is suggested that Cronbach’s alpha should exceed 0.70 (Cronbach, 1971), AVE should be 0.5 or greater (Fornell & Larcker, 1981), and composite reliability should be above 0.70 (Chin, 1998a) to indicate adequate reliability. Table 2 shows that all the values of composite reliability, AVE, and Cronbach’s alpha are well above the 0.70, 0.50, and 0.70 thresholds. These results indicate high reliability of the items.
Table 2. Composite Reliability, Cronbach’s Alpha, and AVE of First-Order Factors
Composite
Reliability
Cronbach’s
Alpha AVE
EASE 0.94 0.90 0.84 FUNC 0.94 0.90 0.83 RELB 0.91 0.86 0.78 USFL 0.95 0.92 0.86
ED: EASE 0.95 0.92 0.86 ED: FUNC 0.93 0.88 0.81 ED:RELB 0.91 0.86 0.78 ED:USFL 0.94 0.91 0.85 ND:EASE 0.91 0.86 0.78 ND:FUNC 0.95 0.92 0.86 ND:RELB 0.93 0.88 0.81 ND:USFL 0.94 0.91 0.85 DD:EASE 0.91 0.86 0.78 DD:FUNC 0.94 0.90 0.84 DD:-RELB 0.93 0.88 0.81 DD:USFL 0.93 0.89 0.82
SATF 0.96 0.94 0.85 TRST 0.95 0.92 0.86
ES = Ease of Use, FC = Functionality, RL = Reliability, US = Usefulness, ED = Expectation Disconfirmation, ND = Norm Disconfirmation, DD = Desire Disconfirmation, SA = Satisfaction, TT = Trust
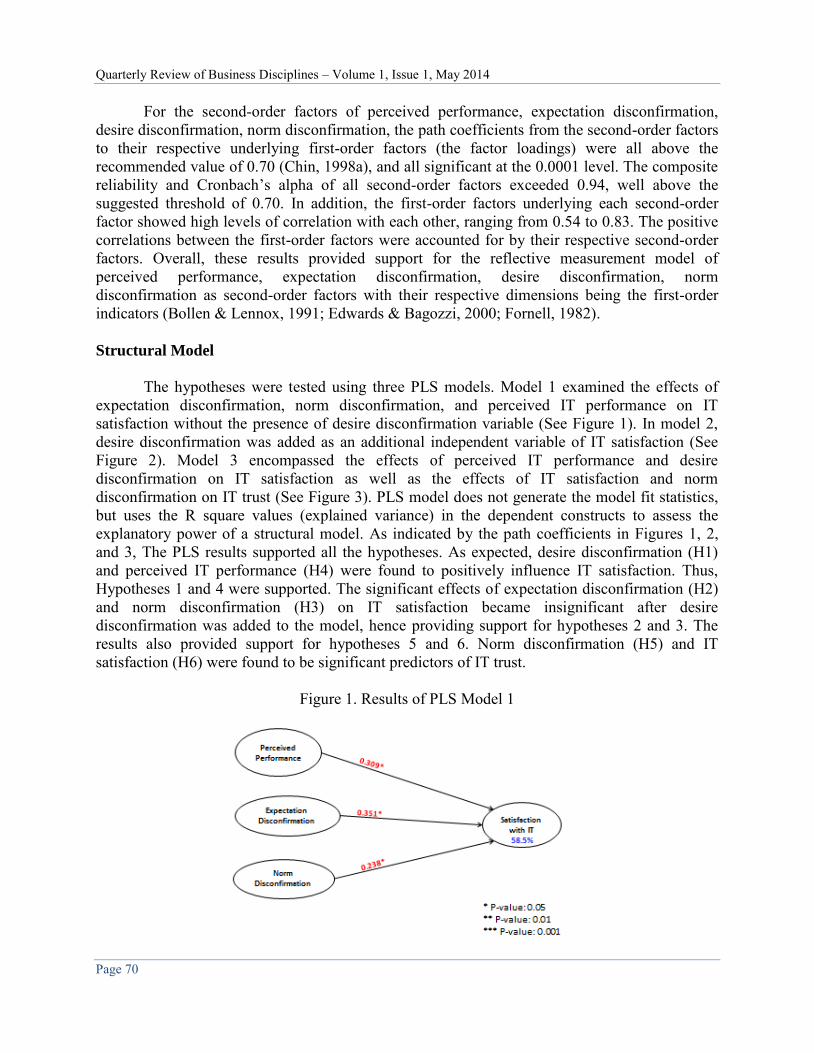
Quarterly Review of Business Disciplines – Volume 1, Issue 1, May 2014
Page 70
For the second-order factors of perceived performance, expectation disconfirmation, desire disconfirmation, norm disconfirmation, the path coefficients from the second-order factors to their respective underlying first-order factors (the factor loadings) were all above the recommended value of 0.70 (Chin, 1998a), and all significant at the 0.0001 level. The composite reliability and Cronbach’s alpha of all second-order factors exceeded 0.94, well above the suggested threshold of 0.70. In addition, the first-order factors underlying each second-order factor showed high levels of correlation with each other, ranging from 0.54 to 0.83. The positive correlations between the first-order factors were accounted for by their respective second-order factors. Overall, these results provided support for the reflective measurement model of perceived performance, expectation disconfirmation, desire disconfirmation, norm disconfirmation as second-order factors with their respective dimensions being the first-order indicators (Bollen & Lennox, 1991; Edwards & Bagozzi, 2000; Fornell, 1982).
Structural Model
The hypotheses were tested using three PLS models. Model 1 examined the effects of expectation disconfirmation, norm disconfirmation, and perceived IT performance on IT satisfaction without the presence of desire disconfirmation variable (See Figure 1). In model 2, desire disconfirmation was added as an additional independent variable of IT satisfaction (See Figure 2). Model 3 encompassed the effects of perceived IT performance and desire disconfirmation on IT satisfaction as well as the effects of IT satisfaction and norm disconfirmation on IT trust (See Figure 3). PLS model does not generate the model fit statistics, but uses the R square values (explained variance) in the dependent constructs to assess the explanatory power of a structural model. As indicated by the path coefficients in Figures 1, 2, and 3, The PLS results supported all the hypotheses. As expected, desire disconfirmation (H1) and perceived IT performance (H4) were found to positively influence IT satisfaction. Thus, Hypotheses 1 and 4 were supported. The significant effects of expectation disconfirmation (H2) and norm disconfirmation (H3) on IT satisfaction became insignificant after desire disconfirmation was added to the model, hence providing support for hypotheses 2 and 3. The results also provided support for hypotheses 5 and 6. Norm disconfirmation (H5) and IT satisfaction (H6) were found to be significant predictors of IT trust.
Figure 1. Results of PLS Model 1

Quarterly Review of Business Disciplines – Volume 1, Issue 1, May 2014
Page 71
Figure 2. Results of PLS Model 2
Figure 3 shows that 62.9% of the variance in IT satisfaction was accounted for by perceived performance of IT and desire disconfirmation of IT performance. Furthermore, norm disconfirmation of IT performance and IT satisfaction explained 62.0% of the variance in IT trust.
Figure 3. Results of PLS Model 3
An additional supplementary analysis was conducted to determine if IT satisfaction
mediates the effect of desire disconfirmation on IT trust. The mediating effect of satisfaction was tested in two separate models. The first model tested the direct effect of desire disconfirmation

Quarterly Review of Business Disciplines – Volume 1, Issue 1, May 2014
Page 72
on IT trust without the presence of satisfaction variable. A positive relationship was found between desire disconfirmation and IT trust, as indicated by a significant direct path from desire disconfirmation to IT trust (B = 0.414, p <0.01) in the model. The second model tested the direct effects of desire disconfirmation and IT satisfaction on IT trust. The results showed that after the satisfaction variable was included in the model, the significant effect of desire disconfirmation on IT trust became insignificant. These results led me to infer a full mediation effect of IT satisfaction on the relationship between desire disconfirmation of IT performance and IT trust.
CONCLUSIONS AND IMPLICATIONS
The contribution of the research is two folds, theoretical and practical. With regard to theoretical advancement, the major contribution of this research is to provide understanding of the distinctive effects of different disconfirmation judgments on IT satisfaction and IT trust. This study demonstrated that expectation disconfirmation, desire disconfirmation, and norm disconfirmation of IT performance are distinct constructs that play unique roles in the formation of IT satisfaction and IT trust. The findings suggested that desire disconfirmation of IT performance should be incorporated into the formation process of IT satisfaction. Desire disconfirmation was found to be a better predictor of IT satisfaction than expectation disconfirmation and norm disconfirmation. The observed direct links from expectation disconfirmation and norm disconfirmation to IT satisfaction diminished after desire disconfirmation was incorporated in the model. The findings also revealed the significant effect of norm disconfirmation on IT trust, indicating that IT trust is formed through a process whereby individuals compare their normative standards of IT performance to the actual IT performance. Finally, IT satisfaction was found to mediate the relationship between desire disconfirmation and IT trust.
As for practical contribution, this research provides practitioners with insights on how to improve user satisfaction with and trust in IT products/services. Practitioners should consider the findings regarding the effects of desire disconfirmation and norm disconfirmation when designing IT systems. To foster IT satisfaction and trust, IT products/services should be designed to meet or exceed users’ desired performance and normative standards.
REFERENCES
Bhattacherjee, A., & Premkumar, G. (2004). Understanding changes in belief and attitude toward
information technology usage: A theoretical model and longitudinal test. MIS Quarterly, 28(2), 229-254.
Bollen, K. A., & Lennox, R. (1991). Conventional wisdom in measurement: A structural
equation perspective. Psychological Bulletin, 110(2), 305-314. Cadotte, E. R., Woodruff, R. B., & Jenkins, R. L. (1987). Expectations and norms in models of
consumer satisfaction. Journal of Marketing Research, 24, 305-314.
Quarterly Review of Business Disciplines – Volume 1, Issue 1, May 2014
Page 73
Chin, W. (1998a). Issues and opinion on structural equation modeling. MIS Quarterly, 22(1), 7-16.
Chin, W. (1998b). The partial least squares approach to structural equation modeling. In G. A.
Macoulides (Ed.), Modern methods for business research (pp. 295-336). Mahwah, NJ: Lawrence Erlbaum Associates.
Churchill, G. A. Jr., & Surprenant, C. (1982, November). An Investigation into the determinants of
customer satisfaction. Journal of Marketing Research, 19, 491 -504. Cronbach, L. J. (1971). Test validation. In R. L. Thorndike (Ed.), Education measurement (pp.
443-507). Washington, DC: American Council on Education. Edwards, J., & Bagozzi, R. P. (2000). On the nature and direction of relationships between
constructs and measures. Psychological Methods, 5(2), 155-174. Flavian, C., Guinalıu, M., & Gurrea, R. (2006). The role played by perceived usability, satisfaction
and consumer trust on website loyalty. Information Management, 43, 1-14. Fornell, C. (1982). A second generation of multivariate analysis. New York: Praeger. Fornell, C., & Bookstein, F. (1982). Two structural equation modeling: Lisrel and PLS applied to
consumer exit-voice theory. Journal of Marketing Research, 19, 440-452. Fornell, C., & Larcker, D. (1981). Evaluating structural equation models with unobservable
variables and measurement error. Journal of Marketing Research, 18, 39-50. Garver, M. S., & Mentzer, J. T. (1999). Logistics research methods: Employing structural
equation modeling to test for construct validity. Journal of Business Logistics, 20(1), 33-57.
Jiang, J., Klein, G., & Saunders, C. (2012). Discrepancy theory models of satisfaction in IS
research. In Y. K. Dwivedi, M. R. Wade, and S. L. Schneberger (Eds.). Information
systems, explaining and predicting our digital society. Vol. 1 (pp. 355-381). New York, NY: Springer.
Kahneman, D., & Miller, D. (1986). Norm theory: Comparing reality to its alternatives.
Psychological Review, 93(2), 136–153. Lankton, N., & McKnight, D. H. (2011). What does it mean to trust Facebook? Examining
technology and interpersonal trust beliefs. The DATA BASE for Advances in Information
Systems, 42(2), 32-54.
Quarterly Review of Business Disciplines – Volume 1, Issue 1, May 2014
Page 74
Lankton, N., & McKnight, D. H. (2006). Using expectation-disconfirmation theory to predict technology trust and continuance usage intentions. Unpublished working paper. Workshops of University of Minnesota, Minnesota, USA. Retrieved from http://misrc.umn.edu/workshops/2006/spring/harrison.pdf
LaTour, S. A., & Peat, N. C. (1979). Conceptual and methodological issues in consumer
satisfaction research. In W. L. Wilkie (Ed.), Advances in consumer research Vol. 6 (pp. 431-440). Ann Arbor, MI: Association for Consumer Research.
Lohmoller, J-B. (1989). Latent variable path modeling with partial least squares. Heidelberg,
Germany: Physica-Verlag. McKnight, D. H. (2005). Trust in information technology. In G. B. Davis (Ed.), The Blackwell
encyclopedia of management Vol. 7: Management information systems (pp. 329-331). Malden, MA: Blackwell.
McKnight, D. H., Kacmar, C. J., & Choudhury, V. (2004). Shifting factors and the ineffectiveness
of third party assurance seals: A two-stage model of initial trust in a web business. Electronic Markets, 14(3), 252-266.
McKnight, H., Choudhury, V., & Kacmar, C. (2002). Developing and validating trust measures for
e-Commerce: An integrative typology. Information Systems Research, 13(3), 334-359. Nickel, P. J. (2011). Ethics in e-trust and e-trustworthiness: The case of direct computer-patient
interfaces. Ethics and Information Technology, 13(4), 355-363. Niedrich, R., Kiryanova, E., & Black, W. (2005). The dimensional stability of the standards used
in the disconfirmation paradigm. Journal of Retailing, 81(1), 49-57. Oliver, R. L. (1997). Satisfaction: A behavioral perspective on the consumer. New York:
McGraw-Hill. Oliver, R. L. (1980). A cognitive model of the antecedents and consequences of satisfaction
decisions. Journal of Marketing Research, 17, 460-469. Oliver, R. L., & Wayne, S. D. (1988, March). Response determinants in satisfaction judgments.
Journal of Consumer Research, 14, 495-507. Olson, J. M., Roese, N. J., & Zanna, M. P. (1996). Expectancies. In E. T. Higgins, and A. W.
Kruglanski (Eds.). Social psychology: Handbook of basic principles (pp. 211-238). New York, NY: Guilford.
Ribbink, D., Riel, A. C. R., Liljander, V., & Streukens, S. (2004). Comfort your online customer:
quality, trust and loyalty on the Internet. Managing Service Quality, 14(6), 446-644.

Quarterly Review of Business Disciplines – Volume 1, Issue 1, May 2014
Page 75
Spreng, R. A., Mackenzie, S. B., & Olshavsky, R. W. (1996). A reexamination of the determinants of consumer satisfaction. Journal of Marketing, 60(3), 15-32.
Spreng, R. A., & Page, T. J. (2003). A test of alternative measures of disconfirmation. Decision
Science, 34(1), 31-62. Selnes, F. (1998). Antecedents and consequences of trust and satisfaction in buyer-seller
relationships. European Journal of Marketing, 32, 305-322. Suh, K., Kim, S., & Lee, J. (1994). End-user’s disconfirmed expectations and the success of
information systems. Information Resources Management Journal, 7(4), 30–39. Tse, D. K., & Wilton, P. C. (1988). Models of consumer satisfaction formation: An extension.
Journal of Marketing Research, 25, 204-212. Westbrook, R. A., & Reilly, M. D. (1983). Value-Percept disparity: An alternative to the
disconfirmation of expectations theory of consumer satisfaction. In R. P. Bagozzi, and A. M. Tybout (Eds.). Advances in Consumer Research Vol. 10 (pp. 256-261). Ann Arbor, MI: Association for Consumer Research.
Wirtz, J., & Mattila, A. (2001). Exploring the role of alternative performance measures and
needs-congruency in the consumer satisfaction process. Journal of Consumer Psychology, 11(3), 181-192.
Yi, Y. (1990). A critical review of consumer satisfaction. In V. A. Zeithaml (Ed.), Review of
marketing (pp. 68-123). Chicago, IL: American Marketing Association. Zeithaml, V. A., & Bitner, M. J. (2000). Services marketing: Integrating customer focus across the
firm, 2nd Edition. Boston: McGraw-Hill.
Quarterly Review of Business Disciplines – Volume 1, Issue 1, May 2014
Page 76
THE VALUE OF SOCIAL MEDIA FOR PUSHING ACTIVIST ORGANIZATIONS
SOCIAL AGENDAS: IMPLICATIONS FOR PR THEORY AND PRACTICE
Maureen Taylor, University of Oklahoma [email protected]
Michael L. Kent, University of Oklahoma
ABSTRACT
New social media tools emerge regularly linking people to people, people to organizations, and organizations to organizations. Today, there are hundreds of social media tools and apps. The fields of advertising, marketing and public relations all make claims about social media as tools to further their field’s strategic objectives. While corporate uses of social media for advertising, marketing, and public relations, are quite common, we know very little about how social cause groups use social media to interact with publics, media, donors, government officials, and corporations. Can the traditional models of social media in strategic communication, initially employed by profit seeking firms, be applicable or even desirable for activist groups? This essay explores a new model of social media that sells ideas rather than products or services.
Keywords: Activists, Social Media, Corporate Communication, Projek Dialog, Sina
Weibo, Wechat, Public Relations.
INTRODUCTION
For many communication professionals, social media are “must have” communication tools. Social media, social networking platforms, and apps now number in the thousands and new ones emerge regularly linking people to others who share the same interests or views. Many organizations use social networking platforms like Facebook, YouTube, and Twitter to communicate with stakeholders and publics but many other tools, apps and networking sites exist for smaller niche groups to interact.
Corporate uses of social media for advertising, marketing, and public relations help to
support the bottom line and build economic value. However, economic value (capital) is not the only possible outcome for social media strategies. Social cause groups have started to use social media and social networking sites to reach publics, the mass media, donors, government officials, and corporations. These organizations, like firms, also seek a return on their investment but the desired return is not an economic one. Social cause groups seek a social capital return. Social capital is a resource that creates shared norms or values. Social capital is an outcome of the relationships in both the business sector and social cause sector (Bourdieu, 1986; Coleman,

Quarterly Review of Business Disciplines – Volume 1, Issue 1, May 2014
Page 77
1988; Fukuyama, 2002; Putnam, 2000). Social media can facilitate the relationships that build social capital.
The first section of the paper briefly summarizes the use of social media in corporate
communications. It compares how public relations, marketing and advertising approach social media. The second section of the paper explores the applicability of the corporate model of social media for the social cause sector. This section asks whether social media, often part of the communication mix for profit seeking firms, is applicable or even desirable for activist groups. Can social media tools that sell products also be used to sell pro social ideas, or as Wiebe (1951–1952) suggested, to sell brotherhood? The final section of the paper provides case studies of two social cause group’s use of social media. The case studies show that new opportunities are made possible by the diffusion of social media into the social cause sphere. Social media can fill in gaps in societies and provide a space for relationship building and information sharing.
This essay explores social media as a communication tool. Additionally, it explores how
social cause organizations are adapting social media practices developed in the corporate sector to create new communication models that sell ideas, not products or services. We view this alternative use of social media as one way to facilitate a “fully functioning society.” Heath (2006) identified a series of premises of how organizations can contribute to a fully functioning society (FFS). Heath called on management teams to use their power responsibly, and be committed to making decisions that bring order and control to uncertainty. For Heath, an organization’s legitimacy is tied to its capacity to meet or exceed the normative expectations of stakeholders. While all organizations pursue self-interest, Heath noted that an organization’s interests are best served when it attempts to coordinate and manage risk. Communication plays a key role in FFS theory: two-way communication between parties creates trust, cooperation, and aligned interests. Ethical organizations need to have internal communication processes that allow for coordination of external effort. Finally, organizations should advocate for their interests because the wrangle of the marketplace of ideas benefits everyone in society.
That the Internet and social media have social and educational value beyond serving
corporate interests has been a fundamental assumption of the World Wide Web since its inception. Kent (2001), in one of the earliest essays critical of the early corporate or managerial use of the Internet to advance business interests, pointed out the value of the Internet as a tool of education, to equalize power among the subaltern, to connect people with limited resources to information, to help maintain relationships among diaspora, etc. (p. 360). The use of social media by activists, then, represents a natural extension of a powerful communication tool. Although many of the marketing, advertising, and public relations uses of the Internet were developed to sell products rather than ideology, the application of such communication tools to building social capital and foster a fully functioning society need to be explored.
SOCIAL MEDIA RESEARCH BY PROFESSIONAL COMMUNICATORS
Many fields of academic study and professional practice make a claim about social media being a valuable communication tool to their field. Kent, a public relations scholar, defined social media as “any interactive communication channel that allows for two-way interaction and
Quarterly Review of Business Disciplines – Volume 1, Issue 1, May 2014
Page 78
feedback” (2010, p. 645). The two major features of social media are that they are relational and involve some kind of feedback or interaction. But as we examine the way that social media are used in more detail we find very different perspectives on what interaction and feedback mean to business communicators from different disciplinary fields.
Advertising Through Social Media
In advertising, the use of social media supports the bottom line. Advertising is commonly understood as paid, one-way, print or mediated communication, intended to encourage or persuade consumers to purchase an organization’s products or services. Historically, advertising services were provided to clients and revenue was generated based on sales and media buys.
Firms and advertising agencies use social media tools like Facebook and Twitter to call
attention to a product or service. Digital and social media have become part of advertisers’ strategies for influencing and encouraging purchasing decisions (Powers, Advincula, Austin, Graiko, & Snyder, 2012). As Powers et al. explained there are seven features of social media that are relevant to selling “products to consumers at all stages in the purchase process: . . . Being Always On, Everywhere, The Role of Emotion; Trust Networks; Mobile Devices in the Purchase Process; The Role of Brands; The Evolving Path to Purchase” (p. 480).
For advertisers, social media are a communication vehicle to carry ads. Using social
media is not much different than using television, radio, or print for bringing a product to the consumer. Being “Always On,” or always exposed to social media content through web sites and social media, computers, cellular telephones, etc. makes social media an obvious tool for influencing purchasing decisions. Since digital technology means that shopping can take place from anywhere and “Everywhere,” consumers receive messages that seek to influence their purchase decisions. Advertisers are interested in incorporating emotions so the “Role of Emotion” is to make consumers feel relaxed and empowered in their shopping. One of the ways that advertising is able to influence purchase decisions has been through an evolution of “Trust Networks.” Social networking enables people to interact with a wider network of friends and acquaintances than would be possible through actual interpersonal interactions (Taylor, Lewin, & Strutton, 2011). As Powers et al. (2012) explain,
Social media are expanding the range of people we trust. It is not just about family, friends, and colleagues now (i.e., the relationships that have formed the basis for word-of-mouth recommendations for years). It’s about a wider circle of people who already are—and still can be—connected via social media. (p. 481) The influence of “Mobile Devices in the Purchase Process” and awareness process has
increased, making social media tools increasingly important to advertisers who want the best venue to reach their audience. Synergistically, social media have influenced how brands interact with consumers. Consumers expect brands to be entertaining and interactive. Consumers now expect that they can interact with brands via their mobile devices and through online interactions. Today, consumers expect more from brands. “The Role of Brands” now includes providing information, commentary, and encouraging “dialogue” or conversations about brands and
Quarterly Review of Business Disciplines – Volume 1, Issue 1, May 2014
Page 79
consumers’ individual and collective brand identities. Finally, “The Evolving Path to Purchase” that has been enabled via new technology and social media has altered the traditional awareness–purchases funnel. Today, consumers often come to, and interact with, brands in a different fashion than before the diffusion of the Internet and social media.
Hence, the goal of social media in advertising is primarily to sell products. The
techniques used include persuasive strategies like storytelling, identification, word of mouth and other techniques, but the process of advertising does not allow for the development of individualized relationships with each consumer. Instead, advertising creates a belief that consumers will gain value from a purchase. Public relations, described next, takes a different approach to the use of social media based on its assumptions about stakeholders and publics.
Public Relations Aspirations for Social Media
The field of public relations has also claimed social media as a communication tool since the mid '90s. Research has suggested that organizations are using social media to build meaningful relationships with publics (Sweetser & Metzgar, 2007; Trammell, & Keshelashvili, 2005). A review of the literature suggests that since 2010, the Journal of Public Relations
Research, Public Relations Journal, and Public Relations Review have published nearly 50 articles about social media.
The public relations social media scholarship has focused primarily on uses of social
media tools by professionals and key publics, rather than on using the tools to achieve agreed upon public relations ends. “Relationship building” is more amorphous than “selling more widgets,” and more difficult to measure. As a result, two methods tend to dominate the research: content analysis of the social media tools and practitioner perceptions of social media. Content analysis research has examined the messages produced by practitioners (Muralidhara, Rasmussen, Patterson, & Shin, 2011; Rybalko & Seltzer, 2010; Smith, 2010; Waters & Jamal, 2011; Xifra & Grau, 2010). Studies have also asked practitioners about their impressions of social media (Sweetser & Kelleher, 2011; Wright & Hinson, 2008, 2010). Wigley and Lewis (2012) reported that two social media platforms, Twitter and Facebook, have been studied the most by public relations scholars and professionals.
The research is not yet clear on how social media creates relationships. Scholars have
generally agreed that organizations have failed to fully maximize the relational possibilities of online communication (McAllister-Spooner, 2009). Indeed, Waters and Jamal (2011) found that organizations are using Twitter as a one-way communication tool to broadcast one-way messages to publics. Little relationship building is created by these one-way communication messages.
Public relations practitioners also view social media as an inexpensive, direct way to
reach publics. In theory, organizational members and consumers are believed to co-create social media content and reality, but in practice, one-way messaging has resulted in the use of social media tools in a similar fashion as advertising.

Quarterly Review of Business Disciplines – Volume 1, Issue 1, May 2014
Page 80
As a strategic messaging tool, Trammell (2006) noted that social media are valuable because they provide another avenue to reach the public. “Practitioners need no longer rely on media for transmitting those messages and reaching their public” (p. 402). There is also a belief public relations tactics “such as electronic pitching, podcasting, and blogging, [will] prevail over traditional news releases and media kits” (Turk, 2006, p. 31). Nevertheless, the historical use of social media by public relations professionals has been primarily one-way communication sharing many of the same assumptions as advertising.
Marketing Applications of Social Media
The field of marketing also has emphasized social media as a tool. Social media marketing is an extension of traditional online marketing but it focuses on people rather than
products. In other words, instead of an organization sending out messages about a product, social media encourages individuals to distribute, repost, or even develop their own messages about products, services, or organizations. Social media marketing attempts to persuade consumers that product, brands and organizations share their own values and exist to make individual’s lives better (Kaplan & Haenlein, 2010).
There are many benefits of using social media to communicate about products, brands,
and organizations. First, organizations can reduce the cost of interacting with consumers. When people voluntarily distribute an organization’s messages to their friends, an amplifier effect is created. Thus, this type of direct marketing communication decreases the cost to reach consumers and the amount of staff time that would have been needed to reach so many people.
Second, social media allow organizations to capitalize on the already homogenous and
established social networks of customers and target audiences. When messages and endorsements are shared via social media, the product, brand, or organization benefits from the credibility of the source of the message. However, at the same time, when organizations make mistakes or are responsible for poor behavior or harm, networks of friends, family, and colleagues share their complaints and concerns about the focal organization creating a greater awareness and perhaps even collective outrage about the firm. When stakeholders and publics share their complaints, concerns, and criticism via social media, people listen.
Major themes in the literature also suggest that like the advertising field, word of mouth,
is an important topic of research (www.womma.org) and organizations like WOMMA (Word of Mouth Marketing Association) have emerged to help teach skills and advance marketing interests. Other marketing themes include analysis of different social media platforms, brand-consumer interactions, SMS and mobile phones, user generated content and audience segmentation (Kaplan & Haenlein, 2010).
There is a common optimistic theme in the three disciplines’ treatment of social media’s
potential economic value. Although advertising, marketing and public relations researchers have yet to fully unlock the economic value of social media, there is still great hope that social media can contribute to an organization’s bottom line.
Quarterly Review of Business Disciplines – Volume 1, Issue 1, May 2014
Page 81
At the same time, there is also awareness that the interactivity of social media and the power of social networks will create other opportunities and challenges for firms. Whelan, Moon, and Grant (2013) demonstrated how social media contribute to recent changes in corporate–society relations. They argued:
(i) social media contribute to significant changes within corporate arenas of
citizenship; (ii) social media contribute to significant changes within public arenas of citizenship; and that (iii) ICT [information and communication technology] corporations possess significant capacities with which to enable individual citizens to participate within public arenas of citizenship. (p. 785)
Whelan et al. (2013) point to the concept of a public sphere where citizens are more
vocal, empowered and active. Firms need to understand that a new model of corporate-citizen relationships is emerging. This new public sphere places both the citizen and the organization on equal footing when it comes to speaking out about issues. Indeed, one implicit outcome of the recent changes in corporate–society relations is the growth of social cause groups. Whelan et al. (2013) are correct: Social media will contribute to significant changes within public arenas of citizenship (p. 785). Additionally, social media have the potential to create the relationships that create social capital. The next section explores how social cause groups can build on and extend corporate models of social media to better achieve their goals.
APPLYING AND EXTENDING SOCIAL MEDIA FOR SOCIAL ACTIVISTS
The literature cited above suggests that there is a clear rationale for corporations to use social media in their different communication strategies of advertising, marketing and public relations. The corporate model suggests that there are tangible economic benefits for incorporating social media into a corporation’s communication strategy. Yet, corporations are not alone in seeing the value of social media. Social activists also see great potential in social media for advocacy. Social cause groups, also known as “not-for-profit” and “third sector” groups are now using social media to reach publics, media, donors, government officials, and corporations. Can tools developed to sell products be used to sell brotherhood (Weibe, 1951–1952) or contribute to what Heath (2006) termed, a fully functioning society? The answer appears to be yes. There are four different ways that social activists are using social media that reflect and extend corporate use of the tools to help improve society. Social media can be used to build awareness of social issues, amplify pro social messages, create relationships, and motivate pro social behaviors that ultimately benefit society.
Build Awareness
Advertising, marketing and public relations practitioners recognize the value of social media in building awareness. Increasing how many people know about an organization, its product or services, and its reputation is a dominant use of social media in the corporate sector. Social activists also need to build awareness about an issue, problem, or situation. They have limited organizational resources devoted to the three communication areas (advertising, marketing and public relations) and thus look for cost effective ways to build awareness.
Quarterly Review of Business Disciplines – Volume 1, Issue 1, May 2014
Page 82
Facebook groups, Facebook Walls, Twitter, and YouTube can build awareness of an issue or an organization. Other social media such as Linkedin, RSS feeds, and blogs can also build awareness about topics of interest to social cause groups.
Amplify Messages
Social media are used by firms to amplify key messages. Communicating through traditional media such as print, television, and radio incurs costs. Even public relations communication, a form of earned media, incurs some costs as salaries and materials need to be created before dissemination. Social media, on the other hand, reduce the cost of disseminating messages for several reasons. First, social media are generally low cost platforms for disseminating messages. Firms do not have to buy space. Content can be easily repurposed. Information from a news release can be reformatted quickly for a Facebook page or shortened to a tweet. Second, social media is about user generated content. Audiences can take social media tactics and modify them in ways that make them more interesting or personalized for a social group. Firms can create contests for creative use of brands and messages. Finally, social media messages are exponential in reach because of social networks. When one person forwards or comments on something, others join in. This amplifies the reach of the communication.
Social cause groups also need to amplify the reach of their messages from the current true
believers to larger sections of the public. When a person personally shares information about an important social cause such as animal welfare or climate change, the message carries more credibility. Social media messages can be constructed in a way that encourages people to share them with others in their social network. Indeed, many social media platforms and apps have multiple options for users to share content via email, twitter, Facebook or other social media platforms.
Create Relationships
Corporate advertising, marketing and public relations practitioners all claim that their communication tactics build relationships with the target public. Social cause activists also seek to build relationships with publics including citizens, media, politicians, and firms. Typical corporate relationship building tactics in advertising, marketing and public relations might include economic incentives such as loyalty programs, discounts or coupons. Social cause groups do not have economic relationships with publics, so instead must build relationships on other terms.
Social cause groups create relationships through identification and a sense of shared
meaning and purpose. For instance, social cause groups create identification and a sense of belonging to members through shared purpose. Social cause groups devote communication resources to articulating shared goals. They also build relationships through creating a sense of interdependence with members or the public in general. Communications from social cause groups often explain that they cannot achieve their higher purpose goals without support from their members. For profit organizations rarely openly acknowledge their dependency on publics. Finally, social cause groups use social media to show progress toward a goal. People like to

Quarterly Review of Business Disciplines – Volume 1, Issue 1, May 2014
Page 83
know that they are contributing to something larger than themselves. Informational graphics in the form of thermometers and piggy banks are used to show progress and motivate behaviors.
Motivate Behaviors
The final way that social media can be used by social cause groups is to find innovative tactics to change or modify behaviors. Behavior change is generally the goal of advertising, marketing and public relations communication. In the social cause sector, behavior change or maintenance is also a goal. Social cause groups need people to activate to support their organization’s goals. Social cause groups need people to make lifestyle changes, donate money, contact their elected representatives, attend meetings, share information and motivate others to join the cause. In the social cause sector, sometimes the desired behavior change is a personal change such as committing to recycling, refraining from eating meat, being kind to others, or conserving fuel. Giving money or time is also a personal component of social activists. In other situations, social activist groups seek to accomplish a larger societal goal that involves members engaging in more public behaviors such as attending rallies or contacting an elected official.
Overall, there is a lot of overlap in how firms and social activists use social media. Both
sectors seek to build awareness, amplify messages, build relationships and motivate behaviors. Yet, social cause activists have a greater imperative to use social media to build relationships because of its reach, cost effectiveness, and high involvement of users. They can be creative in their use of social media because they do not have the same bottom line issues.
CASE STUDIES OF SOCIAL MEDIA USE IN ACTIVISM
This section provides two case studies of how social cause activists are using social
media to accomplish goals that contribute to society. The examples below show how social media can contribute to a fully functioning society (Heath, 2006). Each case study shows innovative use of common social media and then shows how the groups have built on the foundation of the social media for greater societal impact. In both cases, social media is filling a gap in society.
Projek Dialog: Building Inter-ethnic and Intra-ethnic Relations in Malaysia
Malaysia is considered by many to be a model Southeast Asian democratic Muslim-majority country. Yet, there are significant rifts in the ethnic and, more recently, the religious make-up of the country. The ethnic rifts date to colonial days, but had their modern expression in the 1969 Malay-Chinese race riots and subsequent government policies such as the New Economic Policy that positively discriminated in favor of the Malay majority and restricted Chinese, Indian and other ethnic groups’ access to higher education, government jobs and business opportunities. While more than 40 years have passed since the 1969 race riots, the fear of riots is frequently noted as a likely consequence of “hot-headed” Malaysians discussing such a sensitive issue. This lack of discussion has entrenched policies that favor Malays. The affirmative action policies for the majority ethnic Malays—known as bumiputera—are now considered a right that should never be questioned, much less discussed, by other ethnic groups.
Quarterly Review of Business Disciplines – Volume 1, Issue 1, May 2014
Page 84
If Malaysia had a vibrant media sector or the civil society sector, then the actions of the conservative groups to cut-off any religious debate would be less significant or even less successful. However, Malaysia has neither. The mainstream print, radio and TV media is largely compliant with government messages that implicitly state that these issues should not be discussed, one key reason being that most of the media is directly or indirectly operated by the parties that make up the ruling coalition. The government closely controls access to licenses for media organizations to ensure that no independent voices emerge in the traditional media space.
The consequence of government action against independent media and civil society
groups is a lack of moderate voices that can counter-balance the growing and largely unrestrained conservative voices. Online platforms and social media hold great promise to create spaces for moderate voices to emerge. The Projek Dialog (PD) platform was launched in May 2012 (www.projekdialog.com). It provides thoughtful, respectful discussions of interfaith issues in Malaysia. The social media platform includes articles written by well-respected social leaders and it fills a void in the country. People can read about religious issues, post comments, and engage in dialogue with others. The site posts most of its stories in Bahasa, the local language, so that Malays can be exposed to messages that are not in the local language media.
Social media platforms require constant attention, updating and innovation. Projek Dialog
has a Facebook page that attracts young people to its content. PD buys ads to drive traffic to the site and it uses Twitter and YouTube to share content. Over the course of the project, Projek Dialog continued its consistent growth by adding new aspects to its outreach: short video tutorials, podcasts focused on topics discussing religion. There was also an amplifier effect to Projek Dialog, as the media reported stories and invited contributors to talk about Malaysian religious issues.
The social media platform includes short video tutorials that summarize complex issues
such as Islamic feminism, the secular predisposition of the Malaysian constitution, the importance of interfaith dialogue, human rights and liberation theology. There are also podcasts, Dialog Jalanan (or Street Dialog), that tackle sensitive topics. The podcasts are popular because they demonstrated a level of critical and open discussion about sensitive topics. Topics included the decline of Malay folk culture, demonization of Shia Muslims, importance of dialogue, and the rising fear of Christians in Malaysia. A recent contest encouraged Malaysian youth to create a game to build interethnic awareness. In this case study, we see that social media are facilitating information sharing and interactive relationships that can help build understanding in Malaysia. Social media provide a platform for information sharing and interaction that are missing from society. Projek Dialog fills a gap in Malaysian society for communicating about religious topics. The next case study also shows how social media can further communication in a society.
Sina Weibo and WeChat: Creating Spaces for Public Discussions
In China, the government controls all traditional media outlets including newspapers, television and radio stations. Independent media are not yet possible and citizens have limited information options for learning about their community, the nation, and the world. The Chinese government also tightly controls freedom of expression, especially public discussions about
Quarterly Review of Business Disciplines – Volume 1, Issue 1, May 2014
Page 85
topics of the environment, corruption, health, the legal system, and the economy. In the past, there were very few options for Chinese citizens to share information and share opinions.
Social media like Facebook emerged as a path to create more conversations in China;
however the Chinese government started blocking Facebook in spring 2009. That same year, SINA Corporation launched Sina Weibo, a Chinese microblogging (weibo) website. Sina Weibo incorporates aspects of both Twitter and Facebook allowing users to send and receive information, music, links to videos, and photos. Messages take on a public dimension with people choosing to follow others. Posters may not know all of the people who receive their messages so people are generally cautious about what they say on the platform. Sina Weibo does have some censorship including blacklisted words and a manual checking system that deletes posts that are considered inappropriate (usually charges of corruption against government, information that is considered national security, and anything that challenges the government’s authority). However, in a country where discussions about the topics of the day are generally not allowed, Sina Weibo provides a venue for people to share public information and opinion.
Another Chinese social media platform, WeChat, is a mobile text and voice messaging
communication service. Tencent released WeChat in January 2011. The service is more of a private way for people to chat with those they have identified as friends. There are many more personal settings for chats through WeChat. While there is also the possibility of censorship or deleting, reports suggest that WeChat does not have the same level of surveillance as Sina Weibo. Initially, Chinese social activists had used Sina Weibo for pushing out information and stimulating debate. However, since 2014, it appears that activists have begun moving their advocacy to WeChat. The Chinese public appears to agree. Data from 2013 suggest that WeChat is growing while SinaWebo is declining. Despite these limitations, Sina Weibo and WeChat provide some of the only platforms for Chinese citizens to learn about events and participate in conversations about topics that affect their lives, and provide a space for discussion that is missing in Chinese society.
CONCLUSIONS
As noted previously, the discussions about social media among for profit organizations in marketing, advertising, and public relations typically revolve around using the tools to promote corporate interests, rather than serving the needs of a fully functioning society. Forgotten in many of the discussions about social media are the tens of thousands of civil society organizations that work to make the world a better place.
This article examined social media as both a business communication tool and a pro
social tool to help build better societies. The case studies show that social cause groups are adapting social media practices developed in the corporate sector. We believe that a new model of social media is emerging. This new model creates relationships and those relationships have the potential to create social capital. In the two case studies presented here, social media sell ideas, not products or services. Social cause groups are indeed using social media to create awareness, amplify messages, build relationships, and motivate behaviors. Researchers should also be cautious, however, of groups that seek to break down social capital and use social media

Quarterly Review of Business Disciplines – Volume 1, Issue 1, May 2014
Page 86
to achieve their own ends. Future research should study the effectiveness of social cause group’s use of social media and build a conceptual model of social media use to build social capital.
REFERENCES
Bourdieu, P. (1986). The forms of capital. In J. G. Richardson (Ed.), Handbook of theory and
research for the sociology of education (pp. 241–258). New York: Greenwood. Coleman, J. (1988). Social capital in the creation of human capital. American Journal of
Sociology, 94, 95–120. Fukuyama, F. (2002). Social capital and development. SAIS Review, 22, 23-37.
Heath, R. L. (2006). Onward into more fog: Thoughts on public relations’ research directions.
Journal of Public Relations Research, 18, 93–114. Kaplan, A. M., & Haenlein, M. (2010). Social media research in public relations, marketing and
advertising. Business Horizons, 53(1), 59–68. Kent, M. L. (2001). Managerial rhetoric and the metaphor of the World Wide Web. Critical
Studies in Media Communication 18(3), 359–375. Kent, M. L. (2010). Chapter 45: Directions in social media for professionals and scholars. In R.
L. Heath (Ed.), Handbook of public relations (second edition) (pp. 643-65). Thousand Oaks, CA: Sage.
McAllister-Spooner, S. M. (2009). Fulfilling the dialogic promise: A ten-year reflective survey
on dialogic Internet principles. Public Relations Review, 35(3), 320–322. Muralidhara, S., Rasmussen, L., Patterson, D., & Shin, J. (2011). Hope for Haiti: An analysis of
Facebook and Twitter usage during the earthquake relief efforts. Public Relations
Review, 37(2), 175–177. Powers, T., Advincula, D., Austin, M. S., Graiko, S., & Snyder, J. (2012, December). Digital and
social media in the purchase decision process: A special report from the advertising research foundation. Journal of Advertising Research, 479–489.
Putnam, R. (2000). Bowling alone: The collapse and revival of American community. New York,
NY: Simon and Shuster. Rybalko, S., & Seltzer, T. (2010). Dialogic communication in 140 characters or less: How
Fortune 500 companies engage stakeholders using Twitter. Public Relations Review,
36(4), 336–341.
Quarterly Review of Business Disciplines – Volume 1, Issue 1, May 2014
Page 87
Smith, B. (2010). Social distributing public relations: Twitter, Haiti, and interactivity in social media. Public Relations Review, 36(4), 329–335.
Sweetser, K. D., & Metzgar, E. (2007). Communicating during crisis: The use of blogs as a
relationship management tool. Public Relations Review, 33, 340–342. Sweetser, K. D., & Kelleher, T. (2011). A survey of social media use, motivation and leadership
among public relations practitioners. Public Relations Review, 37(4), 425–428. Taylor, D. G., Lewin, J. E., & Strutton, D. (2011). Friends, fans, and followers: Do ads work on
social networks? Business Faculty Publications (2011). Retrieved from http://works.bepress.com/david_taylor2/5
Trammell, K. D. (2006). Blog offensive: An exploratory analysis of attacks published on
campaign blog posts from a political public relations perspective. Public Relations
Review 32(4), 402–406. Trammell, K. D., & Keshelashvili, A. (2005). Examining the new influencers: A
self-presentation study of A-List blogs. Journalism & Mass Communication Quarterly,
82, 968–982. Turk, J. V. (2006). The professional bond: The report of the commission on public relations
education. Retrieved from www.commpred.org/_uploads/report2-full.pdf Waters, R. D., & Jamal, J. Y. (2011). Tweet, tweet, tweet: A content analysis of nonprofit
organizations’ Twitter updates. Public Relations Review, 37(3), 321–324. Whelan, G., Moon, J., & Grant, B. (2013). Corporations and citizenship arenas in the age of
social media. Journal of Business Ethics, 118, 777–790. Wiebe, G. D. (1951–1952). Merchandising commodities and citizenship on television. Public
Opinion Quarterly, 15(3): 679–691. Wigley, S., & Lewis, B. K. (2012). Rules of engagement: Practice what you tweet. Public
Relations Review, 38(1), 165–167. Wright, D. K., & Hinson, M. D. (2008). How blogs and social media are changing public
relations and the way it is practiced. Public Relations Journal, 2(2), 1–21. Wright, D. K., & Hinson, M. D. (2010). How new communications media are being used in
public relations: A longitudinal analysis. Public Relations Journal, 4, 3. Xifra, J., & Grua, F. (2010). Nanoblogging PR: The discourse on public relations on Twitter.
Public Relations Review, 36(2), 171–174.
Quarterly Review of Business Disciplines – Volume 1, Issue 1, May 2014
Page 88
HIT OR MISS?
THE IMPACT ON A PUBLIC FIGURE FROM ONE NEWS ITEM
Amiee J. Shelton, Roger Williams University [email protected]
Caitlin Fisher, Roger Williams University
ABSTRACT
This study investigates framing of news stories through the lens of the agenda setting function of mass media. Specifically, this intuitive study examined how the tone of one article and the time that has passed since exposure influences an individual’s perception of a public figure. A sample of college students (N=147) read an article about a public figure and was surveyed either two days or two weeks later. Findings show that the tone of the article affected respondent’s perception of the public figure. The individual’s level of ability to relate, sympathize and believe the public figure was a “good” person was affected by the passage of time. Additionally, this study investigated respondents’ perceptions of the effect media coverage has on public opinion. The results from this study underscore the impact even limited media, has on the public agenda.
Keywords: publicity, agenda setting, media impact
INTRODUCTION
“The entire study of mass communication is based on the premise that the media have significant effects” (McQuail, 1994, p. 327). To this end, numerous empirical studies have found that negative information is capable of significantly affecting consumers' beliefs and attitudes. In fact, Koenigs, Richey and Fortin (1975) found that a single item of negative information has the capability to neutralize five pieces of positive publicity. Other research has found negative information to be more enduring than positive information (Cusumano & Richey, 1970; Richins, 1984). Thus, the media has the power to determine attitudes. This study investigates framing of news stories through the lens of the agenda setting function of mass media. Specifically, this intuitive study examined how the tone of one article and the time that has passed since exposure influences an individual’s perception of a public figure.
REVIEW OF LITERATURE
The Agenda-Setting Theory, first investigated by Walter Lippman (1922), describes the phenomenon concerning media impact on public opinion. Even in 1922, far before the 24-hour news cycle and social media, Lippman was concerned that the media had the power to influence opinion and attitudes with images. McCombs and Shaw (1972) concluded that the mass media

Quarterly Review of Business Disciplines – Volume 1, Issue 1, May 2014
Page 89
exerted a significant influence on public awareness and concern of salient issues. This awareness and concern leads to attitude formation. The media has continued, even in current times, to have a powerful effect on public opinion.
Attitudes can be explicit and implicit. Explicit attitudes are those that people are consciously aware of and that clearly influence their behaviors and beliefs. Implicit attitudes are unconscious, but still have an effect on individual beliefs and behaviors. While mass media aids in the formation of attitudes pervasive in society, the assumption that media reflects reality is false. In fact, one of the basic assumptions underlying most research on Agenda-Setting is that the press and media do not reflect reality; they filter and shape it. Media draws public attention to certain topics, determined by editors. In this way, journalists and editors set public the public ‘agenda.’ Thus, the way in which the news is created, the frame in which the news is presented, is a choice made by the journalist. Therefore the mass media actively set the frames of reference that readers or viewers use to interpret and discuss public events. According to Neuman, Just, and Crigler (1992) "They give the story a 'spin,' . . . taking into account their organizational and modality constraints, professional judgments, and certain judgments about the audience" (p. 120). Frames influence the audience’s perception of news, but at same time, people's information processing and interpretation are influenced by pre-existing meaning structures or schemas (Scheufele, 1999).
Two concepts of framing must be considered for both presenting and comprehending news: media frames and individual frames. According to Gitlin (1980), taken together, the two types of frames while “largely unspoken and unacknowledged” they “organize the world both for journalists who report it and, in some important degree, for us who rely on their reports” (p. 7). Entman (1991) differentiated the two frames as “information-processing schemata” of individuals and as “attributes of the news itself” for media (p. 7). Tuchman (1978) offered a similar definition for media frames: “The news frame organizes everyday reality and the news frame is part and parcel of everyday reality … [it] is an essential feature of news” (p. 193). Media frames are also working routines for journalists. Here, frames allow journalists to quickly identify and classify information “to package it for efficient relay to their audiences” (Gitlin, 1980, p. 7). Media framing obviously includes the intent of the sender, but motives can be unconscious (Gamson, 1989). Therefore framing systematically affects how society comes to understand news and events (Price, Tewksbury, & Powers, 1995). Additionally, individuals attribute meaning to news stories through individual frames. These “mentally stored clusters of ideas guide individuals’ processing of information” (Entman, 1993, p. 53). Specifically, “short-term, issue-related frames of reference have significant impact on perceiving, organizing, and interpreting incoming information and on drawing inferences from that information” (Pan & Kosicki, 1993, p. 56). Thus, the basis of the Framing Theory is that the media focuses attention on certain events and then places them within a field of meaning. Individual framing takes place when decisions are formed and altered based on how information is presented to an individual (McCloy, Beaman, Frosch, & Goddard, 2010). Attitudes have been defined as relatively stable opinions containing a cognitive element and an emotional element. Attitudes are considered evaluations based on, or developed from, three
Quarterly Review of Business Disciplines – Volume 1, Issue 1, May 2014
Page 90
general classes of information: (1) affective or emotional information, (2) cognitive information, and/or (3) information concerning past behaviors or behavioral intentions (Zanna & Rempel, 1988). Further, evaluations or attitudes are viewed as influencing three modes of response, including affective, cognitive and behavioral responses. Because attitudes can be based on different sources of information, individuals can hold more than one attitude toward the attitude object depending upon whether the individual is led to focus on their feelings or beliefs (Zanna, 1990). The Elaboration Likelihood Model (ELM) accounts for the differences in persuasive impact produced by arguments that contain ample information and cogent reasons as compared to messages that rely on simplistic associations of negative and positive attributes to some object, action or situation (Cacioppo & Petty, 1979). There are two “routes” towards persuasion: central and peripheral. The key variable in this process is involvement; the extent to which an individual is willing and able to ‘think’ about the position advocated and its supporting materials. When people are motivated and able to think about the content of the message, elaboration is high. This involves scrutiny of persuasive communication to determine the arguments' merits. If the individual evaluates a message as reliable, well-constructed and convincing, it may be received favorably even if it contrasts with the receiver’s original position on the message. Elaboration involves cognitive processes such as evaluation, recall, critical judgment, and inferential judgment. When elaboration is high, the central persuasive route is likely to occur; conversely, the peripheral route is the likely result of low elaboration. Peripheral-route processes do not involve elaboration of the message through cognitive processing of an argument's merits. They rely on a message's environmental characteristics: the perceived credibility of the source, message presentation quality, and/or the source's attractiveness or a catchy slogan, when the argument is weak or lacks evidence. The peripheral route is a mental shortcut as such, which accepts (or rejects) a message based on external cues, not thought. It is used with complex messages or when targeting an immature audience. Several factors affect the likelihood that individuals will evaluate information systematically and elaborate the considerations carefully. For example, individuals tend to evaluate issues carefully, if the issue is personally relevant (Petty, Cacioppo, & Haugtvedt, 1992). The “need for cognition” represents an individual characteristic, representing an inclination to apply a “central” or systematic route. Hence, when individuals exhibit a need for cognition, they are more likely to be influenced by strong rather than weak arguments. Moreover, Caccioppo and Petty (1979), suggest that those with a higher need for cognition are more motivated to think, rather than just having an increased ability to do so. These findings imply that when individuals are given a certain message, their need for cognition and affect can direct them to act and depend on their emotions or cognitive beliefs so that they are more influenced and persuaded by the message. The Need for Affect is a separate motivational construct that captures the degree to which people enjoy experiencing strong emotions (Maio & Esses, 2001). Those Individuals who score high in the affect scale are more likely to view emotions as useful when making judgments and their emotional responses to information play a more important role in guiding the formation of attitudes (Huskinson & Haddock, 2006.
Quarterly Review of Business Disciplines – Volume 1, Issue 1, May 2014
Page 91
Finally, Fiske and Todorov (2011) found that individuals tend to overlook situational information when evaluating another’s actions, ignoring behaviors and relying instead on prior impressions to assess the person’s intentions. Therefore, media alone has not been found to singularly create attitudes. Instead, attitudes are formed from a combination of interpersonal communication and mass media.
Defining Public Figures
A public figure is legally defined as either a public official or any other person pervasively involved in public affairs, or according to the Unites States Supreme Court, someone who has "thrust themselves to the forefront of particular public controversies in order to influence the resolution of the issues involved" (1974, sect. III, para. 10). The term has significance in the United States regarding civil law, because it affects the resolution of certain types of lawsuits. These people are expected to tolerate more scrutiny than others, and consequently have more difficulties in winning cases surrounding the issues of defamation and privacy. The idea of public figure is closely related to the concept of celebrity. However, being a celebrity and being famous are two different concepts. A person can be famous for their role in history, or for their position, such as Queen Elizabeth, but that does not make them a celebrity. Empirical evidence finds that a famous person is turned into a celebrity from the narrative surrounding the public persona. The main reason people want to read about public personas in the tabloids or in People or Entertainment Weekly, or watch “Entertainment Tonight” or “Access Hollywood” is because they are interested in their stories. Many argue that America has become a society obsessed with celebrities, and this has profound impact on the business sector. Today, businesspeople are leveraging personal fame for economic benefit (Abril, 2011). Factors such as social media and round-the-clock financial news are forcing executives into the limelight. Additionally, businesspeople have been shedding their skins as private citizens and transforming themselves into public personas. No matter your business, a personal connection with the public is necessary to be successful. “Previously this rapport was mediated through advertising, but today that rapport is often mediated by the individual businesspeople themselves. Executives are encouraged to inject themselves into the debate in order to remain relevant…” (Abril, 2011, para. 6). These additions to the roster of quasi-celebrities have increased the amount of news stories disseminated about public figures. Theoretical or abstract analysis is not covered in most media because often there is not time to devote to the analysis. “Public figures are covered frequently in the news because it is in the public interest to know anything about these officials that might affect their wielding of power or their discharge of the public trust” (Hodge 1994, p. 197). Lastly, Lukeman (1991) found that the simple presence of a celebrity in news coverage increases the odds for higher recall. While the impact of mass media is well documented, we wanted to explore how much impact one print-news story has on public opinion regarding a public figure. To begin with, we chose a public figure, not a celebrity. This public figure would be a CEO of a major corporation, one that presumably would wield power and influence over the marketplace. Understanding that tone/framing by the media plays a large role in the attitudes cultivated, we had to manipulate the
Quarterly Review of Business Disciplines – Volume 1, Issue 1, May 2014
Page 92
tone of each story in order to look at the effect on public opinion. Our Study
In our study we investigated the effects of exposure to a single news article about a public figure on public opinion. We were particularly interested in if the tone of the single article would affect attitude, and if that attitude would persevere. In addition, we tested to what extent the media exposure influenced perceptions of the public figure, and what respondents remembered the most about the media coverage. Phase one of this study provided participating university instructors a short script to read simply acknowledging that the article was intriguing, and that the students should read it. The instructors then proceeded to distribute one of three articles for students to read. An equal number of undergraduates (N = 145) read one of three news articles describing a public figure. We varied the framing of the article to be slanted positive, neutral or negative. Two days or two weeks later, they read a short biography of the public figure, and answered questions concerning the likeably and reputation of the public figure. In this second phase, student researchers administered the materials consisting of informed consent, pre-test measures for affect and cognition, a biography, and the post-article questionnaire. The pre-test questionnaire was structured by the Need for Affect and Cognition Scale to evaluate participant’s cognition and level of need for information in determining their opinion. The post-article questionnaire included scaled measures to quantify previous knowledge of the public figure, current perceptions, memory of article read, and basic demographic information. Additionally, the post-article questionnaire requested that participants recall what they remembered about the featured public figure through an open-ended format. Words were coded into the following categories: positive, negative, balanced (neutral). Participants
Our study’s respondent’s ages ranged from 18-23 years old, with the mean age of 20. Courses were mainly affiliated with psychology and communications. The majority of participants had no previous knowledge of our public figure, with only five participants indicating they had heard her name prior to the study. Factor Analysis
The factorability of nine post article questionnaire items was examined. These items were Likert scale statements that were used to determine the need for individuals affect and cognition when forming an opinion. Several well recognized criteria for the factorability of a correlation were used. Firstly, it was observed that many of the nine items correlated at least .3 with at least one other item, suggesting reasonable factorability. Secondly, the Kaiser-Meyer-Olkin measure of sampling adequacy was .61, above the commonly recommended value of .6. Thirdly, Bartlett’s Test of Sphericity reached statistical significance supporting the factorability of the correlation matrix. Given these overall indicators, factor analysis was deemed to be suitable with all nine items.
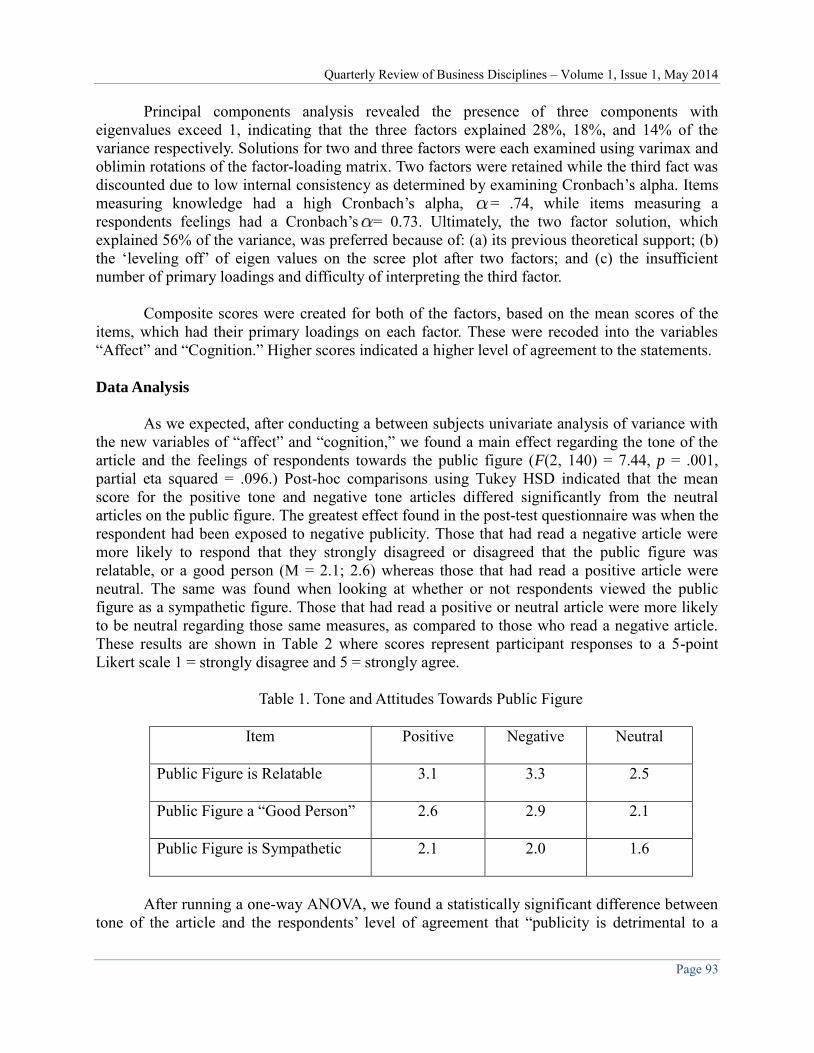
Quarterly Review of Business Disciplines – Volume 1, Issue 1, May 2014
Page 93
Principal components analysis revealed the presence of three components with eigenvalues exceed 1, indicating that the three factors explained 28%, 18%, and 14% of the variance respectively. Solutions for two and three factors were each examined using varimax and oblimin rotations of the factor-loading matrix. Two factors were retained while the third fact was discounted due to low internal consistency as determined by examining Cronbach’s alpha. Items measuring knowledge had a high Cronbach’s alpha, = .74, while items measuring a respondents feelings had a Cronbach’s = 0.73. Ultimately, the two factor solution, which explained 56% of the variance, was preferred because of: (a) its previous theoretical support; (b) the ‘leveling off’ of eigen values on the scree plot after two factors; and (c) the insufficient number of primary loadings and difficulty of interpreting the third factor. Composite scores were created for both of the factors, based on the mean scores of the items, which had their primary loadings on each factor. These were recoded into the variables “Affect” and “Cognition.” Higher scores indicated a higher level of agreement to the statements. Data Analysis
As we expected, after conducting a between subjects univariate analysis of variance with the new variables of “affect” and “cognition,” we found a main effect regarding the tone of the article and the feelings of respondents towards the public figure (F(2, 140) = 7.44, p = .001, partial eta squared = .096.) Post-hoc comparisons using Tukey HSD indicated that the mean score for the positive tone and negative tone articles differed significantly from the neutral articles on the public figure. The greatest effect found in the post-test questionnaire was when the respondent had been exposed to negative publicity. Those that had read a negative article were more likely to respond that they strongly disagreed or disagreed that the public figure was relatable, or a good person (M = 2.1; 2.6) whereas those that had read a positive article were neutral. The same was found when looking at whether or not respondents viewed the public figure as a sympathetic figure. Those that had read a positive or neutral article were more likely to be neutral regarding those same measures, as compared to those who read a negative article. These results are shown in Table 2 where scores represent participant responses to a 5-point Likert scale 1 = strongly disagree and 5 = strongly agree.
Table 1. Tone and Attitudes Towards Public Figure
Item Positive Negative Neutral
Public Figure is Relatable 3.1 3.3 2.5
Public Figure a “Good Person” 2.6 2.9 2.1
Public Figure is Sympathetic 2.1 2.0 1.6
After running a one-way ANOVA, we found a statistically significant difference between tone of the article and the respondents’ level of agreement that “publicity is detrimental to a
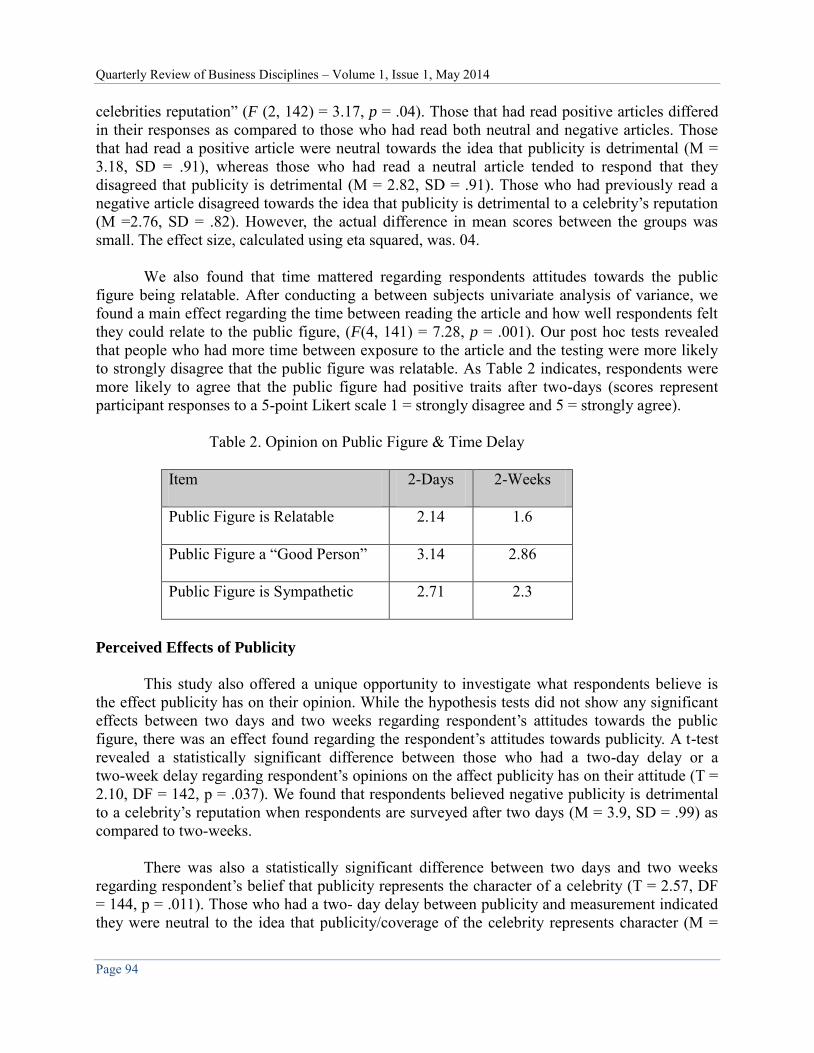
Quarterly Review of Business Disciplines – Volume 1, Issue 1, May 2014
Page 94
celebrities reputation” (F (2, 142) = 3.17, p = .04). Those that had read positive articles differed in their responses as compared to those who had read both neutral and negative articles. Those that had read a positive article were neutral towards the idea that publicity is detrimental (M = 3.18, SD = .91), whereas those who had read a neutral article tended to respond that they disagreed that publicity is detrimental (M = 2.82, SD = .91). Those who had previously read a negative article disagreed towards the idea that publicity is detrimental to a celebrity’s reputation (M =2.76, SD = .82). However, the actual difference in mean scores between the groups was small. The effect size, calculated using eta squared, was. 04. We also found that time mattered regarding respondents attitudes towards the public figure being relatable. After conducting a between subjects univariate analysis of variance, we found a main effect regarding the time between reading the article and how well respondents felt they could relate to the public figure, (F(4, 141) = 7.28, p = .001). Our post hoc tests revealed that people who had more time between exposure to the article and the testing were more likely to strongly disagree that the public figure was relatable. As Table 2 indicates, respondents were more likely to agree that the public figure had positive traits after two-days (scores represent participant responses to a 5-point Likert scale 1 = strongly disagree and 5 = strongly agree).
Table 2. Opinion on Public Figure & Time Delay
Item 2-Days 2-Weeks
Public Figure is Relatable 2.14 1.6
Public Figure a “Good Person” 3.14 2.86
Public Figure is Sympathetic 2.71 2.3
Perceived Effects of Publicity
This study also offered a unique opportunity to investigate what respondents believe is the effect publicity has on their opinion. While the hypothesis tests did not show any significant effects between two days and two weeks regarding respondent’s attitudes towards the public figure, there was an effect found regarding the respondent’s attitudes towards publicity. A t-test revealed a statistically significant difference between those who had a two-day delay or a two-week delay regarding respondent’s opinions on the affect publicity has on their attitude (T = 2.10, DF = 142, p = .037). We found that respondents believed negative publicity is detrimental to a celebrity’s reputation when respondents are surveyed after two days (M = 3.9, SD = .99) as compared to two-weeks. There was also a statistically significant difference between two days and two weeks regarding respondent’s belief that publicity represents the character of a celebrity (T = 2.57, DF = 144, p = .011). Those who had a two- day delay between publicity and measurement indicated they were neutral to the idea that publicity/coverage of the celebrity represents character (M =
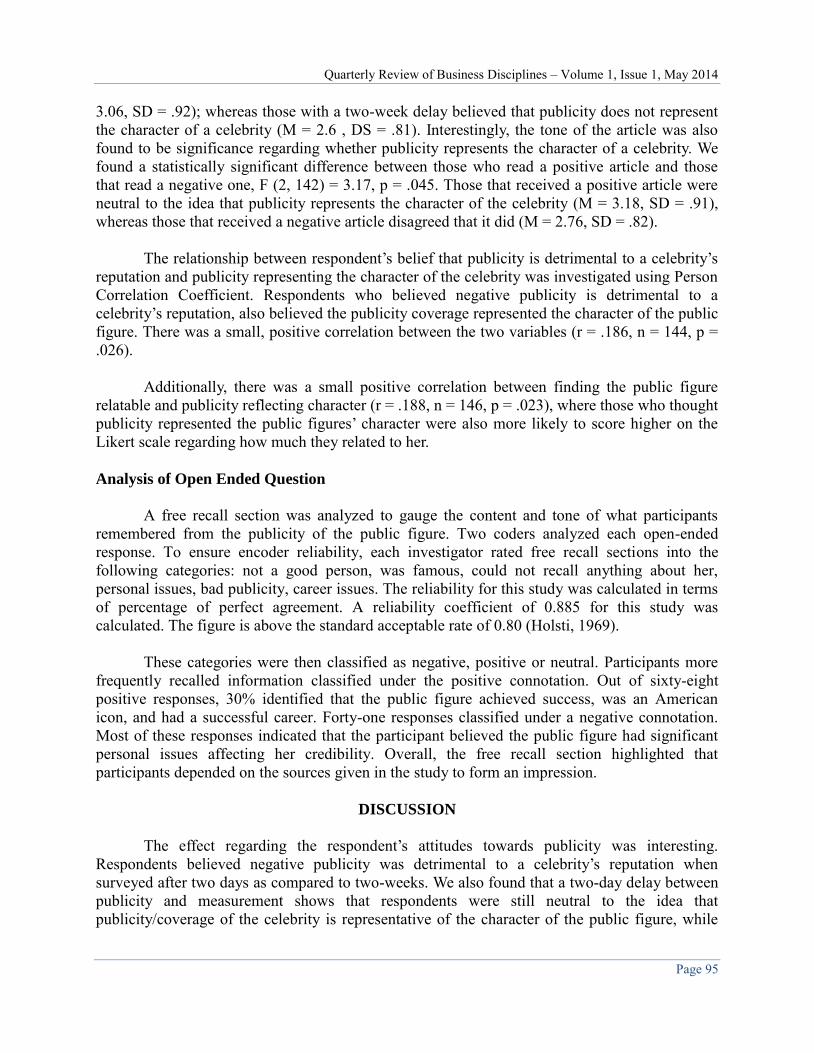
Quarterly Review of Business Disciplines – Volume 1, Issue 1, May 2014
Page 95
3.06, SD = .92); whereas those with a two-week delay believed that publicity does not represent the character of a celebrity (M = 2.6 , DS = .81). Interestingly, the tone of the article was also found to be significance regarding whether publicity represents the character of a celebrity. We found a statistically significant difference between those who read a positive article and those that read a negative one, F (2, 142) = 3.17, p = .045. Those that received a positive article were neutral to the idea that publicity represents the character of the celebrity (M = 3.18, SD = .91), whereas those that received a negative article disagreed that it did (M = 2.76, SD = .82). The relationship between respondent’s belief that publicity is detrimental to a celebrity’s reputation and publicity representing the character of the celebrity was investigated using Person Correlation Coefficient. Respondents who believed negative publicity is detrimental to a celebrity’s reputation, also believed the publicity coverage represented the character of the public figure. There was a small, positive correlation between the two variables (r = .186, n = 144, p = .026). Additionally, there was a small positive correlation between finding the public figure relatable and publicity reflecting character (r = .188, n = 146, p = .023), where those who thought publicity represented the public figures’ character were also more likely to score higher on the Likert scale regarding how much they related to her. Analysis of Open Ended Question
A free recall section was analyzed to gauge the content and tone of what participants remembered from the publicity of the public figure. Two coders analyzed each open-ended response. To ensure encoder reliability, each investigator rated free recall sections into the following categories: not a good person, was famous, could not recall anything about her, personal issues, bad publicity, career issues. The reliability for this study was calculated in terms of percentage of perfect agreement. A reliability coefficient of 0.885 for this study was calculated. The figure is above the standard acceptable rate of 0.80 (Holsti, 1969). These categories were then classified as negative, positive or neutral. Participants more frequently recalled information classified under the positive connotation. Out of sixty-eight positive responses, 30% identified that the public figure achieved success, was an American icon, and had a successful career. Forty-one responses classified under a negative connotation. Most of these responses indicated that the participant believed the public figure had significant personal issues affecting her credibility. Overall, the free recall section highlighted that participants depended on the sources given in the study to form an impression.
DISCUSSION
The effect regarding the respondent’s attitudes towards publicity was interesting. Respondents believed negative publicity was detrimental to a celebrity’s reputation when surveyed after two days as compared to two-weeks. We also found that a two-day delay between publicity and measurement shows that respondents were still neutral to the idea that publicity/coverage of the celebrity is representative of the character of the public figure, while
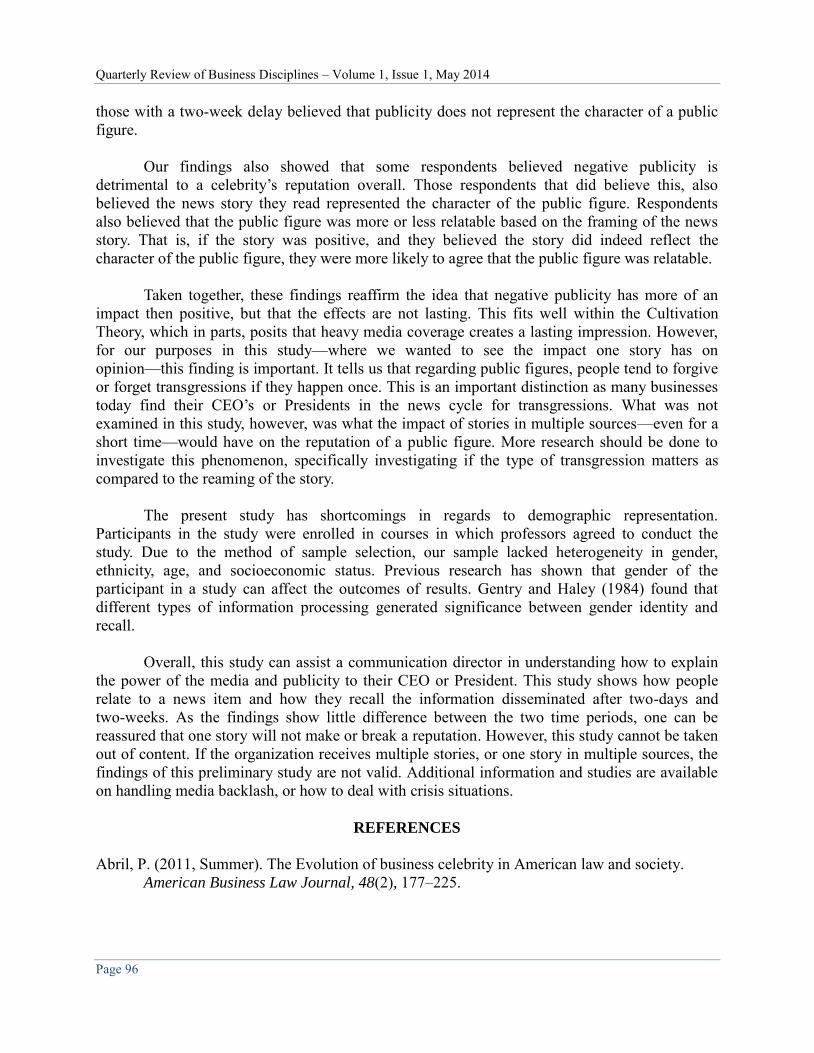
Quarterly Review of Business Disciplines – Volume 1, Issue 1, May 2014
Page 96
those with a two-week delay believed that publicity does not represent the character of a public figure. Our findings also showed that some respondents believed negative publicity is detrimental to a celebrity’s reputation overall. Those respondents that did believe this, also believed the news story they read represented the character of the public figure. Respondents also believed that the public figure was more or less relatable based on the framing of the news story. That is, if the story was positive, and they believed the story did indeed reflect the character of the public figure, they were more likely to agree that the public figure was relatable. Taken together, these findings reaffirm the idea that negative publicity has more of an impact then positive, but that the effects are not lasting. This fits well within the Cultivation Theory, which in parts, posits that heavy media coverage creates a lasting impression. However, for our purposes in this study—where we wanted to see the impact one story has on opinion—this finding is important. It tells us that regarding public figures, people tend to forgive or forget transgressions if they happen once. This is an important distinction as many businesses today find their CEO’s or Presidents in the news cycle for transgressions. What was not examined in this study, however, was what the impact of stories in multiple sources—even for a short time—would have on the reputation of a public figure. More research should be done to investigate this phenomenon, specifically investigating if the type of transgression matters as compared to the reaming of the story. The present study has shortcomings in regards to demographic representation. Participants in the study were enrolled in courses in which professors agreed to conduct the study. Due to the method of sample selection, our sample lacked heterogeneity in gender, ethnicity, age, and socioeconomic status. Previous research has shown that gender of the participant in a study can affect the outcomes of results. Gentry and Haley (1984) found that different types of information processing generated significance between gender identity and recall. Overall, this study can assist a communication director in understanding how to explain the power of the media and publicity to their CEO or President. This study shows how people relate to a news item and how they recall the information disseminated after two-days and two-weeks. As the findings show little difference between the two time periods, one can be reassured that one story will not make or break a reputation. However, this study cannot be taken out of content. If the organization receives multiple stories, or one story in multiple sources, the findings of this preliminary study are not valid. Additional information and studies are available on handling media backlash, or how to deal with crisis situations.
REFERENCES
Abril, P. (2011, Summer). The Evolution of business celebrity in American law and society. American Business Law Journal, 48(2), 177–225.
Quarterly Review of Business Disciplines – Volume 1, Issue 1, May 2014
Page 97
Cusumano, D. R., & Richey, M. H. (1970). A negative Salience in impressions of character: Effects of extremeness of stimulus information, Psychometric Science, 20, 81-83.
Cacioppo, J. T., & Petty, R. E. (1979). Effects of message repetition and position on cognitive
response, recall and persuasion. Journal of Figure and Social Psychology, 27, 97-109. Entman, R. M. (1993). Framing: Towards clarification of a fractured paradigm. Journal of
Communication, 43(4), 51–58. Entman, R. M. (1991). Framing U.S. coverage of international news: Contrasts in narratives of the
KAL and Iran air incidents. Journal of Communication, 41(4), 6–27. Fiske, S. T., & Todorov, A. T. (2011). Impression formation: A focus on others’ intents. In D. L.
Ames (Ed.), The Oxford Handbook of Social Neuroscience (pp. 419-433). New York: Oxford University Press.
Gamson, W. A. (1989). News as framing: comments on Graber. American Behavioral Scientist,
33, 157–166. Gentry, J., & Haley, D. (1984). Gender schema theory as a predictor of ad recall. In Thomas C.
Kinnear (Ed.), Advances in Consumer Research, (Vol. 11; pp. 259-264). Ann Arbor, MI: Association for Consumer Research.
Gitlin, T. (1980). The Whole World Is Watching: Mass Media In The Making & Unmaking of The
New Left. Berkeley: University of California Press. Hodge, L. (1994).The journalist and privacy. Journal of Mass Media Ethics, 9,197–212.
Holsti, O. (1969). Content Analysis for the Social Sciences and Humanities. Menlo Park, CA: Addison Wesley.
Huskinson, T., & Haddock G. (2006). Individual differences in attitude structure and the
accessibility of the affective and cognitive components of attitude. Social Cognition, 24(4), 453-468.
Koenigs, R., Richey M., & Fortin R. (1975). Negative salience in impressions of character:
effects of unequal proportions of positive and negative information. Journal of Social
Psychology, 12(97), 233-41. Lippman, W. (1922). Public Opinion. New York: Macmillan. Lukeman, G. (1991), Analysis shows new way to think about TV recall scores, Marketing News,
25(8), 24.

Quarterly Review of Business Disciplines – Volume 1, Issue 1, May 2014
Page 98
Maio G. R., & Esses V.M. (2001, August). The need for affect: individual differences in the motivation to approach or avoid emotions. Journal of Personality, 69(4), 583-615.
McCloy, R. A., Beaman, C. P., Frosch, C. A., & Goddard, K. (2010) Fast and frugal framing
effects? Journal of Experimental Psychology: Learning, Memory & Cognition, 36(4), 1043-1052.
McCombs, M., & Shaw, D. (1972 ). The Agenda-setting function of mass media. Public Opinion
Quarterly, 36(2), 176-187. McQuail, D. (1994). Mass Communication Theory: An Introduction. Thousand Oaks, CA: Sage. Neuman, R.W., Just, M. R., & Crigler, A. N. (1992). Common Knowledge: News and the
Construction of Political Meaning. Chicago: University of Chicago Press. Pan, Z., & Kosicki, G. M. (1993). Framing analysis: An approach to news discourse. Political
Communication, 10, 55–75. Petty, R. E., Cacioppo, J. T., & Haugtvedt, C. (1979). Issue involvement can increase or decrease
persuasion by enhancing message-relevant cognitive responses. Journal of Personality and
Social Psychology, 37, 1915-1926. Petty, R. E., Cacioppo, J. T., & Haugtvedt, C. (1992). Involvement and persuasion: An
appreciative look at the Sherifs' contribution to the study of self-relevance and attitude change. In D. Granberg, & G. Sarup (Eds.), A Social judgment and intergroup relations:
Essays in honor of Muzifer Sherif (147-175). New York: Springer-Verlag. Price, V., Tewksbury, D., & Powers, E. (1997). Switching trains of thought: The impact of news
frames on readers’ cognitive responses. Communication Research, 24 , 481–506. Richins, M. L. (1984), Word of Mouth Communication as Negative Information: Advances in
Consumer Research, Thomas C. Kinnear, (Ed.). Provo UT: Association for Consumer Research, 11, 697-702.
Scheufele, D. A. (1999). Framing as a Theory of Media Effects. Journal of Communication,
49(1), 103-122. Tuchman, G. (1978). Making news: A study in the construction of reality. New York: Free Press. Zanna, M. P. (1990).Attitude Function: Is It Related to Attitude Structure? Advances in Consumer
Research, 17, 98-100. Zanna, M. P., & Rempel, J. K. (1988). Attitudes: A new look at an old concept. In D. Bar-Tal & A.
Kruglanski (Eds.). The social psychology of knowledge. New York: Cambridge University Press.

Quarterly Review of Business Disciplines – Volume 1, Issue 1, May 2014
Page 99
KIN ALTRUISM, PSYCHOLOGICAL CONTRACT AND COMMITMENT IN
IMMIGRANT BUSINESSES: SOME THEORETICAL PROPOSITIONS
Chulguen (Charlie) Yang, Southern Connecticut State University [email protected]
ABSTRACT
This paper explores underlying psychological mechanisms of employment relations in East Asian immigrant businesses in the United States. Positive functions of kinship and the impacts of kin altruism on psychological contract and commitment are conceptualized from a theoretical perspective of kin selection. In addition, the transmission of Confucian cultural values from home countries to the host country and their influences on employment relations in East Asian immigrant businesses are explicated from a sociocultural evolutionary perspective. Honoring filial piety in a patriarchal family structure is a traditional Confucian value, and such a cultural idea is understood as a unit of cultural transmission. This paper hence proposes the thesis that paternalistic Confucianism as a system of cultural values tends to reinforce biologically evolved kin altruism among East Asian immigrant entrepreneurs while helping them maximize their genetic as well as economic payoff. Several propositions are also presented for future empirical studies.
Keywords: Immigrant business, kin altruism, psychological contract
INTRODUCTION
For the past two decades, psychological contract has been refined as a measurable
construct for unspoken mutual expectations between employer and employee (Rousseau, 2004; Sels, Janssens, & Van den Brande, 2004; Shore & Coyle-Shapiro, 2003). Unfortunately, far less research exists on the formation of psychological contract in unusual organizational settings than on the consequences associated with it (Rousseau, 2001). For instance, there is a gap in the literature on the characteristics of psychological contract in small and medium-sized family enterprises where blood and matrimonial ties play such a critical role (Levinson, 1983).
In a society where democratic ethos is predominant, family ties in the workplace are often
associated with nepotism and perceived unfavorably (Bellow, 2003). It is therefore not surprising that kinship with its effects on the formation and maintenance of psychological contract in small and medium-sized family businesses has rarely received much attention. Hence, little is actually known about the underlying psychological characteristics of employee - employer relationships, where family relatives control a large proportion of ownership and workforce.
In this respect, psychological contract and commitment in East Asian immigrant family businesses in advanced Western economies such as the U.S. and the U.K. are intriguing topics.
Quarterly Review of Business Disciplines – Volume 1, Issue 1, May 2014
Page 100
East Asian ethnic groups in advanced economies are rarely homogeneous, yet they share some commonalities; for instance, the majority of East Asian enterprises are embedded in ethnic communities and highly dependent on kith and kin social networks for procuring capital and labor resources (Sanders & Nee, 1996). About 64% of Chinese-owned, 73% of Japanese-owned, and 63% of Korean-owned firms in the United States are without paid employees (U.S. Census Bureau, 2001). In 2007, 313,995 Chinese-owned firms in the United States had no paid employees, an increase of 59.4% up from 2002, while 85,537 Japanese-owned firms and 121,041 Korean-owned firms had no paid employees, an increase of 32.1% and 20.3% up from 2002, respectively (U.S. Census Bureau, 2007). From a market rationality perspective, labor utilization practices of East Asian immigrant business owners are irrational and even exploitative (Light & Bonacich, 1988). The purpose of this paper is to therefore explore unique employment practices of East Asian immigrant business owners and the underlying psychological mechanisms that characterize their psychological contract with employees. From a coevolutionary perspective (i.e., biological and sociocultural), it is proposed that (a) kinship-based altruism is the biological basis of employment relationship between East Asian immigrant business owners/employers and their employees and (b) transmitted Confucian cultural values tend to reinforce the biologically built-in kin altruism and its extension to coethnics in immigrant business communities. Several propositions derived from the coevolutionary framework are also presented for future empirical studies.
PSYCHOLGOCIAL CONTRACT: A BRIEF OVERVIEW
Early researchers defined psychological contract as implicit mutual expectations and agreements between employee and employer (Argyris, 1962; Levinson, Price, Munden, Mandl, & Solley, 1962). Rousseau (2004) further refined the construct as “beliefs, based upon promises expressed or implied, regarding an exchange agreement between an individual and, in organizations, the employing firm and its agents” (p. 120). Psychological contract is thus mutual, subjective, and reciprocal because it is based on the engaging parties’ perception or interpretations of the explicit and implied agreements in a social exchange relationship (Rousseau, 1995). Although general patterns of a given psychological contract are likely to vary depending on multiple factors (e.g., personal values, nature of the work, terms of employment contract, etc.), the major function of psychological contract is to represent mutual obligations and entitlements between two or more parties as a schema of employment relations (Rousseau, 2001; Rousseau & Schalk, 2000). A given psychological contract can be further positioned on a transactional-relational continuum of social exchange relationships (Rousseau, 1995). While a transactional psychological contract is a bare exchange of work for compensation and is prone to be a short-term exchange based on strict reciprocity (i.e., tit-for-tat), relational contract is based on a long-term relationship and is often strengthened by mutual trust and loyalty (Rousseau, 2004; Rousseau & Schalk, 2000). Depending on the type of given psychological contract, an actor’s commitment to the other party will be affected (Kwon, 2001; Sangkaman, 1995): for instance, when an employee maintains a relatively stable relational psychological contract with the agent of an organization, there is a
Quarterly Review of Business Disciplines – Volume 1, Issue 1, May 2014
Page 101
higher probability that the former becomes more emotionally identified with and morally committed to the organization. Cross-cultural scholars and researchers have persistently argued that cross- cultural differences in values and practices indeed have significant impacts on the employment practices (Hofstede, 1983, 1993, 1997; Kao, Sinha, & Wilpert, 1999; Perkins, 2000; Redding, Norman, & Schlander, 1994; Triandis, 1994). For example, it is well known that Asian cultural values, including paternal collectivism and Confucianism emphasizing the “appropriate” codes of conduct according to one’s position in a social hierarchy, have strong impacts on social dynamics of East Asians in organizational settings (Hofstede & Bond, 1988; Markus & Kitayama, 1991; Nisbett, 2003; Triandis,1995).
Unfortunately, little is known about the mechanism by which kinship influences the formation and maintenance of psychological contract in Asian immigrant enterprises. There exist few studies on the plausible impacts of Asian cultural values on employment relations in small and medium-sized Asian immigrant enterprises in advanced multiethnic societies such as the U.S. and the U.K. The current situation might be attributable to the lack of a useful theoretical framework that deepens our understanding of kinship psychology and its impacts on psychological contract and commitment in immigrant enterprises.
INCLUSIVE FITNESS THEORY: A THEORETICAL FRAMEWORK
The human mind, according to a majority of evolutionary psychologists, consists of massive evolved algorithms (i.e., psychological adaptations) sculpted by natural selection (Buss, 2008; Cosmides, Tooby, & Barkow, 1992; Gaulin & McBurney, 2001).
A psychological adaptation is defined as “an inherited and reliably developing characteristic that came into existence thorough natural selection” (Buss, 2008, p. 39) due to its contribution to our distant ancestors’ survival and reproductive fitness under ancient environmental conditions. As in biological evolution, which provided us a gene pool that predisposes us to behave in certain ways (Van den Berghe, 1990), natural selection endowed our human mind with massive psychological mechanisms that are functional in terms of survival and reproduction (Buss, 2008; Cosmides & Tooby, 1992; Gaulin & McBurney, 2001). Evolution of hominid sociality, for instance, corresponds with underlying psychological mechanisms that were adaptive for our ancestors to solve various social dilemmas such as finding suitable mates and forging social alliances to outcompete rivals in interpersonal and intergroup conflicts (Campbell, 1985; Cosmides & Tooby, 1992; Van den Berghe, 1990).
It was William Hamilton who proposed the elegant mathematical model of inclusive fitness theory in order to explain the existence of altruism among predominantly selfish individuals (Hamilton, 1964). According to the gene’s eye view of natural selection, altruism can evolve as long as the benefit (“b”) multiplied by a coefficient of genetic relatedness (“r”) is larger than the cost (“c”) (i.e., r x b > c), when benefit and cost are measured in reproductive currencies (Axelrod & Hamilton, 1984; Hamilton, 1964). In other words, people will forsake their own reproductive interests and behave altruistically for someone who is biologically related to them, as

Quarterly Review of Business Disciplines – Volume 1, Issue 1, May 2014
Page 102
long as the condition is satisfied. For a sexually reproducing diploid species like Homo sapiens, a coefficient of genetic relatedness (“r”) is .50 for parent and offspring, .50 for full siblings, .25 for half siblings, .25 for aunt/uncle and nephew/niece, .125 for first cousins (Daly, Salmon, & Wilson, 1997). The key theoretical implication is that people in general do not help others randomly, and particularly not in a life-threatening situation. The evolved kin selection mechanism favors altruism that is selectively aimed at close relatives (Burnstein, Crandall, & Kitayama, 1994; Daly et al., 1997). Several empirical studies have confirmed the prediction that we indeed do have a tendency to help others selectively according to their genetic similarities to us, preferring our close kin over distant kin or non-kin (Burnstein et al., 1994; Essorck-Vitale & McGuire, 1985; Smith, Kish, & Crawford, 1987). Evolutionary Bases of Social Contract: Kin and Reciprocal Altruism
Evolutionary speaking, familial solidarity based on kinship is selected against group solidarity larger than family lines mainly because our hominid ancestors lived much of their time in small hunter-gatherer bands until some 10,000 years ago (Campbell, 1985; Dawkins, 1990). Kin altruism, the evolved psychological tendency to prefer kin to non-kin strangers, is not only an emergent outgrowth of our biological evolution, it is also a genetically rational and evolutionary stable strategy to promote inclusive fitness in a predominantly non-cooperative world (Axelrod & Hamilton, 1984; Dawkins, 1990). Firmly rooted in our biological make-up, kin altruism played a significant role in the evolution of early hominid sociality (Axelrod & Hamilton, 1984). In social exchange relationships, for example, engaging with someone who is genetically or matrimonially related is perceived to be safer compared to engaging with those who are unrelated, as the latter invites a higher chance of being manipulated or cheated (Cosmides & Tooby, 1997). As the social world of our hominid ancestors extended beyond the small circle of family ties into clans and tribes, there must have been obvious selection pressures to deal with social exchanges among those who did not have common ancestors (Campbell, 1975; Van den Berghe, 1990). Group solidarity extending beyond family lines has often been selected against, but through sexual reproduction, a sense of obligation to reciprocate with affinal kin (i.e., in-laws) must have gained enforcing power (Campbell, 1975; Van den Berghe, 1990). Affinal kinship based on a matrimonial relationship with a member of the neighboring clan or tribe is therefore a blind evolutionary mechanism for the evolution of reciprocal altruism with non-kin strangers (Axelrod & Hamilton, 1984; Trivers, 1971; Van den Berghe, 1990). As reciprocal altruism is an exchange of mutually beneficial favors (i.e., “I’ll scratch your back if you scratch mine”), it is essentially the pursuit of calculated self-interest in the expectation that the good turn will be paid back at some time in the future (Cosmides & Tooby, 1992, 1997). Reciprocal altruism must have evolved much later than kin altruism in hominid evolution for it demands further development of the hominid brain and the cognitive capacity to remember previous social exchanges. In addition, for “tit-for-tat” reciprocity to have emerged in a non-kin small group, there must have existed an underlying psychological adaptation that facilitated an actor to detect a cheater in riskier transactions (Cosmides & Tooby, 1997; Trivers, 1971). Yet, once the cognitive threshold for reciprocity was reached, reciprocal altruism became a significant psychological adaptation for the evolution of social contract among non-kin strangers (Bailey,

Quarterly Review of Business Disciplines – Volume 1, Issue 1, May 2014
Page 103
2000; Cosmides & Tooby, 1992; Skyrms, 1996). Reciprocity demands ongoing commitment to a mutual agreement and is easily defected, a psychological algorithm to detect a cheater will become more easily activated when people engage in a social exchange with non-kin strangers (Cosmides & Tooby, 1992). Confucianism from a Sociocultural Evolutionary Perspective
There have been various attempts to apply a universal Darwinian process of blind variation and selective retention to human culture (e.g., Aunger, 2000; Dawkins, 1990; Laland & Brown, 2002; Plotkin, 2000). For instance, Dawkins (1990) proposed that cultural information is stored in human brains as a transmittable “replicator” (a.k.a. meme) while biological information is written in the human DNA (Dawkins, 1990). Thus, it has been claimed that the logic of human cultural evolution is also Darwinian in its basic structure (Aunger, 2000; Blackmore, 2000). From the memetic perspective, it is plausible to consider Confucianism as a system of memes. In other words, Confucian cultural values such as filial piety and loyalty to senior family members in the cardinal “five relationships” (i.e., those between ruler and minister; father and son; husband and wife; brothers; and friends) (Waley, 1964) are units of cultural information that have been selectively retained for the past two and half millennia. Confucianism as a system of interrelated cultural values can be considered a super-meme that resides in the brains of people who are born and raised in Confucian cultural milieus. In addition, traditional Confucian values provide not only implicit cultural norms with a strong moral sanctioning power in East Asian societies, but also a socio-political ideology justifying the power structure of a given society (Lingle, 1996). As Confucian moralistic maxims tend to be applied beyond the small circle of a household, for many East Asians, good leadership is often identified with a benevolent father figure (Zakaria, 1994). Considering the nature of Confucian cultural baggage, it is not surprising that a majority of first generation East Asian immigrants in the United States - even second generation East Asian Americans, considered “quintessential Americans” - often adhere to transmitted traditional Confucian values such as supporting their elderly parents (Zhou, 2004).
KIN ALTRUISM, PSYCHOLOGICAL CONTACT, AND COMMITMENT:
A THEORETICAL INTEGRATION AND EMPIRICAL PROPOSITIONS
The inclusive fitness theory has several theoretical implications for employment relations in East Asian immigrant businesses. First of all, it is very likely that, depending on the degree of genetic relationship (i.e., the degree of kinship, “r”), both employers and employees in employment relationships will apply two qualitatively different psychological algorithms (i.e., kin and reciprocal altruism) when they initiate forming mutual psychological contract. East Asian immigrant business owners and their relatives, for instance, will be less affected by the short-term transactional mindset when they engage in employment relationship. Therefore, kin altruism will be the predominant psychological mechanism activated under the aforementioned employment conditions.

Quarterly Review of Business Disciplines – Volume 1, Issue 1, May 2014
Page 104
Proposition 1a: Depending on the status of kinship, both East Asian employers and
employees tend to apply qualitatively different social exchange algorithms to construct and
interpret a psychological contract.
Proposition 1b: As the degree of kinship (“r”) increases between genetically related East
Asian employers and employees, both parties will be more likely to maintain a long-term
relational psychological contract.
It is also expected that qualitatively different psychological algorithms are prone to be linked with distinct motivational processes that affect commitment differently. Previous studies on organizational commitment have claimed that affective (i.e., emotional attachment and identification with an organization) and normative (i.e., a sense of moral duty to remain in an organization) dimensions of organizational commitment are conceptually and empirically distinct from a continuance dimension (i.e., staying in an organization due to the sunk cost from past interactions) (e.g., Allen & Meyer, 1990). It is also reported that normative commitment and instrumental attachment to an organization are two qualitatively different commitment orientations (e.g., Heshizer, Martin, & Wiener, 1991; Wiener, 1982). Therefore, psychological algorithms activated in different employment relationships will have different impacts on the nature of the ensuing commitment.
Proposition 2: Biologically related employees tend to be more emotionally and morally
committed to their employers and businesses in East Asian immigrant businesses.
It will be also the case that non-kin employees are more likely to experience negative consequences resulting from the breach of mutual expectations and agreements with East Asian business owners/managers. Broken promises and breached mutual expectations will lead to lowered levels of morale and commitment and increasing numbers of employees’ exit, voice/complaints, and neglect behaviors (Turnley & Feldman, 1999). However, given the shared genetic interests between biologically related employers and employees, kin altruism will probably buffer some negative consequences of unfulfilled promises. In other words, kin altruism is expected to override the activation of a short-term tit-for-tat reciprocity which is a predominant strategy used in social exchanges between non-kin employers and employees (Skyrms, 1996).
Proposition 3: East Asian employers and employees bound by kinship will be less
likely to apply the rule of strict reciprocity and tend to be more lenient toward the
incidence of breached psychological contract.
Furthermore, given the Confucian cultural emphasis on “harmony” in the paternalistic family structure (Triandis, 1995), implicit cultural norms governing the “appropriate” parent-children relationship must have gained moral impetus in East Asian immigrant communities. It is undeniable that Confucian cultural ideals of the right parent-children relationship have contributed to the fast economic adaptation of first generation immigrant parents, which is seemingly impossible without unpaid or under-paid family labor (Light & Bonacich, 1988). Hence, Confucian cultural traditions of honoring the family membership or

Quarterly Review of Business Disciplines – Volume 1, Issue 1, May 2014
Page 105
household (i.e., jia for Chinese, ie for Japanese, and ga for Korean) will intensify the in-group (family) versus out-group (non-family) social categorization.
Proposition 4: The Confucian cultural emphasis on the genealogical identity of a
household will reinforce the social categorization adopted by East Asian employers in
terms of in-group family members and out-group non-family strangers.
DISCUSSION
It has been about a decade since a small group of scholars and researchers have applied Darwinian evolutionary perspectives to the fields of management and organization studies (e.g., Aldrich, 2001; Colarelli, 1998, 2003; Lawrence & Nohria, 2002; Nicholson, 1997, 2000). In immigrant entrepreneurship literature, it is a well-known fact that kith and kin social networks are the primary source of immigrant entrepreneurs’ social capital (Lansberg, 1992; Light & Bonacich, 1988). Unfortunately, few have attempted to develop a systematic theoretical framework that deepens our understanding of how kinship and unique cultural values influence the dynamics of employment relationships in Asian immigrant family businesses. This paper has attempted to fill the gap in the literature of immigrant entrepreneurship. This paper has proposed the thesis that inclusive fitness theory, a biological theory of kinship, provides a useful theoretical lens to analyze the effects of kin altruism and its impacts on psychological contract and commitment in East Asian immigrant businesses. It is further proposed that Confucian cultural ideas (e.g., filial piety and honoring a genealogical family line) acts to reinforce this evolved kin nepotistic tendency mainly because those who endorse the traditional Confucian ideals of a patriarchal household will have a stronger desire to help family members and relatives. For a majority of East Asian immigrant entrepreneurs, running a family business is an effective avenue for maximizing genetic and economic payoff. From a biological perspective, through helping their relatives settle down in the host country, East Asian immigrant entrepreneurs are more likely to increase the opportunities for spreading copies of their genes among future generations. It is also proposed that transmitted Confucian cultural values would intensify universal kin altruism by maintaining well-demarcated genealogical family lines and reinforcing the social categorization strategy of in-group (i.e., kin) versus out-group (i.e., non-kin) distinctions often adopted by East Asian immigrant entrepreneurs. In addition to the aforementioned five propositions, there are several theoretical questions that need to be empirically tested. For instance, it would be interesting to see whether the proposed relationships among kin altruism, psychological contract and commitment could be also found in different immigrant populations in the U.S. Given that kin altruism is an evolved – universal – behavioral tendency of our species, it is very likely that the predicted relationships would be confirmed in different immigrant/ethnic groups in the U.S. However, non-Asian immigrant business owners/managers may endorse different sets of cultural values, which will have different impacts on the social dynamics in non-Asian immigrant businesses. Furthermore, it is also open to empirical investigation to see whether proposed relationships are stronger between male immigrant business owners and their male relatives than between female counterparts and their
Quarterly Review of Business Disciplines – Volume 1, Issue 1, May 2014
Page 106
female relatives. Rigorous future empirical studies will enrich our understanding of these unanswered questions.
REFERENCES
Aldrich, H. E. (2001). Who wants to be an evolutionary theorist? Journal of Management Inquiry,
10(2), 115-127. Allen, N. J., & Meyer, J. P. (1990). The measurement and antecedents of affective, continuance,
and normative commitment to the organization. Journal of Occupational Psychology,
63(1), 1-18. Argyris, C. (1962). Understanding organizational behavior. Homewood, IL: Dorsey Press. Aunger, R. (Ed.). (2000). Darwinizing culture: The status of memetics as a science. New York:
Oxford University Press. Axelrod, R., & Hamilton, W. D. (1984). The evolution of cooperation in biological systems. In R.
Axelrod, The evolution of cooperation (pp. 88-105). New York: Basic Books. Bailey, K. G. (2000). Evolution, kinship, and psychotherapy: Promoting psychological health
through human relationships. In P. Gilbert & K.G. Bailey, Genes on the couch:
Explorations in evolutionary psychotherapy (pp. 42-67). Philadelphia, PA: Taylor & Francis.
Bellow, A. (2003). In praise of nepotism: A natural history. New York: Doubleday. Blackmore, S. (2000). The meme machine. New York: Oxford University Press. Burnstein, E., Crandall, C., & Kitayama, S. (1994). Some neo-Darwinian decision rules for
altruism: Weighting cues for inclusive fitness as a function of the biological importance of the decision. Journal of Personality and Social Psychology, 67, 773-789.
Buss, D. M. (2008). Evolutionary psychology: The new science of the mind (3rd ed.). New York:
Pearson. Campbell, B. (1985). Human ecology: The story of our place in nature from prehistory to the
present. New York: Aldine Publishing Company. Campbell, D. T. (1975). On the conflicts between biological and social evolution and between
psychology and moral tradition. American Psychologist, 30, 1103-1126. Colarelli, S. M. (1998). Psychological interventions in organizations: An evolutionary perspective.
American Psychologist, 53(9), 1044-1056.
Quarterly Review of Business Disciplines – Volume 1, Issue 1, May 2014
Page 107
Colarelli, S. M. (2003). No best way: An evolutionary perspective on human resource
management. Westport, CT: Praeger. Cosmides, L., Tooby, J. (1992). Cognitive adaptations for social exchange. In J.H. Barkow, L.
Cosmides, & J. Tooby (Eds.), The adapted mind: Evolutionary psychology and the
generation of culture (pp. 163-228). New York: Oxford University Press. Cosmides, L., & Tooby, J. (1997). Evolutionary psychology a primer. Retrieved from
http://www.psych.ucsb.edu/research/cep/primer.html Cosmides, L., Tooby, J., & Barkow, J. H. (1992). Introduction: Evolutionary psychology and
conceptual integration. In J.H. Barkow, L. Cosmides, & J. Tooby (Eds.), The adapted
mind: Evolutionary psychology and the generation of culture (pp. 3-15). New York: Oxford University Press.
Daly, M., Salmon, C., & Wilson, M. (1997). Kinship: The conceptual hole in psychological studies
of social cognition and close relationships. In J.A. Simpson & D.T. Kenrick (Eds.), Evolutionary social psychology (pp. 265- 296). Mahwah, N.J: Erlbaum.
Dawkins, R. (1990). The selfish gene. (2nd ed.). New York: Oxford University Press. Essorck-Vitale, S. M., & McGuire, M. T. (1985). Women’s lives viewed from an evolutionary
perspective. II. Patterns of helping. Ethology and Sociobiology, 6, 155-173. Gaulin, S. J. C., & McBurney, D. H. (2001). Psychology: An evolutionary approach. Upper Saddle
River, NJ: Prentice Hall. Hamilton, W.D. (1964). The genetical evolution of social behavior. I and II. Journal of Theoretical
Biology, 7, 1-52. Heshizer, B. P., Martin, H. J., & Wiener, Y. (1991). Normative commitment and instrumental
attachment as intervening variables in the prediction of union participation. Journal of
Applied Behavioral Science, 27(4), 532-549. Hofstede, G. (1983). The cultural relativity of organizational practices and theories. Journal of
International Business Studies, 14(2), 75-90. Hofstede, G. (1993). Cultural constraints in management theories. Academy of Management
Executive, 7(1), 81-94. Hofstede, G. (1997). Cultures and organizations-Software of the mind: Intercultural cooperation
and its importance for survival. New York: McGraw-Hill. Hofstede, G., & Bond, M. H. (1988). The Confucius connection: From cultural roots to economic
growth. Organizational Dynamics, 16(4), 4-21.
Quarterly Review of Business Disciplines – Volume 1, Issue 1, May 2014
Page 108
Kao, H. S. R., Sinha, D., & Wilpert, B. (Eds.). (1999). Management and cultural values: The
indigenization of organizations in Asia. Thousand Oaks, CA: Sage. Kwon, Y. S. (2001). The relationship of HRM practices, trust, and justice with organizational
commitment during organizational changes in the Korean public sector: An application of
the psychological contract model. Unpublished dissertation. State University of New York, Albany, NY.
Laland, K. N., & Brown, G. R. (2002). Sense and nonsense: Evolutionary perspectives on human
behavior. New York: Oxford University Press. Lansberg, I. S. (1992). The family side of family business: A conversation with Salvador
Minuchin. Family Business Review, 5(3), 309-321. Lawrence, P. R., & Nohria, N. (2002). Driven: How human nature shapes our choices. San
Francisco, CA: Jossey-Bass. Levinson, H. (1983). Consulting with family businesses: What to look for, what to look out for.
Organizational Dynamics, 12(1), 71-80. Levinson, H., Price, C. R., Munden, K. J., Mandl, H. J., & Solley, C. M. (1962). Men, management
and mental health. Cambridge, MA: Harvard University Press. Light, I., & Bonacich, E. (1988). Immigrant entrepreneurs: Koreans in Los Angeles 1965-1982.
Los Angeles, CA: University of California Press. Lingle, C. (1996). Singapore’s authoritarian capitalism: Asian values, free market illusions, and
political dependency. Fairfax, VA: The Locke Institute. Markus, H., & Kitayama, S. (1991). Culture and self: Implications for cognition, emotion, and
motivation. Psychological Review, 98, 224-253. Nicholson, N. (1997). Evolutionary psychology: Toward a new view of human nature and
organizational society. Human Relations, 50(9), 1053-1078. Nicholson, N. (2000). Executive instinct: Managing the human animal in the information age.
New York: Crown Business. Nisbett, R. (2003). The geography of thought. New York: Free Press. Perkins, D. H. (2000). Law, family ties, and the East Asian way of business. In L.E. Harrison &
S.P. Huntington (Eds.), Culture matters: How values shape human progress (pp. 232-243). New York: Basic Books.

Quarterly Review of Business Disciplines – Volume 1, Issue 1, May 2014
Page 109
Plotkin, H. (2000). Culture and psychological mechanisms. In R. Aunger (Ed.), Darwinizing
culture: The status of memetics as a science (pp. 69-82). New York: Oxford University Press.
Redding, S. G., Norman, A., & Schlander, A. (1994). The nature of individual attachment to the
organization: A review of East Asian variations. In H.C. Triandis, M.D. Dunnette, & L.M., Hough (Eds.), Handbook of Industrial and Organizational Psychology (2nd ed.). (pp. 647-688). Palo Alto, CA: Consulting Psychologists Press.
Rousseau, D. M. (1995). Psychological contracts in organizations: Understanding written and
unwritten agreements. Thousand Oaks, CA: Sage. Rousseau, D. M. (2001). Schema, promise and mutuality: The building blocks of the
psychological contract. Journal of Occupational and Organizational Psychology, 74, 511-541.
Rousseau, D. M. (2004). Psychological contracts in the workplace: Understanding the ties that
motivate. Academy of Management Executive, 18(1), 120-127. Rousseau, D. M., & Schalk, R. (Eds.). (2000). Psychological contracts in employment:
Cross-national perspectives. Thousand Oaks, CA: Sage Publications. Sanders, J. M., & Nee, V. (1996). Immigrant self-employment: The family as social capital and the
value of human capital. American Sociological Review, 61, 231-249. Sangkaman, S. (1995). The impact of the psychological contract on organizational commitment.
Unpublished dissertation. United States International University, San Diego, CA. Sels, L., Janssens, M., & Van den Brande, I. (2004). Assessing the nature of psychological
contracts: A validation of six dimensions. Journal of Organizational Behavior, 25, 461-488.
Shore, L. M., & Coyle-Shapiro, J.A-M. (2003). New developments in the employee-organization
relationship. Journal of Organizational Behavior, 24, 443-450.
Skyrms, B. (1996). Evolution of the social contract. New York: Cambridge University Press. Smith, M. S., Kish, B. J., & Crawford, C. B. (1987). Inheritance of wealth as human kin
investment. Ethology and Sociobiology, 8, 171-182. Triandis, H. C. (1994). Cross-cultural industrial and organizational psychology. In H.C. Triandis,
M. D. Dunnette, & L. M., Hough (Eds.), Handbook of Industrial and Organizational
Psychology (2nd ed.). (pp. 103-172). Palo Alto, CA: Consulting Psychologists Press. Triandis, H. C. (1995). Individualism and collectivism. Boulder, CO: Westview Press.
Quarterly Review of Business Disciplines – Volume 1, Issue 1, May 2014
Page 110
Trivers, R. L. (1971). The evolution of reciprocal altruism. Quarterly Review of Biology, 46,
35-57. Turnley, W. H., & Feldman, D. C. (1999). The impact of psychological contract violations on exit,
voice, loyalty, and neglect. Human Relations, 52(7), 895-922. U.S. Census Bureau. (2001). 1997 Economic Census: Survey of Minority-Owned Business
Enterprises. Retrieved from http://www.census.gov/prod/ec97/e97cs-5.pdf U.S. Census Bureau (2007). Survey of Business Owners - Asian-Owned Firms: 2007. Retrieved
from https://www.census.gov/econ/sbo/getsof.html?07asian Van den Berghe, P. L. (1990). Human family systems: An evolutionary view. New York: Waveland
Press. Waley, A. (1964). The analects of Confucius. (5th ed.). London: George Allen & Urwin. Wiener, Y. (1982). Commitment in organizations: A normative view. Academy of
Management Review, 7(3), 418-428. Zakaria, F. (1994). Culture is destiny: A conversation with Lee Kuan Yew. Foreign Affairs, 73(2),
109-126. Zhou, M. (2004). Assimilation, the Asian Way. In T. Jacoby (Ed.), Reinventing melting pot: The
new immigrants and what it means to be American (pp. 139-153). New York: Basic Books.

Blank inside back cover.

QUARTERLY REVIEW OF
BUSINESS DISCIPLINES
VOLUME 1 NUMBER 1 MAY 2014
This issue is now available online at www.iabd.org.
A JOURNAL OF INTERNATIONAL ACADEMY OF BUSINESS DISCIPLINES ISSN 2334-0169 (print)
ISSN 2329-5163 (online)