qrtly report rv qtr1 2015 - business.macombgov.org
TRANSCRIPT

Adopted Amended QTD Prior Year YTD Prior Year Favorable %
Description Budget Budget Actual QTD Actual Actual YTD Actual (Unfavorable) Realized
December 31 Year-End Funds
General Fund 193,103,377$ 194,068,821$ 12,302,586$ 11,182,278$ 12,302,586$ 11,182,278$ (181,766,235)$ 6.34%
Community Corrections Grants 141,929 279,292 201,148 152,970 201,148 152,970 (78,144) 72.02%
Community Development Block Grant 1,416,415 1,559,011 84,369 38,843 84,369 38,843 (1,474,642) 5.41%
Community Services Fund 6,556,619 6,586,661 670,433 - 670,433 - (5,916,228) 10.18%
Debt Service Fund 24,961,666 24,961,666 2,023,984 2,156,098 2,023,984 2,156,098 (22,937,682) 8.11%
Freedom Hill Park 408,500 408,500 44,250 10,650 44,250 10,650 (364,250) 10.83%
Health Grants 194,400 233,291 877 4,153 877 4,153 (232,414) 0.38%
Homeland Security Grants 3,595,589 3,595,589 203,007 1,039,009 203,007 1,039,009 (3,392,582) 5.65%
Macomb/St.Clair Training 4,293,774 4,293,774 1,751,633 944,175 2,728,181 2,927,995 (1,565,593) 63.54%
MSU Extension 15,750 44,245 - - - - (44,245) 0.00%
Prosecutng Attorney Grants 5,000 5,000 11 8 11 8 (4,989) 0.22%
Register of Deeds Remonumentaion 232,236 290,470 - - - - (290,470) 0.00%
Register of Deeds Technology 1,702,200 1,702,200 180,903 162,261 180,903 162,261 (1,521,297) 10.63%
Sheriff Grants 382,600 1,245,549 257,134 60,342 257,134 60,342 (988,415) 20.64%
Social Welfare Fund 200,000 200,000 9,361 20,140 9,361 20,140 (190,639) 4.68%
Veterans' Affairs 1,320,416 1,320,416 779,078 779,029 779,078 779,029 (541,338) 59.00%
238,530,471$ 240,794,485$ 18,508,774$ 16,549,956$ 19,485,322$ 18,533,776$ (221,309,163)$ 8.09%
September 30 Year-End Funds
Adult Drug Court 415,708$ 407,388$ 46,808$ 1,585$ 162,317$ 150,088$ (245,071)$ 39.84%
Child Care Fund 21,435,375 21,446,150 840,174 1,460,789 11,192,914 9,970,722 (10,253,236) 52.19%
Community Corrections 1,314,260 1,366,260 316,800 379,402 622,695 595,216 (743,565) 45.58%
Community Mental Health 206,757,262 206,757,262 52,880,817 914,841 54,482,217 50,102,377 (152,275,045) 26.35%
Community Services 23,287,093 26,464,755 5,852,062 4,823,115 10,685,765 9,493,752 (15,778,990) 40.38%
Friend of the Court 10,385,031 10,385,031 2,426,146 1,739,143 5,433,143 4,788,949 (4,951,888) 52.32%
Health Grants 5,278,153 5,662,547 1,030,032 1,222,837 2,882,387 2,520,624 (2,780,160) 50.90%
Juvenile Drug Court (Mar 31 Year End) 14,059 15,732 2,519 2,420 14,540 15,372 (1,192) 92.42%
- - - - - - - #DIV/0!
MSU Extension Grants 15,800 40,216 - 300 - 300 (40,216) 0.00%
Prosecuting Attorney Grants 2,229,887 2,265,560 437,854 352,783 1,182,417 1,107,034 (1,083,143) 52.19%
Roads 99,978,064 100,032,564 16,658,585 17,040,443 36,395,801 36,357,261 (63,636,763) 36.38%
Sheriff Grants 1,887,887 1,898,825 163,204 9,996 537,304 480,964 (1,361,521) 28.30%
Substance Abuse 12,800,229 12,800,229 3,392,982 - 3,534,282 1,968,942 (9,265,947) 27.61%
385,798,808$ 389,542,519$ 84,047,983$ 27,947,654$ 127,125,782$ 117,551,601$ (262,416,737)$ 32.63%
Macomb County, Michigan
Quarterly Revenue Report - Summary by Fund
Quarter Ended March 31, 2015
Prepared by the Macomb County Finance Department
RV - 1

Adopted Amended QTD Prior Year YTD Prior Year Favorable %
Description Budget Budget Actual QTD Actual Actual YTD Actual (Unfavorable) Realized
Property taxes 112,820,357$ 112,820,357$ 1,975,845$ 1,745,129$ 1,975,845$ 1,745,129$ (110,844,512)$ 1.55%
Licenses and permits 1,568,740 1,568,740 257,736 289,038 257,736 289,038 (1,311,004) 18.42%
Federal grants 2,281,782 2,281,782 37,101 28,926 37,101 28,926 (2,244,681) 1.27%
State grants
Revenue sharing 16,432,531 16,432,531 - 145,983 - 145,983 (16,432,531) 0.89%
Court financing 4,617,896 4,617,896 274,789 274,677 274,789 274,677 (4,343,107) 5.95%
Cigarette tax 50,000 50,000 - - - - (50,000) 0.00%
Liquor tax 4,000,000 4,000,000 - - - - (4,000,000) 0.00%
Other state grants 2,579,629 2,579,629 533,792 511,975 533,792 511,975 (2,045,837) 19.85%
-
Charges for services
Court costs and fees 2,022,600 2,022,600 444,734 473,005 444,734 473,005 (1,577,866) 23.39%
Certified copies 875,260 875,260 244,908 240,971 244,908 240,971 (630,352) 27.53%
Probation oversight fees 586,000 586,000 121,231 129,199 121,231 129,199 (464,769) 22.05%
Real estate transfer tax 3,000,000 3,000,000 638,230 546,041 638,230 546,041 (2,361,770) 18.20%
Recording fees 2,705,800 2,705,800 451,098 397,360 451,098 397,360 (2,254,702) 14.69%
Rents 3,025,500 3,025,500 481,189 480,619 481,189 480,619 (2,544,311) 15.89%
Road patrol 9,600,000 10,599,705 2,550,520 2,307,032 2,550,520 2,307,032 (8,049,185) 21.77%
Other Sheriff services 4,200,834 4,200,834 712,262 577,624 712,262 577,624 (3,488,572) 13.75%
Attorney fees 1,397,000 1,397,000 452,623 424,208 452,623 424,208 (944,377) 30.37%
Public works-pump station 2,615,698 2,637,698 (12,753) 571,272 (12,753) 571,272 (2,650,451) 21.66%
Personal services 1,250,000 1,250,000 86,888 71,034 86,888 71,034 (1,163,112) 5.68%
Inmate housing 1,630,000 1,630,000 76,916 67,105 76,916 67,105 (1,553,084) 4.12%
Soil erosion fees 930,000 930,000 186,310 170,720 186,310 170,720 (743,690) 18.36%
Commissions 804,700 804,700 151,594 139,187 151,594 139,187 (653,106) 17.30%
Foster care 385,000 385,000 (32,319) 38,282 (32,319) 38,282 (417,319) 9.94%
Other charges for services 3,473,769 3,473,769 819,286 656,368 819,286 656,368 (2,654,483) 18.89%
Other administrative services 2,000 2,000 1,050 565 1,050 565 (950) 28.25%
Fines and forfeitures 15,000 15,000 7,530 7,275 7,530 7,275 (7,470) 48.50%
Other revenue 59,562 59,562 15,927 37,364 15,927 37,364 (43,635) 62.73%
Medicare/medicaid 613,299 613,299 248,380 170,410 248,380 170,410 (364,919) 27.79%
Investment income 225,000 225,000 62,674 54,511 62,674 54,511 (162,326) 24.23%
Inter departmental charges
Indirect cost allocation 8,570,813 8,570,813 1,360,949 487,850 1,360,949 487,850 (7,209,864) 5.69%
Fines and forfeitures 648,300 648,300 135,507 130,256 135,507 130,256 (512,793) 20.09%
Other revenue 117,500 117,500 18,589 8,292 18,589 8,292 (98,911) 7.06%
Prior Year Fund Bal (1,193) (120,697) - - - - 120,697 0.00%
Operating transfers in - 63,243 - - - - (63,243) 0.00%
193,103,377$ 194,068,821$ 12,302,586$ 11,182,278$ 12,302,586$ 11,182,278$ (181,766,235)$ 6.34%
General Fund (Dec 31 Year End)
Macomb County, Michigan
Quarterly Revenue Report
Quarter Ended March 31, 2015
Prepared by the Macomb County Finance DepartmentRV - 2

Macomb County, Michigan
Quarterly Revenue Report
Quarter Ended March 31, 2015
Adopted Amended QTD Prior Year YTD Prior Year Favorable %
Description Budget Budget Actual QTD Actual Actual YTD Actual (Unfavorable) Realized
Federal grants 65,000$ 199,708 199,708 151,930 199,708 151,930 -$ 100.00%
Charges for services 3,000 3,000 1,440 1,040 1,440 1,040 (1,560) 48.00%
Operating Transfers In 73,929 73,929 - - - - (73,929) 0.00%
Prior year fund balance - 2,655 - - - - (2,655) 0.00%
141,929$ 279,292$ 201,148$ 152,970$ 201,148$ 152,970$ (78,144)$ 72.02%
Adopted Amended QTD Prior Year YTD Prior Year Favorable %
Description Budget Budget Actual QTD Actual Actual YTD Actual (Unfavorable) Realized
Federal grants 1,000,000$ 1,132,189 - 1,698 - 1,698 (1,132,189)$ 0.00%
State grants 140,000 140,000 49,844 - 49,844 - (90,156) 35.60%
Charges for services 117,000 117,000 34,525 37,145 34,525 37,145 (82,475) 29.51%
Prior year fund balance 159,415 169,822 - - - - (169,822) 0.00%
1,416,415$ 1,559,011$ 84,369$ 38,843$ 84,369$ 38,843$ (1,474,642)$ 5.41%
Adopted Amended QTD Prior Year YTD Prior Year Favorable %
Description Budget Budget Actual QTD Actual Actual YTD Actual (Unfavorable) Realized
Federal grants 6,017,427$ 6,047,469$ 630,505$ -$ 630,505$ -$ (5,416,964)$ 10.43%
Charges for services 401,260 401,260 39,590 - 39,590 - (361,670) 9.87%
Other revenue 10,000 10,000 338 - 338 - (9,662) 3.38%
Prior year fund balance 127,932 127,932 - - - - (127,932) 0.00%
6,556,619$ 6,586,661$ 670,433$ -$ 670,433$ -$ (5,916,228)$ 10.18%
Adopted Amended QTD Prior Year YTD Prior Year Favorable %
Description Budget Budget Actual QTD Actual Actual YTD Actual (Unfavorable) Realized
Property taxes 121,288$ 121,288$ 96,584$ 96,280$ 96,584$ 96,280$ (24,704)$ 79.63%
Employer contributions 18,427,625 18,427,625 - - - - (18,427,625) 0.00%
Prior year fund balance (1,288) (1,288) - - - - 1,288 0.00%
Operating transfers in 6,414,041 6,414,041 1,927,400 2,059,818 1,927,400 2,059,818 (4,486,641) 30.05%
24,961,666$ 24,961,666$ 2,023,984$ 2,156,098$ 2,023,984$ 2,156,098$ (22,937,682)$ 8.11%
Community Corrections (Dec 31 Year End)
Community Development Block Grant Fund (Dec 31 Year End)
Debt Service Fund (Dec 31 Year End)
Community Services Fund (Dec 31 Year End)
Prepared by the Macomb County Finance DepartmentRV - 3

Macomb County, Michigan
Quarterly Revenue Report
Quarter Ended March 31, 2015
Adopted Amended QTD Prior Year YTD Prior Year Favorable %
Description Budget Budget Actual QTD Actual Actual YTD Actual (Unfavorable) Realized
Charges for services 185,000$ 185,000$ 44,250$ 10,650$ 44,250$ 10,650$ (140,750)$ 23.92%
Prior year fund balance 60,000 60,000 - - - - (60,000) 0.00%
Operating transfers in 163,500 163,500 - - - - (163,500) 0.00%
408,500$ 408,500$ 44,250$ 10,650$ 44,250$ 10,650$ (364,250)$ 10.83%
Adopted Amended QTD Prior Year YTD Prior Year Favorable %
Description Budget Budget Actual QTD Actual Actual YTD Actual (Unfavorable) Realized
Federal grants -$ -$ -$ -$ -$ -$ -$ 0.00%
State grants 20,000 45,708 512 - 512 - (45,196) 1.12%
Charges for services 2,500 500 365 4,153 365 4,153 (135) 73.00%
Prior year fund balance 171,900 187,083 - - - - (187,083) 0.00%
194,400$ 233,291$ 877$ 4,153$ 877$ 4,153$ (232,414)$ 0.38%
Adopted Amended QTD Prior Year YTD Prior Year Favorable %
Description Budget Budget Actual QTD Actual Actual YTD Actual (Unfavorable) Realized
Federal grants 3,595,589$ 3,595,589$ 183,532$ 1,039,009$ 183,532$ 1,039,009$ (3,412,057)$ 5.10%
Charges for services - - 19,475 - 19,475 - 19,475 100.00%
3,595,589$ 3,595,589$ 203,007$ 1,039,009$ 203,007$ 1,039,009$ (3,392,582)$ 5.65%
Adopted Amended QTD Prior Year YTD Prior Year Favorable %
Description Budget Budget Actual QTD Actual Actual YTD Actual (Unfavorable) Realized
Charges for services 4,293,774$ 4,293,774$ 1,751,633$ 944,175$ 2,728,181$ 2,927,995$ (1,565,593)$ 63.54%
Freedom Hill Park (Dec 31 Year End)
Health Grants (Dec 31 Year End)
Homeland Security Grants (Dec 31 Year End)
Macomb/St Clair Training (Jun 30 Year End)
Prepared by the Macomb County Finance DepartmentRV - 4

Macomb County, Michigan
Quarterly Revenue Report
Quarter Ended March 31, 2015
Adopted Amended QTD Prior Year YTD Prior Year Favorable %
Description Budget Budget Actual QTD Actual Actual YTD Actual (Unfavorable) Realized
Federal grants -$ -$ -$ -$ -$ -$ -$ 0.00%
Charges for services 5,000 5,000 - - - - (5,000) 0.00%
Prior year fund balance 10,750 39,245 - - - - (39,245) 0.00%
15,750$ 44,245$ -$ -$ -$ -$ (44,245)$ 0.00%
Adopted Amended QTD Prior Year YTD Prior Year Favorable %
Description Budget Budget Actual QTD Actual Actual YTD Actual (Unfavorable) Realized
Investment income -$ -$ 11$ 8$ 11$ 8$ 11$ 100.00%
Prior year fund balance 5,000 5,000 - - - - (5,000) 0.00%
5,000$ 5,000$ 11$ 8$ 11$ 8$ (4,989)$ 0.22%
Prosecuting Attorney Grants (Dec 31 Year End)
MSU Extension (Dec 31 Year End)
Prepared by the Macomb County Finance DepartmentRV - 5

Macomb County, Michigan
Quarterly Revenue Report
Quarter Ended March 31, 2015
Adopted Amended QTD Prior Year YTD Prior Year Favorable %
Description Budget Budget Actual QTD Actual Actual YTD Actual (Unfavorable) Realized
State grants 232,236$ 290,470$ -$ -$ -$ -$ (290,470)$ 0.00%
Adopted Amended QTD Prior Year YTD Prior Year Favorable %
Description Budget Budget Actual QTD Actual Actual YTD Actual (Unfavorable) Realized
Charges for services 1,100,000$ 1,100,000$ 179,824$ 161,200$ 179,824$ 161,200$ (920,176)$ 16.35%
Investment income - - 1,079 1,061 1,079 1,061 1,079 10.00%
Prior year fund balance 602,200 602,200 - - - - (602,200) 0.00%
1,702,200$ 1,702,200$ 180,903$ 162,261$ 180,903$ 162,261$ (1,521,297)$ 10.63%
Adopted Amended QTD Prior Year YTD Prior Year Favorable %
Description Budget Budget Actual QTD Actual Actual YTD Actual (Unfavorable) Realized
Federal grants -$ -$ -$ -$ -$ -$ -$ 0.00%
State grants 44,000 4,000 - - - - (4,000) 0.00%
Charges for services 100,600 100 250,551 2,000 250,551 2,000 250,451 250551.00%
Other revenue 8,000 8,000 - - - - (8,000) 0.00%
Fines and forfeitures 230,000 - 6,583 58,342 6,583 58,342 6,583 100.00%
Prior year fund balance - 1,233,449 - - - - (1,233,449) 0.00%
382,600$ 1,245,549$ 257,134$ 60,342$ 257,134$ 60,342$ (988,415)$ 20.64%
Adopted Amended QTD Prior Year YTD Prior Year Favorable %
Description Budget Budget Actual QTD Actual Actual YTD Actual (Unfavorable) Realized
Charges for services 200,000$ 200,000$ 9,361$ 20,140$ 9,361$ 20,140$ (190,639)$ 4.68%
Adopted Amended QTD Prior Year YTD Prior Year Favorable %
Description Budget Budget Actual QTD Actual Actual YTD Actual (Unfavorable) Realized
Property taxes 970,289$ 970,289$ 774,540$ 774,491$ 774,540$ 774,491$ (195,749)$ 79.83%
Charges for services 18,150 18,150 4,538 4,538 4,538 4,538 (13,612) 25.00%
Prior year fund balance 331,977 331,977 - - - - (331,977) 0.00%
.
1,320,416$ 1,320,416$ 779,078$ 779,029$ 779,078$ 779,029$ (541,338)$ 59.00%
Sheriff Grants (Dec 31 Year End)
Veterans' Affairs (Dec 31 Year End)
Social Welfare Fund (Dec 31 Year End)
Register of Deeds Technology Fund (Dec 31 Year End)
Register of Deeds Remonumentation Fund (Dec 31 Year End)
Prepared by the Macomb County Finance DepartmentRV - 6

Macomb County, Michigan
Quarterly Revenue Report
Quarter Ended March 31, 2015
Adopted Amended QTD Prior Year YTD Prior Year Favorable %
Description Budget Budget Actual QTD Actual Actual YTD Actual (Unfavorable) Realized
State grants 6,000$ 6,000$ 29$ 905$ 764$ 905$ (5,236)$ 12.73%
Charges for services 245,745 237,425 46,779 680 46,779 1,871 (190,646) 100.00%
Operating transfers in 163,963 163,963 - - 114,774 147,312 (49,189) 70.00%
415,708$ 407,388$ 46,808$ 1,585$ 162,317$ 150,088$ (245,071)$ 39.84%
Adopted Amended QTD Prior Year YTD Prior Year Favorable %
Description Budget Budget Actual QTD Actual Actual YTD Actual (Unfavorable) Realized
Federal grants 170,000$ 170,000$ 51,511$ 38,975$ 68,370$ 69,417$ (101,630)$ 40.22%
State grants 8,384,487 8,384,487 419,733 1,054,978 1,919,330 1,054,978 (6,465,157) 22.89%
Charges for services 599,000 599,000 368,930 355,279 605,600 617,088 6,600 101.10%
Other revenue - - - 11,557 2,292 22,307 2,292 100.00%
Prior Year Fund Balance - 10,775 - - - - (10,775) 0.00%
Operating transfers in 12,281,888 12,281,888 - - 8,597,322 8,206,932 (3,684,566) 70.00%
21,435,375$ 21,446,150$ 840,174$ 1,460,789$ 11,192,914$ 9,970,722$ (10,253,236)$ 52.19%
Adopted Amended QTD Prior Year YTD Prior Year Favorable %
Description Budget Budget Actual QTD Actual Actual YTD Actual (Unfavorable) Realized
State grants 1,005,749$ 1,005,749$ 316,800$ 379,402$ 406,737$ 379,402$ (599,012)$ 40.44%
Prior Year Fund Balance - 52,000 - - - - - 0.00%
Operating transfers in 308,511 308,511 - - 215,958 215,814 (92,553) 70.00%
1,314,260$ 1,366,260$ 316,800$ 379,402$ 622,695$ 595,216$ (691,565)$ 45.58%
Adopted Amended QTD Prior Year YTD Prior Year Favorable %
Description Budget Budget Actual QTD Actual Actual YTD Actual (Unfavorable) Realized
Federal grants 542,774$ 542,774$ -$ 26,946$ -$ 26,946$ (542,774)$ 0.00%
State grants 22,434,916 22,434,916 3,828,991 7,778 3,828,991 7,666,140 (18,605,925) 17.07%
Charges for services 179,589,256 179,589,256 49,025,505 834,458 48,504,063 41,081,729 (131,085,193) 27.01%
Inter departmental charges 50,824 50,824 - - - - (50,824) 0.00%
Investment income - - 19,051 17,095 33,807 41,380 33,807 100.00%
Other revenue 45,010 45,010 7,270 28,564 68,115 57,838 23,105 151.33%
Operating transfers in 4,094,482 4,094,482 - - 2,047,241 1,228,344 (2,047,241) 50.00%
206,757,262$ 206,757,262$ 52,880,817$ 914,841$ 54,482,217$ 50,102,377$ (152,275,045)$ 26.35%
Child Care Fund (Sep 30 Year End)
Community Corrections (Sep 30 Year End)
Community Mental Health (Sep 30 Year End)
Circuit Court Programs (Sep 30 Year End)
Prepared by the Macomb County Finance DepartmentRV - 7

Macomb County, Michigan
Quarterly Revenue Report
Quarter Ended March 31, 2015
Adopted Amended QTD Prior Year YTD Prior Year Favorable %
Description Budget Budget Actual QTD Actual Actual YTD Actual (Unfavorable) Realized
Federal grants 11,178,610$ 14,138,811$ 3,419,655$ 3,301,886$ 5,984,873$ 6,306,678$ (8,153,938)$ 42.33%
State grants 1,681,986 1,681,986 462,174 268,025 720,603 272,869 (961,383) 42.84%
Charges for services 6,798,570 6,954,892 1,708,652 952,546 2,286,557 1,712,511 (4,668,335) 32.88%
Inter departmental charges 181,661 181,661 - - - - (181,661) 0.00%
Other revenue 859,933 889,765 227,650 289,354 427,927 420,517 (461,838) 48.09%
Prior Year Fund Balance 353,250 353,250 - - 90,607 - (262,643) 25.65%
Operating transfers in 2,233,083 2,264,390 33,931 11,304 1,175,198 781,177 (1,089,192) 51.90%
23,287,093$ 26,464,755$ 5,852,062$ 4,823,115$ 10,685,765$ 9,493,752$ (15,778,990)$ 40.38%
Adopted Amended QTD Prior Year YTD Prior Year Favorable %
Description Budget Budget Actual QTD Actual Actual YTD Actual (Unfavorable) Realized
Federal grants 5,961,022$ 5,961,022$ 1,830,080$ 1,328,924$ 2,643,181$ 2,061,465$ (3,317,841)$ 44.34%
State grants 665,000 665,000 349,174 174,927 349,174 174,927 (315,826) 52.51%
Charges for services 862,000 862,000 246,892 235,264 412,882 416,861 (449,118) 47.90%
Investment income - - - 28 - 36 - 0.00%
Operating transfers in 2,897,009 2,897,009 - - 2,027,906 2,135,660 (869,103) 70.00%
10,385,031$ 10,385,031$ 2,426,146$ 1,739,143$ 5,433,143$ 4,788,949$ (4,951,888)$ 52.32%
Adopted Amended QTD Prior Year YTD Prior Year Favorable %
Description Budget Budget Actual QTD Actual Actual YTD Actual (Unfavorable) Realized
State grants 3,528,836$ 3,913,561$ 885,588$ 826,099$ 1,794,408$ 1,678,368$ (2,119,153)$ 45.85%
Charges for services 421,148 421,093 143,473 395,199 162,736 432,539 (258,357) 38.65%
Other revenue 6,300 6,300 971 1,539 2,245 2,873 (4,055) 35.63%
Operating transfers in 1,318,569 1,318,569 - - 922,998 406,844 (395,571) 70.00%
Prior Year Fund Balance 3,300 3,024 - - - - (3,024) 0.00%
5,278,153$ 5,662,547$ 1,030,032$ 1,222,837$ 2,882,387$ 2,520,624$ (2,780,160)$ 50.90%
Friend of the Court (Sep 30 Year End)
Health Grants (Sep 30 Year End)
Community Services (Sep 30 Year End)
Prepared by the Macomb County Finance DepartmentRV - 8

Macomb County, Michigan
Quarterly Revenue Report
Quarter Ended March 31, 2015
Adopted Amended QTD Prior Year YTD Prior Year Favorable %
Description Budget Budget Actual QTD Actual Actual YTD Actual (Unfavorable) Realized
Federal grants 10,448$ 12,121$ -$ -$ 10,448$ 13,834$ (1,673)$ 86.20%
State grants 2,450 2,450 1,852 - 1,852 - (598) 75.59%
Charges for services - - 667 591 1,427 1,357 1,427 100.00%
Operating transfers in 1,161 1,161 - 1,829 813 181 (348) 70.03%
14,059$ 15,732$ 2,519$ 2,420$ 14,540$ 15,372$ (1,192)$ 92.42%
Adopted Amended QTD Prior Year YTD Prior Year Favorable %
Description Budget Budget Actual QTD Actual Actual YTD Actual (Unfavorable) Realized
Charges for services -$ -$ -$ 300$ -$ 300$ -$ 0.00%
Prior Year Fund Balance 15,800 40,216 - - - - (40,216) 0.00%
15,800$ 40,216$ -$ 300$ -$ 300$ (40,216)$ 0.00%
Adopted Amended QTD Prior Year YTD Prior Year Favorable %
Description Budget Budget Actual QTD Actual Actual YTD Actual (Unfavorable) Realized
Federal grants 1,039,028$ 1,039,028$ 359,828$ 280,655$ 440,114$ 373,652$ (598,914)$ 42.36%
State grants 289,700 324,600 68,542 62,880 118,585 110,724 (206,015) 36.53%
Charges for services 38,609 39,382 9,484 9,248 19,933 20,769 (19,449) 100.00%
Operating transfers in 862,550 862,550 - - 603,785 601,889 (258,765) 70.00%
2,229,887$ 2,265,560$ 437,854$ 352,783$ 1,182,417$ 1,107,034$ (1,083,143)$ 52.19%
Adopted Amended QTD Prior Year YTD Prior Year Favorable %
Description Budget Budget Actual QTD Actual Actual YTD Actual (Unfavorable) Realized
Licenses & permits 598,200$ 598,200$ 147,319$ 92,795$ 363,945$ 259,316$ (234,255)$ 60.84%
Federal grants 29,549,580 29,549,580 1,318,156 2,070,246 6,051,618 7,974,897 (23,497,962) 20.48%
State grants 46,911,720 46,911,720 14,148,705 13,952,515 26,303,206 25,023,739 (20,608,514) 56.07%
Charges for services 8,138,543 8,138,543 985,567 817,305 3,464,428 2,866,301 (4,674,115) 42.57%
Investment income 146,166 146,166 44,773 42,399 90,527 61,734 (55,639) 61.93%
Other revenue 193,750 193,750 14,065 65,183 122,077 171,274 (71,673) 63.01%
Prior Year Fund Balance 14,440,105 14,494,605 - - - - (14,494,605) 0.00%
99,978,064$ 100,032,564$ 16,658,585$ 17,040,443$ 36,395,801$ 36,357,261$ (63,636,763)$ 36.38%
Prosecuting Attorney Grants (Sep 30 Year End)
Roads (Sep 30 Year End)
Juvenile Drug Court Grants (Mar 31 Year End)
MSU Extension Grants (Sep 30 Year End)
Prepared by the Macomb County Finance DepartmentRV - 9

Macomb County, Michigan
Quarterly Revenue Report
Quarter Ended March 31, 2015
Adopted Amended QTD Prior Year YTD Prior Year Favorable %
Description Budget Budget Actual QTD Actual Actual YTD Actual (Unfavorable) Realized
Federal grants 248,980$ 165,550$ 34,020$ 6,996$ 102,264$ 13,992$ (63,286)$ 61.77%
State grants 951,281 1,045,649 128,961 - 128,961 5,712 (916,688) 12.33%
Charges for services 225,000 225,000 - - - - (225,000) 0.00%
Fines and forfeitures 30,000 30,000 223 3,000 3,241 6,144 (26,759) 10.80%
Operating transfers in 432,626 432,626 - - 302,838 455,116 (129,788) 70.00%
1,887,887$ 1,898,825$ 163,204$ 9,996$ 537,304$ 480,964$ (1,361,521)$ 28.30%
Adopted Amended QTD Prior Year YTD Prior Year Favorable %
Description Budget Budget Actual QTD Actual Actual YTD Actual (Unfavorable) Realized
State grants 3,990,824$ 3,990,824$ 1,171,770$ -$ 1,171,770$ 1,220,424$ (2,819,054)$ 29.36%
Charges for services 5,880,904 5,880,904 2,221,142 - 2,221,142 645,555 (3,659,762) 37.77%
Other revenue - - 70 - 70 - 70 100.00%
Prior Year Fund Balance 816,715 816,715 - - - - (816,715) 0.00%
Operating transfers in 2,111,786 2,111,786 - - 141,300 102,963 (1,970,486) 6.69%
12,800,229$ 12,800,229$ 3,392,982$ -$ 3,534,282$ 1,968,942$ (9,265,947)$ 27.61%
Sheriff Grants (Sep 30 Year End)
Substance Abuse (Sep 30 Year End)
Prepared by the Macomb County Finance DepartmentRV - 10

Adopted Amended QTD Prior Year YTD Prior Year Favorable %
Description Budget Budget Actual QTD Actual Actual YTD Actual (Unfavorable) Utilized
December 31 Year-End Funds
General Fund 193,103,377$ 194,068,821$ 39,385,001$ 36,882,332$ 39,385,001$ 36,882,334$ 154,683,820$ 20.29%
Community Corrections Grants 141,929 279,292 17,617 25,091 17,617 25,091 261,675 6.31%
Community Development Block Grant 1,416,415 1,559,011 32,756 43,762 32,756 43,762 1,526,255 2.10%
Community Services Fund 6,556,619 6,586,661 714,459 12,687 714,459 12,687 5,872,202 10.85%
Debt Service Fund 24,961,666 24,961,666 1,931,206 2,073,400 1,931,206 2,073,400 23,030,460 7.74%
Freedom Hill Park 408,500 408,500 25,920 39,005 25,920 39,005 382,580 6.35%
Health Grants 194,400 233,291 5,438 2,143 5,438 2,143 227,853 2.33%
Homeland Security Grants 3,595,589 3,595,589 (677,315) (871,823) (677,315) (871,823) 4,272,904 -18.84%
Macomb/St. Clair Training 4,293,774 4,293,774 1,738,699 911,158 2,728,181 2,874,104 1,565,593 63.54%
MSU Extension 15,750 44,245 1,310 2,832 1,310 2,832 42,935 2.96%
Prosecutng Attorney Grants 5,000 5,000 - (76) - (76) 5,000 0.00%
Register of Deeds Remonumentaion 232,236 290,470 - - - - 290,470 0.00%
Register of Deeds Technology 1,702,200 1,702,200 273,198 284,563 273,198 284,563 1,429,002 16.05%
Sheriff Grants 382,600 1,245,549 130,337 64,900 130,337 64,900 1,115,212 10.46%
Social Welfare Fund 200,000 200,000 - - - - 200,000 0.00%
Veterans' Affairs 1,320,416 1,320,416 218,305 186,040 218,305 186,040 1,102,111 16.53%
238,530,471$ 240,794,485$ 43,796,931$ 39,656,014$ 44,786,413$ 41,618,962$ 196,008,072$ 18.60%
September 30 Year-End Funds
Adult Drug Court 415,708$ 407,388$ 53,708$ 43,298$ 116,833$ 88,241$ 290,555$ 28.68%
Child Care Fund 21,435,375 21,446,150 4,553,326 4,066,568 8,473,777 8,276,724 12,972,373 39.51%
Community Corrections 1,314,260 1,366,260 263,558 285,389 590,968 653,118 775,292 43.25%
Community Mental Health 206,757,262 206,757,262 39,039,804 37,570,557 65,494,160 65,690,754 141,263,102 31.68%
Community Services 23,287,093 26,464,755 5,833,301 5,391,315 10,266,171 10,305,968 16,198,584 38.79%
Friend of the Court 10,385,031 10,385,031 2,282,576 2,244,322 4,706,869 4,770,136 5,678,162 45.32%
Health Grants 5,278,153 5,662,547 1,044,615 845,098 2,265,991 2,082,080 3,396,556 40.02%
Juvenile Drug Court 14,059 15,732 2,263 590 13,872 15,963 1,860 88.18%
MSU Extension Grants 15,800 40,216 7,051 6,465 10,606 7,776 29,610 26.37%
Prosecuting Attorney Grants 2,229,887 2,265,560 538,101 497,735 1,098,330 1,087,321 1,167,230 48.48%
Roads 99,978,064 100,032,564 14,012,385 14,472,298 33,982,750 34,834,420 66,049,814 33.97%
Sheriff Grants 1,887,887 1,898,825 300,019 312,889 656,843 700,371 1,241,982 34.59%
Substance Abuse 12,800,229 12,800,229 2,838,784 2,295,574 4,420,203 3,620,839 8,380,026 34.53%
385,798,808$ 389,542,519$ 70,769,490$ 68,032,098$ 132,097,374$ 132,133,711$ 257,445,145$ 33.91%
Macomb County, Michigan
Quarterly Expenditure Report - Summary by Fund
Quarter Ended March 31, 2015
Prepared by the Macomb County Finance Department
XP - 1

Adopted Amended QTD Prior Year YTD Prior Year Favorable %
Description Budget Budget Actual QTD Actual Actual YTD Actual (Unfavorable) Utilized
December 31 Year-End Funds
General Fund 121,347,247$ 122,494,320$ 29,028,066$ 28,112,062$ 29,028,066$ 28,112,064$ 93,466,254$ 23.70%
Community Corrections Grants 73,346 73,346 17,471 17,058 17,471 17,058 55,875 23.82%
Community Services Fund 414,049 412,053 88,110 8,362 88,110 8,362 323,943 21.38%
Freedom Hill Park - - 2,114 1,819 2,114 1,819 (2,114) 100.00%
Homeland Security Grants 282,434 269,434 77,794 100,913 77,794 100,913 191,640 28.87%
Macomb/St. Clair Training 4,076,284 4,076,284 1,687,536 904,282 2,613,213 2,805,930 1,463,071 64.11%
Register of Deeds Technology - - - 15,980 - 15,980 - 0.00%
Veterans' Affairs 772,694 772,694 173,000 140,886 173,000 140,886 599,694 22.39%
126,966,054$ 128,098,131$ 31,074,091$ 29,301,362$ 31,999,768$ 31,203,012$ 96,098,363$ 24.98%
September 30 Year-End Funds
Circuit Court Grants 85,192$ 85,192$ 19,965$ 18,932$ 41,350$ 48,500$ 43,842$ 48.54%
Child Care Fund 10,134,544 10,236,844 2,236,378 2,211,398 4,681,660 4,986,869 5,555,184 45.73%
Community Corrections 796,816 796,816 174,013 169,095 370,640 358,023 426,176 46.52%
Community Mental Health 28,279,744 28,279,744 6,157,156 5,941,630 12,894,032 13,116,153 15,385,712 45.59%
Community Services 9,208,414 10,075,741 2,240,044 2,036,028 4,890,118 4,684,121 5,185,623 48.53%
Friend of the Court 8,449,567 8,449,567 1,833,091 1,751,605 3,855,040 3,886,597 4,594,527 45.62%
Health Grants 3,146,688 3,301,245 681,300 648,731 1,441,441 1,437,317 1,859,804 43.66%
Prosecuting Attorney Grants 1,993,575 2,017,985 485,235 447,204 990,183 986,130 1,027,802 49.07%
Roads 29,384,742 29,439,242 6,868,314 6,113,134 15,479,347 14,459,331 13,959,895 52.58%
Sheriff Grants 1,080,886 1,083,939 251,160 268,207 545,612 628,175 538,327 50.34%
Substance Abuse 1,194,564 1,194,564 274,673 216,395 569,778 468,432 624,786 47.70%
93,754,732$ 94,960,879$ 21,221,328$ 19,822,359$ 45,759,202$ 45,059,648$ 49,201,677$ 48.19%
Macomb County, Michigan
Quarterly Expenditure Report - Personnel Expenditure Summary by Fund
Quarter Ended March 31, 2015
Prepared by the Macomb County Finance Department
XP - 2

Adopted Amended QTD Prior Year YTD Prior Year Favorable %
Description Budget Budget Actual QTD Actual Actual YTD Actual (Unfavorable) Utilized
December 31 Year-End Funds
General Fund 71,756,130$ 71,574,501$ 10,356,935$ 8,770,270$ 10,356,935$ 8,770,270$ 61,217,566$ 14.47%
Community Corrections Grants 68,583 205,946 146 8,033 146 8,033 205,800 0.07%
Community Development Block Grant 1,416,415 1,559,011 32,756 43,762 32,756 43,762 1,526,255 2.10%
Community Services Fund 6,142,570 6,174,608 626,349 4,325 626,349 4,325 5,548,259 10.14%
Debt Service Fund 24,961,666 24,961,666 1,931,206 2,073,400 1,931,206 2,073,400 23,030,460 7.74%
Freedom Hill Park 408,500 408,500 23,806 37,186 23,806 37,186 384,694 5.83%
Health Grants 194,400 233,291 5,438 2,143 5,438 2,143 227,853 2.33%
Homeland Security Grants 3,313,155 3,326,155 (755,109) (972,736) (755,109) (972,736) 4,081,264 -22.70%
Macomb/St. Clair Training 217,490 217,490 51,163 6,876 114,968 68,174 102,522 52.86%
MSU Extension 15,750 44,245 1,310 2,832 1,310 2,832 42,935 2.96%
Prosecutng Attorney Grants 5,000 5,000 - (76) - (76) 5,000 0.00%
Register of Deeds Remonumentaion 232,236 290,470 - - - - 290,470 0.00%
Register of Deeds Technology 1,702,200 1,702,200 273,198 268,583 273,198 268,583 1,429,002 16.05%
Sheriff Grants 382,600 1,245,549 130,337 64,900 130,337 64,900 1,115,212 10.46%
Social Welfare Fund 200,000 200,000 - - - - 200,000 0.00%
Veterans' Affairs 547,722 547,722 45,305 45,154 45,305 45,154 502,417 8.27%
111,564,417$ 112,696,354$ 12,722,840$ 10,354,652$ 12,786,645$ 10,415,950$ 99,909,709$ 11.35%
September 30 Year-End Funds
Circuit Court Grants 330,516$ 322,196$ 33,743$ 24,366$ 75,483$ 39,741$ 246,713$ 23.43%
Child Care Fund 11,300,831 11,209,306 2,316,949 1,855,170 3,792,117 3,289,855 7,417,189 33.83%
Community Corrections 517,444 569,444 89,546 116,294 220,328 295,095 349,116 38.69%
Community Mental Health 178,477,518 178,477,518 32,882,648 31,628,927 52,600,128 52,574,601 125,877,390 29.47%
Community Services 14,078,679 16,389,014 3,593,256 3,355,287 5,376,053 5,621,847 11,012,961 32.80%
Friend of the Court 1,935,464 1,935,464 449,485 492,717 851,829 883,539 1,083,635 44.01%
Health Grants 2,131,465 2,361,302 363,315 196,367 824,550 644,763 1,536,752 34.92%
Juvenile Drug Court 14,059 15,732 2,263 590 13,872 15,963 1,860 88.18%
MSU Extension Grants 15,800 40,216 7,051 6,465 10,606 7,776 29,610 26.37%
Prosecuting Attorney Grants 236,312 247,575 52,866 50,531 108,147 101,191 139,428 43.68%
Roads 70,593,322 70,593,322 7,144,071 8,359,164 18,503,403 20,375,089 52,089,919 26.21%
Sheriff Grants 807,001 814,886 48,859 44,682 111,231 72,196 703,655 13.65%
Substance Abuse 11,605,665 11,605,665 2,564,111 2,079,179 3,850,425 3,152,407 7,755,240 33.18%
292,044,076$ 294,581,640$ 49,548,162$ 48,209,739$ 86,338,172$ 87,074,063$ 208,243,468$ 29.31%
Macomb County, Michigan
Quarterly Expenditure Report - Operating Expenditure Summary by Fund
Quarter Ended March 31, 2015
Prepared by the Macomb County Finance Department
XP - 3

Adopted Amended QTD Prior Year YTD Prior Year Favorable %
Description Budget Budget Actual QTD Actual Actual YTD Actual (Unfavorable) Utilized
Board of Commissioners 1,570,709$ 1,570,709$ 311,910$ 261,547$ 311,910$ 261,547$ 1,258,799$ 19.86%
Circuit Court 11,247,562 11,247,562 2,396,986 2,046,617 2,396,986 2,046,619 8,850,576 21.31%
Family Counseling 186,333 186,333 33,040 28,878 33,040 28,878 153,293 17.73%
District Court - Romeo 1,126,799 1,126,799 209,467 234,912 209,467 234,912 917,332 18.59%
District Court - 3rd Class 25,000 25,000 1,254 2,357 1,254 2,357 23,746 5.02%
District Court - New Baltimore 1,426,455 1,426,455 304,875 313,883 304,875 313,883 1,121,580 21.37%
Law Library 35,800 35,800 99 8,247 99 8,247 35,701 0.28%
Probate Court 3,057,790 3,057,790 639,130 676,777 639,130 676,777 2,418,660 20.90%
Juvenile Court 5,198,618 5,198,618 1,014,927 992,389 1,014,927 992,389 4,183,691 19.52%
Probation - Circuit Court 118,600 118,600 22,237 21,747 22,237 21,747 96,363 18.75%
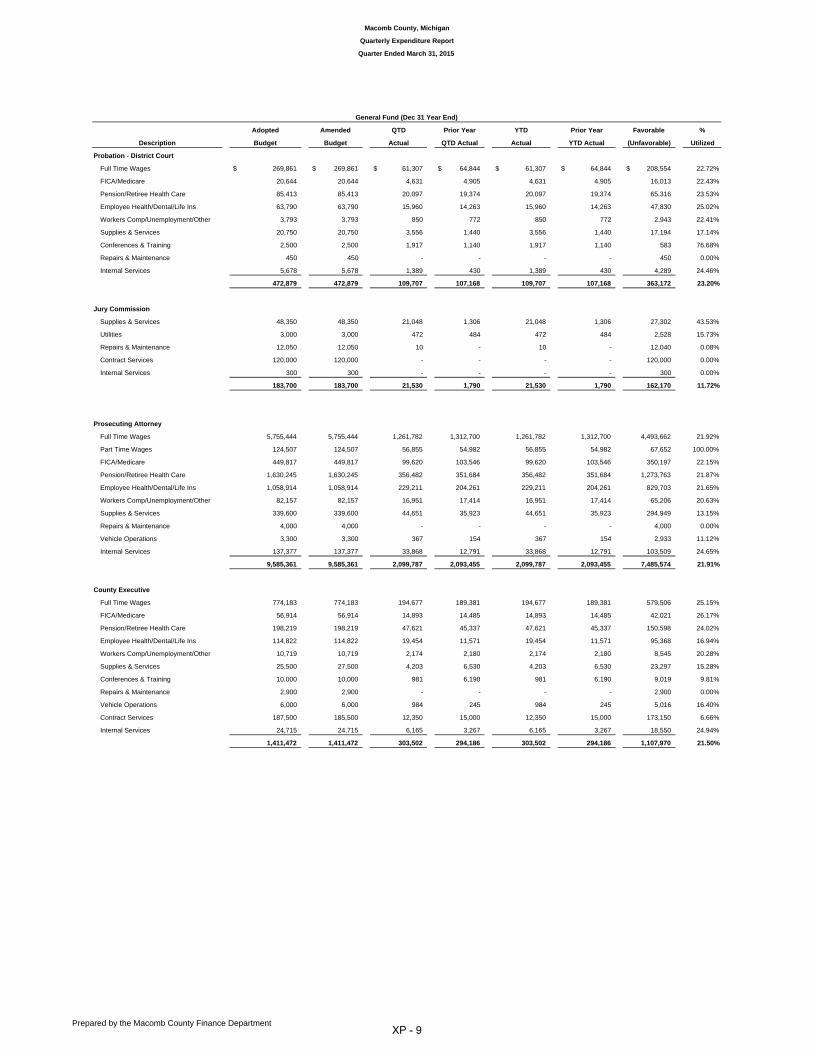
Probation - District Court 472,879 472,879 109,707 107,168 109,707 107,168 363,172 23.20%
Jury Commission 183,700 183,700 21,530 1,790 21,530 1,790 162,170 11.72%
Prosecuting Attorney 9,585,361 9,585,361 2,099,787 2,093,455 2,099,787 2,093,455 7,485,574 21.91%
County Executive 1,411,472 1,411,472 303,502 294,186 303,502 294,186 1,107,970 21.50%
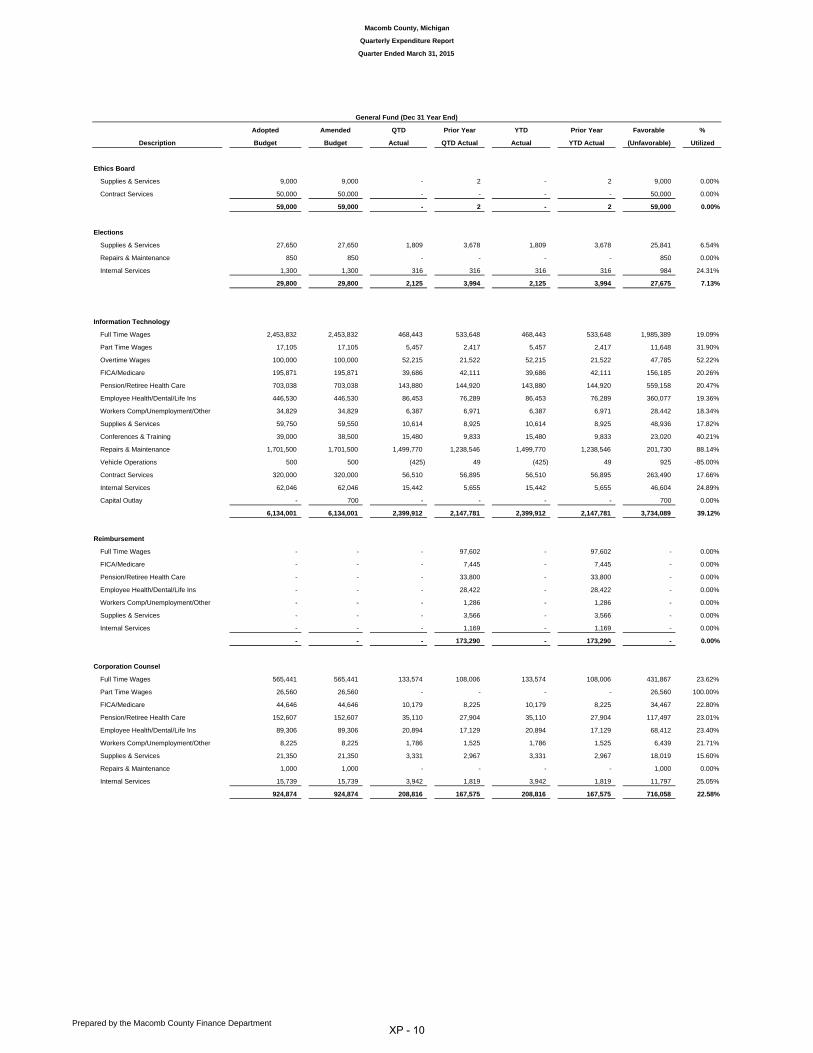
Ethics Board 59,000 59,000 - 2 - 2 59,000 0.00%
Elections 29,800 29,800 2,125 3,994 2,125 3,994 27,675 7.13%
Information Technology 6,134,001 6,134,001 2,399,912 2,147,781 2,399,912 2,147,781 3,734,089 39.12%
Reimbursement - - - 173,290 - 173,290 - 0.00%
Corporation Counsel 924,874 924,874 208,816 167,575 208,816 167,575 716,058 22.58%
County Clerk 4,799,286 4,799,286 1,014,818 963,900 1,014,818 963,900 3,784,468 21.15%
Finance 2,210,939 2,210,939 443,875 445,686 443,875 445,686 1,767,064 20.08%
Equalization 929,624 929,624 207,110 195,574 207,110 195,574 722,514 22.28%
Human Resources 2,136,489 2,202,489 492,936 463,774 492,936 463,774 1,709,553 22.38%
Purchasing 1,399,167 1,399,167 285,759 254,613 285,759 254,613 1,113,408 20.42%
Register of Deeds 1,821,510 1,821,510 389,120 374,346 389,120 374,346 1,432,390 21.36%
Treasurer 2,296,398 2,296,398 516,504 488,799 516,504 488,799 1,779,894 22.49%
Building Authority 1,300 1,300 - 105 - 105 1,300 0.00%
Facilities and Operations 14,873,957 14,873,957 3,356,511 3,201,351 3,356,511 3,201,351 11,517,446 22.57%
MSU Extension 900,361 900,361 115,528 184,142 115,528 184,142 784,833 12.83%
Planning and Econ Develop. 3,031,336 3,031,336 690,485 585,347 690,485 585,347 2,340,851 22.78%
Civil Service Comm. 35,700 35,700 7,031 1,111 7,031 1,111 28,669 19.69%
Sheriff 62,705,493 63,785,694 14,053,013 13,059,330 14,053,013 13,059,330 49,732,681 22.03%
Emergency Management 1,095,471 1,180,714 227,735 231,777 227,735 231,777 952,979 19.29%
Public works 6,366,079 6,366,079 1,223,949 1,217,514 1,223,949 1,217,514 5,142,130 19.23%
Health Dept 20,248,278 20,248,278 3,804,970 3,178,308 3,804,970 3,178,308 16,443,308 18.79%
Health & Comm. Svce 288,687 288,687 66,733 54,223 66,733 54,223 221,954 23.12%
Social Services 72,472 72,472 7,969 12,214 7,969 12,214 64,503 11.00%
Senior Citizens 772,506 772,506 234,804 104,550 234,804 104,550 537,702 30.40%
Appropriations (7,856,350) (8,122,350) 239,447 229,255 239,447 229,255 (8,361,797) -2.95%
Contributions to Other Funds 32,179,921 32,179,921 1,927,400 2,059,818 1,927,400 2,059,818 30,252,521 5.99%
193,103,377$ 194,068,821$ 39,385,001$ 36,882,332$ 39,385,001$ 36,882,334$ 154,683,820$ 20.29%
Macomb County, Michigan
Quarterly Expenditure Report - General Fund All Expenditure Categories Summary
Quarter Ended March 31, 2015
Prepared by the Macomb County Finance Department
XP - 4

Adopted Amended QTD Prior Year YTD Prior Year Favorable %
Description Budget Budget Actual QTD Actual Actual YTD Actual (Unfavorable) Utilized
Board of Commissioners 1,310,335$ 1,310,335$ 291,375$ 247,643$ 291,375$ 247,643$ 1,018,960$ 22.24%
Circuit Court 6,931,662 6,931,662 1,509,773 1,264,552 1,509,773 1,264,554 5,421,889 21.78%
Family Counseling 66,156 66,156 15,713 7,410 15,713 7,410 50,443 23.75%
District Court - Romeo 948,453 948,453 174,318 208,475 174,318 208,475 774,135 18.38%
District Court - New Baltimore 1,203,648 1,203,648 272,339 276,847 272,339 276,847 931,309 22.63%
Probate Court 2,572,655 2,572,655 541,836 576,554 541,836 576,554 2,030,819 21.06%
Juvenile Court 4,152,784 4,152,784 837,674 847,867 837,674 847,867 3,315,110 20.17%
Probation - District Court 443,501 443,501 102,845 104,158 102,845 104,158 340,656 23.19%
Prosecuting Attorney 9,101,084 9,101,084 2,020,901 2,044,587 2,020,901 2,044,587 7,080,183 22.21%
County Executive 1,154,857 1,154,857 278,819 262,954 278,819 262,954 876,038 24.14%
Information Technology 3,951,205 3,951,205 802,521 827,878 802,521 827,878 3,148,684 20.31%
Reimbursement - - - 168,555 - 168,555 - 0.00%
Corporation Counsel 886,785 886,785 201,543 162,789 201,543 162,789 685,242 22.73%
County Clerk 4,382,222 4,383,280 950,448 886,671 950,448 886,671 3,432,832 21.68%
Finance 2,102,377 2,102,377 417,571 432,158 417,571 432,158 1,684,806 19.86%
Equalization 881,233 881,233 199,614 191,679 199,614 191,679 681,619 22.65%
Human Resources 1,964,903 2,030,903 460,344 434,311 460,344 434,311 1,570,559 22.67%
Purchasing 1,163,391 1,163,391 255,344 224,229 255,344 224,229 908,047 21.95%
Register of Deeds 1,673,456 1,673,456 372,792 356,267 372,792 356,267 1,300,664 22.28%
Treasurer 2,169,063 2,169,063 491,916 472,572 491,916 472,572 1,677,147 22.68%
Facilities and Operations 7,674,706 7,674,706 1,833,001 1,798,508 1,833,001 1,798,508 5,841,705 23.88%
MSU Extension 445,665 445,665 100,606 97,345 100,606 97,345 345,059 22.57%
Planning and Econ Develop. 2,641,730 2,641,730 584,034 495,459 584,034 495,459 2,057,696 22.11%
Sheriff 52,500,460 53,495,232 11,974,735 11,378,167 11,974,735 11,378,167 41,520,497 22.38%
Emergency Management 1,013,488 1,098,731 214,997 221,293 214,997 221,293 883,734 19.57%
Public works 6,040,331 6,040,331 1,182,003 1,196,462 1,182,003 1,196,462 4,858,328 19.57%
Health Dept 13,506,075 13,506,075 2,798,879 2,801,191 2,798,879 2,801,191 10,707,196 20.72%
Health & Comm. Svce 263,895 263,895 61,509 53,361 61,509 53,361 202,386 23.31%
Senior Citizens 219,927 219,927 80,616 72,120 80,616 72,120 139,311 36.66%
Appropriations (10,018,800) (10,018,800) - - - - (10,018,800) 0.00%
121,347,247$ 122,494,320$ 29,028,066$ 28,112,062$ 29,028,066$ 28,112,064$ 93,466,254$ 23.70%
Macomb County, Michigan
Quarterly Expenditure Report - General Fund Personnel Expenditure Summary
Quarter Ended March 31, 2015
Prepared by the Macomb County Finance Department
XP - 5

Adopted Amended QTD Prior Year YTD Prior Year Favorable %
Description Budget Budget Actual QTD Actual Actual YTD Actual (Unfavorable) Utilized
Board of Commissioners 260,374$ 260,374$ 20,535$ 13,904$ 20,535$ 13,904$ 239,839$ 7.89%
Circuit Court 4,315,900 4,315,900 887,213 782,065 887,213 782,065 3,428,687 20.56%
Family Counseling 120,177 120,177 17,327 21,468 17,327 21,468 102,850 14.42%
District Court - Romeo 178,346 178,346 35,149 26,437 35,149 26,437 143,197 19.71%
District Court - 3rd Class 25,000 25,000 1,254 2,357 1,254 2,357 23,746 5.02%
District Court - New Baltimore 222,807 222,807 32,536 37,036 32,536 37,036 190,271 14.60%
Law Library 35,800 35,800 99 8,247 99 8,247 35,701 0.28%
Probate Court 485,135 485,135 97,294 100,223 97,294 100,223 387,841 20.06%
Juvenile Court 1,045,834 1,045,834 177,253 144,522 177,253 144,522 868,581 16.95%
Probation - Circuit Court 118,600 118,600 22,237 21,747 22,237 21,747 96,363 18.75%
Probation - District Court 29,378 29,378 6,862 3,010 6,862 3,010 22,516 23.36%
Jury Commission 183,700 183,700 21,530 1,790 21,530 1,790 162,170 11.72%
Prosecuting Attorney 484,277 484,277 78,886 48,868 78,886 48,868 405,391 16.29%
County Executive 256,615 256,615 24,683 31,232 24,683 31,232 231,932 9.62%
Ethics Board 59,000 59,000 - 2 - 2 59,000 0.00%
Elections 29,800 29,800 2,125 3,994 2,125 3,994 27,675 7.13%
Information Technology 2,182,796 2,182,796 1,597,391 1,319,903 1,597,391 1,319,903 585,405 73.18%
Reimbursement - - - 4,735 - 4,735 - 0.00%
Corporation Counsel 38,089 38,089 7,273 4,786 7,273 4,786 30,816 19.09%
County Clerk 417,064 416,006 64,370 77,229 64,370 77,229 351,636 15.47%
Finance 108,562 108,562 26,304 13,528 26,304 13,528 82,258 24.23%
Equalization 48,391 48,391 7,496 3,895 7,496 3,895 40,895 15.49%
Human Resources 171,586 171,586 32,592 29,463 32,592 29,463 138,994 18.99%
Purchasing 235,776 235,776 30,415 30,384 30,415 30,384 205,361 12.90%
Register of Deeds 148,054 148,054 16,328 18,079 16,328 18,079 131,726 11.03%
Treasurer 127,335 127,335 24,588 16,227 24,588 16,227 102,747 19.31%
Building Authority 1,300 1,300 - 105 - 105 1,300 0.00%
Facilities and Operations 7,199,251 7,199,251 1,523,510 1,402,843 1,523,510 1,402,843 5,675,741 21.16%
MSU Extension 454,696 454,696 14,922 86,797 14,922 86,797 439,774 3.28%
Planning and Econ Develop. 389,606 389,606 106,451 89,888 106,451 89,888 283,155 27.32%
Civil Service Comm. 35,700 35,700 7,031 1,111 7,031 1,111 28,669 19.69%
Sheriff 10,205,033 10,290,462 2,078,278 1,681,163 2,078,278 1,681,163 8,212,184 20.20%
Emergency Management 81,983 81,983 12,738 10,484 12,738 10,484 69,245 15.54%
Public works 325,748 325,748 41,946 21,052 41,946 21,052 283,802 12.88%
Health Dept 6,742,203 6,742,203 1,006,091 377,117 1,006,091 377,117 5,736,112 14.92%
Health & Comm. Svce 24,792 24,792 5,224 862 5,224 862 19,568 21.07%
Social Services 72,472 72,472 7,969 12,214 7,969 12,214 64,503 11.00%
Senior Citizens 552,579 552,579 154,188 32,430 154,188 32,430 398,391 27.90%
Appropriations 2,162,450 1,896,450 239,447 229,255 239,447 229,255 1,657,003 12.63%
Contributions to Other Funds 32,179,921 32,179,921 1,927,400 2,059,818 1,927,400 2,059,818 30,252,521 5.99%
71,756,130$ 71,574,501$ 10,356,935$ 8,770,270$ 10,356,935$ 8,770,270$ 61,217,566$ 14.47%
Macomb County, Michigan
Quarterly Expenditure Report - General Fund Operating Expenditure Summary
Quarter Ended March 31, 2015
Prepared by the Macomb County Finance Department
XP - 6

Adopted Amended QTD Prior Year YTD Prior Year Favorable %
Description Budget Budget Actual QTD Actual Actual YTD Actual (Unfavorable) Utilized
Board of Commissioners
Full Time Wages 727,611$ 727,611$ 177,018$ 161,207$ 177,018$ 161,207$ 550,593$ 24.33%
Part Time Wages 13,864 13,864 4,004 3,410 4,004 3,410 9,860 28.88%
FICA/Medicare 56,723 56,723 13,716 12,381 13,716 12,381 43,007 24.18%
Pension/Retiree Health Care 272,015 272,015 47,460 40,775 47,460 40,775 224,555 17.45%
Employee Health/Dental/Life Ins 229,644 229,644 47,902 28,915 47,902 28,915 181,742 20.86%
Workers Comp/Unemployment/Other 10,478 10,478 1,275 955 1,275 955 9,203 12.17%
Supplies & Services 22,850 22,850 2,695 2,356 2,695 2,356 20,155 11.79%
Conferences & Training 13,450 13,450 4,767 4,398 4,767 4,398 8,683 35.44%
Repairs & Maintenance 7,000 7,000 - - - - 7,000 0.00%
Contract Services 190,400 190,400 6,066 3,335 6,066 3,335 184,334 3.19%
Internal Services 26,674 26,674 7,007 3,815 7,007 3,815 19,667 26.27%
Capital Outlay - - - - - - - 0.00%
1,570,709 1,570,709 311,910 261,547 311,910 261,547 1,258,799 19.86%
Circuit Court
Full Time Wages 4,157,769 4,157,769 928,256 807,326 928,256 807,326 3,229,513 22.33%
Part Time Wages 44,604 44,604 7,507 9,407 7,507 9,409 37,097 16.83%
Overtime Wages - - 530 5,038 530 5,038 (530) 100.00%
FICA/Medicare 321,499 321,499 60,917 52,102 60,917 52,102 260,582 18.95%
Pension/Retiree Health Care 1,340,081 1,340,081 279,278 224,439 279,278 224,439 1,060,803 20.84%
Employee Health/Dental/Life Ins 1,009,310 1,009,310 223,103 157,508 223,103 157,508 786,207 22.10%
Workers Comp/Unemployment/Other 58,399 58,399 10,182 8,732 10,182 8,732 48,217 17.44%
Supplies & Services 4,124,891 4,119,741 835,912 755,959 835,912 755,959 3,283,829 20.29%
Conferences & Training 25,000 25,000 7,233 6,295 7,233 6,295 17,767 28.93%
Repairs & Maintenance 6,750 6,750 149 - 149 - 6,601 2.21%
Contract Services 37,500 42,600 10,770 6,093 10,770 6,093 31,830 25.28%
Internal Services 121,759 121,759 33,090 13,718 33,090 13,718 88,669 27.18%
Capital Outlay - 50 59 - 59 - (9) 118.00%
11,247,562 11,247,562 2,396,986 2,046,617 2,396,986 2,046,619 8,850,576 21.31%
Family Counseling
Full Time Wages 35,860 35,860 8,400 4,688 8,400 4,688 27,460 23.42%
FICA/Medicare 2,743 2,743 643 359 643 359 2,100 23.44%
Pension/Retiree Health Care 14,290 14,290 3,443 1,348 3,443 1,348 10,847 24.09%
Employee Health/Dental/Life Ins 12,758 12,758 3,192 951 3,192 951 9,566 25.02%
Workers Comp/Unemployment/Other 505 505 35 64 35 64 470 6.93%
Supplies & Services 2,000 2,000 26 137 26 137 1,974 1.30%
Repairs & Maintenance 175 175 - - - - 175 0.00%
Contract Services 115,000 115,000 16,731 20,901 16,731 20,901 98,269 14.55%
Internal Services 3,002 3,002 570 430 570 430 2,432 18.99%
186,333 186,333 33,040 28,878 33,040 28,878 153,293 17.73%
District Court-Romeo
Full Time Wages 520,309 520,309 97,577 123,562 97,577 123,562 422,732 18.75%
Part Time Wages 34,222 34,222 4,130 4,262 4,130 4,262 30,092 100.00%
FICA/Medicare 42,422 42,422 6,899 8,934 6,899 8,934 35,523 16.26%
Pension/Retiree Health Care 190,629 190,629 36,384 41,553 36,384 41,553 154,245 19.09%
Employee Health/Dental/Life Ins 153,096 153,096 28,105 28,720 28,105 28,720 124,991 18.36%
Workers Comp/Unemployment/Other 7,775 7,775 1,223 1,444 1,223 1,444 6,552 15.73%
Supplies & Services 143,480 142,409 26,054 21,577 26,054 21,577 116,355 18.30%
Conferences & Training 1,600 1,600 969 543 969 543 631 60.56%
Repairs & Maintenance 7,000 7,000 1,577 120 1,577 120 5,423 22.53%
Contract Services 1,000 1,000 - - - - 1,000 0.00%
Internal Services 25,266 26,337 6,549 4,197 6,549 4,197 19,788 24.87%
1,126,799 1,126,799 209,467 234,912 209,467 234,912 917,332 18.59%
Macomb County, Michigan
Quarterly Expenditure Report
Quarter Ended March 31, 2015
General Fund (Dec 31 Year End)
Prepared by the Macomb County Finance DepartmentXP - 7

Macomb County, Michigan
Quarterly Expenditure Report
Quarter Ended March 31, 2015
Adopted Amended QTD Prior Year YTD Prior Year Favorable %
Description Budget Budget Actual QTD Actual Actual YTD Actual (Unfavorable) Utilized
District Court-3rd Class
Supplies & Services 25,000$ 25,000$ 1,254$ 2,357$ 1,254$ 2,357$ 23,746$ 5.02%
District Court New Baltimore
Full Time Wages 641,106 641,106 143,624 150,809 143,624 150,809 497,482 22.40%
Part Time Wages 49,298 49,298 11,945 11,945 11,945 11,945 37,353 24.23%
Overtime Wages - - 3,000 3,893 3,000 3,893 (3,000) 100.00%
FICA/Medicare 52,816 52,816 10,997 11,613 10,997 11,613 41,819 20.82%
Pension/Retiree Health Care 246,620 246,620 53,181 52,148 53,181 52,148 193,439 21.56%
Employee Health/Dental/Life Ins 204,128 204,128 47,865 44,643 47,865 44,643 156,263 23.45%
Workers Comp/Unemployment/Other 9,680 9,680 1,727 1,796 1,727 1,796 7,953 17.84%
Supplies & Services 191,490 190,790 25,296 32,696 25,296 32,696 165,494 13.26%
Conferences & Training 500 1,200 356 - 356 - 844 29.67%
Repairs & Maintenance 850 850 - - - - 850 0.00%
Contract Services 3,000 3,000 145 150 145 150 2,855 4.83%
Internal Services 26,967 26,967 6,739 4,190 6,739 4,190 20,228 24.99%
1,426,455 1,426,455 304,875 313,883 304,875 313,883 1,121,580 21.37%
Law Library
Supplies & Services 35,400 35,400 - 8,148 - 8,148 35,400 0.00%
Internal Services 400 400 99 99 99 99 301 24.75%
35,800 35,800 99 8,247 99 8,247 35,701 0.28%
Probate Court
Full Time Wages 1,586,636 1,586,636 339,415 372,913 339,415 372,913 1,247,221 21.39%
Part Time Wages 15,806 15,806 - 3,040 - 3,040 15,806 0.00%
Overtime Wages - - 571 - 571 - (571) 100.00%
FICA/Medicare 119,745 119,745 25,800 28,539 25,800 28,539 93,945 21.55%
Pension/Retiree Health Care 483,617 483,617 99,092 102,920 99,092 102,920 384,525 20.49%
Employee Health/Dental/Life Ins 344,466 344,466 73,128 64,873 73,128 64,873 271,338 21.23%
Workers Comp/Unemployment/Other 22,385 22,385 3,830 4,269 3,830 4,269 18,555 17.11%
Supplies & Services 392,450 392,450 77,765 87,092 77,765 87,092 314,685 19.82%
Conferences & Training 2,000 2,000 - - - - 2,000 0.00%
Repairs & Maintenance 4,000 4,000 - 85 - 85 4,000 0.00%
Contract Services 36,750 36,750 6,000 7,090 6,000 7,090 30,750 16.33%
Internal Services 49,935 49,935 13,529 5,956 13,529 5,956 36,406 27.09%
3,057,790 3,057,790 639,130 676,777 639,130 676,777 2,418,660 20.90%
Juvenile Court
Full Time Wages 2,541,145 2,541,145 510,891 537,023 510,891 537,023 2,030,254 20.10%
FICA/Medicare 194,398 194,398 38,871 40,747 38,871 40,747 155,527 20.00%
Pension/Retiree Health Care 794,804 794,804 162,343 160,910 162,343 160,910 632,461 20.43%
Employee Health/Dental/Life Ins 586,868 586,868 119,041 102,958 119,041 102,958 467,827 20.28%
Workers Comp/Unemployment/Other 35,569 35,569 6,528 6,229 6,528 6,229 29,041 18.35%
Supplies & Services 935,675 933,675 152,284 131,316 152,284 131,316 781,391 16.31%
Conferences & Training 10,000 10,000 875 910 875 910 9,125 8.75%
Repairs & Maintenance 4,000 4,000 - - - - 4,000 0.00%
Vehicle Operations 2,500 2,500 - - - - 2,500 0.00%
Contract Services 10,000 12,000 1,500 538 1,500 538 10,500 12.50%
Internal Services 83,659 83,659 22,594 11,758 22,594 11,758 61,065 27.01%
5,198,618 5,198,618 1,014,927 992,389 1,014,927 992,389 4,183,691 19.52%
Probation - Circuit Court
Supplies & Services 53,600 53,600 8,837 7,927 8,837 7,927 44,763 16.49%
Repairs & Maintenance 9,500 9,500 89 - 89 - 9,411 0.94%
Internal Services 55,500 55,500 13,311 13,820 13,311 13,820 42,189 23.98%
118,600 118,600 22,237 21,747 22,237 21,747 96,363 18.75%
General Fund (Dec 31 Year End)
Prepared by the Macomb County Finance DepartmentXP - 8
Macomb County, Michigan
Quarterly Expenditure Report
Quarter Ended March 31, 2015
Adopted Amended QTD Prior Year YTD Prior Year Favorable %
Description Budget Budget Actual QTD Actual Actual YTD Actual (Unfavorable) Utilized
Probation - District Court
Full Time Wages 269,861$ 269,861$ 61,307$ 64,844$ 61,307$ 64,844$ 208,554$ 22.72%
FICA/Medicare 20,644 20,644 4,631 4,905 4,631 4,905 16,013 22.43%
Pension/Retiree Health Care 85,413 85,413 20,097 19,374 20,097 19,374 65,316 23.53%
Employee Health/Dental/Life Ins 63,790 63,790 15,960 14,263 15,960 14,263 47,830 25.02%
Workers Comp/Unemployment/Other 3,793 3,793 850 772 850 772 2,943 22.41%
Supplies & Services 20,750 20,750 3,556 1,440 3,556 1,440 17,194 17.14%
Conferences & Training 2,500 2,500 1,917 1,140 1,917 1,140 583 76.68%
Repairs & Maintenance 450 450 - - - - 450 0.00%
Internal Services 5,678 5,678 1,389 430 1,389 430 4,289 24.46%
472,879 472,879 109,707 107,168 109,707 107,168 363,172 23.20%
Jury Commission
Supplies & Services 48,350 48,350 21,048 1,306 21,048 1,306 27,302 43.53%
Utilities 3,000 3,000 472 484 472 484 2,528 15.73%
Repairs & Maintenance 12,050 12,050 10 - 10 - 12,040 0.08%
Contract Services 120,000 120,000 - - - - 120,000 0.00%
Internal Services 300 300 - - - - 300 0.00%
183,700 183,700 21,530 1,790 21,530 1,790 162,170 11.72%
Prosecuting Attorney
Full Time Wages 5,755,444 5,755,444 1,261,782 1,312,700 1,261,782 1,312,700 4,493,662 21.92%
Part Time Wages 124,507 124,507 56,855 54,982 56,855 54,982 67,652 100.00%
FICA/Medicare 449,817 449,817 99,620 103,546 99,620 103,546 350,197 22.15%
Pension/Retiree Health Care 1,630,245 1,630,245 356,482 351,684 356,482 351,684 1,273,763 21.87%
Employee Health/Dental/Life Ins 1,058,914 1,058,914 229,211 204,261 229,211 204,261 829,703 21.65%
Workers Comp/Unemployment/Other 82,157 82,157 16,951 17,414 16,951 17,414 65,206 20.63%
Supplies & Services 339,600 339,600 44,651 35,923 44,651 35,923 294,949 13.15%
Repairs & Maintenance 4,000 4,000 - - - - 4,000 0.00%
Vehicle Operations 3,300 3,300 367 154 367 154 2,933 11.12%
Internal Services 137,377 137,377 33,868 12,791 33,868 12,791 103,509 24.65%
9,585,361 9,585,361 2,099,787 2,093,455 2,099,787 2,093,455 7,485,574 21.91%
County Executive
Full Time Wages 774,183 774,183 194,677 189,381 194,677 189,381 579,506 25.15%
FICA/Medicare 56,914 56,914 14,893 14,485 14,893 14,485 42,021 26.17%
Pension/Retiree Health Care 198,219 198,219 47,621 45,337 47,621 45,337 150,598 24.02%
Employee Health/Dental/Life Ins 114,822 114,822 19,454 11,571 19,454 11,571 95,368 16.94%
Workers Comp/Unemployment/Other 10,719 10,719 2,174 2,180 2,174 2,180 8,545 20.28%
Supplies & Services 25,500 27,500 4,203 6,530 4,203 6,530 23,297 15.28%
Conferences & Training 10,000 10,000 981 6,190 981 6,190 9,019 9.81%
Repairs & Maintenance 2,900 2,900 - - - - 2,900 0.00%
Vehicle Operations 6,000 6,000 984 245 984 245 5,016 16.40%
Contract Services 187,500 185,500 12,350 15,000 12,350 15,000 173,150 6.66%
Internal Services 24,715 24,715 6,165 3,267 6,165 3,267 18,550 24.94%
1,411,472 1,411,472 303,502 294,186 303,502 294,186 1,107,970 21.50%
General Fund (Dec 31 Year End)
Prepared by the Macomb County Finance DepartmentXP - 9
Macomb County, Michigan
Quarterly Expenditure Report
Quarter Ended March 31, 2015
Adopted Amended QTD Prior Year YTD Prior Year Favorable %
Description Budget Budget Actual QTD Actual Actual YTD Actual (Unfavorable) Utilized
Ethics Board
Supplies & Services 9,000 9,000 - 2 - 2 9,000 0.00%
Contract Services 50,000 50,000 - - - - 50,000 0.00%
59,000 59,000 - 2 - 2 59,000 0.00%
Elections
Supplies & Services 27,650 27,650 1,809 3,678 1,809 3,678 25,841 6.54%
Repairs & Maintenance 850 850 - - - - 850 0.00%
Internal Services 1,300 1,300 316 316 316 316 984 24.31%
29,800 29,800 2,125 3,994 2,125 3,994 27,675 7.13%
Information Technology
Full Time Wages 2,453,832 2,453,832 468,443 533,648 468,443 533,648 1,985,389 19.09%
Part Time Wages 17,105 17,105 5,457 2,417 5,457 2,417 11,648 31.90%
Overtime Wages 100,000 100,000 52,215 21,522 52,215 21,522 47,785 52.22%
FICA/Medicare 195,871 195,871 39,686 42,111 39,686 42,111 156,185 20.26%
Pension/Retiree Health Care 703,038 703,038 143,880 144,920 143,880 144,920 559,158 20.47%
Employee Health/Dental/Life Ins 446,530 446,530 86,453 76,289 86,453 76,289 360,077 19.36%
Workers Comp/Unemployment/Other 34,829 34,829 6,387 6,971 6,387 6,971 28,442 18.34%
Supplies & Services 59,750 59,550 10,614 8,925 10,614 8,925 48,936 17.82%
Conferences & Training 39,000 38,500 15,480 9,833 15,480 9,833 23,020 40.21%
Repairs & Maintenance 1,701,500 1,701,500 1,499,770 1,238,546 1,499,770 1,238,546 201,730 88.14%
Vehicle Operations 500 500 (425) 49 (425) 49 925 -85.00%
Contract Services 320,000 320,000 56,510 56,895 56,510 56,895 263,490 17.66%
Internal Services 62,046 62,046 15,442 5,655 15,442 5,655 46,604 24.89%
Capital Outlay - 700 - - - - 700 0.00%
6,134,001 6,134,001 2,399,912 2,147,781 2,399,912 2,147,781 3,734,089 39.12%
Reimbursement
Full Time Wages - - - 97,602 - 97,602 - 0.00%
FICA/Medicare - - - 7,445 - 7,445 - 0.00%
Pension/Retiree Health Care - - - 33,800 - 33,800 - 0.00%
Employee Health/Dental/Life Ins - - - 28,422 - 28,422 - 0.00%
Workers Comp/Unemployment/Other - - - 1,286 - 1,286 - 0.00%
Supplies & Services - - - 3,566 - 3,566 - 0.00%
Internal Services - - - 1,169 - 1,169 - 0.00%
- - - 173,290 - 173,290 - 0.00%
Corporation Counsel
Full Time Wages 565,441 565,441 133,574 108,006 133,574 108,006 431,867 23.62%
Part Time Wages 26,560 26,560 - - - - 26,560 100.00%
FICA/Medicare 44,646 44,646 10,179 8,225 10,179 8,225 34,467 22.80%
Pension/Retiree Health Care 152,607 152,607 35,110 27,904 35,110 27,904 117,497 23.01%
Employee Health/Dental/Life Ins 89,306 89,306 20,894 17,129 20,894 17,129 68,412 23.40%
Workers Comp/Unemployment/Other 8,225 8,225 1,786 1,525 1,786 1,525 6,439 21.71%
Supplies & Services 21,350 21,350 3,331 2,967 3,331 2,967 18,019 15.60%
Repairs & Maintenance 1,000 1,000 - - - - 1,000 0.00%
Internal Services 15,739 15,739 3,942 1,819 3,942 1,819 11,797 25.05%
924,874 924,874 208,816 167,575 208,816 167,575 716,058 22.58%
General Fund (Dec 31 Year End)
Prepared by the Macomb County Finance DepartmentXP - 10

Macomb County, Michigan
Quarterly Expenditure Report
Quarter Ended March 31, 2015
Adopted Amended QTD Prior Year YTD Prior Year Favorable %
Description Budget Budget Actual QTD Actual Actual YTD Actual (Unfavorable) Utilized
County Clerk
Full Time Wages 2,470,146$ 2,470,996$ 533,749$ 498,748$ 533,749$ 498,748$ 1,937,247$ 21.60%
Part Time Wages - - - 13,197 - 13,197 - 0.00%
Overtime Wages 13,463 13,463 3,624 17,648 3,624 17,648 9,839 26.92%
FICA/Medicare 189,697 189,762 40,380 39,542 40,380 39,542 149,382 21.28%
Pension/Retiree Health Care 908,572 908,703 203,554 179,906 203,554 179,906 705,149 22.40%
Employee Health/Dental/Life Ins 765,480 765,480 162,362 130,892 162,362 130,892 603,118 21.21%
Workers Comp/Unemployment/Other 34,864 34,876 6,779 6,738 6,779 6,738 28,097 19.44%
Supplies & Services 307,760 304,202 31,218 52,972 31,218 52,972 272,984 10.26%
Repairs & Maintenance 13,000 15,500 10,514 1,577 10,514 1,577 4,986 67.83%
Vehicle Operations 1,100 1,100 91 - 91 - 1,009 8.27%
Contract Services 3,944 3,944 - - - - 3,944 0.00%
Internal Services 91,260 91,260 22,547 13,700 22,547 13,700 68,713 24.71%
Capital Outlay - - - 8,980 - 8,980 - 0.00%
4,799,286 4,799,286 1,014,818 963,900 1,014,818 963,900 3,784,468 21.15%
Finance Department
Full Time Wages 1,334,922 1,334,922 257,771 276,250 257,771 276,250 1,077,151 19.31%
Overtime Wages - - - 203 - 203 - 0.00%
FICA/Medicare 101,440 101,440 19,480 20,883 19,480 20,883 81,960 19.20%
Pension/Retiree Health Care 370,945 370,945 78,695 77,909 78,695 77,909 292,250 21.21%
Employee Health/Dental/Life Ins 276,424 276,424 58,650 53,738 58,650 53,738 217,774 21.22%
Workers Comp/Unemployment/Other 18,646 18,646 2,975 3,175 2,975 3,175 15,671 15.96%
Supplies & Services 51,925 51,525 13,277 8,556 13,277 8,556 38,248 25.77%
Conferences & Training 4,000 4,000 766 306 766 306 3,234 19.15%
Repairs & Maintenance 2,200 2,200 - - - - 2,200 0.00%
Internal Services 50,437 50,437 12,261 4,666 12,261 4,666 38,176 24.31%
Capital Outlay - 400 - - - - 400 0.00%
2,210,939 2,210,939 443,875 445,686 443,875 445,686 1,767,064 20.08%
Equalization
Full Time Wages 535,098 535,098 118,293 118,822 118,293 118,822 416,805 22.11%
Part Time Wages - - - - - - - 0.00%
FICA/Medicare 40,935 40,935 9,033 9,056 9,033 9,056 31,902 22.07%
Pension/Retiree Health Care 170,112 170,112 39,373 36,138 39,373 36,138 130,739 23.15%
Employee Health/Dental/Life Ins 127,580 127,580 31,465 26,247 31,465 26,247 96,115 24.66%
Workers Comp/Unemployment/Other 7,508 7,508 1,450 1,416 1,450 1,416 6,058 19.31%
Supplies & Services 21,400 21,400 3,731 2,047 3,731 2,047 17,669 17.43%
Conferences & Training 7,500 7,500 - - - - 7,500 0.00%
Repairs & Maintenance 1,000 1,000 - - - - 1,000 0.00%
Internal Services 18,491 18,491 3,765 1,848 3,765 1,848 14,726 20.36%
929,624 929,624 207,110 195,574 207,110 195,574 722,514 22.28%
General Fund (Dec 31 Year End)
Prepared by the Macomb County Finance DepartmentXP - 11

Macomb County, Michigan
Quarterly Expenditure Report
Quarter Ended March 31, 2015
Adopted Amended QTD Prior Year YTD Prior Year Favorable %
Description Budget Budget Actual QTD Actual Actual YTD Actual (Unfavorable) Utilized
Human Resources
Full Time Wages 1,198,895$ 1,238,947$ 274,888$ 264,196$ 274,888$ 264,196$ 964,059$ 22.19%
Part Time Wages - - 8,475 4,739 8,475 4,739 (8,475) 100.00%
Overtime Wages - - 238 - 238 - (238) 100.00%
FICA/Medicare 90,971 94,035 21,129 19,989 21,129 19,989 72,906 22.47%
Pension/Retiree Health Care 377,589 390,335 88,002 81,989 88,002 81,989 302,333 22.55%
Employee Health/Dental/Life Ins 280,676 290,245 63,887 59,797 63,887 59,797 226,358 22.01%
Workers Comp/Unemployment/Other 16,772 17,341 3,725 3,601 3,725 3,601 13,616 21.48%
Supplies & Services 85,650 85,650 21,135 11,557 21,135 11,557 64,515 24.68%
Conferences & Training 15,000 15,000 45 5,701 45 5,701 14,955 0.30%
Repairs & Maintenance 2,750 2,750 - - - - 2,750 0.00%
Contract Services 34,000 34,000 2,416 8,083 2,416 8,083 31,584 7.11%
Internal Services 34,186 34,186 8,996 4,122 8,996 4,122 25,190 26.31%
2,136,489 2,202,489 492,936 463,774 492,936 463,774 1,709,553 22.38%
Purchasing
Full Time Wages 675,348 675,348 138,700 124,452 138,700 124,452 536,648 20.54%
Part Time Wages - - 4,398 4,804 4,398 4,804 (4,398) 100.00%
Overtime Wages - - 6,408 7,687 6,408 7,687 (6,408) 100.00%
FICA/Medicare 51,664 51,664 11,264 10,422 11,264 10,422 40,400 21.80%
Pension/Retiree Health Care 235,539 235,539 50,024 42,249 50,024 42,249 185,515 21.24%
Employee Health/Dental/Life Ins 191,370 191,370 42,914 33,315 42,914 33,315 148,456 22.42%
Workers Comp/Unemployment/Other 9,470 9,470 1,636 1,300 1,636 1,300 7,834 17.28%
Supplies & Services 78,020 78,020 15,803 15,437 15,803 15,437 62,217 20.26%
Conferences & Training 500 500 - - - - 500 0.00%
Repairs & Maintenance 53,600 53,600 1,146 3,433 1,146 3,433 52,454 2.14%
Vehicle Operations 20,000 20,000 1,340 1,933 1,340 1,933 18,660 6.70%
Internal Services 53,656 53,656 12,126 9,581 12,126 9,581 41,530 22.60%
Capital Outlay 30,000 30,000 - - - - 30,000 0.00%
1,399,167 1,399,167 285,759 254,613 285,759 254,613 1,113,408 20.42%
Register of Deeds
Full Time Wages 912,028 912,028 195,867 195,564 195,867 195,564 716,161 21.48%
Part Time Wages - - 5,897 8,195 5,897 8,195 (5,897) 100.00%
Overtime Wages - - 445 2,748 445 2,748 (445) 100.00%
FICA/Medicare 70,070 70,070 15,086 15,526 15,086 15,526 54,984 21.53%
Pension/Retiree Health Care 359,635 359,635 80,884 74,222 80,884 74,222 278,751 22.49%
Employee Health/Dental/Life Ins 318,950 318,950 71,849 57,230 71,849 57,230 247,101 22.53%
Workers Comp/Unemployment/Other 12,773 12,773 2,764 2,782 2,764 2,782 10,009 21.64%
Supplies & Services 122,574 122,574 11,569 15,485 11,569 15,485 111,005 9.44%
Conferences & Training 1,000 1,000 - 70 - 70 1,000 0.00%
Repairs & Maintenance 2,000 2,000 - - - - 2,000 0.00%
Internal Services 22,480 22,480 4,759 2,524 4,759 2,524 17,721 21.17%
1,821,510 1,821,510 389,120 374,346 389,120 374,346 1,432,390 21.36%
Treasurer
Full Time Wages 1,258,899 1,258,899 284,676 286,420 284,676 286,420 974,223 22.61%
Part Time Wages 34,210 34,210 6,173 7,496 6,173 7,496 28,037 18.04%
FICA/Medicare 98,924 98,924 21,929 22,129 21,929 22,129 76,995 22.17%
Pension/Retiree Health Care 427,158 427,158 97,127 91,041 97,127 91,041 330,031 22.74%
Employee Health/Dental/Life Ins 331,708 331,708 78,318 61,835 78,318 61,835 253,390 23.61%
Workers Comp/Unemployment/Other 18,164 18,164 3,693 3,651 3,693 3,651 14,471 20.33%
Supplies & Services 84,850 84,850 15,206 11,218 15,206 11,218 69,644 17.92%
Repairs & Maintenance 3,000 3,000 840 788 840 788 2,160 28.00%
Vehicle Operations 4,000 4,000 105 101 105 101 3,895 2.63%
Internal Services 35,485 35,485 8,437 4,120 8,437 4,120 27,048 23.78%
2,296,398 2,296,398 516,504 488,799 516,504 488,799 1,779,894 22.49%
General Fund (Dec 31 Year End)
Prepared by the Macomb County Finance DepartmentXP - 12

Macomb County, Michigan
Quarterly Expenditure Report
Quarter Ended March 31, 2015
Adopted Amended QTD Prior Year YTD Prior Year Favorable %
Description Budget Budget Actual QTD Actual Actual YTD Actual (Unfavorable) Utilized
Building Authority
Supplies & Services 1,300$ 1,300$ -$ 105$ -$ 105$ 1,300$ 0.00%
Facilities and Operations
Full Time Wages 4,093,520 4,093,520 950,022 937,728 950,022 937,728 3,143,498 23.21%
Part Time Wages 74,208 74,208 15,824 9,629 15,824 9,629 58,384 21.32%
Overtime Wages 425,000 425,000 131,859 176,668 131,859 176,668 293,141 31.03%
FICA/Medicare 334,414 334,414 83,175 85,300 83,175 85,300 251,239 24.87%
Pension/Retiree Health Care 1,514,119 1,514,119 358,887 338,514 358,887 338,514 1,155,232 23.70%
Employee Health/Dental/Life Ins 1,173,736 1,173,736 280,874 238,196 280,874 238,196 892,862 23.93%
Workers Comp/Unemployment/Other 59,709 59,709 12,360 12,473 12,360 12,473 47,349 20.70%
Supplies & Services 662,690 662,790 340,544 263,617 340,544 263,617 322,246 51.38%
Utilities 3,090,500 3,090,500 563,632 624,012 563,632 624,012 2,526,868 18.24%
Repairs & Maintenance 2,790,750 2,790,750 528,883 436,554 528,883 436,554 2,261,867 18.95%
Vehicle Operations 57,500 57,500 10,729 6,426 10,729 6,426 46,771 18.66%
Contract Services 262,600 262,600 47,191 51,590 47,191 51,590 215,409 17.97%
Internal Services 246,211 246,211 32,288 15,260 32,288 15,260 213,923 13.11%
Capital Outlay 89,000 88,900 243 5,384 243 5,384 88,657 0.27%
14,873,957 14,873,957 3,356,511 3,201,351 3,356,511 3,201,351 11,517,446 22.57%
MSU Extension
Full Time Wages 238,443 238,443 55,331 55,728 55,331 55,728 183,112 23.21%
Part Time Wages 15,870 15,870 - - - - 15,870 0.00%
FICA/Medicare 19,455 19,455 4,179 4,188 4,179 4,188 15,276 21.48%
Pension/Retiree Health Care 91,775 91,775 21,395 19,843 21,395 19,843 70,380 23.31%
Employee Health/Dental/Life Ins 76,548 76,548 18,952 16,833 18,952 16,833 57,596 24.76%
Workers Comp/Unemployment/Other 3,574 3,574 749 753 749 753 2,825 20.96%
Supplies & Services 6,300 11,150 4,503 80,415 4,503 80,415 6,647 40.39%
Room & Board 414,536 404,686 - - - - 404,686 0.00%
Repairs & Maintenance 1,000 6,000 2,223 - 2,223 - 3,777 37.05%
Contract Services 2,000 2,000 - - - - 2,000 0.00%
Internal Services 30,860 30,860 8,196 6,382 8,196 6,382 22,664 26.56%
900,361 900,361 115,528 184,142 115,528 184,142 784,833 12.83%
Planning & Econ Develop
Full Time Wages 1,664,464 1,664,464 365,721 322,745 365,721 322,745 1,298,743 21.97%
Part Time Wages 8,830 8,830 - 307 - 307 8,830 0.00%
FICA/Medicare 127,466 127,466 27,801 24,570 27,801 24,570 99,665 21.81%
Pension/Retiree Health Care 485,782 485,782 109,020 88,515 109,020 88,515 376,762 22.44%
Employee Health/Dental/Life Ins 331,708 331,708 76,874 55,228 76,874 55,228 254,834 23.18%
Workers Comp/Unemployment/Other 23,480 23,480 4,618 4,094 4,618 4,094 18,862 19.67%
Supplies & Services 216,700 216,400 52,020 41,641 52,020 41,641 164,380 24.04%
Conferences & Training 10,000 10,000 1,156 4,344 1,156 4,344 8,844 11.56%
Repairs & Maintenance 49,000 47,500 34,074 33,634 34,074 33,634 13,426 71.73%
Vehicle Operations 3,700 5,200 1,604 137 1,604 137 3,596 30.85%
Contract Services 70,000 70,000 7,500 6,160 7,500 6,160 62,500 10.71%
Internal Services 40,206 40,206 9,855 3,972 9,855 3,972 30,351 24.51%
Capital Outlay - 300 242 - 242 - 58 80.67%
3,031,336 3,031,336 690,485 585,347 690,485 585,347 2,340,851 22.78%
General Fund (Dec 31 Year End)
Prepared by the Macomb County Finance DepartmentXP - 13

Macomb County, Michigan
Quarterly Expenditure Report
Quarter Ended March 31, 2015
Adopted Amended QTD Prior Year YTD Prior Year Favorable %
Description Budget Budget Actual QTD Actual Actual YTD Actual (Unfavorable) Utilized
Plat Board
Supplies & Services -$ -$ -$ -$ -$ -$ -$ 0.00%
Civil Service Comm
Supplies & Services 19,700 19,700 4,739 1,386 4,739 1,386 14,961 24.06%
Contract Services 16,000 16,000 2,292 (275) 2,292 (275) 13,708 14.33%
35,700 35,700 7,031 1,111 7,031 1,111 28,669 19.69%
Sheriff
Full Time Wages 29,751,884 30,321,425 6,319,140 6,193,310 6,319,140 6,193,310 24,002,285 20.84%
Part Time Wages 855,419 855,419 217,235 222,630 217,235 222,630 638,184 25.40%
Overtime Wages 2,844,500 2,904,500 772,793 710,555 772,793 710,555 2,131,707 26.61%
FICA/Medicare 2,380,979 2,429,139 556,006 541,478 556,006 541,478 1,873,133 22.89%
Pension/Retiree Health Care 9,306,244 9,487,068 2,435,855 2,257,003 2,435,855 2,257,003 7,051,213 25.68%
Employee Health/Dental/Life Ins 6,353,484 6,468,306 1,435,323 1,220,751 1,435,323 1,220,751 5,032,983 22.19%
Workers Comp/Unemployment/Other 1,007,950 1,029,375 238,383 232,440 238,383 232,440 790,992 23.16%
Supplies & Services 2,121,695 2,122,645 426,419 409,530 426,419 409,530 1,696,226 20.09%
Conferences & Training 75,000 79,000 33,737 9,000 33,737 9,000 45,263 42.71%
Repairs & Maintenance 299,000 396,000 92,352 67,628 92,352 67,628 303,648 23.32%
Vehicle Operations 884,000 860,317 79,552 54,526 79,552 54,526 780,765 9.25%
Contract Services 5,534,000 5,499,800 1,267,450 1,045,982 1,267,450 1,045,982 4,232,350 23.05%
Internal Services 781,717 788,879 178,768 51,497 178,768 51,497 610,111 22.66%
Capital Outlay 509,621 543,821 - 43,000 - 43,000 543,821 0.00%
62,705,493 63,785,694 14,053,013 13,059,330 14,053,013 13,059,330 49,732,681 22.03%
Emergency Management
Full Time Wages 612,629 662,928 125,280 143,017 125,280 143,017 537,648 18.90%
Part Time Wages 10,780 10,780 5,654 4,296 5,654 4,296 5,126 52.45%
Overtime Wages - - 1,942 315 1,942 315 (1,942) 100.00%
FICA/Medicare 47,455 51,303 10,165 11,294 10,165 11,294 41,138 19.81%
Pension/Retiree Health Care 192,745 209,261 40,385 37,926 40,385 37,926 168,876 19.30%
Employee Health/Dental/Life Ins 141,401 154,159 29,970 22,864 29,970 22,864 124,189 19.44%
Workers Comp/Unemployment/Other 8,478 10,300 1,601 1,581 1,601 1,581 8,699 15.54%
Supplies & Services 10,750 10,860 1,286 1,315 1,286 1,315 9,574 11.84%
Conferences & Training - 90 90 - 90 - - 0.00%
Repairs & Maintenance 9,000 9,500 255 - 255 - 9,245 2.68%
Vehicle Operations 17,500 16,800 1,734 997 1,734 997 15,066 10.32%
Internal Services 44,733 44,733 9,373 8,172 9,373 8,172 35,360 20.95%
1,095,471 1,180,714 227,735 231,777 227,735 231,777 952,979 19.29%
Public Works
Full Time Wages 3,670,172 3,670,172 702,664 739,109 702,664 739,109 2,967,508 19.15%
Part Time Wages 16,740 16,740 43,303 12,234 43,303 12,234 (26,563) 258.68%
Overtime Wages 95,000 95,000 15,383 25,488 15,383 25,488 79,617 16.19%
FICA/Medicare 289,316 289,316 57,799 58,909 57,799 58,909 231,517 19.98%
Pension/Retiree Health Care 1,126,292 1,126,292 208,849 215,337 208,849 215,337 917,443 18.54%
Employee Health/Dental/Life Ins 791,071 791,071 145,622 136,986 145,622 136,986 645,449 18.41%
Workers Comp/Unemployment/Other 51,740 51,740 8,383 8,399 8,383 8,399 43,357 16.20%
Supplies & Services 46,800 46,800 12,679 7,694 12,679 7,694 34,121 27.09%
Room & Board - - (585) - (585) - 585 0.00%
Repairs & Maintenance 2,400 2,400 - 189 - 189 2,400 0.00%
Vehicle Operations 69,000 69,000 5,746 2,530 5,746 2,530 63,254 8.33%
Internal Services 207,548 207,548 24,106 10,639 24,106 10,639 183,442 11.61%
6,366,079 6,366,079 1,223,949 1,217,514 1,223,949 1,217,514 5,142,130 19.23%
General Fund (Dec 31 Year End)
Prepared by the Macomb County Finance DepartmentXP - 14

Macomb County, Michigan
Quarterly Expenditure Report
Quarter Ended March 31, 2015
Adopted Amended QTD Prior Year YTD Prior Year Favorable %
Description Budget Budget Actual QTD Actual Actual YTD Actual (Unfavorable) Utilized
Health Department
Full Time Wages 7,609,428$ 7,609,428$ 1,546,805$ 1,561,684$ 1,546,805$ 1,561,684$ 6,062,623$ 20.33%
Part Time Wages 600,335 600,335 139,893 180,226 139,893 180,226 460,442 23.30%
Overtime Wages 67,242 67,242 36,680 45,482 36,680 45,482 30,562 54.55%
FICA/Medicare 630,712 630,712 130,792 135,609 130,792 135,609 499,920 20.74%
Pension/Retiree Health Care 2,518,496 2,518,496 533,527 506,365 533,527 506,365 1,984,969 21.18%
Employee Health/Dental/Life Ins 1,964,732 1,964,732 391,522 352,292 391,522 352,292 1,573,210 19.93%
Workers Comp/Unemployment/Other 115,130 115,130 19,660 19,533 19,660 19,533 95,470 17.08%
Supplies & Services 3,368,386 3,361,142 282,279 191,475 282,279 191,475 3,078,863 8.40%
Conferences & Training 30,880 37,830 11,565 (443) 11,565 (443) 26,265 30.57%
Repairs & Maintenance 40,814 42,592 4,100 2,368 4,100 2,368 38,492 9.63%
Vehicle Operations 103,035 103,035 6,272 5,960 6,272 5,960 96,763 6.09%
Contract Services 872,410 870,410 130,357 133,909 130,357 133,909 740,053 14.98%
Internal Services 2,229,162 2,229,678 540,743 31,906 540,743 31,906 1,688,935 24.25%
Capital Outlay 97,516 97,516 30,775 11,942 30,775 11,942 66,741 31.56%
20,248,278 20,248,278 3,804,970 3,178,308 3,804,970 3,178,308 16,443,308 18.79%
Health & Community Services
Full Time Wages 178,054 168,254 39,065 30,776 39,065 30,776 129,189 23.22%
Part Time Wages - 9,800 2,188 5,239 2,188 5,239 7,612 0.00%
FICA/Medicare 12,902 12,902 3,129 2,703 3,129 2,703 9,773 24.25%
Pension/Retiree Health Care 44,976 44,976 10,209 8,496 10,209 8,496 34,767 22.70%
Employee Health/Dental/Life Ins 25,516 25,516 6,384 5,712 6,384 5,712 19,132 25.02%
Workers Comp/Unemployment/Other 2,447 2,447 534 435 534 435 1,913 21.82%
Supplies & Services 17,100 6,350 444 477 444 477 5,906 6.99%
Conferences & Training 1,200 11,450 3,447 75 3,447 75 8,003 30.10%
Internal Services 6,492 6,492 933 310 933 310 5,559 14.37%
Capital Outlay - 500 400 - 400 - 100 80.00%
288,687 288,687 66,733 54,223 66,733 54,223 221,954 23.12%
Social Services
Supplies & Services 72,472 72,472 7,969 12,214 7,969 12,214 64,503 11.00%
Senior Citizens Services
Full Time Wages 124,820 124,820 44,433 46,232 44,433 46,232 80,387 35.60%
Part Time Wages - - 6,931 32 6,931 32 (6,931) 100.00%
Overtime Wages - - 260 203 260 203 (260) 100.00%
FICA/Medicare 9,549 9,549 3,916 3,510 3,916 3,510 5,633 41.01%
Pension/Retiree Health Care 45,527 45,527 14,197 15,486 14,197 15,486 31,330 31.18%
Employee Health/Dental/Life Ins 38,274 38,274 10,380 6,076 10,380 6,076 27,894 27.12%
Workers Comp/Unemployment/Other 1,757 1,757 499 581 499 581 1,258 28.40%
Supplies & Services 140,006 139,756 57,044 9,941 57,044 9,941 82,712 40.82%
Conferences & Training 5,000 5,000 - 30 - 30 5,000 0.00%
Repairs & Maintenance 2,250 2,500 - - - - 2,500 0.00%
Contract Services 288,715 288,715 44,501 14,934 44,501 14,934 244,214 15.41%
Internal Services 18,155 18,155 2,931 4,941 2,931 4,941 15,224 16.14%
Capital Outlay 98,453 98,453 49,712 2,584 49,712 2,584 48,741 50.49%
772,506 772,506 234,804 104,550 234,804 104,550 537,702 30.40%
Appropriations
Full Time Wages (5,221,000) (5,221,000) - - - - (5,221,000) 0.00%
FICA/Medicare (399,406) (399,406) - - - - (399,406) 0.00%
Pension/Retiree Health Care (3,281,078) (3,281,078) - - - - (3,281,078) 0.00%
Employee Health/Dental/Life Ins (1,192,800) (1,192,800) - - - - (1,192,800) 0.00%
Workers Comp/Unemployment/Other 75,484 75,484 - - - - 75,484 0.00%
Supplies & Services 1,412,450 1,346,450 129,748 227,268 129,748 227,268 1,216,702 9.64%
Capital Outlay 750,000 550,000 109,699 1,987 109,699 1,987 440,301 19.95%
(7,856,350) (8,122,350) 239,447 229,255 239,447 229,255 (8,361,797) -2.95%
Contributions
Operating transfers out 32,179,921 32,179,921 1,927,400 2,059,818 1,927,400 2,059,818 30,252,521 5.99%
193,103,377$ 194,068,821$ 39,385,001$ 36,882,332$ 39,385,001$ 36,882,334$ 154,683,820$ 20.29%
General Fund (Dec 31 Year End)
Prepared by the Macomb County Finance DepartmentXP - 15

Macomb County, Michigan
Quarterly Expenditure Report
Quarter Ended March 31, 2015
Adopted Amended QTD Prior Year YTD Prior Year Favorable %
Description Budget Budget Actual QTD Actual Actual YTD Actual (Unfavorable) Utilized
Full Time Wages 41,636$ 41,636$ 9,772$ 9,929$ 9,772$ 9,929$ 31,864$ 23.47%
FICA/Medicare 3,185 3,185 723 730 723 730 2,462 22.70%
Pension/Retiree Health Care 15,181 15,181 3,648 3,406 3,648 3,406 11,533 24.03%
Employee Health/Dental/Life Ins 12,758 12,758 3,192 2,853 3,192 2,853 9,566 25.02%
Workers Comp/Unemployment/Other 586 586 136 140 136 140 450 23.21%
Supplies & Services 50,000 154,262 - 8,033 - 8,033 154,262 0.00%
Conferences & Training 15,000 16,865 - - - - 16,865 0.00%
Contract Services 3,000 5,655 - - - - 5,655 0.00%
Internal Services 583 583 146 - 146 - 437 25.04%
Capital Outlay - 28,581 - - - - 28,581 0.00%
141,929$ 279,292$ 17,617$ 25,091$ 17,617$ 25,091$ 261,675$ 6.31%
Adopted Amended QTD Prior Year YTD Prior Year Favorable %
Description Budget Budget Actual QTD Actual Actual YTD Actual (Unfavorable) Utilized
Full Time Wages -$ -$ -$ -$ -$ -$ -$ 0.00%
Supplies & Services 1,172,000 1,215,315 16,794 20,951 16,794 20,951 1,198,521 1.38%
Contract Services 224,415 323,696 15,962 22,811 15,962 22,811 307,734 4.93%
Capital Outlay 20,000 20,000 - - - - 20,000 0.00%
1,416,415$ 1,559,011$ 32,756$ 43,762$ 32,756$ 43,762$ 1,526,255$ 2.10%
Adopted Amended QTD Prior Year YTD Prior Year Favorable %
Description Budget Budget Actual QTD Actual Actual YTD Actual (Unfavorable) Utilized
Full Time Wages 225,682$ 223,686$ 54,731$ -$ 54,731$ -$ 168,955$ 24.47%
Part Time Wages 40,565 40,565 561 5,266 561 5,266 40,004 1.38%
FICA/Medicare 20,367 20,367 4,197 402 4,197 402 16,170 20.61%
Pension/Retiree Health Care 78,363 78,363 16,682 2,679 16,682 2,679 61,681 21.29%
Employee Health/Dental/Life Ins 45,934 45,934 11,205 - 11,205 - 34,729 24.39%
Workers Comp/Unemployment/Other 3,138 3,138 734 15 734 15 2,404 23.39%
Supplies & Services 5,912,389 5,945,427 624,179 4,325 624,179 4,325 5,321,248 10.50%
Conferences & Training 14,000 13,000 410 - 410 - 12,590 3.15%
Contract Services 148,504 148,504 - - - - 148,504 0.00%
Internal Services 7,677 7,677 1,760 - 1,760 - 5,917 22.93%
Transfers Out 60,000 60,000 - - - - 60,000 0.00%
6,556,619$ 6,586,661$ 714,459$ 12,687$ 714,459$ 12,687$ 5,872,202$ 10.85%
Community Services Fund (Dec 31 Year End)
Community Corrections (Dec 31 Year End)
Community Development Block Grant Fund (Dec 31 Year End)
Prepared by the Macomb County Finance DepartmentXP - 16

Macomb County, Michigan
Quarterly Expenditure Report
Quarter Ended March 31, 2015
Adopted Amended QTD Prior Year YTD Prior Year Favorable %
Description Budget Budget Actual QTD Actual Actual YTD Actual (Unfavorable) Utilized
Supplies & Services 122,025$ 122,025$ 3,806$ 30,634$ 3,806$ 30,634$ 118,219$ 3.12%
Debt service - principal 11,547,974 11,547,974 1,650,000 1,695,000 1,650,000 1,695,000 9,897,974 14.29%
Interest and fees 13,291,667 13,291,667 277,400 347,766 277,400 347,766 13,014,267 2.09%
Payment to Refunding Agent - - - - - - - 0.00%
24,961,666$ 24,961,666$ 1,931,206$ 2,073,400$ 1,931,206$ 2,073,400$ 23,030,460$ 7.74%
Adopted Amended QTD Prior Year YTD Prior Year Favorable %
Description Budget Budget Actual QTD Actual Actual YTD Actual (Unfavorable) Utilized
Overtime Wages -$ -$ 1,395$ 1,411$ 1,395$ 1,411$ (1,395)$ 100.00%
FICA/Medicare - - 106 107 106 107 (106) 100.00%
Pension/Retiree Health Care - - 370 243 370 243 (370) 100.00%
Employee Health/Dental/Life Ins - - 238 51 238 51 (238) 100.00%
Workers Comp/Unemployment/Other - - 5 7 5 7 (5) 100.00%
Supplies & Services 182,000 208,000 6,547 6,860 6,547 6,860 201,453 3.15%
Utilities 158,000 158,000 16,493 27,122 16,493 27,122 141,507 10.44%
Repairs & Maintenance 42,000 42,000 655 3,096 655 3,096 41,345 1.56%
Contract Services 26,000 - - - - - - 0.00%
Internal Services 500 500 111 108 111 108 389 22.20%
408,500$ 408,500$ 25,920$ 39,005$ 25,920$ 39,005$ 382,580$ 6.35%
Adopted Amended QTD Prior Year YTD Prior Year Favorable %
Description Budget Budget Actual QTD Actual Actual YTD Actual (Unfavorable) Utilized
Full Time Wages -$ -$ -$ -$ -$ -$ -$ 0.00%
Supplies & Services 27,300 58,142 23 - 23 - 58,119 0.04%
Conferences & Training 2,100 4,744 - - - - 4,744 0.00%
Repairs & Maintenance 40,000 40,000 - - - - 40,000 0.00%
Contract Services 100,000 101,685 2,159 2,143 2,159 2,143 99,526 2.12%
Capital Outlay 25,000 28,720 3,256 - 3,256 - 25,464 11.34%
194,400$ 233,291$ 5,438$ 2,143$ 5,438$ 2,143$ 227,853$ 2.33%
Adopted Amended QTD Prior Year YTD Prior Year Favorable %
Description Budget Budget Actual QTD Actual Actual YTD Actual (Unfavorable) Utilized
Full Time Wages 191,827$ 191,827$ 40,753$ 40,983$ 40,753$ 40,983$ 151,074$ 21.24%
Part Time Wages - - 13,289 30,062 13,289 30,062 (13,289) 100.00%
Overtime Wages 90,607 77,607 109 5,267 109 5,267 77,498 0.14%
FICA/Medicare - - 4,116 5,829 4,116 5,829 (4,116) 100.00%
Pension/Retiree Health Care - - 12,664 13,085 12,664 13,085 (12,664) 100.00%
Employee Health/Dental/Life Ins - - 6,394 5,182 6,394 5,182 (6,394) 100.00%
Workers Comp/Unemployment/Other - - 469 505 469 505 (469) 100.00%
Supplies & Services 3,067,454 3,094,710 (808,456) (1,101,154) (808,456) (1,101,154) 3,903,166 -26.12%
Conferences & Training 48,075 50,175 13,540 18,351 13,540 18,351 36,635 26.99%
Repairs & Maintenance 2,775 3,139 1,380 5,192 1,380 5,192 1,759 43.96%
Vehicle Operations 5,000 5,000 - - - - 5,000 0.00%
Contract Services 84,753 66,253 14,772 61,829 14,772 61,829 51,481 22.30%
Internal Services - 1,780 668 646 668 646 1,112 37.53%
Capital Outlay 105,098 105,098 22,987 41,138 22,987 41,138 82,111 21.87%
Transfers Out - - - 1,262 - 1,262 - 0.00%
3,595,589$ 3,595,589$ (677,315)$ (871,823)$ (677,315)$ (871,823)$ 4,272,904$ -18.84%
Homeland Security Grants (Dec 31 Year End)
Debt Service Fund (Dec 31 Year End)
Health Grants Fund (Dec 31 Year End)
Freedom Hill Park (Dec 31 Year End)
Prepared by the Macomb County Finance DepartmentXP - 17

Macomb County, Michigan
Quarterly Expenditure Report
Quarter Ended March 31, 2015
Adopted Amended QTD Prior Year YTD Prior Year Favorable %
Description Budget Budget Actual QTD Actual Actual YTD Actual (Unfavorable) Utilized
Full Time Wages 2,443,067$ 2,438,516$ 1,008,561$ 558,024$ 1,617,524$ 1,741,632$ 820,992$ 66.33%
Overtime Wages - 4,551 10,392 - 13,848 (9,297) 304.29%
FICA/Medicare 190,657 190,657 76,901 42,036 123,232 131,420 67,425 64.64%
Pension/Retiree Health Care 644,843 644,843 326,212 171,666 489,214 484,995 155,629 75.87%
Employee Health/Dental/Life Ins 755,616 755,616 251,675 124,723 347,994 422,746 407,622 46.05%
Workers Comp/Unemployment/Other 42,101 42,101 13,794 7,833 21,402 25,137 20,699 50.83%
Supplies & Services 66,598 66,598 11,171 6,608 18,642 19,581 47,956 27.99%
Conferences & Training 17,150 17,150 4,490 268 3,957 3,367 13,193 23.07%
Internal Services 133,742 133,742 35,502 - 92,369 45,226 41,373 69.06%
4,293,774$ 4,293,774$ 1,738,699$ 911,158$ 2,728,181$ 2,874,104$ 1,565,593$ 63.54%
Adopted Amended QTD Prior Year YTD Prior Year Favorable %
Description Budget Budget Actual QTD Actual Actual YTD Actual (Unfavorable) Utilized
Part Time Wages -$ -$ -$ -$ -$ -$ -$ 0.00%
Supplies & Services 6,850 9,000 403 330 403 330 8,597 4.48%
Conferences & Training 750 1,895 50 - 50 - 1,845 2.64%
Repairs & Maintenance 2,000 2,200 - - - - 2,200 0.00%
Contract Services 4,650 29,650 - 2,202 - 2,202 29,650 0.00%
Capital Outlay 1,500 1,500 857 - 857 - 643 57.13%
Transfers Out - - - 300 - 300 - 0.00%
15,750$ 44,245$ 1,310$ 2,832$ 1,310$ 2,832$ 42,935$ 2.96%
Adopted Amended QTD Prior Year YTD Prior Year Favorable %
Description Budget Budget Actual QTD Actual Actual YTD Actual (Unfavorable) Utilized
Supplies & Services 5,000$ 5,000$ -$ (76)$ -$ (76)$ 5,000$ 0.00%
Macomb/St Clair Training (Jun 30 Year End)
Prosecuting Attorney Grants (Dec 31 Year End)
MSU Extension (Dec 31 Year End)
Prepared by the Macomb County Finance DepartmentXP - 18

Macomb County, Michigan
Quarterly Expenditure Report
Quarter Ended March 31, 2015
Adopted Amended QTD Prior Year YTD Prior Year Favorable %
Description Budget Budget Actual QTD Actual Actual YTD Actual (Unfavorable) Utilized
Supplies & Services 680$ 3,013$ -$ -$ -$ -$ 3,013$ 0.00%
Contract Services 231,556 287,457 - - - - 287,457 0.00%
232,236$ 290,470$ -$ -$ -$ -$ 290,470$ 0.00%
Adopted Amended QTD Prior Year YTD Prior Year Favorable %
Description Budget Budget Actual QTD Actual Actual YTD Actual (Unfavorable) Utilized
Full Time Wages -$ -$ -$ 8,816$ -$ 8,816$ -$ 0.00%
Overtime Wages - - - 224 - 224 - 0.00%
FICA/Medicare - - - 691 - 691 - 0.00%
Pension/Retiree Health Care - - - 3,267 - 3,267 - 0.00%
Employee Health/Dental/Life Ins - - - 2,857 - 2,857 - 0.00%
Workers Comp/Unemployment/Other - - - 125 - 125 - 0.00%
Supplies & Services 106,000 106,000 9,189 7,463 9,189 7,463 96,811 8.67%
Conferences & Training 2,000 2,000 - - - - 2,000 0.00%
Repairs & Maintenance 3,200 3,200 772 772 772 772 2,428 24.13%
Contract Services 1,590,000 1,590,000 263,014 260,133 263,014 260,133 1,326,986 16.54%
Internal Services 1,000 1,000 223 215 223 215 777 22.30%
1,702,200$ 1,702,200$ 273,198$ 284,563$ 273,198$ 284,563$ 1,429,002$ 16.05%
Adopted Amended QTD Prior Year YTD Prior Year Favorable %
Description Budget Budget Actual QTD Actual Actual YTD Actual (Unfavorable) Utilized
Full Time Wages -$ -$ -$ -$ -$ -$ -$ 0.00%
Supplies & Services 112,600 233,321 43,360 26,391 43,360 26,391 189,961 18.58%
Conferences & Training 119,000 129,716 38,726 34,572 38,726 34,572 90,990 29.85%
Repairs & Maintenance 5,000 8,000 518 406 518 406 7,482 6.48%
Vehicle Operations 22,000 87,000 8,668 4,575 8,668 4,575 78,332 9.96%
Contract Services - 15,000 - (1,044) - (1,044) 15,000 0.00%
Internal Services 8,000 17,000 - - - - 17,000 0.00%
Capital Outlay 116,000 755,512 39,065 - 39,065 - 716,447 5.17%
382,600$ 1,245,549$ 130,337$ 64,900$ 130,337$ 64,900$ 1,115,212$ 10.46%
Register of Deeds Remonumentation Fund (Dec 31 Year End)
Register of Deeds Technology Fund (Dec 31 Year End)
Sheriff Grants (Dec 31 Year End)
Prepared by the Macomb County Finance DepartmentXP - 19

Macomb County, Michigan
Quarterly Expenditure Report
Quarter Ended March 31, 2015
Adopted Amended QTD Prior Year YTD Prior Year (Over) Under %
Description Budget Budget Actual QTD Actual Actual YTD Actual Budget Utilized
Supplies & Services 200,000$ 200,000$ -$ -$ -$ -$ 200,000$ 0.00%
Adopted Amended QTD Prior Year YTD Prior Year Favorable %
Description Budget Budget Actual QTD Actual Actual YTD Actual (Unfavorable) Utilized
Full Time Wages 430,598$ 430,598$ 93,707$ 83,090$ 93,707$ 83,090$ 336,891$ 21.76%
Part Time Wages - - 5,660 5,461 5,660 5,461 (5,660) 100.00%
FICA/Medicare 32,941 32,941 7,540 6,712 7,540 6,712 25,401 22.89%
Pension/Retiree Health Care 162,758 162,758 35,582 29,687 35,582 29,687 127,176 21.86%
Employee Health/Dental/Life Ins 140,338 140,338 29,220 14,761 29,220 14,761 111,118 20.82%
Workers Comp/Unemployment/Other 6,059 6,059 1,291 1,175 1,291 1,175 4,768 21.31%
Supplies & Services 331,900 331,900 41,395 42,200 41,395 42,200 290,505 12.47%
Conferences & Training 8,900 8,900 400 430 400 430 8,500 4.49%
Repairs & Maintenance 3,600 3,600 - - - - 3,600 0.00%
Internal Services 195,322 195,322 3,510 1,722 3,510 1,722 191,812 1.80%
Capital Outlay 8,000 8,000 - 802 - 802 8,000 0.00%
1,320,416$ 1,320,416$ 218,305$ 186,040$ 218,305$ 186,040$ 1,102,111$ 16.53%
Veterans' Affairs (Dec 31 Year End)
Social Welfare Fund (Dec 31 Year End)
Prepared by the Macomb County Finance DepartmentXP - 20

Macomb County, Michigan
Quarterly Expenditure Report
Quarter Ended March 31, 2015
Adopted Amended QTD Prior Year YTD Prior Year Favorable %
Description Budget Budget Actual QTD Actual Actual YTD Actual (Unfavorable) Utilized
Full Time Wages 51,152$ 51,152$ 11,765$ 11,411$ 25,168$ 25,878$ 25,984$ 49.20%
Part Time Wages - - - - - 6,118 - 0.00%
FICA/Medicare 3,913 3,913 900 872 1,925 2,438 1,988 49.19%
Pension/Retiree Health Care 16,648 16,648 3,945 3,635 7,887 7,431 8,761 47.38%
Employee Health/Dental/Life Ins 12,758 12,758 3,192 2,853 6,045 6,251 6,713 47.38%
Workers Comp/Unemployment/Other 721 721 163 161 325 384 396 45.08%
Supplies & Services 34,510 33,325 3,060 3,696 15,791 4,699 17,534 47.38%
Conferences & Training 2,770 2,770 1,770 1,770 1,770 1,770 1,000 63.90%
Contract Services 292,520 285,385 28,734 18,900 57,564 32,939 227,821 20.17%
Internal Services 716 716 179 - 358 333 358 50.00%
-
415,708$ 407,388$ 53,708$ 43,298$ 116,833$ 88,241$ 290,555$ 28.68%
Adopted Amended QTD Prior Year YTD Prior Year Favorable %
Description Budget Budget Actual QTD Actual Actual YTD Actual (Unfavorable) Utilized
Full Time Wages 5,366,419$ 5,285,019$ 1,189,361$ 1,240,862$ 2,614,832$ 2,863,863$ 2,670,187$ 49.48%
Part Time Wages 443,365 443,365 48,356 47,576 100,762 99,046 342,603 22.73%
Overtime Wages 307,500 307,500 75,829 58,848 141,679 141,402 165,821 46.07%
FICA/Medicare 434,010 434,010 99,762 102,247 216,942 235,105 217,068 49.99%
Pension/Retiree Health Care 1,985,725 1,985,725 439,019 424,735 881,865 870,548 1,103,860 44.41%
Employee Health/Dental/Life Ins 1,518,202 1,518,202 340,730 291,984 631,851 635,021 886,351 41.62%
Workers Comp/Unemployment/Other 79,323 263,023 43,321 45,146 93,729 141,884 169,294 35.64%
Supplies & Services 586,400 607,825 85,689 104,786 200,191 233,090 407,634 32.94%
Room & Board 6,665,000 6,665,000 1,493,994 1,235,219 2,083,279 1,926,179 4,581,721 31.26%
Conferences & Training 24,950 24,300 972 1,369 3,891 1,707 20,409 16.01%
Utilities 253,500 253,500 44,937 55,004 98,179 122,187 155,321 38.73%
Repairs & Maintenance 249,000 249,000 22,621 29,385 78,101 66,580 170,899 31.37%
Vehicle Operations 5,500 5,500 666 339 5,500 3,474 - 100.00%
Contract Services 1,125,000 1,125,000 180,848 211,864 420,251 470,839 704,749 37.36%
Internal Services 2,376,481 2,264,181 487,222 216,693 901,185 462,848 1,362,996 39.80%
Capital Outlay 15,000 15,000 - 511 1,540 2,951 13,460 10.27%
21,435,375$ 21,446,150$ 4,553,326$ 4,066,568$ 8,473,777$ 8,276,724$ 12,972,373$ 39.51%
Adopted Amended QTD Prior Year YTD Prior Year Favorable %
Description Budget Budget Actual QTD Actual Actual YTD Actual (Unfavorable) Utilized
Full Time Wages 467,261$ 467,261$ 102,471$ 105,192$ 228,813$ 228,207$ 238,448$ 48.97%
FICA/Medicare 35,746 35,746 7,766 7,960 17,357 17,296 18,389 48.56%
Pension/Retiree Health Care 159,652 159,652 33,634 34,346 69,879 66,682 89,773 43.77%
Employee Health/Dental/Life Ins 127,580 127,580 28,759 20,122 51,736 42,785 75,844 40.55%
Workers Comp/Unemployment/Other 6,577 6,577 1,382 1,475 2,856 3,053 3,721 43.43%
Supplies & Services 93,546 91,793 10,021 26,365 30,124 78,722 61,669 32.82%
Conferences & Training 3,000 4,500 717 1,669 1,378 1,669 3,122 30.63%
Repairs & Maintenance 1,500 1,500 - 347 441 514 1,059 29.37%
Contract Services 403,856 455,856 73,352 84,913 181,252 209,690 274,604 39.76%
Internal Services 15,542 15,795 5,456 3,000 7,133 4,500 8,662 45.16%
1,314,260$ 1,366,260$ 263,558$ 285,389$ 590,968$ 653,118$ 775,292$ 43.25%
Community Corrections (Sep 30 Year End)
Child Care Fund (Sep 30 Year End)
Circuit Court Programs (Sep 30 Year End)
Prepared by the Macomb County Finance DepartmentXP - 21

Macomb County, Michigan
Quarterly Expenditure Report
Quarter Ended March 31, 2015
Adopted Amended QTD Prior Year YTD Prior Year Favorable %
Description Budget Budget Actual QTD Actual Actual YTD Actual (Unfavorable) Utilized
Full Time Wages 16,937,301$ 16,937,301$ 3,673,947$ 3,640,203$ 7,962,202$ 8,260,274$ 8,975,099$ 47.01%
Part Time Wages - - 29,022 77,722 74,134 148,475 (74,134) 100.00%
Overtime Wages - - 675 506 1,406 956 (1,406) 100.00%
FICA/Medicare 1,285,114 1,285,114 280,172 281,568 605,868 635,563 679,246 47.15%
Pension/Retiree Health Care 5,534,054 5,534,054 1,214,670 1,136,499 2,461,699 2,325,153 3,072,355 44.48%
Employee Health/Dental/Life Ins 4,286,688 4,286,688 912,249 759,457 1,695,674 1,644,090 2,591,014 39.56%
Workers Comp/Unemployment/Other 236,587 236,587 46,422 45,675 93,049 101,642 143,538 39.33%
Supplies & Services 11,255,973 11,255,973 4,874,637 1,597,342 6,186,857 3,186,558 5,069,116 54.97%
Conferences & Training 315,444 315,444 41,087 897 68,645 2,948 246,799 21.76%
Utilities 272,591 272,591 89,023 70,891 137,499 112,287 135,092 50.44%
Repairs & Maintenance 46,707 46,707 1,724 12,295 13,066 19,292 33,641 27.98%
Vehicle Operations 9,577 9,577 - 14 - 2,165 9,577 0.00%
Contract Services 164,905,069 164,905,069 27,813,057 29,884,983 46,061,775 49,109,080 118,843,294 27.93%
Internal Services 1,384,225 1,384,225 58,903 - 123,458 25,766 1,260,767 8.92%
Capital Outlay 287,932 287,932 4,217 62,505 8,828 116,505 279,104 3.07%
206,757,262$ 206,757,262$ 39,039,804$ 37,570,557$ 65,494,160$ 65,690,754$ 141,263,102$ 31.68%
Adopted Amended QTD Prior Year YTD Prior Year Favorable %
Description Budget Budget Actual QTD Actual Actual YTD Actual (Unfavorable) Utilized
Full Time Wages 3,880,076$ 4,382,694$ 886,145$ 899,885$ 2,155,845$ 2,248,161$ 2,226,849$ 49.19%
Part Time Wages 2,042,588 2,137,828 605,372 430,248 1,138,945 865,286 998,883 53.28%
Overtime Wages - - 5,771 1,515 8,311 2,412 (8,311) 100.00%
FICA/Medicare 452,655 487,393 113,661 101,150 251,076 239,492 236,317 51.51%
Pension/Retiree Health Care 1,514,209 1,579,587 374,498 389,308 802,729 784,944 776,858 50.82%
Employee Health/Dental/Life Ins 1,035,681 1,189,316 241,496 198,916 495,788 501,831 693,528 41.69%
Workers Comp/Unemployment/Other 283,205 298,923 13,102 15,006 37,425 41,995 261,498 12.52%
Supplies & Services 7,764,091 8,410,176 2,342,508 2,319,525 2,951,873 3,336,546 5,458,303 35.10%
Conferences & Training 88,688 95,158 25,103 22,362 33,606 33,518 61,552 35.32%
Utilities 6,800 7,100 1,311 3,387 3,634 5,587 3,466 51.18%
Repairs & Maintenance 75,502 43,174 4,255 4,449 21,076 16,066 22,098 48.82%
Vehicle Operations 130,600 134,109 51,587 24,548 73,288 66,208 60,821 54.65%
Contract Services 4,371,754 5,699,231 1,054,167 967,645 2,099,338 1,948,828 3,599,893 36.84%
Internal Services 881,259 882,524 21,285 1,459 63,979 49,094 818,545 7.25%
Capital Outlay 162,203 508,608 59,108 608 60,417 6,142 448,191 11.88%
Transfers Out 597,782 608,934 33,931 11,304 68,841 159,858 540,093 11.31%
23,287,093$ 26,464,755$ 5,833,301$ 5,391,315$ 10,266,171$ 10,305,968$ 16,198,584$ 38.79%
Community Mental Health (Sep 30 Year End)
Community Services (Sep 30 Year End)
Prepared by the Macomb County Finance DepartmentXP - 22

Macomb County, Michigan
Quarterly Expenditure Report
Quarter Ended March 31, 2015
Adopted Amended QTD Prior Year YTD Prior Year Favorable %
Description Budget Budget Actual QTD Actual Actual YTD Actual (Unfavorable) Utilized
Full Time Wages 4,850,691$ 4,885,996$ 1,052,620$ 1,064,413$ 2,319,547$ 2,421,947$ 2,566,449$ 47.47%
Part Time Wages 65,401 65,401 10,763 13,408 26,887 37,606 38,514 41.11%
Overtime Wages 40,000 40,000 - - - - 40,000 0.00%
FICA/Medicare 379,141 379,141 80,410 81,396 177,649 186,289 201,492 46.86%
Pension/Retiree Health Care 1,692,790 1,692,790 373,317 346,579 758,559 704,783 934,231 44.81%
Employee Health/Dental/Life Ins 1,352,348 1,317,043 303,266 232,979 546,713 507,343 770,330 41.51%
Workers Comp/Unemployment/Other 69,196 69,196 12,715 12,830 25,685 28,629 43,511 37.12%
Supplies & Services 131,050 118,550 16,501 13,855 40,383 38,608 78,167 34.06%
Conferences & Training 12,250 12,250 1,656 1,498 5,488 4,252 6,762 44.80%
Repairs & Maintenance 68,000 58,000 5,574 32,597 9,557 30,905 48,443 16.48%
Vehicle Operations 22,000 20,000 2,299 2,275 5,162 8,470 14,838 25.81%
Contract Services 560,000 540,000 138,373 145,908 218,728 227,650 321,272 40.51%
Internal Services 1,142,164 1,142,164 282,638 296,584 570,066 573,246 572,098 49.91%
Capital Outlay - 44,500 2,445 - 2,445 408 42,055 5.49%
10,385,031$ 10,385,031$ 2,282,576$ 2,244,322$ 4,706,869$ 4,770,136$ 5,678,162$ 45.32%
Adopted Amended QTD Prior Year YTD Prior Year Favorable %
Description Budget Budget Actual QTD Actual Actual YTD Actual (Unfavorable) Utilized
Full Time Wages 1,555,678$ 1,640,973$ 317,931$ 319,117$ 706,145$ 745,362$ 934,828$ 43.03%
Part Time Wages 373,503 373,503 87,394 80,687 178,291 162,088 195,212 47.73%
Overtime Wages 9,295 9,295 6,884 4,153 20,716 13,059 (11,421) 222.87%
FICA/Medicare 148,293 154,579 31,354 30,745 68,944 70,159 85,635 44.60%
Pension/Retiree Health Care 560,708 592,928 135,287 121,477 272,853 249,376 320,075 46.02%
Employee Health/Dental/Life Ins 472,046 501,679 98,240 88,098 183,225 187,118 318,454 36.52%
Workers Comp/Unemployment/Other 27,165 28,288 4,211 4,454 11,267 10,155 17,021 39.83%
Supplies & Services 306,724 420,017 56,172 51,552 112,862 114,745 307,155 26.87%
Conferences & Training 19,109 29,989 3,395 1,248 4,426 2,274 25,563 14.76%
Utilities 2,929 - - - - - - 0.00%
Repairs & Maintenance 1,725 7,775 3,104 90 4,441 283 3,334 57.12%
Contract Services 783,718 843,112 132,832 134,619 273,754 284,081 569,358 32.47%
Internal Services 995,070 1,034,069 164,386 8,243 422,907 242,765 611,162 40.90%
Capital Outlay 22,190 26,340 3,426 615 6,160 615 20,180 23.39%
5,278,153$ 5,662,547$ 1,044,615$ 845,098$ 2,265,991$ 2,082,080$ 3,396,556$ 40.02%
Adopted Amended QTD Prior Year YTD Prior Year Favorable %
Description Budget Budget Actual QTD Actual Actual YTD Actual (Unfavorable) Utilized
Supplies & Services 1,850$ 1,850$ -$ -$ -$ -$ 1,850$ 0.00%
Conferences & Training 600 600 590 590 590 590 10 98.33%
Contract Services 11,609 13,282 1,673 - 13,282 15,373 - 100.00%
14,059$ 15,732$ 2,263$ 590$ 13,872$ 15,963$ 1,860$ 88.18%
Juvenile Drug Court Grants (Sep 30 Year End)
Friend of the Court (Sep 30 Year End)
Health Grants (Sep 30 Year End)
Prepared by the Macomb County Finance DepartmentXP - 23

Macomb County, Michigan
Quarterly Expenditure Report
Quarter Ended March 31, 2015
Adopted Amended QTD Prior Year YTD Prior Year Favorable %
Description Budget Budget Actual QTD Actual Actual YTD Actual (Unfavorable) Utilized
Supplies & Services 4,250 8,339 38 1,517 88 2,131 8,251 1.05%
Conferences & Training 150 1,650 - 1,895 - 1,895 1,650 0.00%
Contract Services 11,400 30,227 7,014 3,053 10,518 3,724 19,709 34.80%
Internal Services - - - - - 26 - 0.00%
15,800$ 40,216$ 7,051$ 6,465$ 10,606$ 7,776$ 29,610$ 26.37%
Adopted Amended QTD Prior Year YTD Prior Year Favorable %
Description Budget Budget Actual QTD Actual Actual YTD Actual (Unfavorable) Utilized
Full Time Wages 1,221,307$ 1,226,562$ 286,004$ 281,207$ 615,072$ 636,485$ 611,490$ 50.15%
Part Time Wages - 24,475 13,854 6,576 14,735 12,238 9,740 100.00%
FICA/Medicare 93,431 95,304 22,468 21,630 47,444 48,973 47,860 49.78%
Pension/Retiree Health Care 381,045 380,045 90,523 82,737 182,169 169,743 197,876 47.93%
Employee Health/Dental/Life Ins 280,676 274,421 68,514 51,450 123,118 110,650 151,303 44.86%
Workers Comp/Unemployment/Other 17,116 17,178 3,871 3,604 7,646 8,041 9,532 44.51%
Supplies & Services 95,859 102,581 17,688 19,412 39,391 40,602 63,190 38.40%
Conferences & Training 5,000 5,000 2,954 1,200 4,494 2,232 506 89.88%
Repairs & Maintenance 1,000 1,100 99 182 440 408 660 39.97%
Contract Services 8,500 7,250 - - 1,750 1,750 5,500 24.14%
Internal Services 123,453 123,894 30,896 29,737 60,844 56,199 63,050 49.11%
Capital Outlay 2,500 7,750 1,229 - 1,229 - 6,521 15.86%
2,229,887$ 2,265,560$ 538,101$ 497,735$ 1,098,330$ 1,087,321$ 1,167,230$ 48.48%
Adopted Amended QTD Prior Year YTD Prior Year Favorable %
Description Budget Budget Actual QTD Actual Actual YTD Actual (Unfavorable) Utilized
Full Time Wages 13,438,742$ 13,465,827$ 3,853,032$ 3,161,551$ 6,700,886$ 5,747,239$ 6,764,941$ 49.76%
Part Time Wages 100,000 100,000 - 1,800 2,669 6,684 97,331 2.67%
Overtime Wages 1,536,000 1,536,000 435,349 407,632 823,385 940,490 712,615 53.61%
FICA/Medicare 1,155,000 1,157,072 328,216 280,087 572,927 520,813 584,145 49.52%
Pension/Retiree Health Care 9,415,000 9,432,853 1,459,823 1,398,453 5,908,581 5,834,645 3,524,272 62.64%
Employee Health/Dental/Life Ins 3,495,000 3,502,020 741,119 839,406 1,412,438 1,394,046 2,089,582 40.33%
Workers Comp/Unemployment/Other 245,000 245,470 50,775 24,205 58,461 15,414 187,009 23.82%
Supplies & Services 1,912,727 1,912,727 337,432 308,696 583,191 536,880 1,329,536 30.49%
Conferences & Training 124,960 124,960 13,642 12,664 35,630 25,869 89,330 28.51%
Utilities 659,150 659,150 171,911 173,723 285,423 266,536 373,727 43.30%
Repairs & Maintenance 542,500 542,500 87,971 91,856 158,969 158,377 383,531 29.30%
Road Construction & Maintenance 57,089,176 57,089,176 5,042,968 5,405,335 14,675,483 15,906,124 42,413,693 25.71%
Vehicle Operations 2,476,450 2,476,450 442,025 736,200 857,248 1,246,204 1,619,202 34.62%
Contract Services 3,675,200 3,675,200 672,467 822,291 964,441 1,063,561 2,710,759 26.24%
Capital Outlay 3,966,993 3,966,993 330,882 766,000 852,491 1,109,804 3,114,502 21.49%
Transfers Out 146,166 146,166 44,773 42,399 90,527 61,734 55,639 61.93%
99,978,064$ 100,032,564$ 14,012,385$ 14,472,298$ 33,982,750$ 34,834,420$ 66,049,814$ 33.97%
Roads (Sep 30 Year End)
Prosecuting Attorney Grants (Sep 30 Year End)
MSU Extension Grants (Sep 30 Year End)
Prepared by the Macomb County Finance DepartmentXP - 24

Macomb County, Michigan
Quarterly Expenditure Report
Quarter Ended March 31, 2015
Adopted Amended QTD Prior Year YTD Prior Year Favorable %
Description Budget Budget Actual QTD Actual Actual YTD Actual (Unfavorable) Utilized
Full Time Wages 616,111$ 616,011$ 140,501$ 164,489$ 322,290$ 394,635$ 293,721$ 52.32%
Overtime Wages 86,101 88,500 17,014 9,010 30,787 15,009 57,713 34.79%
FICA/Medicare 53,719 53,890 11,999 13,219 26,968 30,498 26,922 50.04%
Pension/Retiree Health Care 187,550 188,020 49,520 53,395 105,684 116,179 82,336 56.21%
Employee Health/Dental/Life Ins 114,822 114,822 26,924 22,171 48,527 53,105 66,295 42.26%
Workers Comp/Unemployment/Other 22,583 22,696 5,202 5,923 11,356 18,749 11,340 50.04%
Supplies & Services 682,565 690,450 37,621 28,627 70,676 33,804 619,774 10.24%
Conferences & Training 1,000 1,000 - 445 - 445 1,000 0.00%
Repairs & Maintenance 6,000 6,000 - 112 776 410 5,224 12.94%
Vehicle Operations 86,000 86,000 7,816 6,884 31,360 24,566 54,640 36.47%
Internal Services 19,736 19,736 3,422 1,076 6,807 4,004 12,929 34.49%
Capital Outlay 11,700 11,700 - 7,538 1,613 8,967 10,087 13.78%
1,887,887$ 1,898,825$ 300,019$ 312,889$ 656,843$ 700,371$ 1,241,982$ 34.59%
Adopted Amended QTD Prior Year YTD Prior Year Favorable %
Description Budget Budget Actual QTD Actual Actual YTD Actual (Unfavorable) Utilized
Full Time Wages 745,055$ 745,055$ 172,140$ 140,649$ 371,750$ 312,260$ 373,305$ 49.90%
FICA/Medicare 57,003 57,003 12,883 10,443 27,881 23,336 29,122 48.91%
Pension/Retiree Health Care 228,790 228,790 50,583 40,438 102,825 81,546 125,965 44.94%
Employee Health/Dental/Life Ins 153,128 153,128 36,884 22,991 62,885 47,200 90,243 41.07%
Workers Comp/Unemployment/Other 10,588 10,588 2,183 1,874 4,437 4,090 6,151 41.90%
Supplies & Services 372,662 372,662 205,954 14,421 249,763 44,915 122,899 67.02%
Conferences & Training 27,230 27,230 125 - 301 - 26,929 1.11%
Utilities 7,070 7,070 430 518 739 928 6,331 10.45%
Repairs & Maintenance 3,500 3,500 - - - - 3,500 0.00%
Contract Services 11,130,170 11,130,170 2,355,591 2,064,240 3,595,599 3,104,922 7,534,571 32.30%
Internal Services 64,033 64,033 2,011 - 4,022 1,642 60,011 6.28%
Capital Outlay 1,000 1,000 - - - - 1,000 0.00%
12,800,229$ 12,800,229$ 2,838,784$ 2,295,574$ 4,420,203$ 3,620,839$ 8,380,026$ 34.53%
Substance Abuse (Sep 30 Year End)
Sheriff Grants (Sep 30 Year End)
Prepared by the Macomb County Finance DepartmentXP - 25