qsar studies of cyp2d6 inhibitor aryloxypropanolamines using 2d and 3d descriptors
TRANSCRIPT

QSAR Studies of CYP2D6 InhibitorAryloxypropanolamines Using 2D and 3DDescriptors
Partha Pratim Roy and Kunal Roy*
Drug Theoretics and Cheminformatics Lab, Division of Medicinaland Pharmaceutical Chemistry, Department of PharmaceuticalTechnology, Jadavpur University, Kolkata 700 032, India*Corresponding author: Kunal Roy, [email protected]
Thirty six aryloxypropanolamine compounds withcytochrome 2D6 (CYP2D6) inhibitory activity weresubjected to molecular shape analysis and molecu-lar field analysis studies to explore the requiredmolecular shape features as well as informationon putative interactions with the active site of theenzyme. In addition to the 3D QSAR models,impact of two-dimensional (2D; thermodynamic,structural and topological including E-state param-eters) descriptors towards the inhibitory activitywas also studied. The whole data set was dividedinto training (n = 26) and test (n = 10) sets byK-means clustering technique. The chemometrictools used for molecular shape analysis andmolecular field analysis were GFA and G ⁄ PLS tech-niques respectively. The G ⁄ PLS model derived inmolecular field analysis using maximum commonsubgroup alignment was found to be the bestmodel based on highest external (R2
pred = 0.912) pre-dictive power with lowest RMSEP value (0.363).The molecular field analysis-derived models sug-gest the requirement of U-shape conformation foroptimum interactions as well as importance of dif-ferent substituents on the aryloxypropanol frag-ment like indolylalkyl substituent. The molecularshape analysis models indicate the importance ofdistribution of positive and negative charges onthe surface of the molecules. The QSAR modelswith 2D descriptors reveal the importance of bulk,branching and presence of different fragments.
Key words: CYP2D6, G ⁄ PLS, GFA, K-means cluster, MFA, MSA,QSAR
Received 22 October 2008, revised and accepted for publication 25January 2009
Cytochrome P-450 (CYP) is the most versatile natural catalyst pres-ent in all five biological kingdoms (monerea, protista, fungi, plantaeand animalea). There are over 2000 individual CYP members which
are primarily oxidative in nature (1–7). P-450s can usually metabo-lize, generally with a wide regio- and stereo selectivity, a largenumber of structurally diverse endogenous and exogenous com-pounds as a result of broad substrate specificity (8–10). Six sub-strate recognition sites (SRSs) are thought to be present on P-450s,which display distinct differences in their substrate-binding residues(11). Human hepatic P-450 enzymes from the CYP1, CYP2 and CYP3families are associated with the Phase 1 metabolism of drugs andother xenobiotics (12). In the CYP2 family, CYP2D6 is of particularinterest in the pharmaceutical industry because many of its sub-strates cannot be metabolized by other enzymes and excessivelyrapid metabolism leads to short serum half-life for a drug (13).CYP2D6 is expressed in the human brain, especially the midbrain aswell as in the liver (14). CYP2D6 locus exhibits a high degree ofgenetic polymorphism that clearly has been linked to the variablepharmacological response to a variety of analgesic, cardiovascularand anti-depressant drugs (9,15,16). Approximately, 20–25% of cyto-chrome P-450 mediated oxidation of drugs (including b-blockers,neuroleptics, antidepressants and antiarythmics) are performed byCYP2D6 (17–20). CYP2D6 is involved in the oxidation of well over150 drugs, which usually contain a basic nitrogen and planar aro-matic ring (21). Metabolism of compounds not containing a basicamine by CYP2D6 has also been reported (22). Because of geneticpolymorphism, CYP2D6 exhibits either rapid or poor metabolic sta-tus in some individuals and is also deficient (or absent) in someethnographical populations (8–10,23–28). Substrates of CYP2D6possess a basic nitrogen 5–7 � away from the lipophilic position ofthe site of metabolism (29,30).
Because of genetic polymorphism, CYP2D6 is associated with differ-ent human diseases (31–34). Subjects who possess certain allelicvariants will show normal (CYP2D6*1), decreased (CYP2D6*9,CYP2D6*10, CYP2D6*17) or no (CYP2D6*3, CYP2D6*4, CYP2D6*5)CYP2D6 function depending on the allele (35). The so-called debr-isoquine ⁄ sparteine oxidation polymorphism has been extensivelystudied in many different populations and over 80 alleles have beenreported in the literature (18). Recently, it has been published thatthe regulation of neurosteroid level is modified by central nervoussystem active drugs that inhibit brain CYP2D isoforms (36). It wasreported that tamoxifen produces better results than aromataseinhibitors in breast cancer patients who are of wild-type forCYP2D6 (37). Recently applied data visualization for multiobjectiveoptimization techniques to cytochrome P-450 metabolism revealsthat CYP2D6 substrates are cationic compounds (38). A clear rela-tionship between polar surface area of ligands and binding affinity
442
Chem Biol Drug Des 2009; 73: 442–455
Research Article
ª 2009 The AuthorsJournal compilation ª 2009 Blackwell Munksgaard
doi: 10.1111/j.1747-0285.2009.00791.x

was observed for CYP2D6 (39). Docking study of CYP2D6 substratesindicates that formal charges, number of aromatic rings and hydro-phobicity are the main attributes for CYP2D6 binding (13). Phe-120,Glu-216, Asp-301, Phe-483 along with Phe-219 and Glu-222 wereidentified as the substrate binding residues for CYP2D6 inhibitorsaccording to different reports (21). Thus, to explore the requiredstructural and physicochemical properties of compounds acting asCYP2D6 substrates is an important goal in predicting potential druginteractions and new drug discovery and development (40).
In the present study, we have performed molecular shape andmolecular field analyses of a series of aryloxypropanolamine deriva-tives reported by R. J. Vaz et al. (41) to explore the contribution ofmolecular shape as well three-dimensional quantitative informationabout a putative active site of the CYP2D6 enzyme. We have alsoperformed QSAR analysis taking 2D descriptors to identify physico-chemical and structural requirements of ideal CYP2D6 inhibitors ina classical manner.
Materials and Methods
Data sets and descriptorsIn the present study, a series of aryloxypropanolamines (Figure 1,Table 1) having inhibitory potencies towards human CYP2D6 enzyme(41) were used as the model data set. The activity data have beenconverted to the logarithmic scale (M) and then used for subse-quent QSAR analyses as the response variable. The analysis wasperformed using both 2D and 3D descriptors. 2D QSAR analysiswas performed using topological (including E-state indices), physico-chemical (AlogP98, Molref) and structural indices [MW, (number of)Hbond_donor, Hbond_acceptor, Rotatable bonds, Chiral centers]descriptors. Molecular shape analysis (MSA) and molecular fieldanalysis (MFA) were used as 3D QSAR tools. For MSA, shape(DiFFV, Fo, NCOSV, COSV, ShapeRMS, SrVol), electronic (Apol,Dipole, HOMO, LUMO and Sr) and spatial (Radius of gyration, Jurs,Shadow indices, Area, PMI-mag, Density, Vm) descriptors wereused. For the calculation of 3D descriptors, multiple conformationsof each molecule were generated using the optimal search as theconformational search method. Each conformer was subjected to anenergy minimization procedure using smart minimizer under openforce field (OFF) to generate the lowest energy conformation foreach structure. The charges were calculated according to Gasteigermethod. All the descriptors were calculated using Descriptor+ mod-ule of the Cerius2 version 4.10 software (42) under QSAR+ environ-ment on a Silicon Graphics O2 workstation running under the IRIX6.5 operating system.
Model developmentTo begin with the model development process, the data set wasclassified into clusters by using K-means clusters based on stan-dardized topological, thermodynamic and structural descriptor matrix(values 0–1) (43). This approach (clustering) ensures that the similar-ity principle can be employed for the activity prediction of the testset (44). K-means clustering is a non-hierarchical classificationmethod, which expresses the final cluster membership for eachcase only (45). The number of compounds for the training set was
26, and the test set was composed of 10 compounds. For thedevelopment of the QSAR models the statistical techniques usedwere GFA (Genetic Function Approximation) and G ⁄ PLS (Genetic Par-tial Least Squares).
For the molecular shape analysis, the major steps are (i) generationof conformers and energy minimization; (ii) hypothesizing an activeconformer (global minimum of the most active compound); (iii)selecting a candidate shape reference compound (based on activeconformation); (iv) performing pairwise molecular superimpositionusing the maximum common subgroup (MCSG) method; (v) measur-ing molecular shape commonality using MSA descriptors; (vi) deter-mination of other molecular features by calculating spatial,electronic, and conformational parameters; (vii) selection of con-formers; and (viii) generation of QSAR equations by genetic func-tion approximation (GFA). Optimal search was used as theconformational search method. Each conformer was subjected toan energy minimization procedure using a smart minimizer underopen force field (OFF) to generate the lowest energy conformationfor each structure. The global minimum conformer of the mostactive compound (14) was selected as a shape reference to whichall the structures in the study compounds were aligned through pair-wise superpositioning. The method used for performing the align-ment was MCSG (42,46). This method looks at molecules as pointsand lines and uses the techniques of graph theory to identify pat-terns. It finds the largest subset of atoms in the shape referencecompound that is shared by all the structures in the study table anduses this subset for alignment. A rigid fit of atom pairings was per-formed to superimpose each structure so that it overlays the shapereference compound. Such a comparison necessitates a pairwisemolecular superposition. The measure of molecular shape similarityis interdependent upon the molecular superposition. Finally, addi-tional electronic, spatial and thermodynamic descriptors were alsocalculated.
Molecular field analysis is a method for quantifying the interactionenergy between a probe and a set of aligned molecules (47). Themajor steps of MFA (46) were as follows: (i) generating conformersand energy minimization; (ii) matching atoms using maximum com-mon subgroup (MCSG) or common substructure search (CSS) align-ment; (iii) setting MFA preferences (rectangular grid with 2 � stepsize, charges by Gasteiger algorithm, H+ and CH3 as probes); (iv)creating the field; and (v) analysis by G ⁄ PLS method. MFA modelsare predictive and sufficiently reliable to guide the chemist in thedesign of novel compounds. This approach is effective for the anal-ysis of data sets where activity information is available but thestructure of the receptor site is unknown. MFA attempts to postu-late and represent the essential features of a receptor site fromthe aligned common features of the molecules that bind to it. Thismethod generates multiple models that can be checked easily forvalidity. The MFA formalism calculates probe interaction energieson a rectangular grid around a bundle of active molecules. Atomsin the target molecule are fixed, so that intramolecular energy inthe target is ignored. The surface is generated from a 'Shape Field'.The atomic coordinates of the contributing models are used to com-pute field values on each point of a 3D grid. Grid size was adjustedto default 2.00 �. MFA evaluates the energy between a probe (H+
and CH3) and a molecular model at a series of points defined by a
QSAR Studies of CYP2D6 Inhibitors
Chem Biol Drug Des 2009; 73: 442–455 443

Figure 1: Structures of the aryloxypropanolamine compounds (1–36).
Roy and Roy
444 Chem Biol Drug Des 2009; 73: 442–455

rectangular grid. Fields of molecules are represented using grids inMFA, and each energy associated with an MFA grid point can serveas input for the calculation of a QSAR. These energies were addedto the study table to form new columns headed according to theprobe type. For a set of structures for which energy fields are gen-erated, some or all of the grid data points can be used as descrip-tors in generating QSAR models and analyzing structure–activityrelationships. For our study both maximum common subgroup(MCSG) method and CSS alignment method were used. The CSSmethod (42) starts with defining a core model substructure to finda match in all of the molecules under study. The core model is
composed of core atoms and substitution sites. 1-Isopropylamino-propan-2-ol (Figure 2) was used as the core model for alignment. Incase of the CSS alignment, core atoms are those atoms in the coremodel that exactly match a substructure in all the molecules.
In case of 2D QSAR models and MSA models, genetic functionapproximation (GFA) technique (48,49) was used to generate a pop-ulation of equations rather than one single equation for correlationbetween biological activity and descriptors. GFA involves the combi-nation of multivariate adaptive regression splines (MARS) algorithmwith genetic algorithm to evolve population of equations that bestfit the training set data. It provides an error measure, called thelack-of-fit (LOF) score that automatically penalizes models with toomany features. It also inspires the use of splines as a powerful toolfor nonlinear modelling. A distinctive feature of GFA is that it pro-duces a population of models (e.g. 100), instead of generating asingle model, as do most other statistical methods. The range of
Table 1: Observed and calculated CYP2D6 inhibitory activity of aryloxypropanolamines
SL No. Obsa Calb Calc Cald Cale Calf Calg Calh Cali Calj Calk
Training set1 1.678 2.216 2.100 2.034 1.716 2.766 2.865 2.896 2.532 1.826 2.1832 1.18 0.471 0.950 0.804 0.907 1.701 1.715 1.942 1.875 1.804 1.1574 2.42 2.894 2.768 2.341 2.264 1.980 1.835 1.992 2.176 1.822 2.1326 1.745 2.008 1.978 2.341 2.107 2.052 1.752 1.576 1.918 1.825 1.8157 2.721 2.457 2.509 2.341 2.434 2.220 2.081 1.997 2.041 1.825 2.2059 1.62 1.536 1.054 1.419 1.475 1.798 2.047 2.054 1.369 1.824 1.790
10 1.553 1.703 1.543 1.660 1.765 2.035 1.747 1.624 2.041 1.949 1.75811 1.959 1.884 2.149 2.845 2.440 1.968 2.449 1.788 1.731 1.753 1.97712 3.377 3.742 3.747 3.797 4.046 3.760 3.818 3.749 3.936 3.586 3.23813 4.301 3.832 3.966 4.104 4.205 3.661 3.566 3.843 3.936 4.284 4.37714 4.523 4.494 4.771 4.412 4.510 4.514 4.419 4.806 4.663 4.442 4.32417 4.301 4.206 4.330 4.104 4.099 4.406 4.324 4.209 4.154 4.054 4.19518 3.509 3.840 3.948 3.797 4.046 4.348 4.285 3.714 3.936 3.821 4.05619 1.921 3.205 3.074 2.874 2.340 2.946 2.810 2.164 2.235 2.201 2.02421 4.301 3.743 3.722 3.797 4.046 3.895 3.981 3.961 3.936 4.287 4.39422 3.553 3.907 3.711 3.182 2.909 3.282 3.740 3.852 3.936 3.468 3.97524 4.301 3.779 4.004 4.104 4.046 4.615 4.199 4.364 3.936 4.288 4.37725 2.319 2.553 2.312 1.769 2.202 1.725 1.801 2.066 1.721 2.705 2.02626 4.301 3.862 3.982 4.104 4.064 4.283 4.036 3.821 3.936 3.699 3.93027 4.398 4.598 4.280 4.104 4.046 3.693 3.550 4.021 3.936 4.356 4.02029 4.155 4.081 4.128 3.797 4.046 3.822 4.598 3.884 4.110 4.387 3.94730 4.398 4.081 4.145 3.797 4.046 3.967 4.389 3.361 3.698 4.453 4.35631 3.959 3.950 3.670 4.104 4.046 3.768 3.435 4.255 4.080 4.150 3.99532 4.046 3.661 3.966 4.412 4.144 2.851 3.128 3.982 3.936 3.598 4.04033 3.921 3.548 3.780 4.104 4.205 3.891 3.732 4.052 3.936 4.116 4.00036 3.174 3.376 3.033 3.489 3.478 3.703 3.345 3.637 3.936 3.111 3.342Test set
3 1.678 0.887 0.440 1.419 1.475 2.194 2.162 1.700 1.269 1.823 1.8315 4.523 4.950 5.273 4.412 4.400 3.370 3.506 4.024 3.936 4.286 4.4238 1.000 1.548 1.103 1.726 1.495 2.275 2.232 2.474 2.267 1.815 1.590
15 2.076 2.363 2.206 2.034 1.808 2.340 2.431 2.347 2.026 1.825 2.20416 4.097 3.771 3.850 3.797 4.046 4.431 4.353 3.929 3.936 4.285 4.38120 2.678 2.062 1.794 2.567 1.772 3.312 3.330 3.759 4.255 2.727 3.49123 3.921 3.573 3.738 4.104 4.205 3.729 3.550 3.962 3.936 4.248 3.99928 3.456 3.992 3.820 4.104 4.046 3.791 3.444 3.952 3.936 3.337 3.34334 4.523 5.251 5.201 4.104 4.046 3.632 3.516 3.805 3.936 3.934 3.30235 4.398 4.138 3.805 3.489 3.478 4.058 3.756 4.188 4.148 4.471 3.381
aObserved (Ref. 41); bCalculated from model (1); cCalculated from model (2); dCalculated from model (3); eCalculated from model (4); fCalculated from model (5);gCalculated from model(6); hCalculated from model(7); iCalculated from model (8); jCalculated from model(9); kCalculated from model(10).
Figure 2: Core structure for CSS alignment.
QSAR Studies of CYP2D6 Inhibitors
Chem Biol Drug Des 2009; 73: 442–455 445
variations in this population gives added information on the qualityof fit and importance of the descriptors.
In case of MFA, G ⁄ PLS was used as the statistical tool. The geneticpartial least squares (G ⁄ PLS) algorithm (50,51) may be used as analternative to a GFA calculation. G ⁄ PLS is derived from two QSARcalculation methods: GFA and partial least squares (PLS). TheG ⁄ PLS algorithm uses GFA to select appropriate basis functions tobe used in a model of the data and PLS regression as the fittingtechnique to weigh the basis functions' relative contributions in thefinal model. Application of G ⁄ PLS thus allows the construction oflarger QSAR equations while still avoiding overfitting and eliminat-ing most variables.
Genetic function approximation can build models not only with lin-ear polynomials but also with higher order polynomials, splines, andGaussians. By using spline-based terms, GFA can perform a form ofautomatic outlier removal and classification. The splines used aretruncated power splines and denoted with angular brackets. Forexample, Æf (x) ) aæ is equal to zero if the value of (f (x) – a) isnegative, else it is equal to (f (x))a). The constant 'a' is called theknot of the spline. A spline partitions the data samples into twoclasses, depending on the value of some feature. The value of thespline is zero for one of the classes and non-zero for the otherclasses. Splines are interpreted as performing either range identifi-cation or outlier removal. If there are many members in the non-zero partition, then the spline is identifying a range of effect. Ifthere are only a few members of the non-zero set, this indicatesthat the spline is identifying outliers (49).
Statistical qualitiesThe statistical qualities of the equations were judged by the param-eters such as explained variance ðR 2
aÞ, squared correlation coeffi-cient (R 2) and variance ratio (F) at specified degrees of freedom (df)(52). For G ⁄ PLS equations, least-squares error (LSE) was taken asan objective function to select an equation, while LOF was notedfor the GFA-derived equations. The generated QSAR equations werevalidated by leave-one-out cross-validation R 2 (Q 2) and predictedresidual sum of squares (PRESS) (53–55) and then were used forthe prediction of the enzyme inhibition activity values of the testset compounds. The prediction qualities of the models were judgedby statistical parameters like predictive R 2 (R 2
pred ) , squared corre-lation coefficient between observed and predicted values with (r 2)and without (r 2
0 ) intercept. It was previously shown that use ofR 2
pred and r 2 might not be sufficient to indicate the external valida-tion characteristics (56). Thus, an additional parameter (r 2
m ) (definedas r 2 � ð1�
ffiffiffiffiffiffiffiffiffiffiffiffiffiffir 2 � r 2
0
q), which penalizes a model (56) for large dif-
ferences between observed and predicted values, was also calcu-lated. Finally, the developed models were subjected to arandomization test for validation purpose.
Results and Discussion
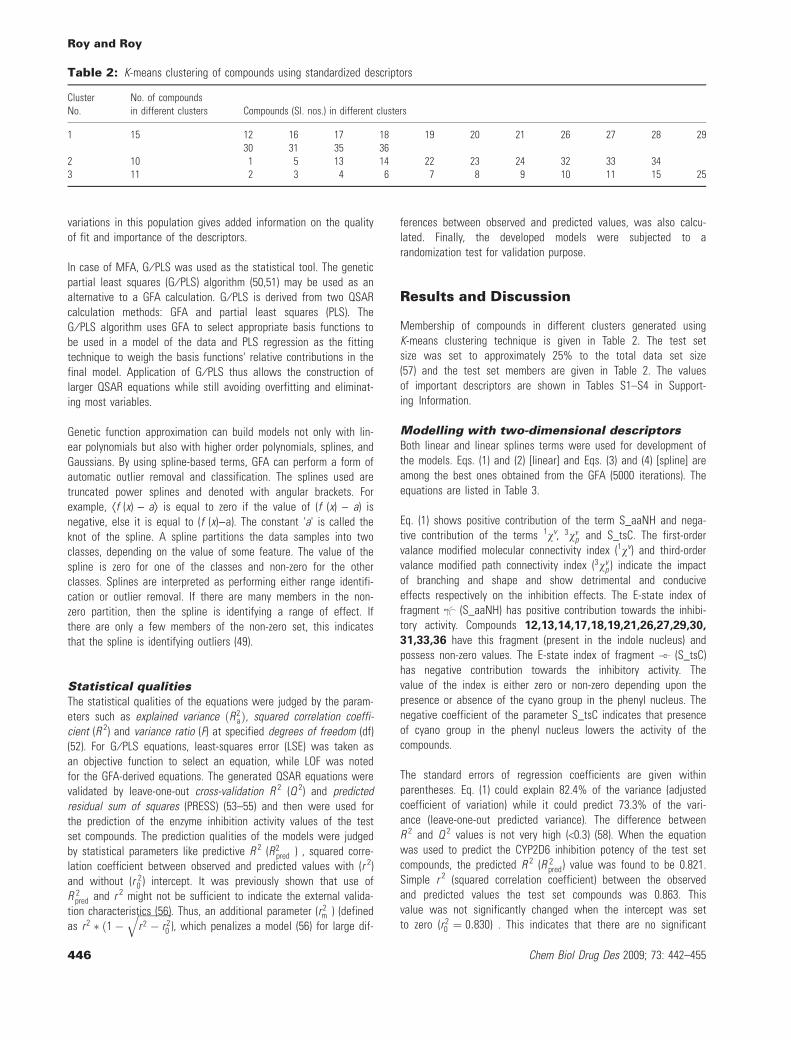
Membership of compounds in different clusters generated usingK-means clustering technique is given in Table 2. The test setsize was set to approximately 25% to the total data set size(57) and the test set members are given in Table 2. The valuesof important descriptors are shown in Tables S1–S4 in Support-ing Information.
Modelling with two-dimensional descriptorsBoth linear and linear splines terms were used for development ofthe models. Eqs. (1) and (2) [linear] and Eqs. (3) and (4) [spline] areamong the best ones obtained from the GFA (5000 iterations). Theequations are listed in Table 3.
Eq. (1) shows positive contribution of the term S_aaNH and nega-tive contribution of the terms 1vv, 3vm
p and S_tsC. The first-ordervalance modified molecular connectivity index (1vv) and third-ordervalance modified path connectivity index (3vv
p ) indicate the impactof branching and shape and show detrimental and conduciveeffects respectively on the inhibition effects. The E-state index offragment (S_aaNH) has positive contribution towards the inhibi-tory activity. Compounds 12,13,14,17,18,19,21,26,27,29,30,
31,33,36 have this fragment (present in the indole nucleus) andpossess non-zero values. The E-state index of fragment (S_tsC)has negative contribution towards the inhibitory activity. Thevalue of the index is either zero or non-zero depending upon thepresence or absence of the cyano group in the phenyl nucleus. Thenegative coefficient of the parameter S_tsC indicates that presenceof cyano group in the phenyl nucleus lowers the activity of thecompounds.
The standard errors of regression coefficients are given withinparentheses. Eq. (1) could explain 82.4% of the variance (adjustedcoefficient of variation) while it could predict 73.3% of the vari-ance (leave-one-out predicted variance). The difference betweenR 2 and Q 2 values is not very high (<0.3) (58). When the equationwas used to predict the CYP2D6 inhibition potency of the test setcompounds, the predicted R 2 (R 2
pred) value was found to be 0.821.Simple r 2 (squared correlation coefficient) between the observedand predicted values the test set compounds was 0.863. Thisvalue was not significantly changed when the intercept was setto zero (r 2
0 ¼ 0:830) . This indicates that there are no significant
Table 2: K-means clustering of compounds using standardized descriptors
ClusterNo.
No. of compoundsin different clusters Compounds (Sl. nos.) in different clusters
1 15 12 16 17 18 19 20 21 26 27 28 2930 31 35 36
2 10 1 5 13 14 22 23 24 32 33 343 11 2 3 4 6 7 8 9 10 11 15 25
Roy and Roy
446 Chem Biol Drug Des 2009; 73: 442–455

numerical differences between the observed and predicted val-ues of the test set compounds. Thus, r 2
m value (for the test set),calculated according to ref. (56), is also acceptable (r 2
m ¼ 0:706) .The test set size was about 25% of the full data set size (57).
Eq. (2) differs from Eq. (1) in having an additional term JX, contrib-uting negatively on the activity. When compared to Eq. (1), the val-ues of adjusted coefficient of variation and leave-one-out predictedvariance increase to 86.8% and 82.0% respectively on addition ofJx, but the R 2
pred value decreases to 0.737.
The Balaban J index (Jx), which characterizes the shape of the mol-ecule based on covalent radii, is defined as following:
J ¼ qlþ 1
X�VDi :�VDj
In the above equation, i and j are the adjacent vertices, q is thenumber of edges, l represents the number of rings (i.e. l = 0 forlinear graphs), �VDi and �VDj are the average distance sum of the ver-tices i and j respectively.
From the above equation it is evident that if the number of ringsincreases then the value of the index is small (for example, com-pounds 17, 29, 30) and this is less detrimental towards the activ-ity than high values (for example, in case of compound 9).
Eq. (3) could explain and predict 84.8% and 80.4% respectively ofthe variance. The predictive R 2-value for the test set was found tobe 0.856. Negative contribution of the term ÆS_ssssC + 0.084931æindicates that the value of S_ssssC should be more negative than)0.084931 for the optimal activity. The value of S_ssssC is more
negative in cases where the fragment is present between nitro-gen and heteroaromatic group. The E-state index of fragment(S_ssssC) has positive values in compounds 10 and 25 in whichthe fragment exists terminally and it is detrimental for the activity.The number of rotatable bonds has negative contribution towardsthe activity.
Eq. (4) is statistically significant with all acceptable statisticalparameters (Ra
2 = 0.907, Q2 = 0.858, R2pred = 0.820). Negative contri-
bution of the term ÆRotlsbonds-11æ indicates that for optimal activ-ity the number of rotatable bonds should be less than 11.Compounds with rotatable bonds more than 11 (for example, 2,19, 22 and 36) have lower enzyme inhibitory activity. This indi-cates that long chain substitutions at the phenyl ring (in case ofcompounds 2, 19, 22) and on the propanolanine nitrogen (com-pound 36) will lead to poor inhibitory activity. The positive coeffi-cient of the term Æ6.12243)PHIæ indicates that molecular flexibilityindex has positive contribution if the value of the parameter is<6.12243. Compounds like 2, 3, 9, 19, 20, 22 having the highervalues for this parameter (because of the presence of long chainsubstitution at the phenyl ring making the molecule flexible) havepoor inhibitory activity.
Molecular shape analysisThe view of the aligned training set molecules is shown in Figure 3.The molecules take a U–shape geometry after conformer selectionand energy minimization. This is in agreement with the observationthat this series of compounds bind with the active site in U-shapeconformations (41).
Table 3: List of equations derived from GFA method using 2D descriptors
Eq. No. Equations
1 pIC50 ¼ 6:827ð�1:133Þ � 2:265ð�0:387Þ1vv þ 3:662ð�0:550Þ3vvp þ 0:477ð�0:090ÞS aaNH
� 0:334ð�0:100ÞS tsC
n Training ¼ 26; LOF ¼ 0:381; R2 ¼ 0:853; R2a ¼ 0:824; F ¼ 30:36ðdf4; 21Þ;Q 2 ¼ 0:733;
PRESS ¼ 8:598; n Test ¼ 10; R 2pred ¼ 0:821
2 pIC50 ¼ 11:893ð�2:054Þ � 2:435ð�0:341Þ1vv þ 3:616ð�0:477Þ3vvp � 1:945ð�0:693ÞJX
þ 0:398ð�0:083ÞS aaNH� 0:349ð�0:087ÞS tsC
n Training ¼ 26; LOF ¼ 0:345; R2 ¼ 0:894; R2a ¼ 0:868; F ¼ 33:83ðdf5; 20Þ;Q 2 ¼ 0:820;
PRESS ¼ 5:789; n Test ¼ 10; R 2pred ¼ 0:737
3 pIC50 ¼ 7:179ð�0:670Þ � 31:621ð�2:783Þ<S ssssCþ 0:084931> � 0:308ð�0:062ÞRotlbonds
n Training ¼ 26; LOF ¼ 0:266; R2 ¼ 0:860; R2a ¼ 0:848; F ¼ 70:61ðdf2; 23Þ;Q 2 ¼ 0:804;
PRESS ¼ 6:321; n Test ¼ 10; R 2pred ¼ 0:856
4 pIC50 ¼ 4:046ð�0:092Þ � 0:569ð�0:098Þ<Rotlsbonds� 11> � 30:268ð�2:352Þ<S ssssCþ0:084931>
þ 0:789ð�0:217Þ<6:12243� PHI>
n Training ¼ 26; LOF ¼ 0:273; R2 ¼ 0:918; R2a ¼ 0:907; F ¼ 82:10ðdf3; 22Þ;Q 2 ¼ 0:858;
PRESS ¼ 4:569; n Test¼10; R 2pred¼0:820
QSAR Studies of CYP2D6 Inhibitors
Chem Biol Drug Des 2009; 73: 442–455 447

Equations (5–8) were among the best ones obtained from the GFA(5000 iterations). Both linear and linear spline terms were used fordevelopment of the models.
pIC50 ¼ �13:290ð�5:568Þ þ 0:009ð�0:003ÞCOSV
þ 0:572ð�0:221ÞRPCSþ 12:084ð�5:528ÞDensity
þ 0:014ð�0:004ÞWNSA 1 ð5Þ
n Training ¼ 26; LOF ¼ 0:627; R 2 ¼ 0:757;
R2a ¼ 0:711; F ¼ 16:37ðdf 4; 21Þ; Q 2 ¼ 0:661;
PRESS ¼ 10:894; nTest ¼ 10; R 2pred ¼ 0:676
Eq. (5) could explain 71.1% of the variance (adjusted coefficient ofvariation). The leave-one-out predicted variance was found to be66.1%. While Eq. (1) was applied for prediction of the test set com-pounds, the predictive R 2-value for the test set was found to be0.676. The equation contains four terms including COSV, RPCS, Den-sity, and WNSA_1. The relative importance of the above descrip-tors, when regressed with their standardized values, is of thefollowing order COSV > WNSA_1 > RPCS > Density. All the fourterms have positive contributions towards the inhibition potential.
Common overlap steric volume (COSV) is conducive for the activity,i.e. molecules which are very similar in shape with the shape refer-ence molecule (compound 14) have more inhibitory potency.Although compounds 2 and 19 have COSV values close to the ref-erence compound, but at the same time, they have relatively highnon-common steric overlap volume (NCOSV). This leads to the poorinhibitory activity. Density is a 3D spatial descriptor that is definedas the ratio of molecular weight to molecular volume. Densityreflects the types of atoms and how tightly they are packed in amolecule. Density has positive contribution towards the activity. All
the compounds having indolylalkyl and benzothienylalkyl substitu-tions at the nitrogen atom of the aryloxypropanolamine moiety havealmost similar values for density which is slightly higher than thosewithout bulky substitutions. This indicates the presence of bulkysubstitutions at the nitrogen atom of aryloxypropanolamine moietywill lead to increase the inhibitory activity (41). This is in accor-dance with the previous report (41) that the compounds interactwith a hydrophobic pocket formed by Phe-120, Val370, Met-374,Phe-483, and Leu-484.
The positive coefficient of JursRPCS indicates that the relative posi-tive charge (RPCS) is conducive for the inhibitory activity. It isdefined as the solvent accessible surface area of most positiveatom divided by the relative positive charge and derived as follows
RPCS ¼ SAþmax
RPCG
The positive coefficient of Jurs WNSA_1 indicates that surfaceweighted charged partial negative surface areas is conducive forthe activity and the term WNSA_1 is derived as follows:
WNSA 1 ¼ PNSA1:SASA1000
where PNSA1 is partial negative surface area and SASA is solventaccessible surface area.
Both RPCS and WNSA_1 have positive contributions towards theactivity. But it is not certain that high values of either of RPCS andWNSA_1 parameters will lead to high inhibitory activity (for exam-ple, compounds 6 and 10 have high RPCS values but significantlylower WNSA_1 values and the inhibitory potentials of these twocompounds are reasonably low). This indicates that there should bea balance between solvent accessible surface area of positivelycharged atoms and the negatively charged surface area for theoptimal activity. Compounds (like 12, 13, 17, 18, 21, 24, 26,
33, and 36) which have both electron donor and electron acceptorsubstituents contribute more towards the inhibitory activity.
pIC50 ¼ �19:580ð�4:695Þ þ 0:009ð�0:003ÞCOSV
þ 0:691ð�0:218Þ RPCSþ 15:512ð�4:868Þ Density
þ 0:007ð�0:002ÞSASA ð6Þ
n Training ¼ 26; LOF ¼ 0:612; R 2 ¼ 0:763; R 2a ¼ 0:718;
F ¼ 16:88ðdf4; 21Þ; Q 2 ¼ 0:645; PRESS ¼ 11:408;
nTest ¼ 10; R2pred ¼ 0:669
The standard errors of regression coefficients are given withinparentheses. According to the standardized values of the regressioncoefficients, the relative importance of the variables are in the fol-lowing order: COSV > SASA > RPCS > Density. SASA (total molecu-lar solvent accessible surface area) has positive contributiontowards the inhibitory activity. The equation could explain and pre-dict 71.8% and 64.5% respectively and the predictive R 2-value wasfound to be 0.669.
Figure 3: Aligned geometry of the training set molecules (MCSGalignment).
Roy and Roy
448 Chem Biol Drug Des 2009; 73: 442–455

pIC50 ¼ 1:688ð�0:755Þ þ 11:555ð�4:227ÞRNCG
� 0:002ð�0:001Þh1929:04� PMI magiþ 0:018ð�0:003ÞhCOSV� 150:749i ð7Þ
n Training ¼ 26; LOF ¼ 0:455; R 2 ¼ 0:824; R 2a ¼ 0:800;
F ¼ 34:23 ðdf 3; 22Þ; Q 2 ¼ 0:595; PRESS ¼ 13:037;
nTest ¼ 10; R 2pred ¼ 0:700
The standard errors of regression coefficients are given withinparentheses. Eq. (7) could explain 80.0% of the variance (adjustedcoefficient of variation) while it could predict 59.5% of the variance(leave-one-out predicted variance). When the equation was used topredict the test set compounds, the predicted R 2 ðR 2
predÞ value wasfound to be 0.700. The positive coefficient of JursRNCG indicates thatthe relative negative charge (RNCG), the charge of the most negativeatom divided by the total negative charge, is conducive for the inhibi-tory activity. The relative negative charge (RNCG) is derived as
RNCG ¼ Q�max
Q�
where Q�max is the charge of the most negative atom and Q) is thetotal negative charge.
Compounds like 1, 2, 4, 6, 9, 10 and 25 have relatively higher val-ues of RNCG but poor inhibitory potential. On the contrary compoundslike 13, 14, 24, 26, 27, 32 have moderate RNCG values but sur-prisingly high inhibitory potential. The latter set of compounds containa bulky heteroaromatic alkyl substitution at the nitrogen atom of thearyloxypropanolamine moiety and CN, SO2Me, F, methyl substitutionsat the phenyl ring. This indicates that there should be more numberof negatively charged atoms present either in the heteroaromatic ringsubstituent or in the substituent on the phenyl ring. The termsÆ1929.04 ) PMI_magæ and ÆCOSV ) 150.749æ have negative andpositive contributions respectively. It indicates that principle momentof inertia will contribute positively to the activity only when its valueis greater than 1929.04. The negative coefficient of ÆCOSV ) 150.749indicates that the value of COSV should be >150.749 for the inhibitoryactivity.
pIC50 ¼ 3:936ð�0:126Þ þ 0:414ð�0:119Þh14:6654�WPSA 3iþ 0:022ð�0:003ÞhCOSV� 170:559i� 0:003ð�0:001Þh1828:61� PMI magi ð8Þ
n Training ¼ 26; LOF ¼ 0:459; R 2 ¼ 0:841; R 2a ¼ 0:820;
F ¼ 38:89 ðdf 3; 22Þ; Q 2 ¼ 0:644; PRESS ¼ 11:439;
nTest ¼ 10; R 2pred ¼ 0:649
The standard errors of regression coefficients are given withinparentheses. In the equation the terms Æ14.6654)WPSA_3æ,ÆCOSV)170.559æ are conducive for the activity whereas the termÆ1828.61-PMI_magæ is detrimental for the activity up to a certainlimit. Eq. (3) could explain and predict 82.0% and 64.4% respec-tively of the variance. The predictive R 2-value for the test set wasfound to be 0.649.
Molecular field analysisTwo different methods of alignment of compounds were used: maxi-mum common subgroup (MCSG) and CSS methods.
Model derived from maximum commonsubgraph search alignmentThe field generated was of the rectangular type. The probes usedwere H+ and CH3. The charge method used was Gasteiger type,and the energy cutoff was kept at )50 to +50 kcal and fields at1330 points were generated. The QSAR equation was generatedusing the genetic partial least squares (1000 crossovers, linearterms, scaled variables, number of components 3, initial equationlength 5, no fixed length of the final equation and other defaultsettings) method. The view of aligned training set molecules in thefield is shown in Figure 3. The following equation was obtainedfrom the MFA.
pIC50 ¼ 1:524þ 0:006CH3=664� 0:017CH3=813� 0:011CH3=911
þ 0:014CH3=1050þ 0:052CH3=932 ð9Þ
nTraining ¼ 26; LSE ¼ 0:113; R 2 ¼ 0:908; R 2a ¼ 0:850;
F ¼ 72:26ðdf 3; 22Þ; Q 2 ¼ 0:844; PRESS ¼ 5:005;
nTest ¼ 10; R 2pred ¼ 0:912
Eq. (9) could explain and predict 85.0% and 84.4% respectively ofthe variance. The external validation statistics of Eq. (6) are verygood. The predictive R 2, r 2 and r m
2 values for the test set werefound to be 0.912, 0.920 and 0.838 respectively. These indicate thatthe predicted values are in good agreement with the observedones. In Eq. (10), CH3 ⁄ 664, CH3 ⁄ 1050, CH3 ⁄ 813, CH3 ⁄ 911, CH3 ⁄ 932are the probes and their corresponding to the spatial position asshown in Figure 4. These terms indicate the interactions of theprobe with the ligands at points 664, 1050, 813, 911, 932 respec-tively. Among the above points 813 and 911 are close to the het-eroaromatic steric bulky groups and points 1050 and 932 are in theregion near the indole nucleus and point 664 is the interactionpoint near the phenyl ring. The parameters CH3 ⁄ 813 and CH3 ⁄ 911have negative coefficients and this indicates that presence of bulkysubstitutions at the indole nucleus is detrimental for the inhibitionpotential.
The point 664 is near the phenyl ring. The positive coefficient forCH3 ⁄ 664 indicates that substitution at the phenyl nucleus whichreduces the interaction energy between the methyl probe and ligandfacilitates the inhibitory activity (like compound 27, 29, 30 and 32).
The points 813 and 911 are near the steric bulky substituent indolylnucleus. In case of U-shape conformation of the ligands, there isno significant possible interaction of the indole ring with the twopoints. The negative coefficient of these two terms indicates whenthe conformation changes to such a form where methyl probe atthe two positions interact with the indole ring, it leads to poorinhibitory potential.
QSAR Studies of CYP2D6 Inhibitors
Chem Biol Drug Des 2009; 73: 442–455 449

The points 1050 and 932 are in the region of the indole nucleuswith positive contribution towards the inhibitory potentials. Thepoint CH3 ⁄ 1050 is more close to the benzene ring of the indolenucleus, and methoxy and hydroxyl substitutions at the benzene ringgive maximum interaction energies (like in compounds 12, 16 and21) and this is conducive for the inhibitory activity. The methylprobe at point 932 is near the pyrrole ring and gives maximuminteraction energy in case of unsubstituted ones although methylsubstitution at the nitrogen in case of compound 32 gives goodinhibitory activity.
Model derived from common substructurealignment modelEq. (10) is obtained from the common substructure alignment model.The view of aligned training set molecules in the field is shown inFigure 5. The core structure is shown in Figure 2. The probes usedwere H+ and CH3 and 1580 field points were generated.
pIC50 ¼ 1:611� 0:018CH3=1424þ 0:047CH3=1245þ0:008CH3=198þ 0:007Hþ=930� 0:011Hþ=801
ð10Þ
n Training ¼ 26; LSE ¼ 0:064; R 2 ¼ 0:947; R 2a ¼ 0:894;
F ¼ 130:92ðdf 3; 22Þ; Q 2 ¼ 0:918;
PRESS ¼ 2:641; nTest ¼ 10; R2pred ¼ 0:754
Eq. (10) could explain 90.8% of the variance. The internal validationparameter Q2 (0.918) of Eq. (10) is very encouraging but the externalvalidation parameters ðR 2
pred ¼ 0:754; r 2m ¼ 0:705Þ are inferior com-
pared to Eq. (9). In the above equation CH3 ⁄ 1424, CH3 ⁄ 1245,
CH3 ⁄ 198, H+ ⁄ 930, H+ ⁄ 801 are the interaction energies with differentprobes (CH3 and H+) at different spatial positions (Figure 6).
The parameter CH3 ⁄ 1424 with the negative coefficient indicatesthat bulky substitutions at the indole nucleus will increase the inter-action energies between the target molecule and methyl probe asit is near the indole nucleus.
The negative contribution of the point H+ ⁄ 801 indicates that com-pounds giving maximum interaction energy with the probe will havepoor inhibitory potential. In compound 36, there is an acetylenic H,which interacts with H+ probe. Compound 36 has relatively loweractivity compared to compound 35 which has a ethylenic hydrogen.The point 930 is in the region of the phenyl ring; the positivecoefficient of H+ ⁄ 930 indicates that compounds with substitutedphenyl ring give maximum interaction energies (like compounds 13,
17, 21, 24, 25, 30) with H+ probe at point 930 and favour theactivity.
The point 1245 is near the indole nucleus and CH3 at this pointgives maximum interaction energies with the unsubstituted indolenucleus as well as that with small substituents (like hydroxyl, meth-oxy at the benzene ring of indole as well as methyl substitution atthe nitrogen of the indole ring).
Although the variable CH3 ⁄ 198 has positive coefficient and maxi-mum interaction energies are observed between CH3 probe at 198position and the napthyl ring instead of phenyl ring (compounds 1,
4, 7, 15 have poor inhibitory activities). However, compounds con-taining the napthyl ring with indolylalkyl or any other bulky substitu-tion on the nitrogen will lead to increased inhibitory potential (likecompounds 5, 17). This can be inferred that the napthyl ring isimportant for favourable interaction with CH3 ⁄ 198 probe but for the
Figure 5: Aligned geometry of the training set molecules (CSSalignment).
Figure 4: The view of the most active compound 14 in molecu-lar field and the interaction points in the MFA model with MCSGalignment.
Roy and Roy
450 Chem Biol Drug Des 2009; 73: 442–455

optimum conformation of the compounds, presence of bulky stericsubstituents on the nitrogen atom is required and the inhibitorypotential will then increase. This is supported by the presence oflarge hydrophobic pocket defined by the residues Phe-120, Val-370,Met-374, Phe-483, and Leu-484 (41).
Further test on external validationThe models were also subjected to the test for criteria of externalvalidation as suggested by Golbraikh and Tropsha (59). Theseauthors (59) have recommended that in addition to a high value ofcross-validated R 2 (Q2), the correlation coefficient r between theobserved and predicted activities of compounds from an externaltest set should be close to 1. At least one (but better both) of thecorrelation coefficients for regressions through the origin (observed
versus predicted activities, or, predicted versus observed activities),i.e. r 2
0 or r 020 should be close to r2. Furthermore, at least one slopeof regression lines (k or k¢) through the origin should be close to 1.Models are considered acceptable, if they satisfy all of the follow-ing conditions: (i) Q 2 > 0.5, (ii) r 2 > 0.6, (iii) r0
2 or r¢02 is close tor 2, such that [(r 2)r0
2) ⁄ r 2] or [(r 2)r¢02) ⁄ r 2] < 0.1 and 0.85 £k £ 1.15 or 0.85 £ k¢ £ 1.15. A list of values of different parame-ters for different models as recommended by Golbraikh and Tropsha(59) is given in Table 4. All the models pass the recommendedcriteria.
Additional test on validationSelected models were subjected to an additional test for r 2
mðoverallÞstatistic described by Roy and Roy (60). The parameter r 2
m is a mea-sure of deviation of observed values from the predicted values andcalculated according to the following equation:
r 2m ¼ r 2 � ð1�
ffiffiffiffiffiffiffiffiffiffiffiffiffiffir 2 � r 2
0
qÞ
In the above equation r 2 and r 20 indicate determination coefficient
between observed and predicted values with and without interceptrespectively.
Initially the concept r 2m was applied only to the test set prediction
(56), but it can as well be applied for training set if one considersthe correlation between observed and leave-one-out (LOO) predictedvalues of the training set compounds (39,40). More interestingly,this can be used for the whole set considering LOO-predictedvalues for the training set and predicted values of the test setcompounds. The r 2
mðoverallÞ statistic may be used for selection of thebest predictive models from among comparable models.
The present group of authors (60) recommended the r 2mðoverallÞ statis-
tic, which is not only based on limited test set prediction but alsoincludes training set (using LOO predictions). The r 2
mðoverallÞ statisticmay be used for selection of the best predictive models fromamong comparable models. The parameter r 2
mðLOOÞ is a stricter met-ric for internal validation than Q2. Similarly r 2
mðtestÞ appears to be abetter metric to denote external predictivity than the traditionalparameter R 2
pred The parameter r 2mðoverallÞ is unique in that it consid-
ers predictions for both training and test set compounds and itsvalue is not obtained from prediction of limited number of test set
Table 4: External validation characteristics of different models according to Golbraikh and Tropsha (59)
Sl. No. Statistical parameters
Eq. Nos.
1 2 3 4 5 6 7 8 9 10
1 r 2 0.863 0.868 0.861 0.841 0.744 0.774 0.755 0.660 0.920 0.7642 r0
2 0.830 0.743 0.860 0.830 0.676 0.674 0.710 0.660 0.912 0.7583 r ¢02 0.861 0.840 0.828 0.838 0.161 0.039 0.362 0.495 0.886 0.6314 (r 2 ) r0
2) ⁄ r 2 0.038 0.144 0.002 0.013 0.091 0.129 0.060 0.000 0.007 0.0085 (r 2 ) r ¢02) ⁄ r 2 0.002 0.032 0.038 0.004 0.784 0.949 0.521 0.250 0.040 0.1746 Minimum of 4 and 5 0.002 0.032 0.002 0.004 0.091 0.129 0.060 0.000 0.007 0.0087 k 0.967 0.973 1.023 1.036 0.998 1.027 0.966 0.963 0.998 1.0218 k ¢ 1.011 0.994 0.960 0.944 0.962 0.934 0.998 0.994 0.991 0.949
Figure 6: The view of the most active compound 14 in molecu-lar field and the interaction points in the MFA model with CSSalignment.
QSAR Studies of CYP2D6 Inhibitors
Chem Biol Drug Des 2009; 73: 442–455 451
compounds as is the case for R2pred. In addition to this, r 2
mðoverallÞhelps to identify the best model from among comparable models,especially when different models show different patterns in internaland external predictivity. For a predictive model, the recommendedcriterion (60) is that r 2
mðoverallÞvalue should be >0.5. For the presentQSAR study, we have determined rm
2 values for both training(based on LOO predicted values) and test sets and also for thewhole set for the 3D-QSAR models and the results are shown inTable 7. All the models pass the criterion for r 2
mðoverallÞ statistic, butfor Eqs. (6) and (7), the values of r 2
mðLOOÞare <0.5. Based on ther 2mðoverallÞ statistic, the G ⁄ PLS model obtained from MFA (CSS align-
ment) was found to the best model.
Comparison with previous studyVaz et al. (41) performed a comparative molecular similarity analy-sis on the same set of aryloxypropanolamine compounds. Theseauthors suggested the requirement of U shape conformation forthe optimal activity, which is in agreement with conclusionsderived from our model. The aryloxypropanolamines interact witha large hydrophobic pocket formed by the residues like Phe-120,Val-370, Met-374, Phe-483, and Leu-484 (41) and this is supportedby our models which suggest the requirement of bulky substitu-ents on the nitrogen of aryloxypropanolamine moiety. However,Vaz et al. (41) stated that appropriate substitution on either ring(phenyl or indole) decreased CYP2D6 inhibitory potency. In contraryto this suggestion, our models have showed appropriate substitu-ents in both the phenyl and indole ring could lead to satisfactoryinhibitory potency towards the CYP2D6 enzyme. In case of thesource paper (41), the cross-validated R 2 (Q2) was found to be0.7 (from the Figure 2 reported in the paper). But the internal val-idation (Q2) statistics for our best models are far above the valueof 0.7 as listed in Table 5. Vaz et al. (41) did not perform anytest for external validation.
Overview and Conclusion
The whole dataset was divided into a training set (26 compounds)and a test set (10 compounds) based on K-means clustering of the
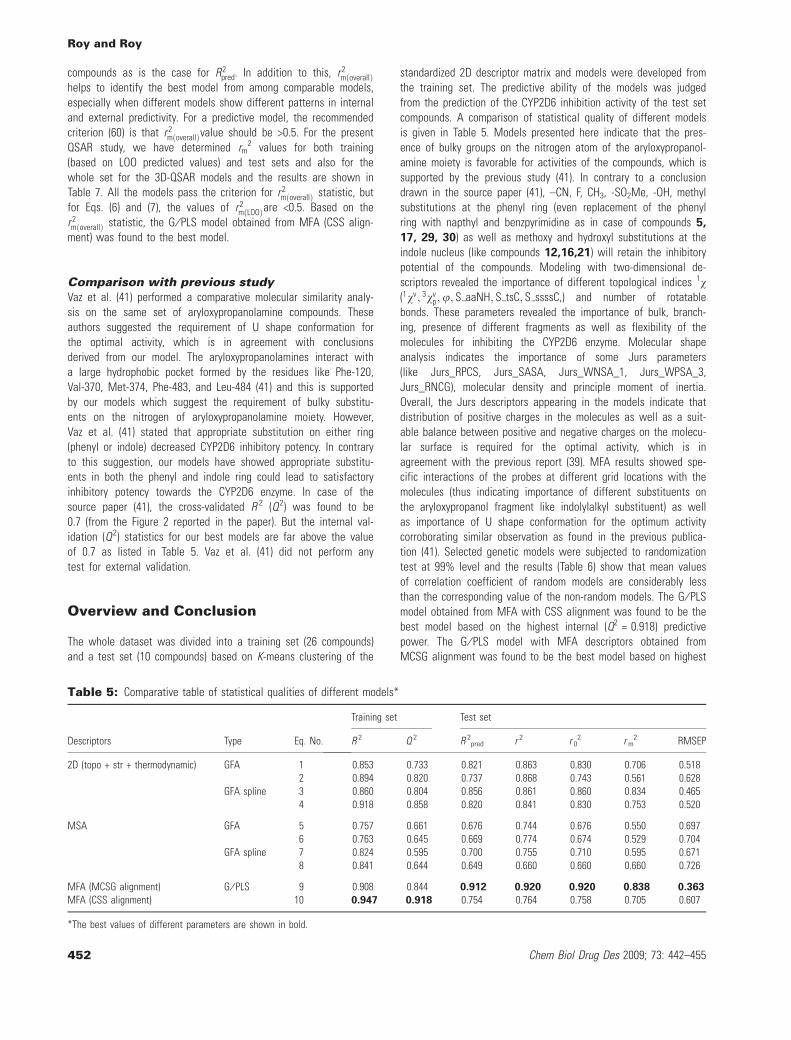
standardized 2D descriptor matrix and models were developed fromthe training set. The predictive ability of the models was judgedfrom the prediction of the CYP2D6 inhibition activity of the test setcompounds. A comparison of statistical quality of different modelsis given in Table 5. Models presented here indicate that the pres-ence of bulky groups on the nitrogen atom of the aryloxypropanol-amine moiety is favorable for activities of the compounds, which issupported by the previous study (41). In contrary to a conclusiondrawn in the source paper (41), –CN, F, CH3, -SO2Me, -OH, methylsubstitutions at the phenyl ring (even replacement of the phenylring with napthyl and benzpyrimidine as in case of compounds 5,
17, 29, 30) as well as methoxy and hydroxyl substitutions at theindole nucleus (like compounds 12,16,21) will retain the inhibitorypotential of the compounds. Modeling with two-dimensional de-scriptors revealed the importance of different topological indices 1v(1vv; 3vv
p;u; S aaNH; S tsC; S ssssC,) and number of rotatablebonds. These parameters revealed the importance of bulk, branch-ing, presence of different fragments as well as flexibility of themolecules for inhibiting the CYP2D6 enzyme. Molecular shapeanalysis indicates the importance of some Jurs parameters(like Jurs_RPCS, Jurs_SASA, Jurs_WNSA_1, Jurs_WPSA_3,Jurs_RNCG), molecular density and principle moment of inertia.Overall, the Jurs descriptors appearing in the models indicate thatdistribution of positive charges in the molecules as well as a suit-able balance between positive and negative charges on the molecu-lar surface is required for the optimal activity, which is inagreement with the previous report (39). MFA results showed spe-cific interactions of the probes at different grid locations with themolecules (thus indicating importance of different substituents onthe aryloxypropanol fragment like indolylalkyl substituent) as wellas importance of U shape conformation for the optimum activitycorroborating similar observation as found in the previous publica-tion (41). Selected genetic models were subjected to randomizationtest at 99% level and the results (Table 6) show that mean valuesof correlation coefficient of random models are considerably lessthan the corresponding value of the non-random models. The G ⁄ PLSmodel obtained from MFA with CSS alignment was found to be thebest model based on the highest internal (Q2 = 0.918) predictivepower. The G ⁄ PLS model with MFA descriptors obtained fromMCSG alignment was found to be the best model based on highest
Table 5: Comparative table of statistical qualities of different models*
Descriptors Type Eq. No.
Training set Test set
R 2 Q 2 R 2pred r 2 r 0
2 r m2 RMSEP
2D (topo + str + thermodynamic) GFA 1 0.853 0.733 0.821 0.863 0.830 0.706 0.5182 0.894 0.820 0.737 0.868 0.743 0.561 0.628
GFA spline 3 0.860 0.804 0.856 0.861 0.860 0.834 0.4654 0.918 0.858 0.820 0.841 0.830 0.753 0.520
MSA GFA 5 0.757 0.661 0.676 0.744 0.676 0.550 0.6976 0.763 0.645 0.669 0.774 0.674 0.529 0.704
GFA spline 7 0.824 0.595 0.700 0.755 0.710 0.595 0.6718 0.841 0.644 0.649 0.660 0.660 0.660 0.726
MFA (MCSG alignment) G ⁄ PLS 9 0.908 0.844 0.912 0.920 0.920 0.838 0.363
MFA (CSS alignment) 10 0.947 0.918 0.754 0.764 0.758 0.705 0.607
*The best values of different parameters are shown in bold.
Roy and Roy
452 Chem Biol Drug Des 2009; 73: 442–455

external ðR 2pred ¼ 0:912Þ predictive power with lowest RMSEP
value (0.363). Again, based upon the r 2mvalues, which penalizes a
model for large differences between observed and predicted values,the G ⁄ PLS-derived model obtained from MFA descriptors (MCSGalignment) was found to be superior ðr 2
m ¼ 0:838Þ in comparison tothe other models listed in Table 5. But based on the r 2
mðoverallÞ statis-tic, the G ⁄ PLS model obtained from MFA (CSS alignment) wasfound to be the best model among all models listed in Table 7. TheMFA model derived from CSS alignment was poor in terms of exter-nal statistics than the model derived from MCSG alignment sug-gesting dependence on model performance on alignment strategy.All the other models derived from either 2D descriptors or fromMSA analysis were of statistically significance as shown in Table 5.The results indicate performance of 2D descriptors-derived modelsis better than that of the MSA-derived models based on externaland internal validation statistics as listed in Table 5.
Acknowledgments
This research work is supported by a Major Research Grant of Uni-versity Grant Commission (UGC), New Delhi. One of the authors (P.P. Roy) thanks the UGC, New Delhi for a fellowship.
References
1. Guengerich F.P. (2002) Cytochrome P450. In: Ioannides C., editor.Enzyme Systems That Metabolize Drugs and Other Xenobiotics,Chapter 2. New York: Wiley; p. 33–65.
2. Nelson D.R. (1999) Cytochrome P450 and the Individuality ofSpecies. Arch Biochem Biophys;369:1–10.
3. Nelson D.R., Koymans L., Kamataki T., Stegeman J.J., FeyereisenR., Waxman D.J., Waterman M.R., Gotoh O., Coon M.J., Esta-brook R.W., Gunsalus I.C., Nebert D.W. (1996) P450 superfamily:
update on new sequences, gene mapping, accession numbersand nomenclature. Pharmacogenetics;6:1–42.
4. Anzenbacher P., Anzenbacherova E. (2001) Cytochromes P450and metabolism of xenobiotics. Cell Mol Life Sci;58:737–747.
5. Lewis D.F.V. (1996) Cytochromes P450: Structure, Function andMechanism. London: Taylor & Francis.
6. Lewis D.F.V. (2001) Guide to Cytochromes P450 Structure andFunction. London: Taylor & Francis.
7. Ortiz de Montellano P.R. (1995) Cytochrome P450. New York:Plenum.
8. Bertz R.J., Granneman G.R. (1997) Use of in vitro and in vivodata to estimate the likelihood of metabolic pharmacokineticinteractions. Clin. Pharmacokinet;32:210–258.
9. Fromm M.F., Kroemer H.K., Eichelbaumm M. (1997) Impact ofP450 genetic polymorphism on the first-pass extraction of car-diovascular and neuroactive drugs Adv. Drug Deliv. Rev;27:171–199.
10. Bertilsson L., Dahl M.L. (1996) Polymorphic drug oxidation: rele-vance to the treatment of psychiatric disorders. CNS Drugs;5:200–223.
11. Gotoh O. (1992) Substrate recognition sites in cytochrome P450family 2 (CYP2) proteins inferred from comparative analyses ofamino acid and coding nucleotide sequences. J Biol Chem;267:83–90.
12. Rendic S., DiCarlo F.J. (1997) Human cytochrome P450 enzymes:a status report summarizing their reactions, substrates, inducers,and inhibitors. Drug Metabol Rev;29:413–580.
13. Bazeley P.S., Prithivi S., Struble C.A., Povinelli R.J., Sem D.S.(2006) Synergistic use of compound properties and dockingscores in neural network modeling of CYP2D6 binding: predictingaffinity and conformational sampling. J Chem Inf Model;46:2698–2708.
14. McFadyen M.C.E., Melvin W.T., Murray G.I. (1998) Regionaldistribution of individual forms of cytochrome P450 mRNA innormal adult human brain. Biochem Pharmacol;55:825–830.
15. Flores A., Gast�lum E.M., Bosseno M.F., OrdoÇez R., Kasten F.L.,Espinoza B., Ramsey J., Breni�re S.F. (2001) Isoenzyme variabilityof five principal triatomine vector species of Chagas disease inMexico. Infect Genet Evol;1:21–28.
16. Frist W.H., Groves J.R., Merrill W.H., Connors A.W., StewartK.A., Luce P.A., Walker B.L., Heim C.R. (1992) Physiologicalexercise response in heart transplant recipients at 1 year. Trans-plant Proc;24:2672–2673.
17. Ingelman-Sundberg M. (2005) Genetic polymorphisms of cyto-chrome P450 2D6 (CYP2D6): clinical consequences, evolutionaryaspects and functional diversity. Pharmacogenomics J;5:6–13.
Table 6: Results of randomization test of the developed models
Eq. No 1 2 3 4 5 6 7 8 9 10
Modelling technique GFA GFA (spline) GFA GFA (spline) G ⁄ PLS
R from non-random model 0.923 0.946 0.927 0.958 0.870 0.873 0.908 0.917 0.952 0.973Confidence level (%) 99 99 99 99 99 99 99 99 99 99Mean value of R from random trials
€ standard deviation0.390
€ 0.1280.416
€ 0.1100.270
€ 0.1370.337
€ 0.1300.366
€ 0.1010.387
€ 0.1210.335
€ 0.1070.301
€ 0.1020.111
€ 0.2100.178
€ 0.246
Table 7: Values of additional validation parameters suggestedby Roy and Roy (60)
Eq. No r2m(LOO) r2
m(test) r2m(overall)
5 0.508 0.550 0.5456 0.498 0.529 0.5307 0.461 0.594 0.5218 0.500 0.653 0.5319 0.831 0.838 0.85310 0.894 0.703 0.865
QSAR Studies of CYP2D6 Inhibitors
Chem Biol Drug Des 2009; 73: 442–455 453

18. Zanger U.M., Raimundo S., Eichelbaum M. (2004) CytochromeP450 2D6: overview and update on pharmacology, genetics, bio-chemistry. Naunyn Schmiedebergs Arch Pharmacol;369:23–37.
19. Bertilsson L., Dahl M.L., Dalen P., Al-Shurbaji A. (2002) Molecu-lar genetics of CYP2D6: clinical relevance with focus on psycho-tropic drugs. Br J Clin Pharmacol;53:111–122.
20. Hishiki T., Shimada H., Nagano S., Egawa T., Kanamori Y., Maki-no R., Park S.Y., Adachi S., Shiro Y., Ishimura Y. (2000) X-raycrystal structure and catalytic properties of Thr252Ile mutant ofcytochrome P450cam: roles of Thr252 and water in the activecenter. J Biochem (Tokyo);128:965–974.
21. Ito Y., Kondo H., Goldfarb P.S., Lewis D.F.V. (2008) Analysis ofCYP2D6 substrate interactions by computational methods. J MolGraphics Model;26:947–956.
22. Guengerich F.P., Miller G.P., Hanna I.H., Martin M.V., Leger S.,Black C., Chauret N., Silva J.M., Trimble L.A., Yergey J.A.,Nicoll-Grith D.A. (2002) Diversity in the oxidation of substratesby cytochrome P450 2D6: lack of an obligatory role of aspartate301-substrate electrostatic bonding. Biochemistry;41:11025–11034.
23. Meyer U.A. (1994) The molecular basis of genetic polymor-phisms. of drug metabolism. Pharm Pharmacol;46:409–415.
24. Alva¢n G., Bechtel P., Iselius L., Gundert-Remy U. (1990) Hydrox-ylation polymorphisms of debrisoquine and mephenytoin in Euro-pean populations. Eur J Clin Pharmacol;39:533–537.
25. Daly A.K., Brockmoller J., Broly F., Eichelbaum M., Evans W.E.,Gonzalez F.J., Huang J.D., Idle J.R., Ingelman-Sundberg M., Ishi-zaki T., Jacqz-Aigrain E., Meyer U.A., Nebert D.W., Steen V.M.,Wolf C.R., Zanger U.M. (1996) Nomenclature for human CYP2D6alleles. Pharmacogenetics;6:193–201.
26. Tyndale R., Aoyama T., Broly F., Matsunaga T., Inaba T., KalowW., Gelboin H.V., Meyer U.A., Gonzalez F.J. (1991) Identificationof a new variant CYP2D6 allele lacking the codon encoding Lys-281: possible association with the poor metabolizer phenotype.Pharmacogenetics;1:26–32.
27. Johansson I., Oscarson M., Yue Q.Y., Bertilsson L., Sjoqvist F.,Ingelman-Sundberg M. (1994) Genetic analysis of the Chinesecytochrome P4502D locus: characterization of variant CYP2D6genes present in subjects with diminished capacity for debrisoq-uine hydroxylation. Mol Pharmacol;46:452–459.
28. Ingelman-Sundberg M. (2005) Genetic polymorphisms of cyto-chrome P450 2D6 (CYP2D6): clinical consequences, evolutionaryaspects and functional diversity. Pharmacogenom J;5:6–13.
29. De Groot M.J., Ackland M.J., Horne V.A., Alex A.A., Jones B.C.(1999) Novel approach to predicting P450-mediated drug metab-olism: development of a combined protein and pharmacophoremodel for CYP2D6. J Med Chem;42:1515–1524.
30. De Groot M.J., Bijloo G.J., Hansen K.T., Vermeulen N.P. (1995)Computer prediction and experimental validation of cytochromeP4502D6-dependent oxidation of GBR 12909. Drug Metab. Dis-pos;23:667–669.
31. Kapitany T., Meszaros K., Lenzinger E., Schindler S.D., Barnas C.,Fuchs K., Sieghart W., Aschauer H.N., Kasper S. (1998) Geneticpolymorphisms for drug metabolism (CYP2D6) and tardive dyski-nesia in schizophrenia. Schizophrenia Res;32:101–106.
32. Agundez J.A., Martinez C., Olivera M., Gallardo L., Ladero J.M.,Rosado C., Prados J., Rodriguez-Molina J., Resel L., Benitez J.(1998) Expression in human prostate of drug- and carcinogen-
metabolizing enzymes: association with prostate cancer risk. BritJ Cancer;78:1361–1367.
33. Bordet R., Broly F., Destee A., Libersa C. (1994) Genetic polymor-phism of cytochrome P450 2D6 in idiopathic Parkinson's diseaseand diffuse Lewy body disease. Clin Neuropharm;17:484–488.
34. McCann S.J., Pond S.M., James K.M., Le Couteur D.G. (1997)The association between polymorphisms in the cytochrome P-450 2D6 gene and Parkinson's disease: a case-control study andmeta-analysis. J Neurol Sci;153:50–53.
35. Droll K., Bruce-Mensah K., Otton S.V., Gaedigk A., Sellers E.M.,Tyndale R.F. (1998) Comparison of three CYP2D6 probe sub-strates and genotype in Ghanaians, Chinese and Caucasians.Pharmacogenetics;8:325–333.
36. Niwa T., Okada K., Hiroi T., Imaoka S., Narimatsu S., Funae Y.(2008) Effect of psychotropic drugs on the 21-hydroxylation ofneurosteroids, progesterone and allopregnanolone, catalyzed byrat CYP2D4 and human CYP2D6 in the brain. Biol PharmBull;31:348–351.
37. Punglia R.S., Burstein H.J., Winer E.P., Weeks J.C. (2008) Phar-macogenomic variation of CYP2D6 and the choice of optimaladjuvant endocrine therapy for postmenopausal breast cancer: amodeling analysis. J Natl Cancer Inst;100:642–648.
38. Yamashita F., Hara H., Ito T., Hashida M. (2008) Novel hierarchi-cal classification and visualization method for multiobjectiveoptimization of drug properties: application to structure-activityrelationship analysis of cytochrome P450 metabolism. J ChemInf Model;48:364–369.
39. McMasters R.D., Torres A.R., Crathern J.S., Dooney L.D., Nach-bar B.R., Sheridan P.R., Korzekwa R.K. (2007) Inhibition of recom-binant cytochrome P450 isoforms 2D6 and 2C9 by diverse drug-like molecules. J Med Chem;50:3205–3213.
40. Haji-Momenian S., Rieger J.M., Macdonald T.L., Brown M.L.(2003) Comparative molecular field analysis and QSAR on sub-strates binding to cytochrome p450 2D6. Bioorg MedChem;11:5545–5554.
41. Vaz R.J., Nayeem A., Santone K., Chandrasena G., Gavai A.V.(2005) A 3D-QSAR model for CYP2D6 inhibition in the aryl-oxypropanolamine series. Bioorg Med Chem Lett;15:3816–3820.
42. Cerius2 version 4.8 is a product of Accelrys, Inc., San Diego,USA, http://www.accelrys.com/cerius2
43. Leonard J.T., Roy K. (2006) On Selection of Training and TestSets for the Development of Predictive QSAR models. QSARComb Sci;25:235–251.
44. Roy K., Mandal A.S. (2008) Development of linear and nonlinearpredictive QSAR models and their external validation usingmolecular similarity principle for anti-HIV indolyl aryl sulfones.J Enz Inh Med Chem;980–995.
45. Everitt B.S., Landau S., Leese M. (2001) Cluster Analysis.London: Edward Arnold.
46. Hopfinger A.J., Tokarsi J.S. (1997) Three dimensional quantita-tive structure activity relationship analysis. In: Charifson P.S.,editor. Practical Applications of Computer-Aided Drug Design.New York: Marcel Dekker, p. 105–164.
47. Hirashima A., Eiraku T., Kuwano E., Eto M. (2003) Three-Dimensional Molecular Field Analyses of Agonists for TyramineReceptor which Inhibit Sex-Pheromone Production in Plodia inter-punctella. Internet Electron J Mol Des;2:511–526.
Roy and Roy
454 Chem Biol Drug Des 2009; 73: 442–455

48. Fan Y., Shi L.M., Kohn K.W., Pommier Y., Weinstein J.N. (2001)Quantitative structure-antitumor activity relationships of camp-tothecinanalogues: cluster analysis and genetic algorithm-basedstudies. J Med Chem;44:3254–3263.
49. Rogers D., Hopfinger A.J. (1994) Application of genetic functionapproximation to quantitative structure-activity relationship andquantitative structure-property relationship. J Chem Inf ComputSci;34:854–866.
50. Dunn W.J. III, Rogers D. (1996) Genetic partial least squares inQSAR. In: Devillers J., editor. Genetic Algorithms in MolecularModeling. London: Academic Press, p. 109–130.
51. Hasegawa K., Miyashita Y., Funatsu K. (1997) GA strategy forvariable selection in QSAR studies: GA-based PLS analysis of cal-cium channel antagonists. J Chem Inf Comput Sci;37:306–310.
52. Snedecor G.W., Cochran W.G. (1967) Statistical Methods.New Delhi: Oxford & IBH.
53. Wold S., Eriksson L. (1995) Validation tools. In: van de Water-beemd H., editor. Chemometric Methods in Molecular Design.Weinheim: VCH, p. 312–317.
54. Debnath A.K. (2001) Quantitative structure-activity relationships:A versatile toll in drug design. In: Ghose A.K., ViswanadhanV.N., editors. Combinatorial Library Design and Evaluation. NewYork: Marcel Dekker, p. 73–129.
55. Roy K. (2007) On Some aspects of validation of predictive QSARmodels. Expert Opin Drug Discov;2:1567–1577.
56. Roy P.P., Roy K. (2008) On some aspects of variable selection forpartial least squares regression models. QSAR Comb Sci;27:302–313.
57. Roy P.P., Leonard J.T., Roy K. (2008) Exploring the impact of thesize of training sets for the development of predictive QSARmodels. Chemom Intell Lab Sys;90:31–42.
58. Eriksson L., Jaworska J., Worth A.P., Cronin M.T.D., RobertMcDowell M., Gramatica P. (2003) Methods for reliability anduncertainty assessment and for applicability evaluations of clas-sification and regression-based QSARs. Environ Health Per-spect;111:1361–1375.
59. Golbraikh A., Tropsha A. (2002) Beware of q2! J Mol GraphicsModel;20:269–276.
60. Roy K., Roy P.P. (2008) Comparative QSAR studies of CYP1A2inhibitor flavonoids using 2D and 3D descriptors. Chem BiolDrug Des;72:370–382.
Supporting Information
Additional Supporting Information may be found in the online ver-sion of this article:
Table S1. Important topological descriptors.
Table S2. Values of the important MSA descriptors.
Table S3. Important MFA descriptors (MCSG alignment model).
Table S4. Important MFA descriptors (CSS alignment model).
Please note: Wiley-Blackwell is not responsible for the content orfunctionality of any supporting materials supplied by the authors.Any queries (other than missing material) should be directed to thecorresponding author for the article.
QSAR Studies of CYP2D6 Inhibitors
Chem Biol Drug Des 2009; 73: 442–455 455