quakesim: grid computing, web services, and portals for earthquake science marlon pierce community...
TRANSCRIPT
QuakeSim: Grid Computing, Web Services, and Portals for
Earthquake Science
Marlon Pierce
Community Grids Lab
Indiana University

Acknowledgements Prof. Geoffrey Fox, CGL Director Many external collaborators: Andrea Donnellan and team
(JPL), Yehuda Bock and team (Scripps/UCSD), Neil Devadason, John Buechler, and David Coats (POLIS)
Dr. Yili Gong Graduate Students
Choonhan Youn (now with GEON project)* Galip Aydin* Harshawardhan Gadgil Mehmet S. Aktas Ahmet Sayar Zhigang Qi Zao Liu Jong Youl Choi

Grids and CyberinfrastructureCyberinfrastructure is a term coined by the
National Science Foundation in the famous “Atkins Report”.http://www.nsf.gov/od/oci/reports/toc.jspProf. Dan Atkins (UM) is now the head of
NSF’s Office of Cyberinfrastructure.Roughly synonymous with
eScience (UK)Grid Computing (DOE and NSF)Global Information Grid (DOD), etc.

What Is CI, Really? Computing, Data Storage, Networking
NSF TeraGrid (www.teragrid.org) Open Sciences Grid (www.opensciencegrid.org) Many international equivalents
Middleware Globus: multi-institutional security, job management, file transfer,
data management, system monitoring Condor: Cycle-scavenging and job scheduling. And many others: see for example the TeraGrid’s Common
TeraGrid Software Stack, the OSG’s Virtual Data Toolkit and the NMI Grids Center for composite releases.
Scientific Gateways (like QuakeSim) Useful Online Services
NIH’s PubMed, PubChem Most Grids are built these days with Web Services and
follow Service Oriented Architecture principles.

QuakeSim Project Requirements and
ArchitectureContributions from Choonhan
Youn, Ahmet Sayar, Galip Aydin, Harsh Gadgil, and collaborators’
codes

Science GatewaysQuakeSim is an example of a science
gateway.Google “TeraGrid Science Gateways” for
other examples.Combines a Web portal and Web
services to access on-line data sources and connect them to geophysical applications running on computing resources.

QuakeSim Applications and Their DataPattern Informatics (UC-Davis)
Earthquake forecasting code, uses seismic archives as input
Regularized Dynamic Annealing Hidden Markov Method (RDAHMM) (JPL)Time series analysis code, can be applied to GPS and
seismic archives. Identifies signal components (possibly associated with
underlying physical causes) with no fixed parameters.GeoFEST (JPL/CalTech)
Finite element code for detailed modeling of fault stresses, seismic displacements, uses fault models as input.

Data Requirements QuakeTables Fault Database
QuakeSim’s fault repository for California. Compatible with GeoFEST, Disloc, VC
GPS Data sources and formats (RDAHMM and others). JPL: ftp://sideshow.jpl.nasa.gov/pub/mbh SOPAC: ftp://garner.ucsd.edu/pub/timeseries USGS: http://pasadena.wr.usgs.gov/scign/Analysis/plotdata/
Seismic Event Data (RDAHMM and others) SCSN: http://www.scec.org/ftp/catalogs/SCSN SCEDC: http://www.scecd.scec.org/ftp/catalogs/SCEC_DC Dinger-Shearer: http://www.scecdc.org/ftp/catalogs/dinger-
shearer/dinger-shearer.catalog Haukkson:
http://www.scecdc.scec.org/ftp/catalogs/hauksson/Socal

JSP + Client Stubs
DB Service
JDBC
DB
Job Sub/Mon And FileServices
Operating andQueuing Systems
WSDLWSDL
Browser Interface
WSDL
WSDL
WSDLWSDL WSDL
VisualizationOr MapService
DB
WSDL
Host 1 (WFS) Host 2 (Grid) Host 3 (WMS)
My “octopus” diagram, from the archives.
SOAP/HTTP
HTTP(S)

GIS Services as a Data Grid We decided that the Data Grid components of SERVO is
best implemented using standard GIS services. Use Open Geospatial Consortium standards Maximize reusability in future QuakeSim projects Provide downloadable GIS software to the community as a side
effect of QuakeSim research. We implemented two cornerstone standards
Web Feature Service (WFS): data service for storing abstract map features
Supports queries Faults, GPS, seismic records
Web Map Service (WMS): generate interactive maps from WFS’s and other WMS’s.
We built these as Web Services WSDL and SOAP: programming interfaces and messaging formats You can work with the data and map services through
programming APIs as well as browser interfaces. See www.crisisgrid.org.

Plotting Google satellite maps with QuakeTables fault overlays for Los Angeles.

Pattern Informatics
This has been our simplest “proving ground” example.
Integrates (streaming) WFS, WMS, WS-Context, and HPSearch’s WSProxy services (wraps PI executable and helper format conversion services).
This is basically a linear workflow

Whole earth seismic catalog plotted on NASA map server. Combines streaming feature server and map server.
Pattern informatics results combined with Feature and Map servers can be used to forecast areas of increased earthquake probability.

Data Flow or Event Flow? Octopus slide implies a sequential data flow between
applications on distributed hosts. Usually called “scientific workflow” in the CI community. See http://vtcpc.isi.edu/wiki/ for the an overview and players. See www.hpsearch.org for our work to using JavaScript as a
workflow language. This is not MPI or parallel programming. It’s more like a stone
age mash-up. Services don’t need to know much about each other. Don’t have to be from the same providers
Loosely coupled. Transfer data (or URL pointers) as needed.
Event flow and traditional message passing are better suited for closely coupled applications. See for example DOE’s CCA project and NASA’s Earth System
Modeling Framework (ESMF).

Portlet Development
We use JSR 168 portlets to build sharable portal plugins.

Portlets: Portal Components
Web portals are essentially websites with logins.Personalization, content control, etc, derive from
this.Java portals are based on a standard
component/container model.Componets are called portletsJSR 168 is the standard
Many TeraGrid and other science gateways use this standard.
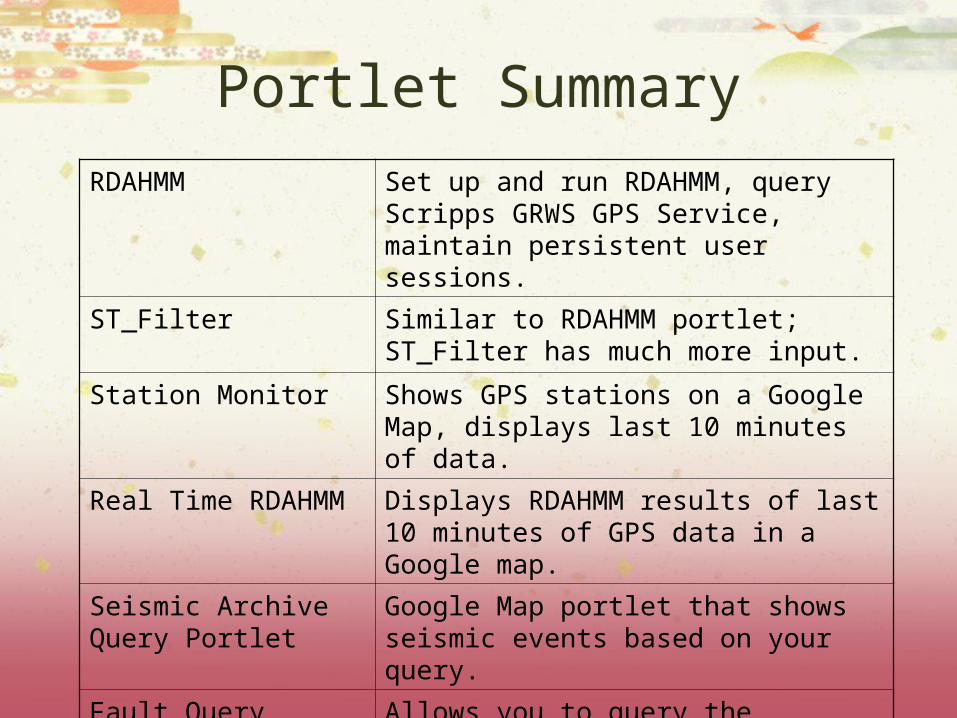
Portlet Summary
RDAHMM Set up and run RDAHMM, query Scripps GRWS GPS Service, maintain persistent user sessions.
ST_Filter Similar to RDAHMM portlet; ST_Filter has much more input.
Station Monitor Shows GPS stations on a Google Map, displays last 10 minutes of data.
Real Time RDAHMM Displays RDAHMM results of last 10 minutes of GPS data in a Google map.
Seismic Archive Query Portlet
Google Map portlet that shows seismic events based on your query.
Fault Query Portlet Allows you to query the QuakeTables fault data base for information on faults.
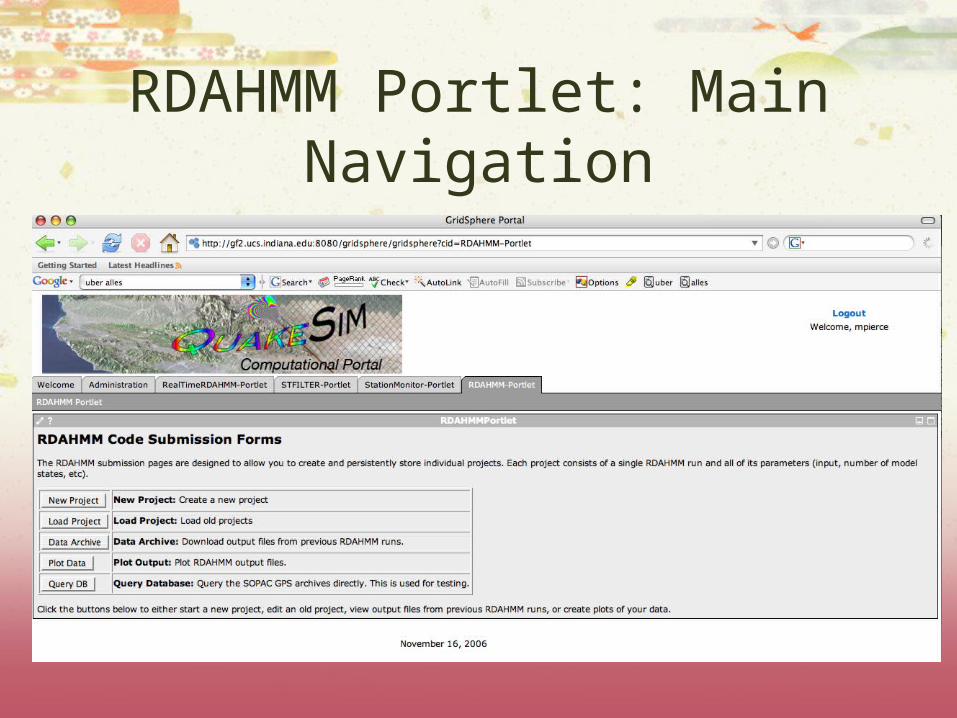
RDAHMM Portlet: Main Navigation

RDAHMM Project Set Up

RDAHMM GRWS Query Interface

RDAHMM Results Page

Real Time RDAHMM Portlet

Station Monitor Portlet

ST_Filter Portlets

Managing Real Time GPS Data
Slides from Galip Aydin

California Real Time Network
Network Data Rates Message Format
Time RYO ASCII GML
CRTN GPS Site Positions(9 Stations)
1 second 1.5KB 4.03KB 48.7KB
1 hour 5.31MB 14.18MB 171.31MB
1 day 127.44MB 340.38MB 4.01GB
1 month 3.8GB 9.97GB 123.3GB
1 year 45.8GB 119.67GB 1.41TB
Entire SCIGN Network (250
stations)1year 1.23TB 16.18TB 160TB
Continuous GPS Stations (CGPS) are depicted as triangles while the Real-Time stations are represented as circles. Image is obtained from SOPAC GPS Explorer at http://sopac.ucsd.edu/projects/realtime
How does one manage all the data generated by the 85 stations? How can you get just the data you want?
Note this is fundamentally different from traditional request/response style Web Services.

Processing Real-Time GPS Streams
27
Raw Data
70107010
70117011
70127012
RYOPorts
NB Server
ScrippsRTD
Server
ScrippsRTD
Server
Raw Data
A Complete Sensor Message Processing Path, including a data analysis application.
GPS Networks

Application Integration with Real-Time Filters
Station Monitor Filter records real-time positions for 10 minutes and calculates position changes
Graph Plotter Application creates visual representation of the positions.
RDAHMM Filter records real-time positions for 10 minutes and invokes RDAHMM application which determines state changes in the XYZ signal.
Graph Plotter Application creates visual representation of the RDAHMM output.
28

2 – Multiple Publishers Test
We add more GPS networks by running more publishers. The results show that 1000 publishers can be supported
with no performance loss. This is an operating system limit.29
Topic 1A
Topic 1B
Topic 2
Topic n

4 – Multiple Brokers Test NaradaBrokering allows
creation of Broker networks. We create a two-broker
network. Messages published to first
broker can be received from the second broker.
We take timings on each broker.
We connect 750 clients to each broker and run for 24 hours. We chose 750 clients to stay well below the saturation limit.
The results show that the performance is very good and similar to single broker test. 30
NB Server
1
NB Server
2
Topic 1A
Topic 1B
Topic 1B
NB Server
2

Supporting Geographical Information Systems
Slides courtesy of Zao Liu

Integrating Map Servers Geographical Information Systems combine online dynamic
maps and databases. Many GIS software packages exist GIS servers around state of Indiana
ESRI ArcIMS and ArcMap Server (Marion, Vanderburgh, Hancock, Kosciusco, Huntington, Tippecanoe)
Autodesk MapGuide (Hamilton, Hendricks, Monroe, Wayne)
WTH Mapserver™ Web Mapping Application (Fulton, Cass, Daviess, City of Huntingburg) based on several Open Source projects (Minnesota Map Server)
Challenge: make 17 different county map servers from different companies work together.
92 counties in Indiana, so potentially 92 different map servers.

Considerations We assume heterogeneity in GIS map and feature
servers. GIS services are organized bottom-up rather than top-down. Local city governments, 92 different county governments,
multiple Indiana state agencies, inter-state (Ohio, Kentucky) consideration, federal government data providers (Hazus).
Must find a way to federate existing services. We must reconcile ESRI, Autodesk, OGC, Google Map,
and other technical approaches. Must try to take advantage of Google, ESRI, etc rather than
compete. We must have good performance and interactivity.
Servers must respond quickly--launching queries to 20 different map servers is very inefficient.
Clients should have simplicity and interactivity of Google Maps and similar AJAX style applications.

Caching and Tiling Maps
Federation through caching: WMS and WFS resources are queried and results are stored on the cache
servers. WMS images are stored as tiles.
These can be assembled into new images on demand (c. f. Google Maps). Projections and styling can be reconciled. We can store multiple layers this way.
We build adapters that can work with ESRI and OGC products; tailor to specific counties.
Serving images as tiles Client programs obtain images directly from our tile server.
That is, don’t go back to the original WMS for every request. Similar approaches can be used to mediate WFS requests. This works with Google Map-based clients. The tile server can re-cache and tile on demand if tile sections are
missing.

35
Browser +Google Map API
Cass County Map Server
(OGC Web Map Server)
Hamilton County Map Server(AutoDesk)
Marion County Map Server
(ESRI ArcIMS)
Browser client fetches image tiles for the bounding box using Google Map API. Tile Server
Cache Server
Adapter Adapter Adapter
Tile Server requests map tiles at all zoom levels with all layers. These are converted to uniform projection, indexed, and stored. Overlapping images are combined.
Must provide adapters for each Map Server type .
The cache server fulfills Google map calls with cached tiles at the requested bounding box that fill the bounding box.
Google Maps Server

Map Server ExampleMarion and Hancock county parcel plots and IDs are overlaid on IU aerial photographic images that are accessed by this mashup using Google Map APIs.
We cache and tile all the images from several different map servers. (Marion and Hancock actually use different commercial software.)

Final Thoughts

It’s the Data, Stupid Grids have been distracted by complicated security issues.
Accounts, allocations, authentication, etc on supercomputers. It assumes a lot of people actually want to do this. But arguably most people really want access to data and
results, not computers. Ex: PubChem has properties on 12 million drug-like molecules
online, can be browsed for free. The Grid security model is equivalent to actually giving you a key
to the lab. My suggestion: leave the Grid to the experts and try to
think of as many online data services that can be created using results from TeraGrid resources.
Challenge: use all of the TeraGrid, NASA, Open Science Grid, China National Grid, etc, etc to opportunistically perform these calculations. Why not? The infrastructure is there.

Multiple Grid Job Execution

Web 2.0?QuakeSim and many similar science gateways
have generally correct approach...Web Services, online components.
...but arguably the details need to be changed.We have been following the Enterprise model
(IBM, HP, MS, Sun). JSR 168, WSRP, WSDL, SOAP, WS-*
Maybe time to switch to the Internet model Google desktop, Netvibes startpage Programmable Web, mash ups, AJAX, REST, etc.


The End
http://www.tryscience.org/grid/master/master.html

WFS+
Seismic Rec.
WSDL
WFS+
State Bounds
WSDL
WMS+
OnEarthOr
Google Maps
“REST”
…
AggregatingWMS
Stubs
Web MapClient
Stubs
WSDL
SOAPHTTP

Tying It All Together: HPSearch HPSearch is an engine for orchestrating distributed Web Service
interactions It uses an event system and supports both file transfers and data
streams. Legacy name
HPSearch flows can be scripted with JavaScript HPSearch engine binds the flow to a particular set of remote
services and executes the script. HPSearch engines are Web Services, can be distributed
interoperate for load balancing. Boss/Worker model
ProxyWebService: a wrapper class that adds notification and streaming support to a Web Service.
More info: http://www.hpsearch.org


SensorGrid Architecture Major components:
Real-Time filters Publish-Subscribe System Information Service
Filters can be run as Web Services to create workflows.
Filter Chains can be deployed for complex processing.
Streaming messaging provide high-performance transfer options.
46