qualitative analysis using r: a free analytic tool
TRANSCRIPT

The Qualitative Report The Qualitative Report
Volume 22 Number 4 How To Article 2
4-1-2017
Qualitative Analysis Using R: A Free Analytic Tool Qualitative Analysis Using R: A Free Analytic Tool
Samantha Estrada University of Northern Colorado, [email protected]
Follow this and additional works at: https://nsuworks.nova.edu/tqr
Part of the Quantitative, Qualitative, Comparative, and Historical Methodologies Commons, and the
Social Statistics Commons
Recommended APA Citation Recommended APA Citation Estrada, S. (2017). Qualitative Analysis Using R: A Free Analytic Tool. The Qualitative Report, 22(4), 956-968. https://doi.org/10.46743/2160-3715/2017.2659
This How To Article is brought to you for free and open access by the The Qualitative Report at NSUWorks. It has been accepted for inclusion in The Qualitative Report by an authorized administrator of NSUWorks. For more information, please contact [email protected].

Qualitative Analysis Using R: A Free Analytic Tool Qualitative Analysis Using R: A Free Analytic Tool
Abstract Abstract R (R Development Core Team, 2011) is a powerful tool to analyze statistical data. In recent years R has gained popularity because the software is free and open source. However, evaluators and researchers do not exclusively use quantitative data. It is possible to perform qualitative analysis in R. Using data from a case study exploring a family psychoeducation recovery course, this article provides users a tutorial on how to perform a qualitative analysis and data visualization using R.
Keywords Keywords R, RQDA, Qualitative Research, Thematic Analysis
Creative Commons License Creative Commons License
This work is licensed under a Creative Commons Attribution-Noncommercial-Share Alike 4.0 License.
This how to article is available in The Qualitative Report: https://nsuworks.nova.edu/tqr/vol22/iss4/2

The Qualitative Report 2017 Volume 22, Number 4, How To Article 1, 956-968
Qualitative Analysis Using R: A Free Analytic Tool
Samantha Estrada University of Northern Colorado, Greely, Colorado, USA
R (R Development Core Team, 2011) is a powerful tool to analyze statistical
data. In recent years R has gained popularity because the software is free and
open source. However, evaluators and researchers do not exclusively use
quantitative data. It is possible to perform qualitative analysis in R. Using data
from a case study exploring a family psychoeducation recovery course, this
article provides users a tutorial on how to perform a qualitative analysis and
data visualization using R. Keywords: R, RQDA, Qualitative Research,
Thematic Analysis
Installing R
R is an open source statistical software. The website for The R Project for Statistical
Computing where users can download R can be found in the references for this paper. R can
be installed in UNIX platforms, Windows, and MacOS. The directions presented in this article
are based on R version 3.1.1.
Setting the working directory helps users when reading or writing files to a specific
location. While this is not necessary to run the R package for Qualitative Data Analysis
(RQDA) and other packages used in this article, it will make it easier for R users in the long
run as the user will avoid having to search in different folders for files. In R, the symbol #
defines a comment. A comment is basically an annotation for the programmer and will not be
executed by the program. For example, reading a file from a folder “Case Study” within the
“Documents” folder in the C drive would look like:
# Set the working directory
setwd("C:\\Documents\\Case Study")
If using Windows, it is recommended to use double slash when writing the path “\\”;
however, if using Mac, use the forward slash instead “/”.
RQDA
The RQDA package is a free qualitative software application that can be used instead
of more expensive qualitative software. Huang (2014) states that RQDA is an “integrated
platform for both quantitative and qualitative data analysis” (para 1). RQDA is a useful tool for
evaluators and students alike. In order to use any package in R, in this case the RQDA package
created by Huang (2014), it is necessary to load and install the package in R. This is a one-time
procedure; however, if the user wishes to open the RQDA files in a different computer, it will
be necessary to install R and the RQDA package again.
The first step would be to open R once the software is installed in the computer. To be
able to install a package the user must open R and click on the “Packages” top menu. A new
drop-down menu will appear from this list. The user should select “Install package(s)” then a
new pop up window will appear on the screen. This pop-up window is a Comprehensive R
Archive Network (CRAN) mirror. Select the preferred location from the list and click OK. A
new window labeled “Packages” will appear on the screen, and from this list it is necessary to
Samantha Estrada 957
locate RQDA. Click OK and allow the RQDA package to download. A window should pop-
up prompting the user to install “Gtk+”.
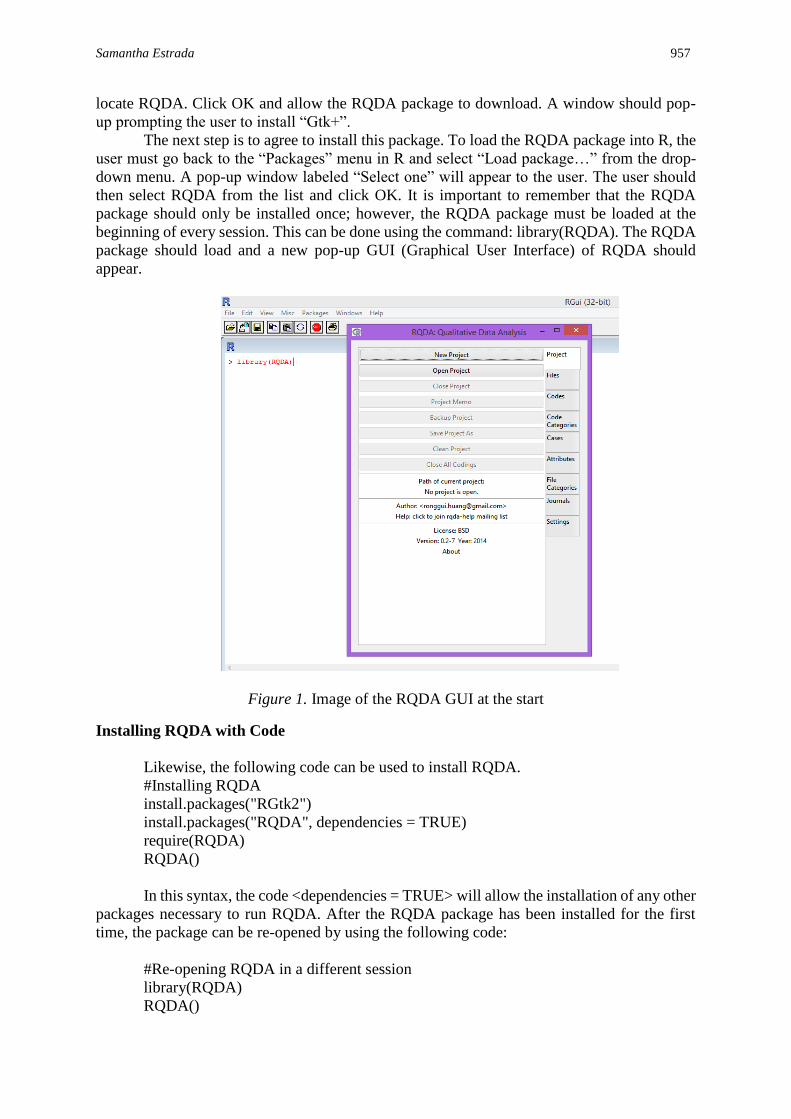
The next step is to agree to install this package. To load the RQDA package into R, the
user must go back to the “Packages” menu in R and select “Load package…” from the drop-
down menu. A pop-up window labeled “Select one” will appear to the user. The user should
then select RQDA from the list and click OK. It is important to remember that the RQDA
package should only be installed once; however, the RQDA package must be loaded at the
beginning of every session. This can be done using the command: library(RQDA). The RQDA
package should load and a new pop-up GUI (Graphical User Interface) of RQDA should
appear.
Figure 1. Image of the RQDA GUI at the start
Installing RQDA with Code
Likewise, the following code can be used to install RQDA.
#Installing RQDA
install.packages("RGtk2")
install.packages("RQDA", dependencies = TRUE)
require(RQDA)
RQDA()
In this syntax, the code <dependencies = TRUE> will allow the installation of any other
packages necessary to run RQDA. After the RQDA package has been installed for the first
time, the package can be re-opened by using the following code:
#Re-opening RQDA in a different session
library(RQDA)
RQDA()

958 The Qualitative Report 2017
Loading Qualitative Data
To be able to load qualitative data such as interview transcripts, the user should click
in the “New Project” button. Then, the user should give the project a name, and select where
to save the project, for example, Documents folder. This will create a file with the extension
.rqda. The user should note that it is possible to transfer this file to a different computer and
open the project given that R and RQDA are installed on that computer. After creating a project,
files can be imported into the project. These files can be the interview files after transcription.
Files can be imported by clicking the “Import” button under the “Files” tab. It is recommended
that the file should be plain text with an ASCII encoding (Huang, 2014). If it is necessary to
open a file and read it, the user will need to click the “Open” button or double click on the file.
If a file needs to be deleted, the user must first select the file and then click the “Delete”
button. Under the “Settings” tab, the user will be able to change or edit the name of the coder,
along with other customizations such as color. This is a useful setting in projects where there
is more than one coder.
Thematic Analysis
In the evaluation field, the collection of qualitative data is common. Thematic analysis
is widely used by researchers and evaluators alike (Braun & Clarke, 2006). In fact, thematic
analysis is one of the first methods the qualitative researcher learns, and it is the basis to
learning and performing different types of qualitative analyses (Braun & Clarke, 2006).
Thematic analysis works by having the researcher analyze the data, searching important
emerging themes in describing the case or phenomenon of interest. A theme refers to a specific
pattern that consistently can be found in the data. Next, the researcher aggregates the
information into large “clusters of ideas and provides details that support the themes”
(Creswell, 2007, p. 244). The result of thematic analysis should emphasize the most prominent
characteristics and meanings contained within the data.
Perform Thematic Analysis Using RQDA
For this article, the data used will be from a case study evaluation from an online
recovery course (Estrada, 2016). The author interviewed four different participants regarding
their perspectives and experiences with an online recovery course. After analyzing the data, the
researcher identified six major categories from the interviewees’ responses: (a) Recovery
oriented psychoeducation, (b) Online format of psychoeducation, (c) Curriculum and class
mechanics, (d) Need for the program, (e) Future program direction (f) Limitations of the
program. Four separate interviews were uploaded to RQDA.
In order to create themes, the user must click the “Codes” tab. The user should think
of “Codes” as the themes in thematic analysis. Depending on the framework of the study, the
codes can be created theoretically. If a code is created theoretically, it is driven by the
researcher’s knowledge and expectations of the content area and data collected. The choice
between inductive and theoretical thematic analysis is one made by the researcher. Yet, the
choice determines how the data will be coded. For example, in theoretical thematic analysis a
code could be one of the research questions for the study.
Once the researcher has decided between inductive or theoretical, the next step is to
begin coding. The user should begin by opening a transcript, and reading through the data.
When the user identifies a theme in RQDA, he or she should select the text and under the
“Codes” tab to select the “Mark” button. This will highlight the text and create a label at the
beginning of the code. Figure 2 shows the result of clicking in the “Mark” button: the label

Samantha Estrada 959
<International> is created at the beginning of the highlighted text. The code and theme
“International” contains all the references made by the participants in this study describing the
background diversity participants in the online psychoeducation course. To check on the data
that has been coded, the user can double-click on the code. The process of code retrieval will
gather everything that has been coded under that theme. The codes that pertain to Online
Psychoeducation will appear in a separate pop-up window, which will also contain the number
of codes as well as information on the original source of the text. If it is necessary to undo a
coding, the user must select the same text and click the “Unmark” button. A coding is
successfully deleted when the highlight is no longer seen.
Figure 2. After coding under the “international” theme
Within the RQDA package the user is able to right click on any code under the “Codes”
tab in order to either highlight all codings within a specific theme; code a specific theme under
the memo section of RQDA, or show specific codes stored under the theme, memos or
categories. It is also possible to sort the codings and codes in a specific theme by using this
menu, as well as to assign colors to the codes.
Cases
The user can create a case under the “Cases” tab. Creating a case will allow the
researcher to assign attributes to that case. A file can be assigned to a case in two ways. The
first is by adding an entire file to a case. This is done by selecting the file under the “Files” tab
right-clicking so that a pop-up menu appears, and then selecting “add to case…” The second
form a file can be assigned is by selecting a case name and then clicking the button “Link”
under the “Cases” tab.
Confidentiality is important in qualitative research. Often, qualitative researchers use
pseudonyms and unidentifiable IDs. The command getCases() is helpful when it is necessary
to identify the case ID as well as the case name, or pseudonym, given to the participants. This
command can also be useful when opening data that has not been used over a certain period of
time in order to refresh the user’s memory regarding the data. However, it is important for the
user to know that these commands are not available through the GUI. Instead the commands
will be typed in R’s main window. The function getCaseIds() will return the case IDs or names
assigned to a set of files. If it is necessary to see the case’s name, the function getCaseNames()
is useful and uses getCaseIds() as one of the parameters. nFiles will return the number of files
that belong to a specific case. Finally, the getCases() function retrieves the case names or IDs,
depending on the argument <names>. Both getCaseIds() and getCases() utilize the function
getFileIds() in order to retrieve the names or IDs from a file that is currently in use. Those
commands are listed below:

960 The Qualitative Report 2017
# Retrieve the number of cases and the case name
getCaseIds(fid = getFileIds(), nFiles = FALSE)
# Returns the names of the IDs
getCaseNames(caseId = getCaseIds(nFiles = FALSE))
# Returns the case Names or IDs
getCases(fid=getFileIds(), names = TRUE)
Figure 3 Demonstrates the output from each of these three commands. The output
reveals four participants in this case study of family psychoeducation. These four participants
have the case IDs 1-4. Likewise, the names given to these four participants were Participant1
through Participant4.
Figure 3. getCaseIds(), getCaseNames() and getCases() output
Attributes and Descriptive Information
Under the “Attributes” tab, the researcher can describe the unit of analysis. These can
include, for example, the age, socioeconomic status, gender and other variables of the
participants. The attributes will depend on the unit of analysis and the purpose of the study. In
RQDA it is possible to learn descriptive information about the codes by using the command
summaryCodings(). This command has to be written in the R command window, and it is not
available through the RQDA GUI interface. The summaryCoding()function will return the
"Number of codings for each code," "Average number of words associated with each code,"
and "Number of files associated with each code" in the R command window. Figure 4
represents the output from summaryCodings(). For example, the theme “Class Mechanics”
contains all mentions of how users interact within the online psychoeducation course, while
the theme “International” contains the participants’ comments that discuss how the course is
viewed and access internationally. In Figure 4 the theme “Class Mechanics” has four different
codes attributed to this theme, while the theme International has two codes.

Samantha Estrada 961
Figure 4. summaryCodings() output
getCodingTable()
The command getCodingTable() allows the researcher to have a descriptive look at the
data. The output, which can be seen in Figure 5, will contain the code (or themes) along with
the filename. In the case of this example, the filename also represents the participant
interviewed. The row ID, Case ID and File ID will also be provided in this table, along with
the code index from beginning to end and the code length.
Figure 5. getCodingTable() output

962 The Qualitative Report 2017
codingByOne()
The codingByOne() function is useful to researchers when searching for a specific code
in the data. It is helpful to run getCodingTable() first. For example, in the second line of Figure
5, we can see that Case ID (cid) is 1 and the File ID is 4. From Figure 5 and the execution of
getCodingTable() it is clear the code or theme in this location is “curriculum.” In AUTHOR
(2016), a recurrent theme was the use of an original curriculum to teach psychoeducation to
family members of people facing mental health challenges. If the user executes the following
code:
getCodingsByOne(cid=1, fid=4, codingTable=c("coding"))
This will return a pop-up window with the seven codes marked as “Curriculum” for the first
participant. The result can be seen in Figure 6. At the top of the window, the information is
displayed with the number 7 and file 1. Not all the seven codes are shown.
Figure 6. getCodingsByOne() output
codingBySearch()
The codingBySearch() function is helpful to researchers by finding a specific text in a
file and then applying a specific coding. Figure 7 shows the transcript before using the function
codingBySearch()

Samantha Estrada 963
Figure 7. Original transcript before codingBySearch()
This code should be typed in the R command window.
codingBySearch(“recovery", fid=getFileIds(), cid=9, separator="[.!?]")
The function will search for the word “recovery.” The fid argument will find the file ID. If the
user is in need to know what the file ID is he or she can always go to the file tab and select the
file of interest. The file ID can be seen on the top in Figure 8. This process can be followed to
find the code ID. The code ID or cid argument will code the string as “recovery.” “Separator”
tells the function to stop at the end of a sentence, which is defined by a “.”, “!” or “?”. Figure
9 shows the result of using the codingBySearch()function.
Figure 8. File ID

964 The Qualitative Report 2017
Figure 9. codingBySearch() output
The following code can be run:
codingBySearch("Curriculum", fid="4", cid="1")
Interrater Agreement
Reliability in qualitative research is as important as in quantitative research (Campbell,
Quincy, Osserman, & Pedersen, 2013). Interrater agreement can be performed by using the
CrossCodes() function. Two different people would have to code the data. For example, Rater1
would code the data. After Rater1 has finished coding, these codes must be deleted temporarily.
Then, Rater2 would code the same file. Next, utilizing the function undelete() the researcher
can recover the Rater1 codes. Finally, the researcher can use the function crossCodes() to check
for interrater agreement. This function will return the number of codes that match exactly.
Plot of Categories
In the GUI, the user can select the tab “Code Categories” and select all the codes by
pushing CTL + A. This will highlight all the code categories. Then right click the selection and
click on “Plot Selected Code Categories.” A new window will pop-up and after a few seconds,
a map of the data framework will be plotted. See Figure 10 to examine a visual graphic of the
themes. This is a simple example for demonstration purposes; however, RQDA is able to plot
more complex networks. In Figure 10, shows the subthemes “Origin,” “Online Format,” “Need
for Recovery Oriented Class” and “National Alliance on Mental Illness (NAMI) limitations,”
all cited within the overarching theme of the “Need for the Organization.”
Figure 10. Themes visualization.
Samantha Estrada 965
It is possible to change the theme vertex color and size by right clicking on the vertex.
Once the plot is final, the user is able to save the image to the computer using the Export menu.
The file will be saved in a .eps format, which can be used in Adobe Illustrator.
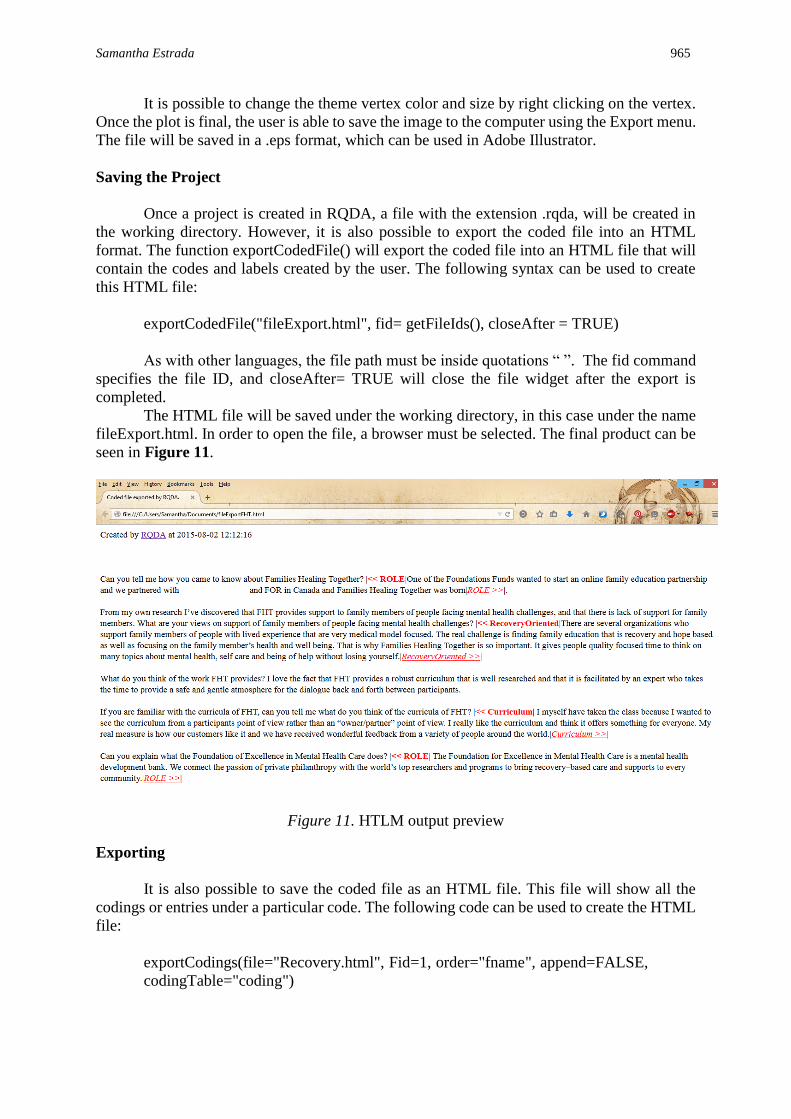
Saving the Project
Once a project is created in RQDA, a file with the extension .rqda, will be created in
the working directory. However, it is also possible to export the coded file into an HTML
format. The function exportCodedFile() will export the coded file into an HTML file that will
contain the codes and labels created by the user. The following syntax can be used to create
this HTML file:
exportCodedFile("fileExport.html", fid= getFileIds(), closeAfter = TRUE)
As with other languages, the file path must be inside quotations “ ”. The fid command
specifies the file ID, and closeAfter= TRUE will close the file widget after the export is
completed.
The HTML file will be saved under the working directory, in this case under the name
fileExport.html. In order to open the file, a browser must be selected. The final product can be
seen in Figure 11.
Figure 11. HTLM output preview
Exporting
It is also possible to save the coded file as an HTML file. This file will show all the
codings or entries under a particular code. The following code can be used to create the HTML
file:
exportCodings(file="Recovery.html", Fid=1, order="fname", append=FALSE,
codingTable="coding")

966 The Qualitative Report 2017
This code will collect the codings from the file ID number 1. However, it is important
to note that R is case sensitive, and the code must be submitted as specified. For example, file
ID should be capitalized. The codingTable argument specifies data table where codings are
stored. Normally, this data table is named either coding or coding2. Once the code is executed,
a GUI window will pop up. This window will contain all the themes created by the user. Figure
12 shows the GUI window.
Figure 12. Export window
Utilizing this window, the researcher can highlight the themes that he or she is
interested in (or even all the codes) by holding the Control key and clicking on each code
individually. The resulting HTML file can be seen in Figure 13. In this example, the selected
theme is “Curriculum” codes from the first participant.
Figure 13. HTML export file.

Samantha Estrada 967
Word Clouds
It is also possible to visualize qualitative data by using the text mining R package tm
by Feinerer and Hornik (2015). The package can be installed by following the steps at the
beginning of this article, but substituting tm for RQDA. Once the package is installed, the
function wordcloud() can be used to create a colorful word cloud. In a word cloud, the size of
the text represents the frequency of the word used in the transcript.
In order to load the text to R, the user may use a simple/copy pasting or the “corpus”
function from the tm package. A corpus is considered a compilation of documents, for example,
in the example worked in this paper the compilation of four interviews in four different text
files. Note that the path does not direct to a specific file; thus, the user must be careful on what
it is stored in the specified directory, or all files contained within the folder will be loaded.
yourPath <- DirSource("C:/Documents/Case Study/")
recoveryWords <- Corpus(yourPath)
If the user wishes to examine what has just been imported into R, the commands
“inspect” or “summary” can be used, for example inspect(recoveryWords). Next, the function
tm_map() is useful in other to remove unnecessary spaces and remove stopwords such as “the.”
Note that the package provides options for these stop words. In the example, the option
“SMART” is used. “SMART” is a list of stopwords in English. More information on the
package can be found in the documentation in the R website. However, “English” is also an
option, as well as other languages such as German and Romanian. Within the tm package it is
also possible to edit the text before creating the word cloud. Here are some helpful commands:
recoveryWords <- tm_map(recoveryWords, stripWhitespace)
recoveryWords <- tm_map(recoveryWords, removeWords,
stopwords(“SMART”))
recoveryWords <- tm_map(recoveryWords, tolower)
Finally, to create the word cloud, the command wordcloud(recoveryWords) can be
used. The argument <colors> in this function can be used to change the colors of the wordcloud.
Furthermore, the frequency of the words can be edited; for example, the arguments <min.freq>
and <max.words> allow the user to determine a minimum and a maximum number for words
to appear in the word cloud. Figure 14 shows the result of the word cloud.
Figure 14. Themes word cloud

968 The Qualitative Report 2017
Conclusion
Thematic analysis is one of the most flexible tools in qualitative methodology and thus
the basis of many more sophisticated qualitative approaches. RQDA offers students and
evaluators alike the opportunity to utilize qualitative software in their analyses. In combination
with additional R packages, R can help researchers, evaluators and students perform qualitative
research without having to pay for what is almost always an expensive software license.
Additionally, support for R, RQDA and other R packages is available online without cost.
References
Braun, V., & Clarke, V. (2006). Using thematic analysis in psychology. Qualitative Research
in Psychology, 3(2), 77-101. doi: 10.1191/1478088706qp063oa
Campbell, J. L., Quincy, C., Osserman, J., & Pedersen, O. K. (2013). Coding in-depth
semistructured interviews problems of unitization and intercoder reliability and
agreement. Sociological Methods and Research, 42(3), 597-606. doi:
10.1177/0049124113500475
Creswell, J. W. (2007). Qualitative inquiry and research design: Choosing among five
approaches. Thousand Oaks, CA: Sage.
Estrada, S. (2016). Families healing together: Exploring a family recovery online course. The
Qualitative Report, 21(7), 1216-1231. Retrieved from
http://nsuworks.nova.edu/tqr/vol21/iss7/3
Feinerer, I., & Hornik, K. (2015). TM: Text Mining Package Version 0.6-2 [Computer
software]. Retrieved from http://tm.r-forge.r-project.org/
Huang, R. (2014). RQDA: R-based Qualitative Data Analysis R Package Version 0.2-7
[Computer software]. Retrieved from http://rqda.r-forge.r-project.org
R Core Team. (2014). R: A language and environment for statistical computing. (3.0.3)
[Computer software]. Vienna, Austria: Foundation for Statistical Computing.
Retrieved from http://www.R-project.org/
Author Note
Samantha Estrada is a graduate student at the University of Northern Colorado and
adjunct faculty at AIMS Community College. Correspondence regarding this article can be
addressed directly to: [email protected].
Copyright 2017: Samantha Estrada and Nova Southeastern University.
Article Citation
Estrada, S. (2017). Qualitative analysis using R: A free analytic tool. The Qualitative Report,
22(4), 956-968. Retrieved from http://nsuworks.nova.edu/tqr/vol22/iss4/3