quality assessment of drug therapy - nih clinical … · quality assessment of drug therapy charles...
TRANSCRIPT
Quality Assessment of Drug Therapy
Charles E. Daniels, R.Ph., Ph.D.Pharmacist In Chief
Professor of Clinical PharmacyUniversity of CaliforniaSan Diego, California
March 5, 2009

Patient ConcernsDrug-Drug interaction 70%Wrong medicine 69%Cost of treatment 69%Complications from procedure 69%Cost of prescription medicines 67%Hospital acquired infection 49%
ASHP Survey: May 1 and 5, 2002
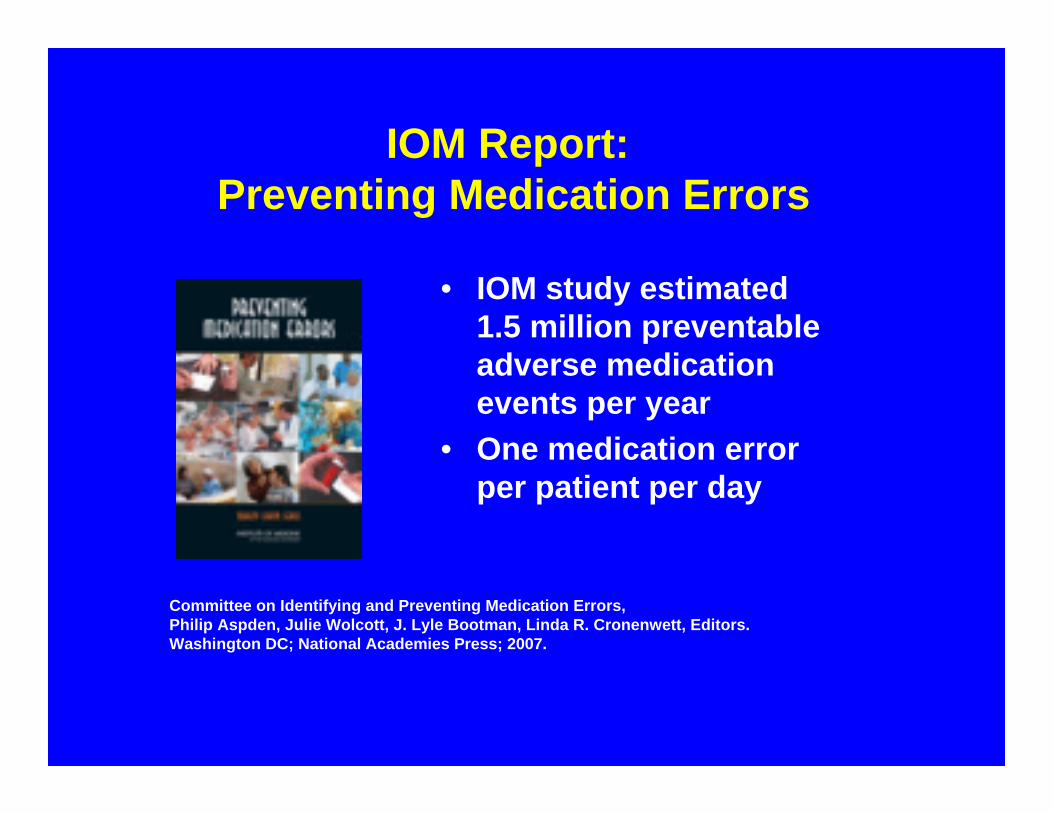
IOM Report: Preventing Medication Errors
Committee on Identifying and Preventing Medication Errors, Philip Aspden, Julie Wolcott, J. Lyle Bootman, Linda R. Cronenwett, Editors.Washington DC; National Academies Press; 2007.
• IOM study estimated 1.5 million preventable adverse medication events per year
• One medication error per patient per day
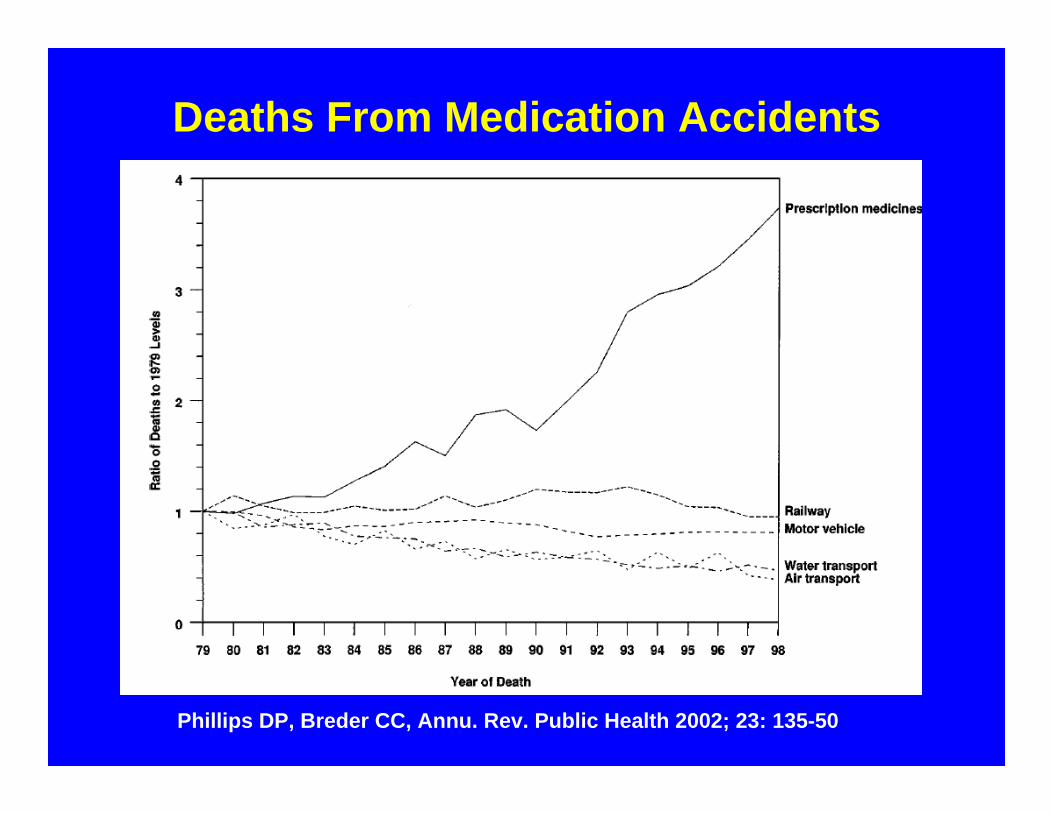
Phillips DP, Breder CC, Annu. Rev. Public Health 2002; 23: 135-50
Deaths From Medication Accidents

Drug Related Morbidity and Mortality Costs
Hospital $121 billionLong Term Care 33 billionPhysician visits 14 billionEmergency visits 5 billionAdded prescriptions 3 billionTotal $177 billion
Ernst, J Am Pharm Assn. 2001; 41:192-9 (Mar 2001)
Medication Use Quality
• Medication use process/system• Organizational interests in med use• Monitoring and improving med use
quality & outcomes• Identifying and reducing med errors
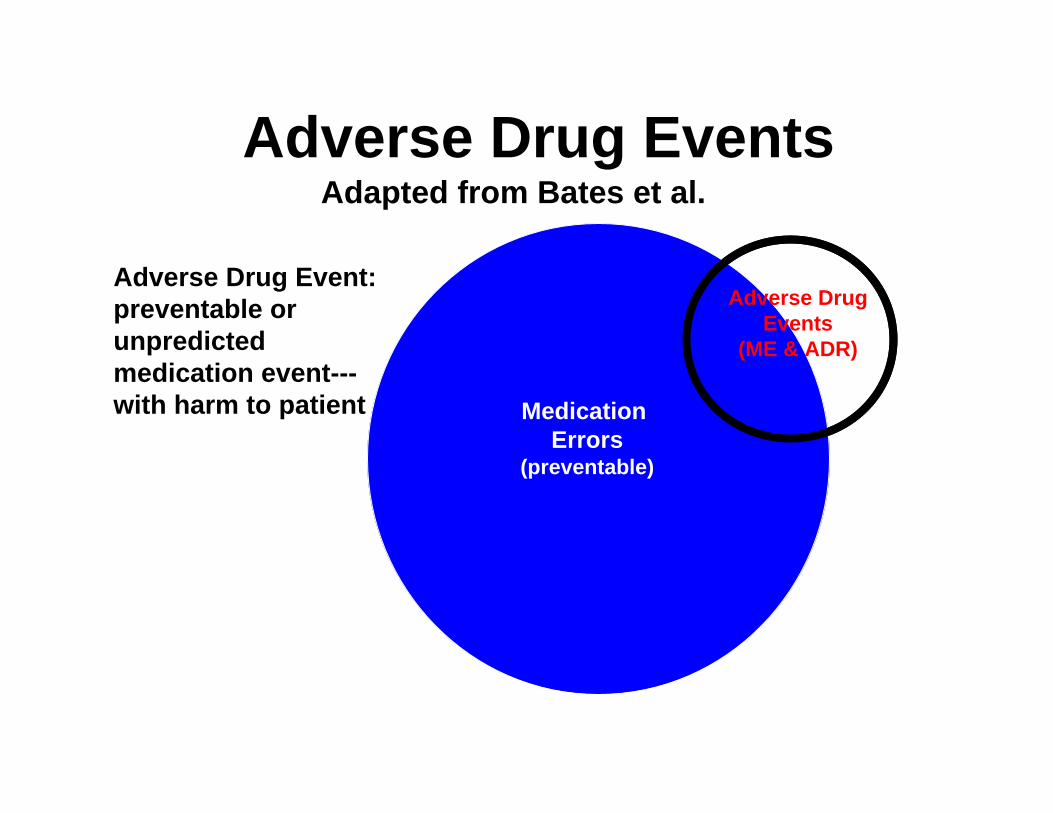
Adapted from Bates et al.Adverse Drug Events
Adverse Drug Event: preventable or unpredicted medication event---with harm to patient Medication
Errors(preventable)
Adverse Drug Events
(ME & ADR)

Cost Impact of ADE’s
Increased IncreasedLOS Cost
ADE 2.2 $3,244Preventable ADE 4.6 $5,857
Bates DW, et al. The Costs of Adverse Drug Events in Hospitalized Patients. JAMA. 1997; 277:307-311

Incidence of Preventable Drug Related Admissions
• Meta-analysis of 15 studies (1980-99)• 4.3% (2.5-19%) of all admissions were
drug related • >50% of drug related admissions are
preventableWinterstein AG, Sauer BC, Hepler CD, Poole C, Preventable Drug-Related Hospital Admissions.Ann Pharmacother 2002; 36:1238-48

Impact of Preventable Drug Related Admissions
• 158 ADR related admissions over 11 months (24% life threatening)
• 67% inappropriate monitoring of therapy (80% lab abnormality)
• 26% drug-drug interactions• 595 hospital days (6.1 day LOS)
McDonnell PJ and Jacobs MR. Hospital Admissions Resulting from Preventable Adverse Drug Reactions. Ann Pharmacother 2002; 36:1331-6

Medication Errors
Any preventable event that may cause or lead to inappropriate medication
use or patient harm while medication is in the control of the health care professional, patient or consumer
National Coordinating Council for
Medication Error Reporting and Prevention

Decision to Treat
Order Written
Interpreted by PharmacistInterpreted by Nurse
Prepared and dispensedTranscribed to MAR
Administered to patient
Monitor ResultsNurse
Physician Pharmacist
Patient Other
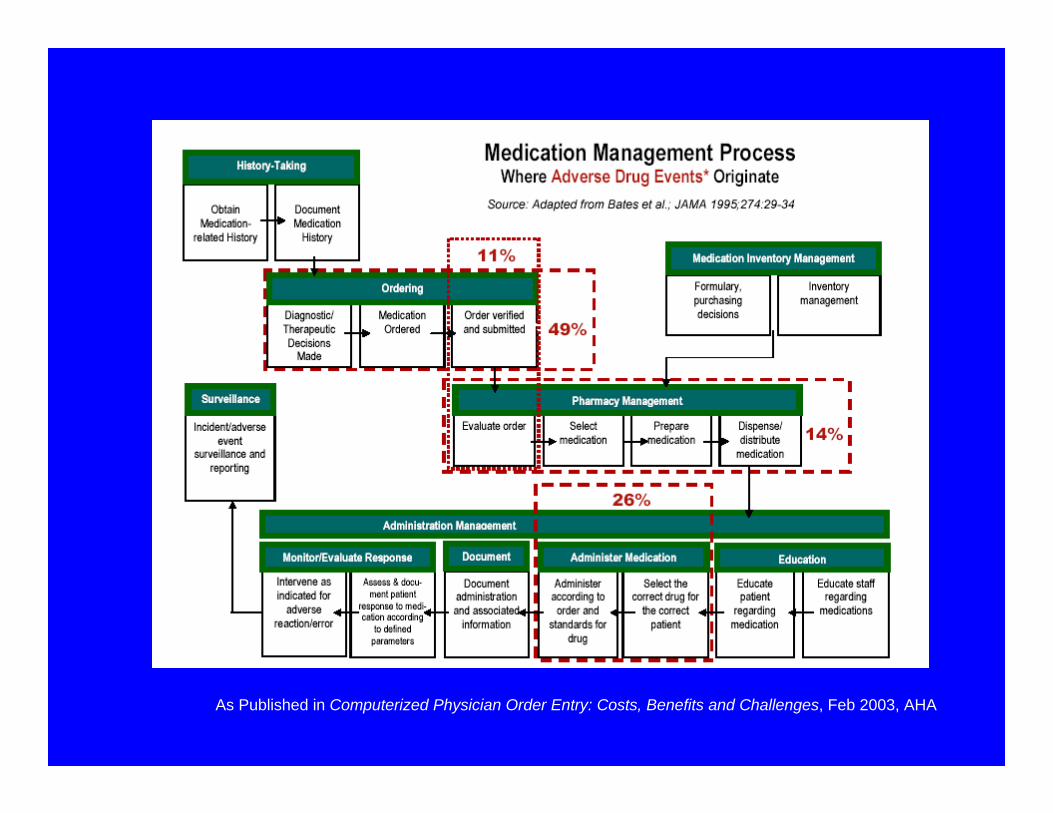
As Published in Computerized Physician Order Entry: Costs, Benefits and Challenges, Feb 2003, AHA
Medication Use Process
• Complex system• Opportunities for error• Impacts patient care and
research
Process Improvement
• Focus on systems• Data driven• Iterative Cycle Concept

Step 1: Planning stage (identify objectives, define data which may be available, define new data needs, plan change or test)
Step 2: Implementation or pilot stage (complete the planned changes or test)
Step 3: Observation stage (collect information on the effect of the planned changes which have been implemented)
Step 4: Evaluation stage (study the results of the changes implemented during this cycle)
The Shewhart cycle is repeated multiple cycles with expected improvements implemented in each new cycle
3 2
14
Shewhart Cycle in Quality Improvement

Organizational Interests
• What to use• When to use it• How to use it• Is it cost-effective• Will it be used safely

Pharmacy and Therapeutics Committee
Focus for medication relatedactivities within a health care
organization

P&T Committee Overview
• Medical Staff Committee• Oversight of medication use in the
organization• Staff experts in the medication use
process
P & T Committee Role
• Medication related policies• Formulary drug selection
and review• Evaluate medication use and
improve performance• Educate
Medication Policy Issues• Medication selection and
quality• Medication prescribing• Medication administration

FormularyA continuously updated list of
medications and related information representing the
clinical judgement of physicians, pharmacists, and other experts…
Principles of a Sound Drug Formulary System, 2000http://www.usp.org/pdf/EN/patientSafety/pSafetySndFormPrinc.pdf

Drug Selection
• Safety • Clinical Effectiveness• Cost Impact
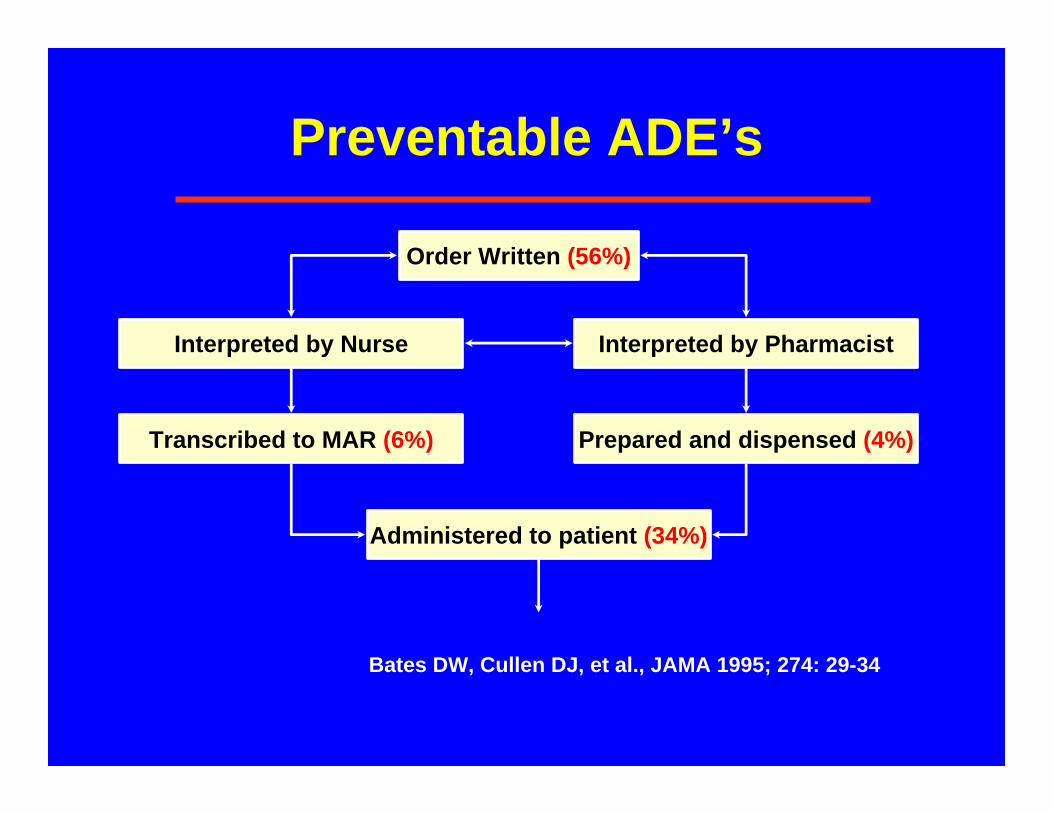
Order Written (56%)
Interpreted by PharmacistInterpreted by Nurse
Prepared and dispensed (4%)Transcribed to MAR (6%)
Administered to patient (34%)
Bates DW, Cullen DJ, et al., JAMA 1995; 274: 29-34
Preventable ADE’s
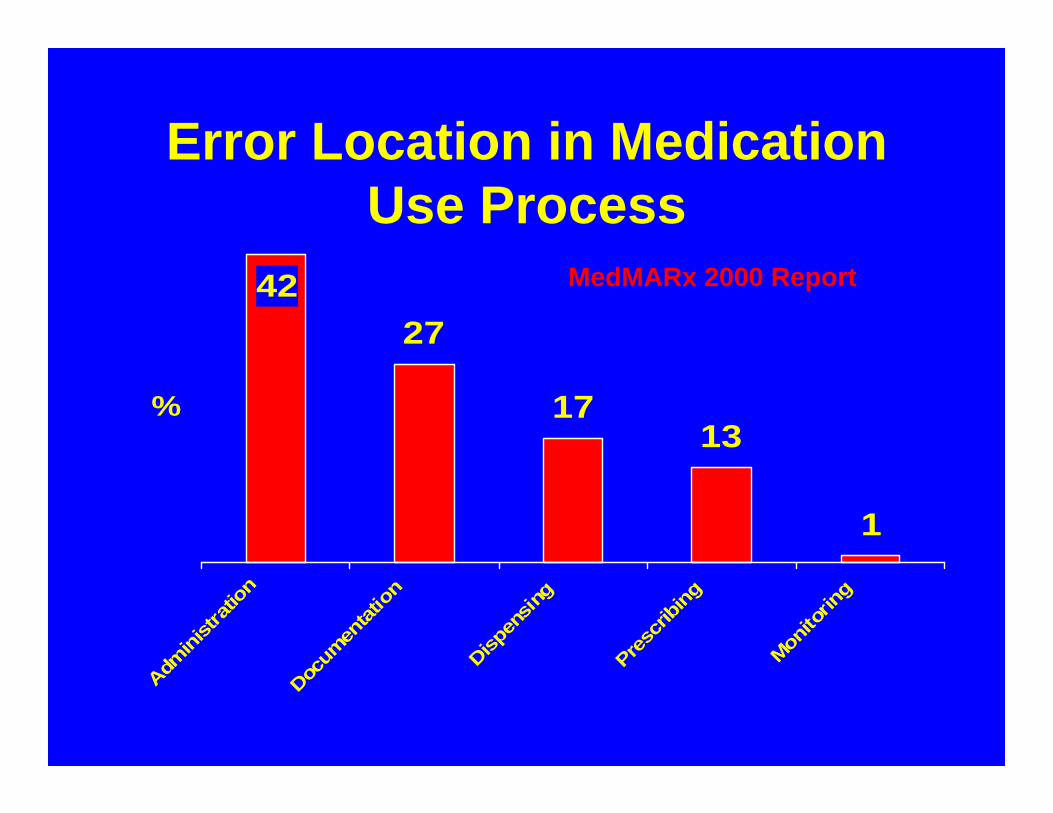
Error Location in Medication Use Process
MedMARx 2000 Report
27
1713
1
42
Admini
strati
on
Docum
entat
ion
Dispen
sing
Presc
ribing
Monito
ring
%

30
17
4
43
Wrong Time Omission Wrong Dose Wrong Drug
%
Errors in Medication Administration
Total Error Rate = 19%
Barker et al, Arch Int Med 2002
Excluding Wrong Time = 10%
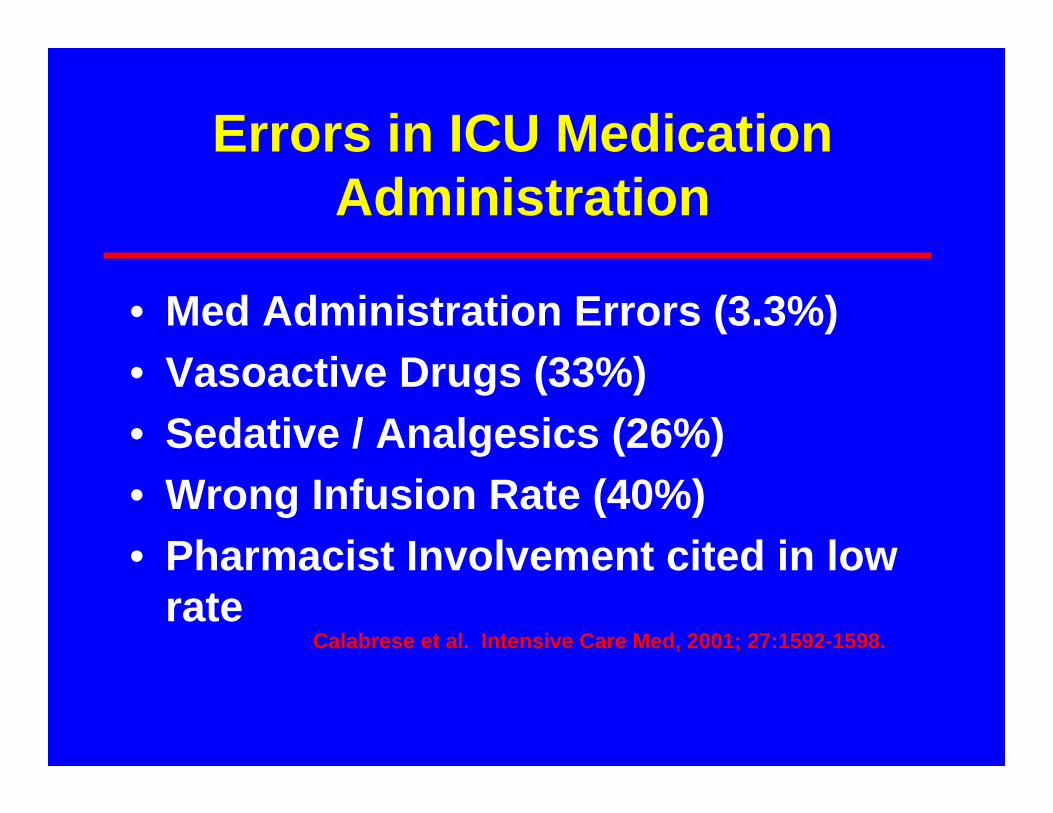
Errors in ICU Medication Administration
• Med Administration Errors (3.3%)• Vasoactive Drugs (33%)• Sedative / Analgesics (26%)• Wrong Infusion Rate (40%)• Pharmacist Involvement cited in low
rateCalabrese et al. Intensive Care Med, 2001; 27:1592-1598.

Error Type %Wrong dose 41Wrong drug 16Wrong route 9.5
MEDICATION ERROR DEATHS
Phillips J, Meam S, Brinker A, et al. Retrospective analysis of mortalitiesassociated with medication errors. Am J Health-sys Pharm, 2001; 58:1835-41.
FDA Adverse Events Reporting System 1993-98
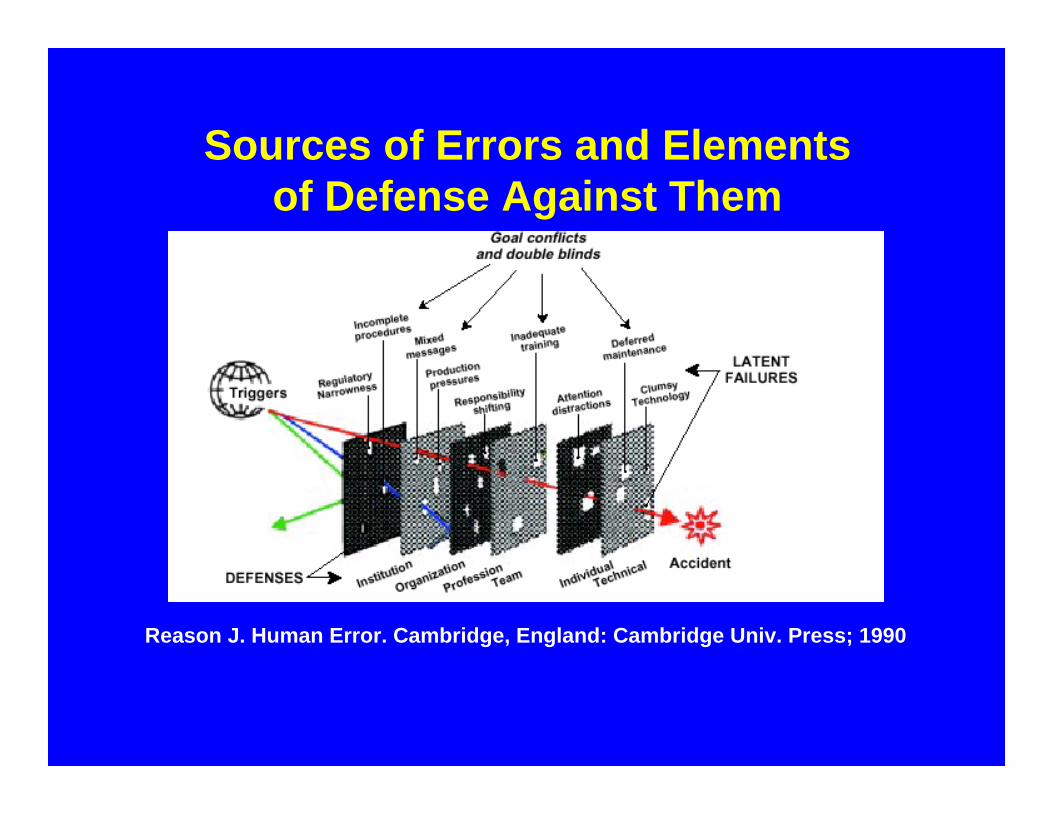
Sources of Errors and Elementsof Defense Against Them
Reason J. Human Error. Cambridge, England: Cambridge Univ. Press; 1990
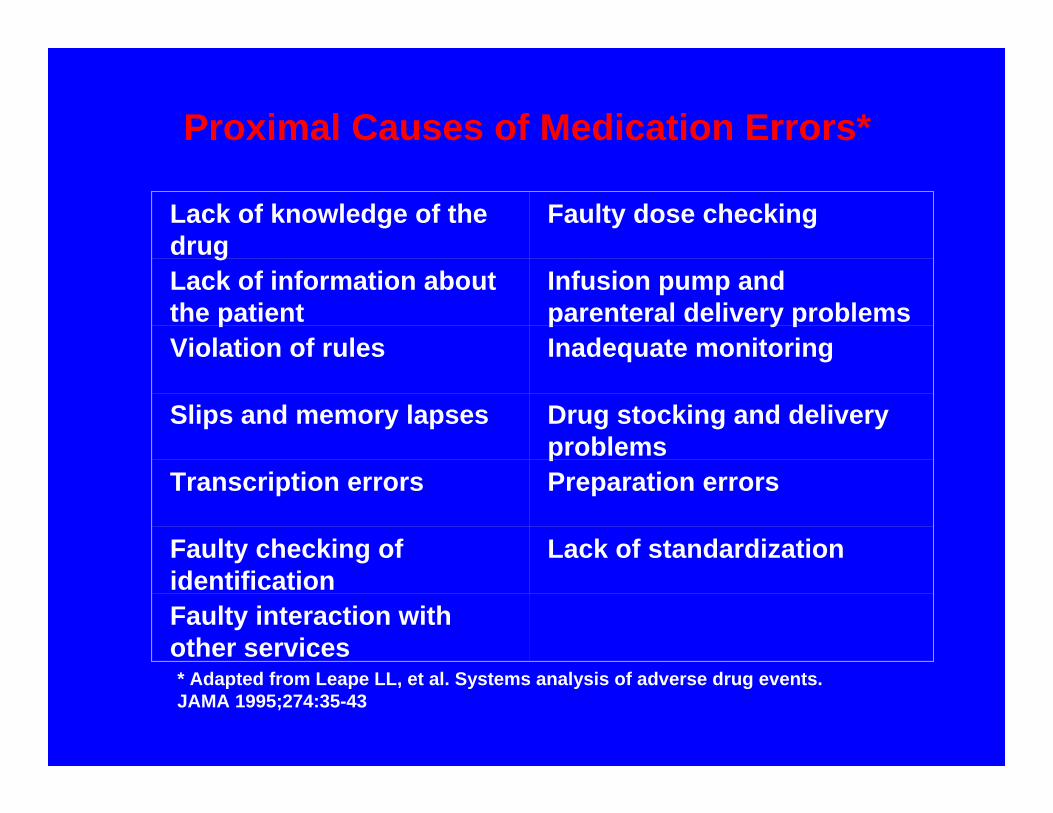
Proximal Causes of Medication Errors*
Lack of knowledge of the drug
Faulty dose checking
Lack of information about the patient
Infusion pump and parenteral delivery problems
Violation of rules Inadequate monitoring
Slips and memory lapses Drug stocking and delivery problems
Transcription errors Preparation errors
Faulty checking of identification
Lack of standardization
Faulty interaction with other services* Adapted from Leape LL, et al. Systems analysis of adverse drug events. JAMA 1995;274:35-43
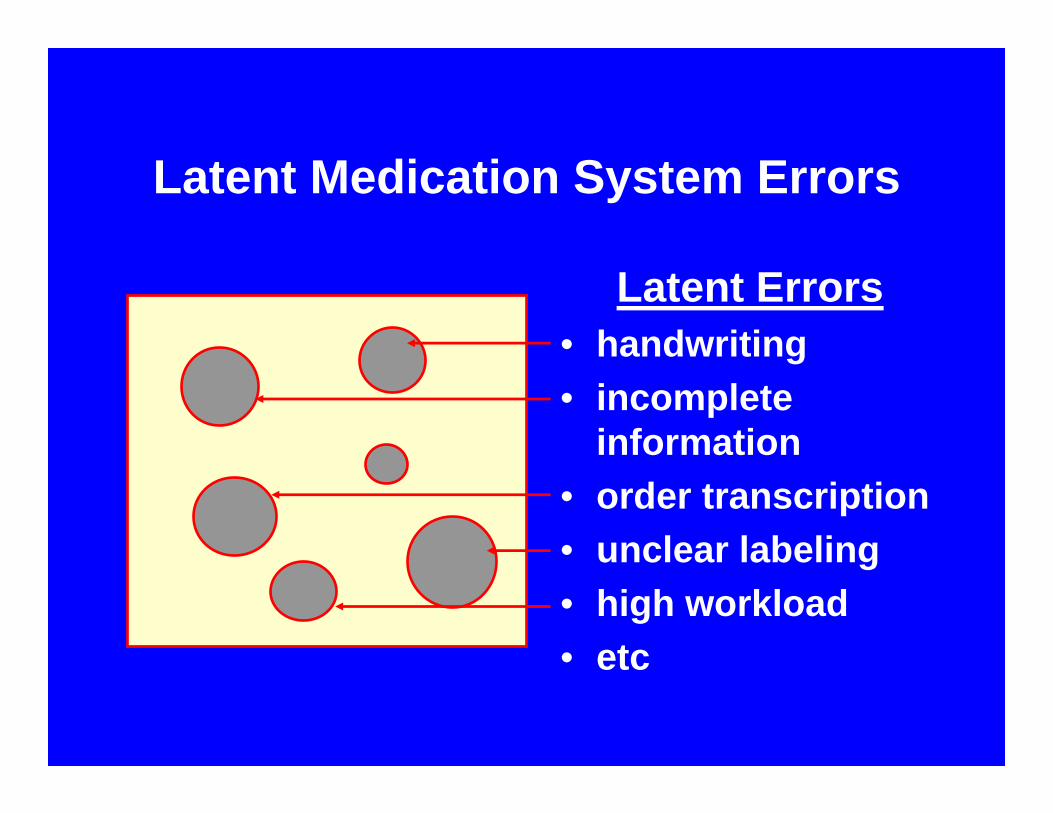
Latent Medication System Errors
Latent Errors• handwriting• incomplete
information• order transcription• unclear labeling• high workload• etc

Workload and Outcomes
1.09*
IP Mortality 30-day Re-admit
-5.11*-5.30*
Average Census
2.31*3.09*
Team admissions
that day
Total CostsLOS
*Significant Multivariate House Staff Effects
Ong et al., Arch Intern Med. 2007, 167: 47-52.

Prescribing Errors by Medication Category
Antimicrobials 40%Cardiovascular 18%Gastrointestinal 7%Narcotic analgesics 7%
Lesar et al. JAMA, 1997
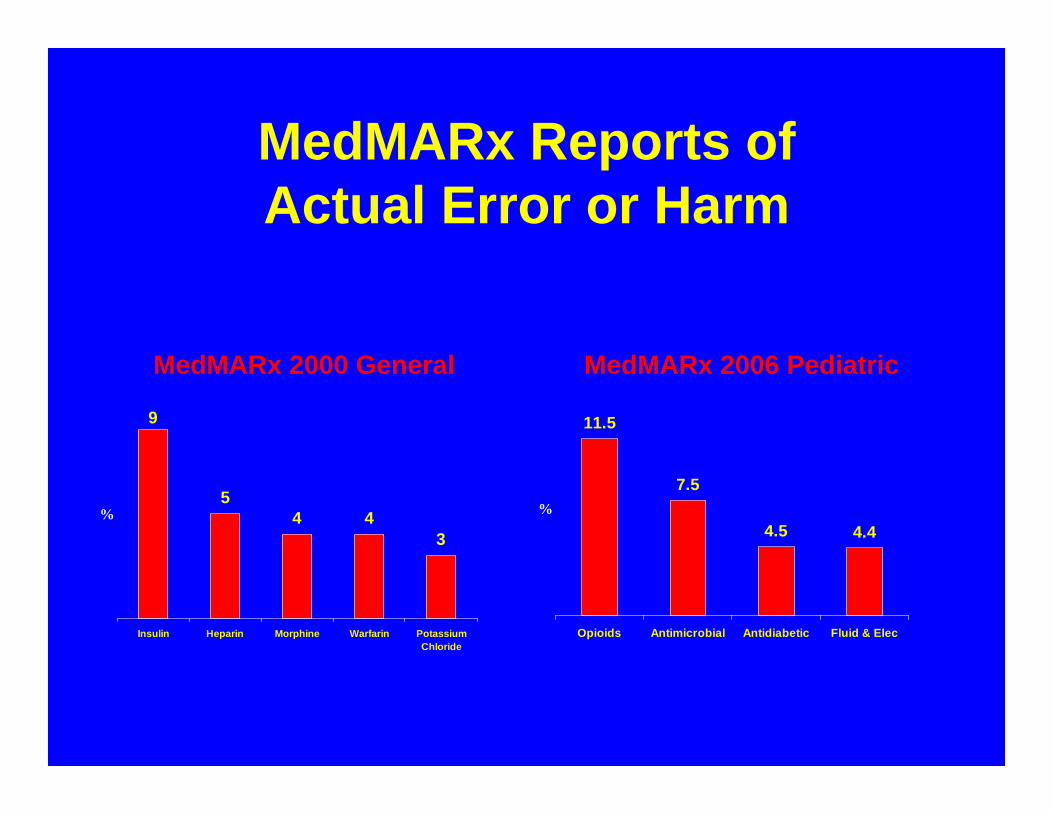
MedMARx Reports ofActual Error or Harm
9
54 4
3
Insulin Heparin Morphine Warfarin PotassiumChloride
%
MedMARx 2000 General
11.5
7.5
4.5 4.4
Opioids Antimicrobial Antidiabetic Fluid & Elec
%
MedMARx 2006 Pediatric
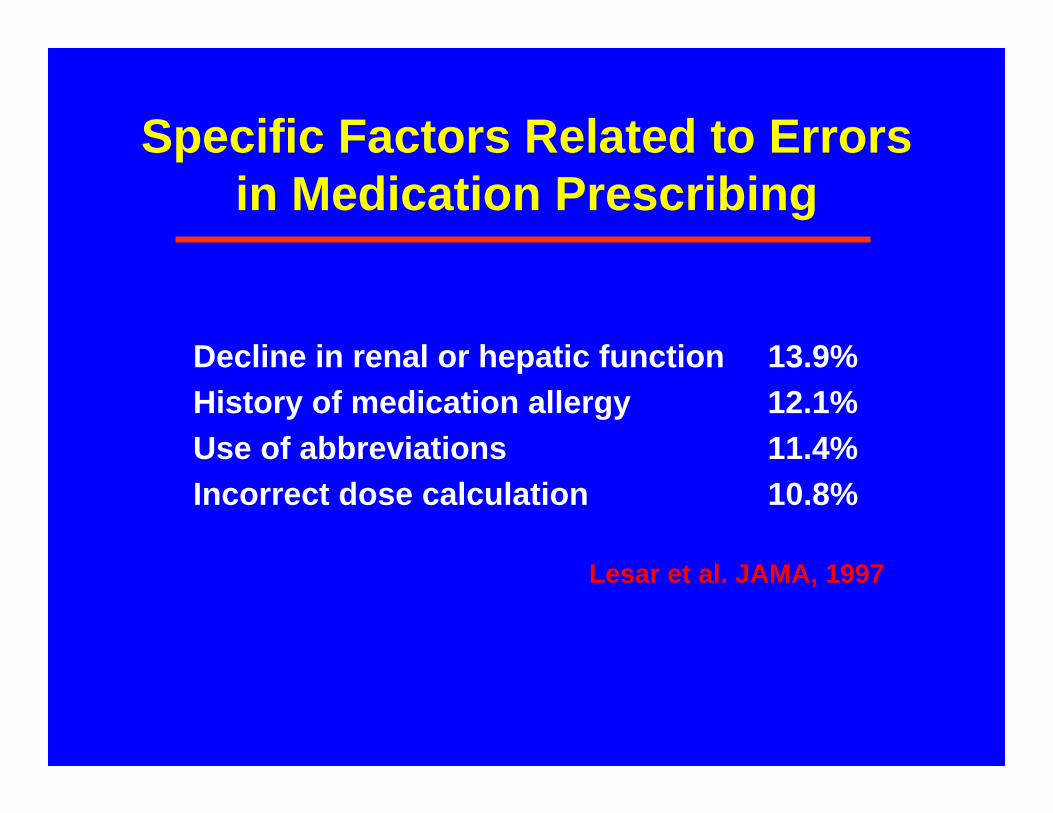
Specific Factors Related to Errors in Medication Prescribing
Decline in renal or hepatic function 13.9%History of medication allergy 12.1%Use of abbreviations 11.4%Incorrect dose calculation 10.8%
Lesar et al. JAMA, 1997

MEDMARXsm Reports of Harmful Errors
MEDMARX 2002 Report
1.7
3.5
Overall Geriatric
Perc
ent 55%
were fatal

Safeguard Against Errors in High-Risk Drugs
• Build in System Redundancies
• Use Fail-Safes• Reduce Options• Use Forcing Functions• Externalize or Centralize
Error-prone Processes• Store Medications
Appropriately
• Screen New Products• Standardize and Simplify
Order Communication• Limit Access• Use Constraints• Use Reminders• Standardize Dosing
Procedures• Use Differentialization
* Adapted from Cohen MR, Kilo CM. High-Alert Medications: Safeguarding against errors. In Medication Errors. Washington: American Pharmaceutical Association; 1999

Total Medication Errors by Month
01020304050
Jun-0
1Oct-
01Feb
-02Ju
n-02
Oct-02
Feb-03
Jun-0
3Oct-
03Feb
-04Ju
n-04
Oct-04
Feb-05
Jun-0
5

Use of High Level Data
• Shows interesting trends• Better for global evaluation• No detail to work with

Pitfalls ofHigh Level Data
• Cause unclear• Potential false conclusions
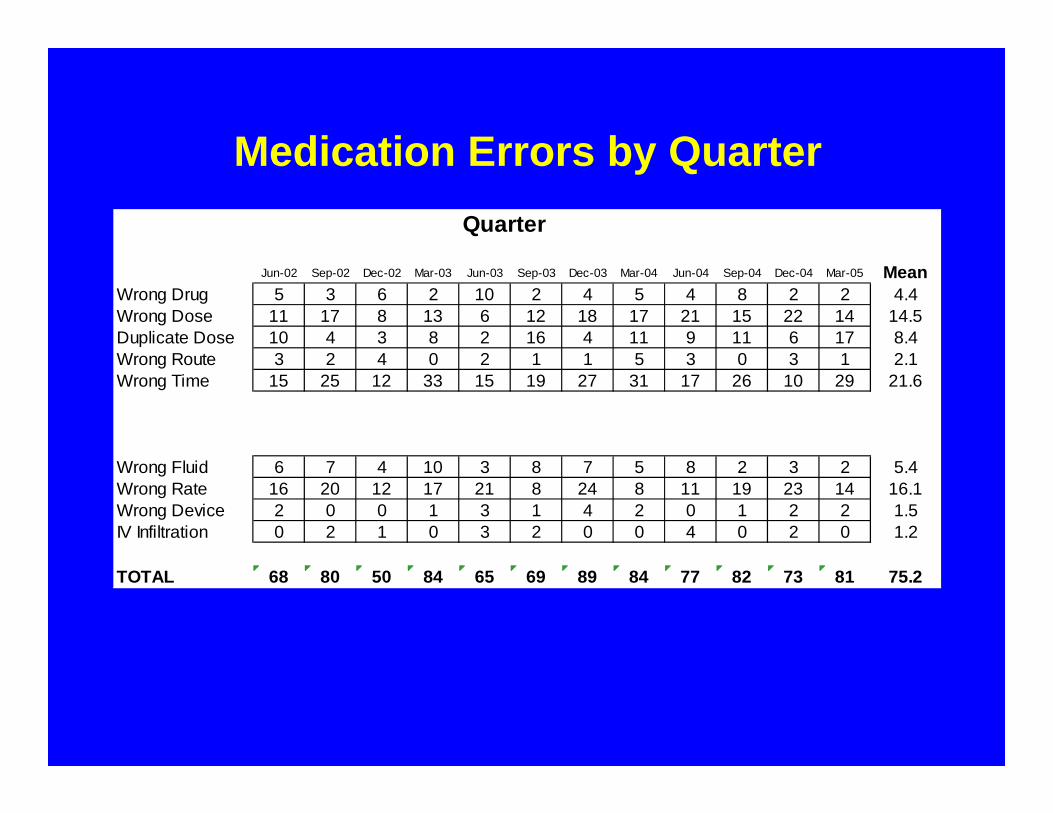
Quarter
Jun-02 Sep-02 Dec-02 Mar-03 Jun-03 Sep-03 Dec-03 Mar-04 Jun-04 Sep-04 Dec-04 Mar-05 MeanWrong Drug 5 3 6 2 10 2 4 5 4 8 2 2 4.4Wrong Dose 11 17 8 13 6 12 18 17 21 15 22 14 14.5Duplicate Dose 10 4 3 8 2 16 4 11 9 11 6 17 8.4Wrong Route 3 2 4 0 2 1 1 5 3 0 3 1 2.1Wrong Time 15 25 12 33 15 19 27 31 17 26 10 29 21.6
Wrong Fluid 6 7 4 10 3 8 7 5 8 2 3 2 5.4Wrong Rate 16 20 12 17 21 8 24 8 11 19 23 14 16.1Wrong Device 2 0 0 1 3 1 4 2 0 1 2 2 1.5IV Infiltration 0 2 1 0 3 2 0 0 4 0 2 0 1.2
TOTAL 68 80 50 84 65 69 89 84 77 82 73 81 75.2
Medication Errors by Quarter

Broad-based Information Sources
• Near misses• Patient specific events• Aggregated hospital-wide
occurrence data• External medication error data• Hospital quality improvement data• Therapeutic trends & changes• Hospital programatic information
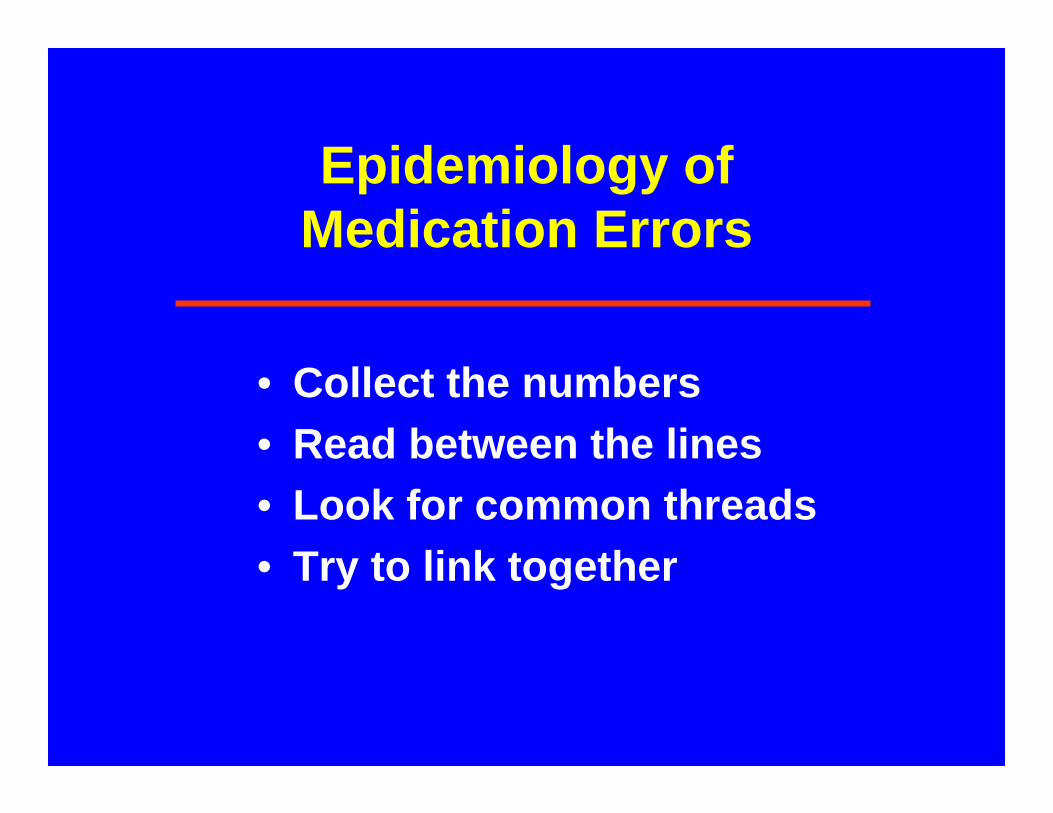
Epidemiology of Medication Errors
• Collect the numbers• Read between the lines• Look for common threads• Try to link together

Admission OrderMedication Omissions
• Review of ongoing meds not ordered by MD at admission
• 53% of patients had at least 1 unintended discrepancy
• 37% had potential for harm
Cornish, Arch Intern Med 2005; 165:424-429
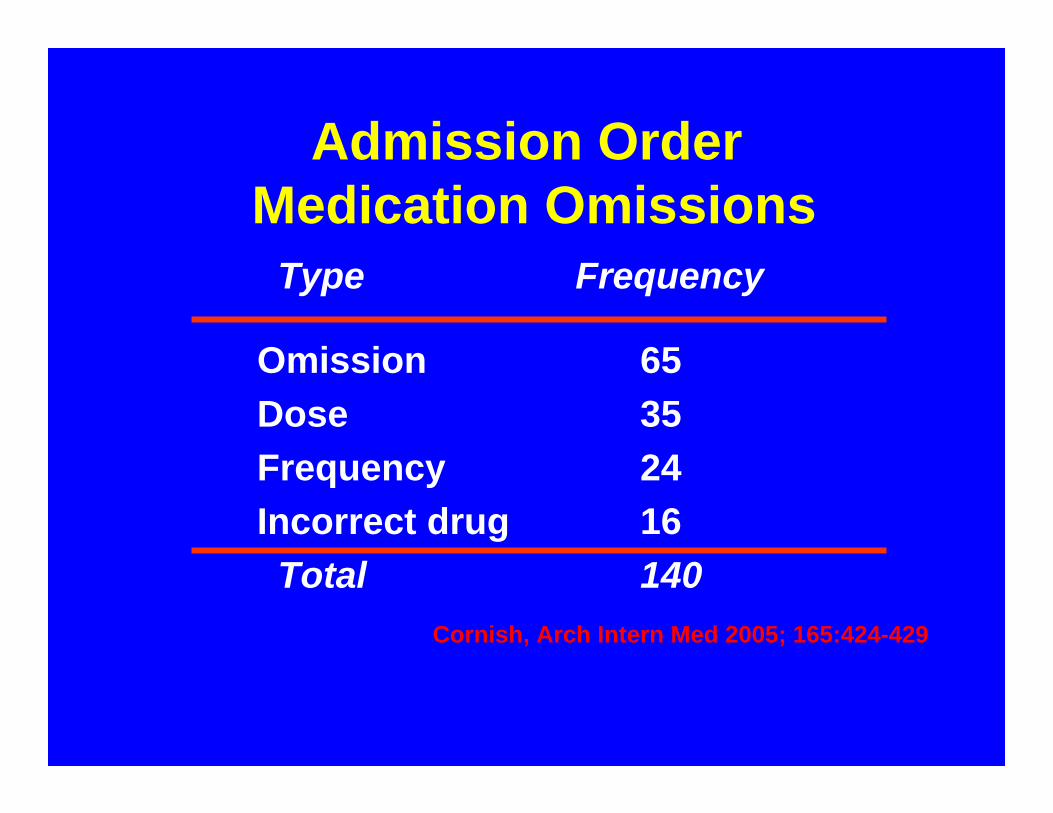
Admission OrderMedication Omissions
Cornish, Arch Intern Med 2005; 165:424-429
Type Frequency
Omission 65Dose 35Frequency 24Incorrect drug 16Total 140
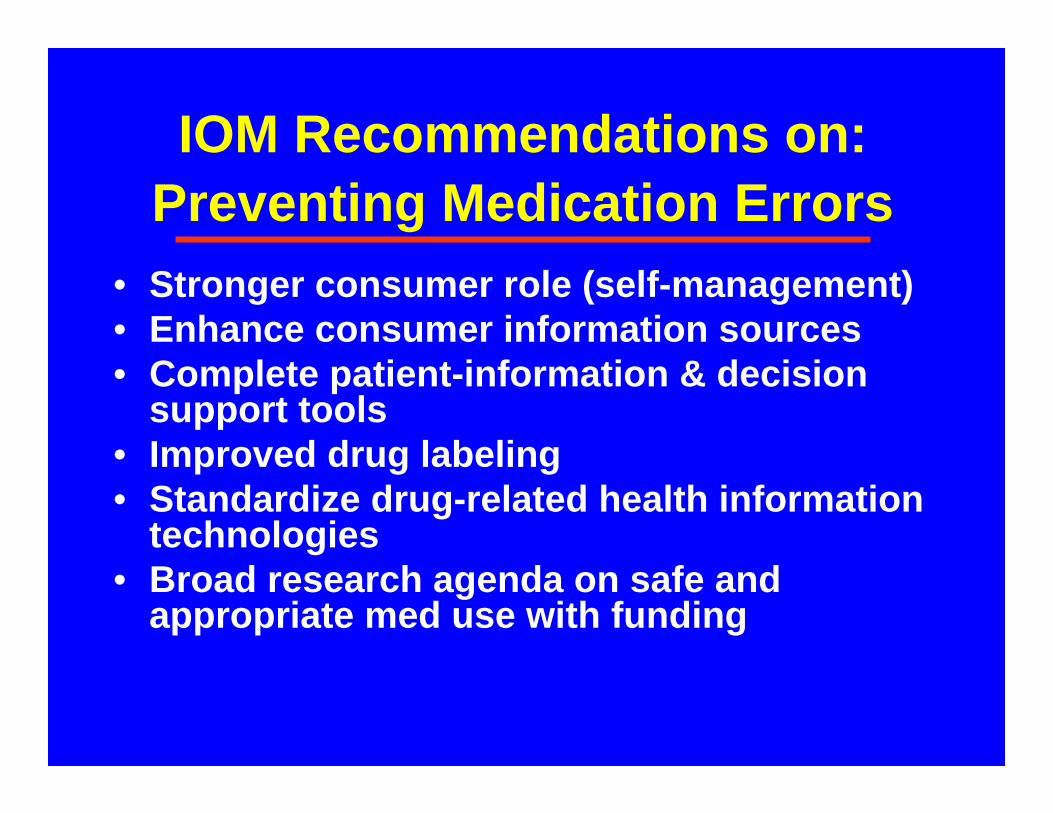
IOM Recommendations on: Preventing Medication Errors
• Stronger consumer role (self-management)• Enhance consumer information sources• Complete patient-information & decision
support tools• Improved drug labeling• Standardize drug-related health information
technologies• Broad research agenda on safe and
appropriate med use with funding
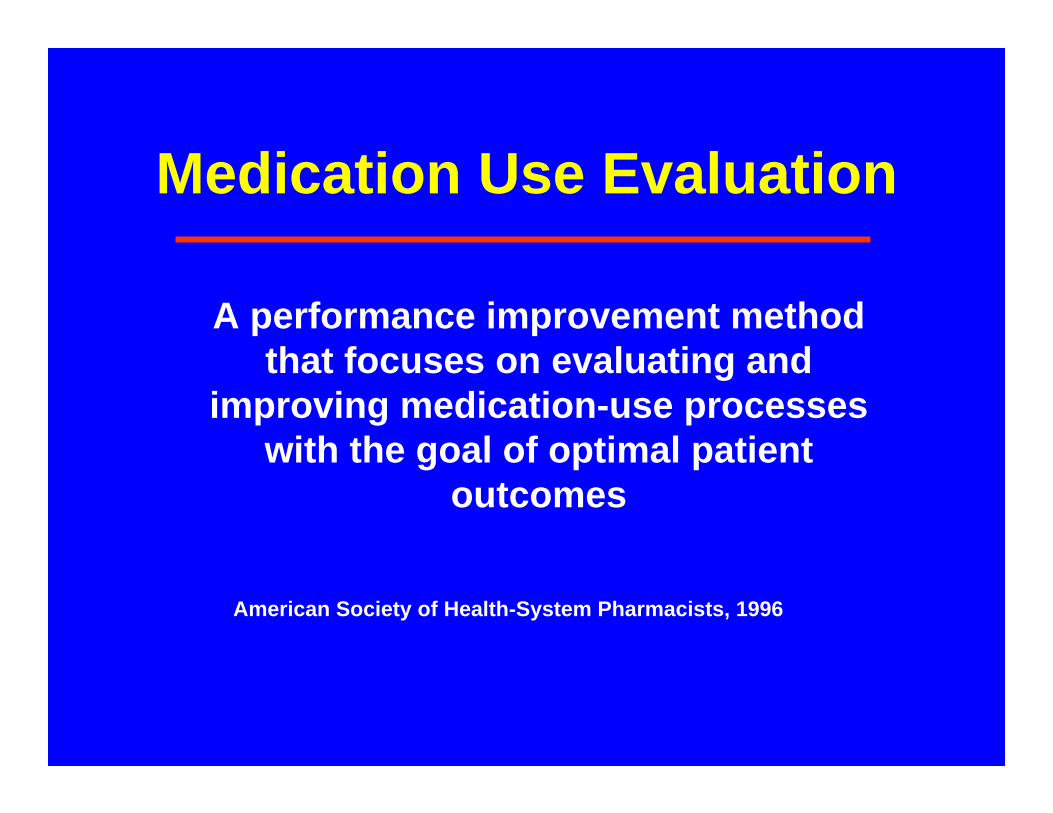
Medication Use Evaluation
A performance improvement methodthat focuses on evaluating and
improving medication-use processeswith the goal of optimal patient
outcomes
American Society of Health-System Pharmacists, 1996
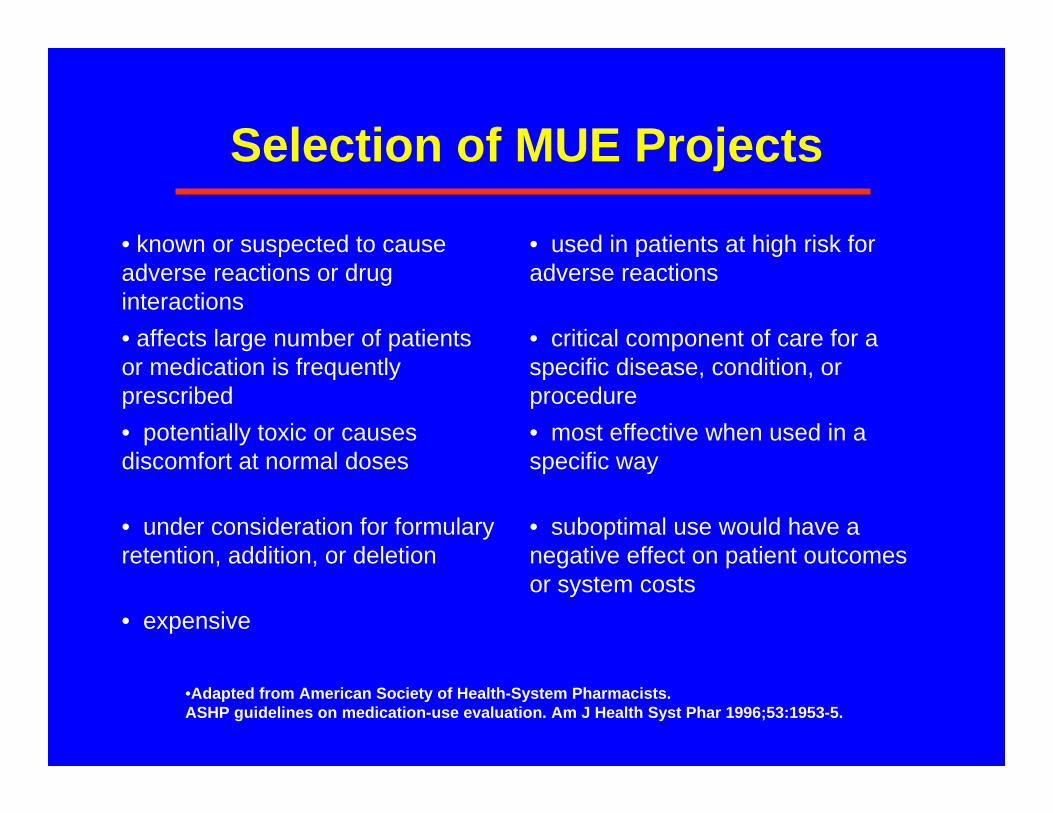
Selection of MUE Projects
• known or suspected to cause adverse reactions or drug interactions
• used in patients at high risk for adverse reactions
• affects large number of patients or medication is frequently prescribed
• critical component of care for a specific disease, condition, or procedure
• potentially toxic or causes discomfort at normal doses
• most effective when used in a specific way
• under consideration for formulary retention, addition, or deletion
• suboptimal use would have a negative effect on patient outcomes or system costs
• expensive
•Adapted from American Society of Health-System Pharmacists. ASHP guidelines on medication-use evaluation. Am J Health Syst Phar 1996;53:1953-5.

SPENT FY 01 SPENT FY 02 SPENT FY 03 SPENT FY 04 SPENT FY_05
80000 ANTI-INFECTIVE AGENTS 80400 AMEBICIDES $0 $1,522 $332 $884 $1,32180800 ANTHELMINTICS $2,510 $996 $2,623 $1,231 $1,83481202 AMINOGLYCOSIDES $9,457 $13,457 $10,351 $35,468 $47,01481204 ANTIFUNGAL ANTIBIOTICS $256,806 $320,884 $357,206 $946,657 $1,082,16581206 CEPHALOSPORINS $221,196 $197,231 $162,850 $180,186 $188,43581207 B-LACTAMS $59,322 $77,722 $77,703 $90,073 $112,23581208 CHLORAMPHENICOLS $626 $204 $172 $771 $1,33181212 ERYTHROMYCINS $52,106 $69,377 $89,793 $112,984 $109,49981216 PENICILLINS $50,569 $41,427 $65,243 $46,314 $61,15381224 TETRACYCLINES $16,872 $4,427 $4,788 $4,569 $8,82081228 MISCELLANEOUS ANTIBIOTICS $38,577 $35,347 $35,261 $37,811 $41,47381600 ANTITUBERCULOSIS AGENTS $33,141 $27,937 $42,335 $53,318 $46,22381800 ANTIVIRALS $658,157 $1,399,246 $2,472,982 $3,251,543 $3,417,00482000 ANTIMALARIAL AGENTS $82,141 $60,942 $20,848 $19,051 $20,57782200 QUINOLONES $82,319 $113,064 $94,705 $117,380 $116,30182400 SULFONAMIDES $7,053 $6,730 $3,425 $3,660 $2,77082600 SULFONES $5,207 $4,839 $4,651 $4,972 $5,36683200 ANTITRICHOMONAL AGENTS $1,493 $3,923 $677 $924 $1,45483600 URINARY ANTI-INFECTIVES $5,974 $2,009 $2,142 $1,632 $2,83684000 MISCELLANEOUS ANTI-INFECTIVES $28,489 $34,661 $30,211 $27,401 $19,394
80000 ANTI-INFECTIVE AGENTS TOTAL $1,612,016 $2,415,944 $3,478,297 $4,936,828 $5,287,206100000 ANTINEOPLASTIC AGENTS TOTAL $1,226,067 $1,564,834 $1,550,613 $1,693,797 $1,866,450
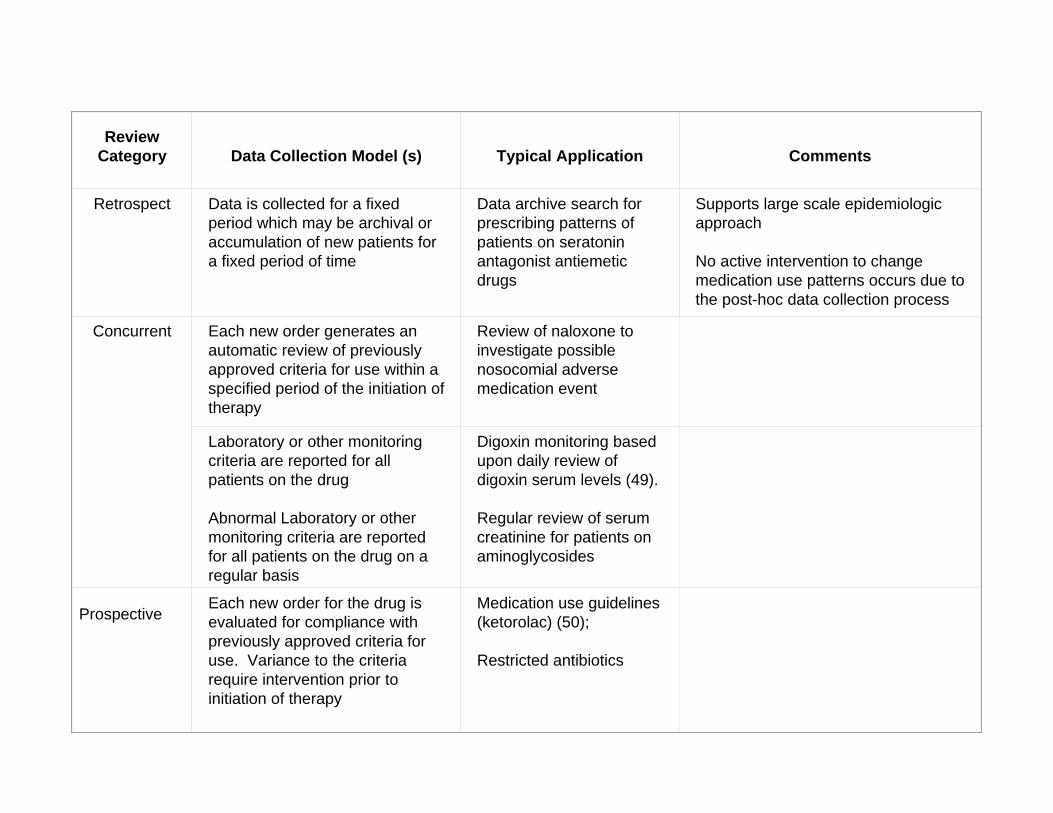
Review Category Data Collection Model (s) Typical Application Comments
Retrospect Data is collected for a fixed period which may be archival or accumulation of new patients for a fixed period of time
Data archive search for prescribing patterns of patients on seratonin antagonist antiemetic drugs
Supports large scale epidemiologic approach
No active intervention to change medication use patterns occurs due to the post-hoc data collection process
Concurrent Each new order generates an automatic review of previously approved criteria for use within a specified period of the initiation of therapy
Review of naloxone to investigate possible nosocomial adverse medication event
Laboratory or other monitoring criteria are reported for all patients on the drug
Abnormal Laboratory or other monitoring criteria are reported for all patients on the drug on a regular basis
Digoxin monitoring based upon daily review of digoxin serum levels (49).
Regular review of serum creatinine for patients on aminoglycosides
ProspectiveEach new order for the drug is evaluated for compliance with previously approved criteria for use. Variance to the criteria require intervention prior to initiation of therapy
Medication use guidelines (ketorolac) (50);
Restricted antibiotics

Evidence Based Guidelines
www.guidelines.gov

Primary Indication for NovoSeven™ Use
Primary Indication for NovoSeven Use by Institution
Note: The numbers above the bars represent the number of complete cases submitted by each institution.
37.8% (119/315) of patients received NovoSeven for prevention of bleed62.2% (196/315) of patients received NovoSeven for treatment of active bleed
Bleed type:
Prevention of bleed
Active bleed
% o
f Cas
es
0
20
40
60
80
100
2245
3269
7868
2568
4
3530
7
4029
1
4035
3
4885
4
681
4008
8
3657
0
4148
2
4009
8
4030
5
482
3093
4031
4
1599
4030
2
4029
8
665
3 4 8 13 1 12 5 10 9 9 21 21 5 5 8 8 35 35 36 36 19 19 7 7 4 4 35 35 48 48 31 31 1
Benchmarking
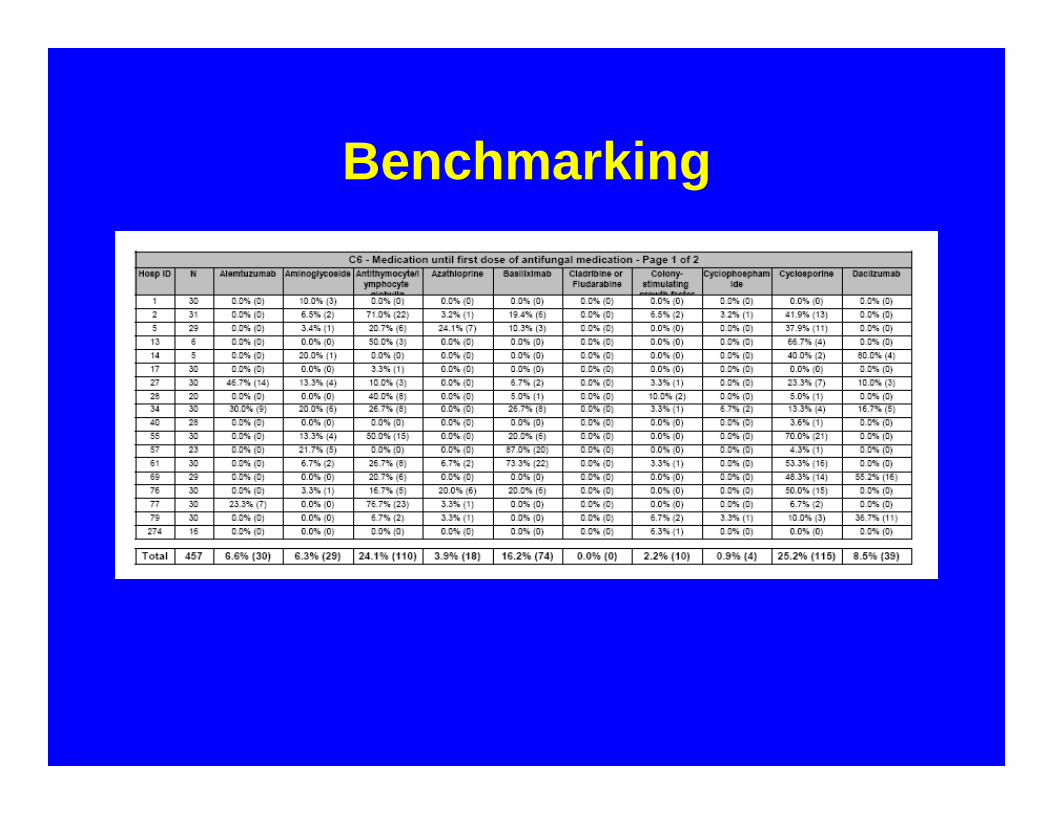
Benchmarking

Benchmarking Sample Hospital


Computerized Laboratory Alerts
• Flashing Computerized Alert for low Potassium
• Increased follow-up monitoring• Increased K+ intervention rate• Decreased hypokalemia at
dischargePaltiel, Arch Intern Med 2003; 163:200-204

Computerized Order Entry• Taylor (Pediatrics, 2008)• Feldstein (Arch Intern Med, 2006)• Mekhjian (JAMIA, 2002)• Nightingale (BMJ, 2000)• Bates (JAMA, 1998; JAMIA, 1999)• Raschke (JAMA, 1998)• Claussen (Ann Intern Med, 1996)
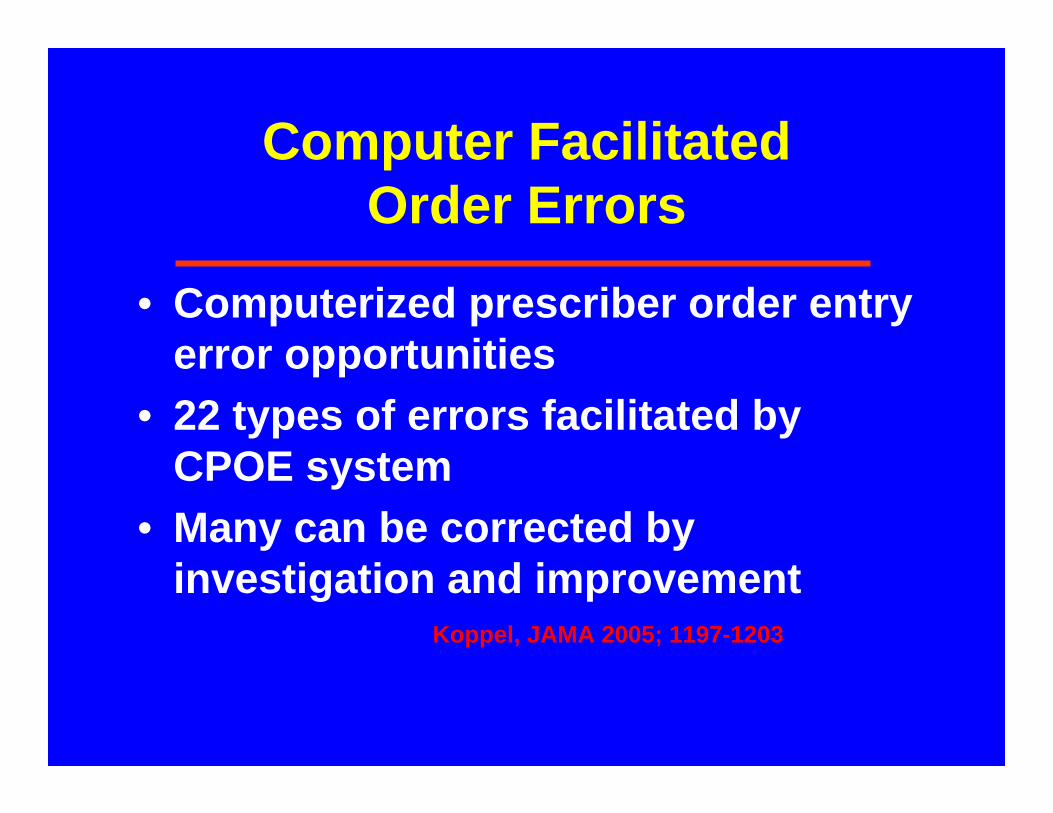
Computer Facilitated Order Errors
• Computerized prescriber order entry error opportunities
• 22 types of errors facilitated by CPOE system
• Many can be corrected by investigation and improvement
Koppel, JAMA 2005; 1197-1203
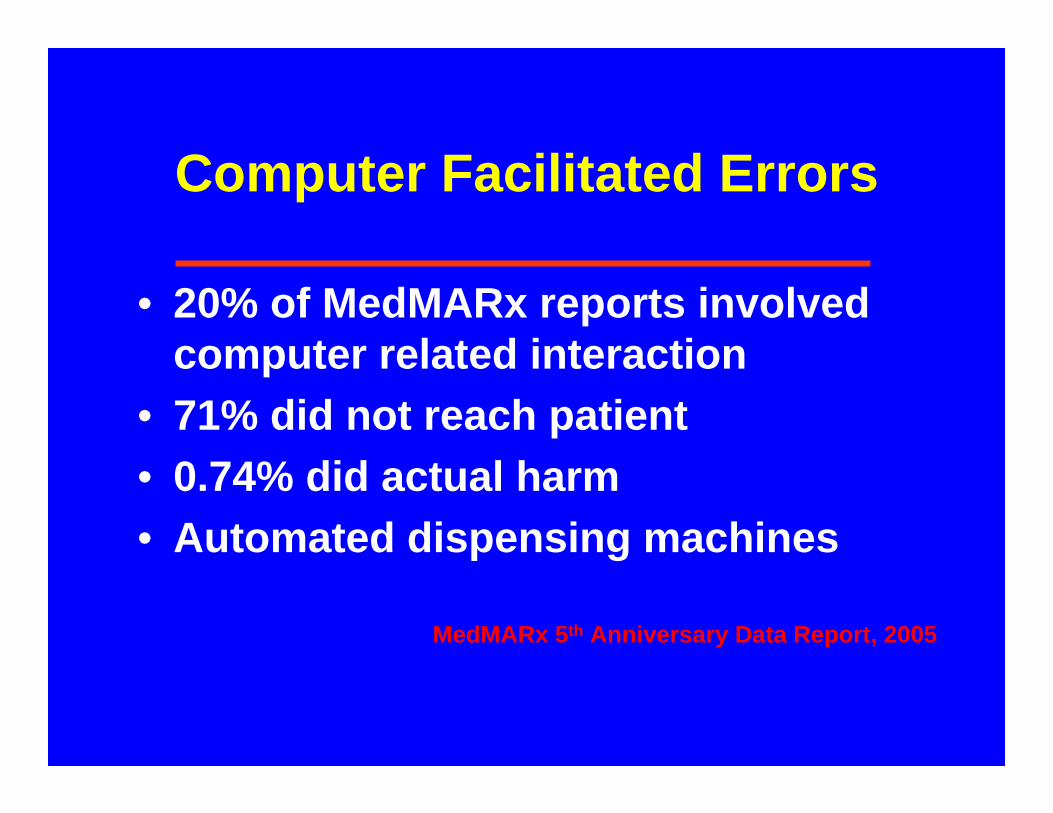
Computer Facilitated Errors
• 20% of MedMARx reports involved computer related interaction
• 71% did not reach patient• 0.74% did actual harm• Automated dispensing machines
MedMARx 5th Anniversary Data Report, 2005

Simulation of Technology Impact
• Computer simulation of integrated medication use system
Concluded• 1,226 days of excess hospitalization• $1.4 million associated costs
Anderson, JAMIA 2002; 9: 479-90
Drug Name Selection
• Lambert (Drug Safety, 2005)• Lambert (AJHP, 1997)• Lambert (Medical Care, 1999
Summary of Medication Use Quality Issues
• Complex process prone to error• Drug use can be improved• ADE risks can be reduced
