quality assessment of image & corine land cover...
TRANSCRIPT

1
Quality assessment ofImage & Corine Land Cover 2000
Guillermo Villa (1)
ge & Co e d Cove 000database in Spain.Lessons learnt from the project. Future actions
15 July 2005 ICC 2005 A Coruña 1
Antonio Arozarena (1)Isabel del Bosque (1)Ana Porcuna (2)Nuria Valcarcel (1)
(1) IGN Spain(2) Tragsatec
1. Background of I&CLC2000 in Spain
Summary
. Bac g ou d o &C C 000 Spa
2. Quality control
3. Results
4. Lessons learnt
5 Future actions: SIOSE Project
215 July 2005 ICC 2005 A Coruña 2
5. Future actions: SIOSE Project
6. Conclusions

2
On 27 June 1985 and by virtue of a decision taken by the Council of Ministers of the European Union (EC/338/85), “an experimental project for the acquisition of data, the coordination and standardization of information on the state of the environment
315 July 2005 ICC 2005 A Coruña 3
and natural resources in the Union” was launched. It was called the CORINE Programme (Coordination of Information on the Environment).
The period from 1985 to 1990 saw the creation of an environmental information system, which included the development of nomenclatures and methodologies regarding land cover agreed by the member states of the EU.
415 July 2005 ICC 2005 A Coruña 4
member states of the EU.

3
Goals
Homogeneity
Databases comparable between different countries
Allow periodic updating
515 July 2005 ICC 2005 A Coruña 5
Principal Objectives I&CLC2000:
Background of I&CLC2000 Spain
• Updating of CLC90 database
• Evaluation of Land Cover changes between 1990 and 2000
615 July 2005 ICC 2005 A Coruña 6
990 d 000

4
715 July 2005 ICC 2005 A Coruña 7
815 July 2005 ICC 2005 A Coruña 8
5
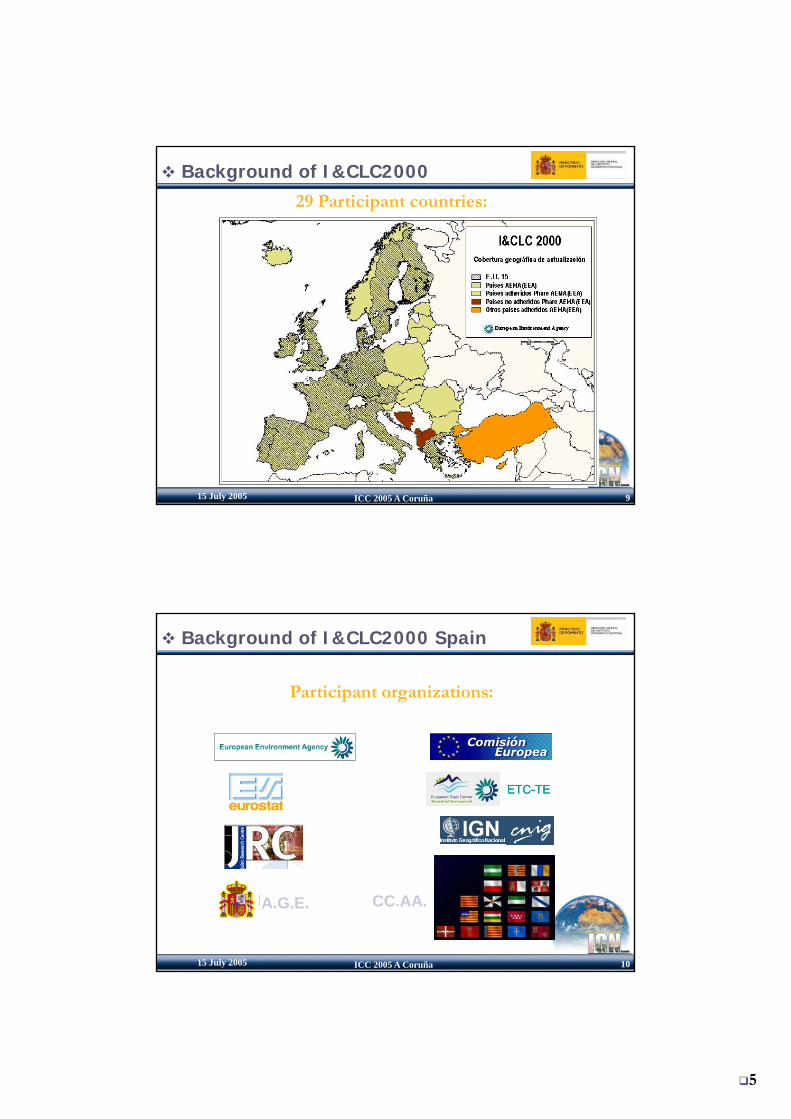
29 Participant countries:
Background of I&CLC2000
915 July 2005 ICC 2005 A Coruña 9
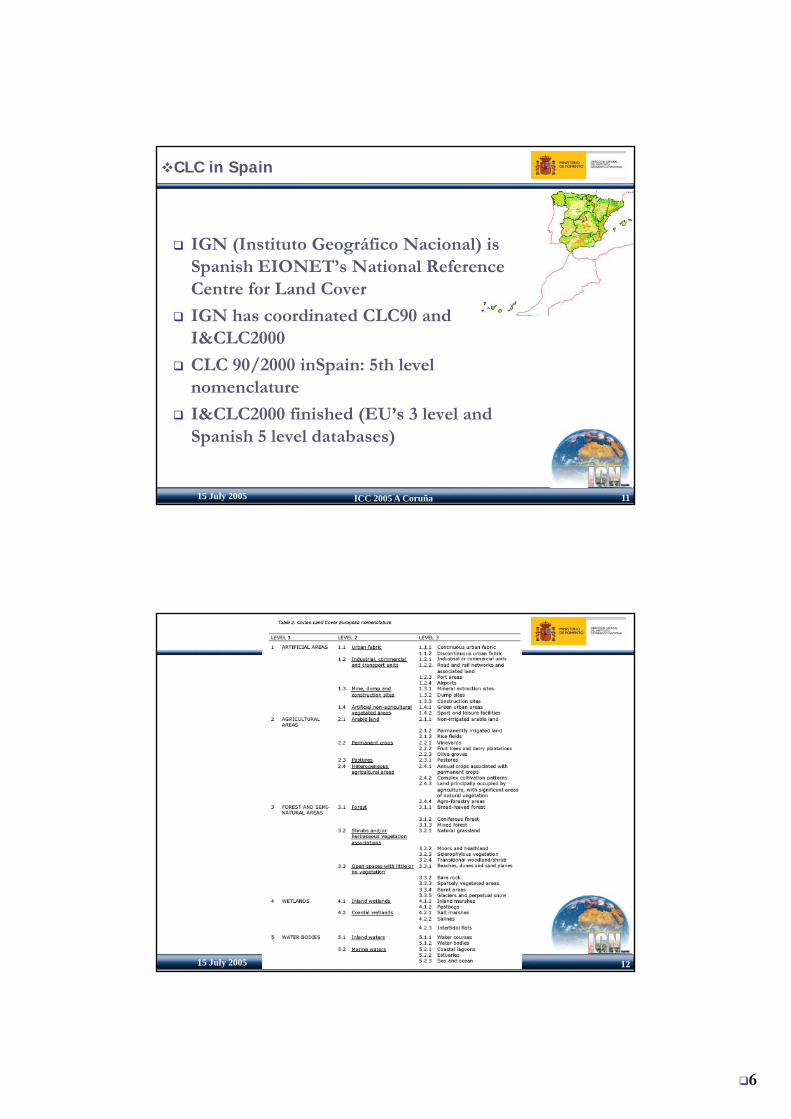
Participant organizations:
Background of I&CLC2000 Spain
ETCETC--TETE
1015 July 2005 ICC 2005 A Coruña 10
A.G.E. CC.AA.
6
CLC in Spain
IGN (Instituto Geográfico Nacional) is Spanish EIONET’s National ReferenceSpanish EIONET’s National Reference Centre for Land Cover
IGN has coordinated CLC90 and I&CLC2000
CLC 90/2000 inSpain: 5th level nomenclature
1115 July 2005 ICC 2005 A Coruña 11
nomenclature
I&CLC2000 finished (EU’s 3 level and Spanish 5 level databases)
1215 July 2005 ICC 2005 A Coruña 12

7
1315 July 2005 ICC 2005 A Coruña 13
1415 July 2005 ICC 2005 A Coruña 14

8
1515 July 2005 ICC 2005 A Coruña 15
1615 July 2005 ICC 2005 A Coruña 16

9
Decentralization in Spain
1715 July 2005 ICC 2005 A Coruña 17
19 Autonomous regions → 19 Production Teams
Organization of CLC2000 in Spain
AEMA (EEA)Comisión de seguimiento
I&CLC2000 Europa
CTE Medioambiente terrestre
CCI (JRC)
PFN-MIMAM
NRC / CNIG – IGNCoordination
A.G.E. CC AA
Comisión de seguimientoI&CLC2000 España
I&CLC2000 Europa
1815 July 2005 ICC 2005 A Coruña 18
A.G.E.•Mº Fomento•Mº Medioambiente•Mº Agricultura•Mº Ciencia y Tecnología•Mº Economía•Mº Defensa
CC.AA.-Galicia -Castilla la Mancha-Principado de Asturias -Región de Murcia-Cantabria -Comunidad Valenciana-País Vasco -Extremadura-Comunidad Foral de Navarra -Andalucía-Aragón -Islas Baleares-Cataluña -Canarias-Castilla y León -Ceuta-La Rioja -Melilla-Comunidad de Madrid

10
Financing
CLC Europe (3 Level Nomenclature: 44 clases)
Budget: 1.578.000 € (3,1 €/Km2)g ( , / )
E.U. - 50% (789.000 €)
NA Spain (AGE). - 50% (789.000 €)
CLC Spain (CLC Spain (5 Level Nomenclature: 64 classes 5 Level Nomenclature: 64 classes CLC90 / 85 classes CLC2000CLC90 / 85 classes CLC2000))
1915 July 2005 ICC 2005 A Coruña 19
))Budget: 2.350.000 Budget: 2.350.000 €€ (4,6 (4,6 €€/km/km22) (included L3)) (included L3)
E.U. E.U. –– 33,56% (789.000 33,56% (789.000 €€))
NA Spain (A.G.E.) NA Spain (A.G.E.) –– 50% (1.175.223 50% (1.175.223 €€))
CC.AA. CC.AA. –– 16,44% (386.223 16,44% (386.223 €€))
Fases Coste EUR/KM2 Coste en EUROSIMAGE2000- Datos satélite + procesado- Mosaico y difusión
0.4 EUR/Km20.1 EUR/Km2
195.447,72 EUROS52.867 EUROS
CLC2000- Fotointerpretación y edición- Dirección nacional- Control e integración datos CCAA- Integración de datos a nivel europeo y difusión
2.9 EUR/Km20.3 EUR/KM20.3 EUR/KM20.3 EUR/km2
1.525.400 EUROS144.182,74 EUROS144.182,74 EUROS144.182,74 EUROS
2015 July 2005 ICC 2005 A Coruña 20
Gestión y dirección del proyecto 0.3 EUR/km2 144.182,74 EUROS
Coste por Km2 4.6 EUR/Km2 2.350.445,64 EUROS

11
1st Method: 1) correct CLC902) update to CLC2000
IMAGE 2000
Methodologies
IMAGE 1990CLC2000
2115 July 2005 ICC 2005 A Coruña 21
Old CLC90
New CLC90
BD changes
IMAGEN 1990
2nd Method: 1) Obtain CLC2000 from a regional 2000 Land cover database2) Down-date to CLC90
IMAGEN 2000
IMAGEN 1990 CLC90
2215 July 2005 ICC 2005 A Coruña 22
CLC2000
BD cambiosBD Ocupación suelo regional

12
2315 July 2005 ICC 2005 A Coruña 23
2415 July 2005 ICC 2005 A Coruña 24
13
2515 July 2005 ICC 2005 A Coruña 25
BD O ió l
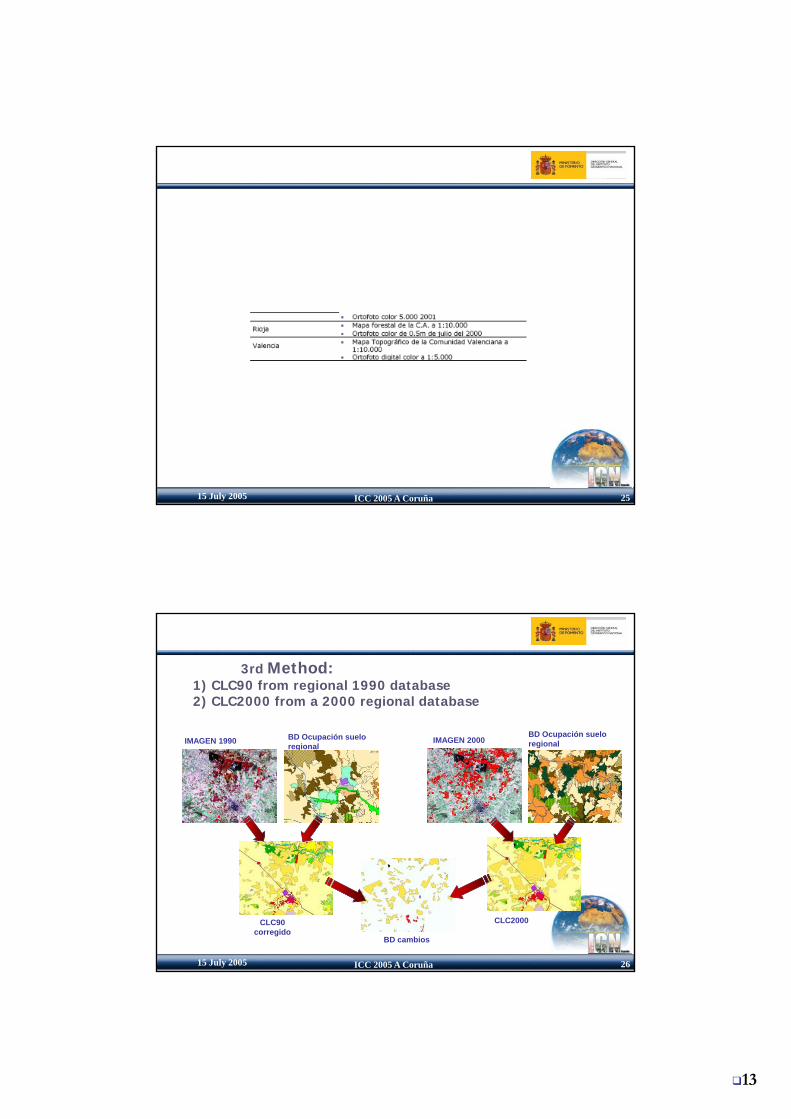
3rd Method: 1) CLC90 from regional 1990 database2) CLC2000 from a 2000 regional database
IMAGEN 2000IMAGEN 1990 BD Ocupación suelo regional
BD Ocupación suelo regional
2615 July 2005 ICC 2005 A Coruña 26
CLC2000CLC90 corregido
BD cambios

14
PRODUCTS Responsible of delivery
Producto 1 – Escenas ortorrectificadas + hojas EEA/JRC
Producto 2 – Mosaico nacional IMAGE2000 EEA/JRC
Producto 3a – CLC2000 NacionalProducto 3b – CLC90 nacional revisado Producto 3aNivel5 – CLC2000 Nacional a nivel 5Producto 3bNivel5 – CLC90 nacional revisado a nivel 5
Países miembros
Producto 4 – Cambios CLC nacionalesProducto 4Nivel5– Cambios CLC nacionales a nivel 5
Países miembros
Producto 5 – Mosaico europeo IMAGE2000 EEA/JRC
Producto 6a – CLC2000 europeo
P d 6b CLC90 i dEEA/JRC
2715 July 2005 ICC 2005 A Coruña 27
Producto 6b – CLC90 europeo revisado/J
Producto 7 – Cambios CLC90 europeo EEA/JRC
Producto 8 – CLC raster 250 m EEA/JRC
Producto 9 – CLC raster 100 m EEA/JRC
Producto 10 – CLC estadísticas 1 km2 EEA/JRC
Producto 11 – Metadatos nacionales Países miembros
Producto 12 – Metadatos europeos EEA/JRC
Product 1: Landsat 7 ortho-rectified scenes
2815 July 2005 ICC 2005 A Coruña 28
15
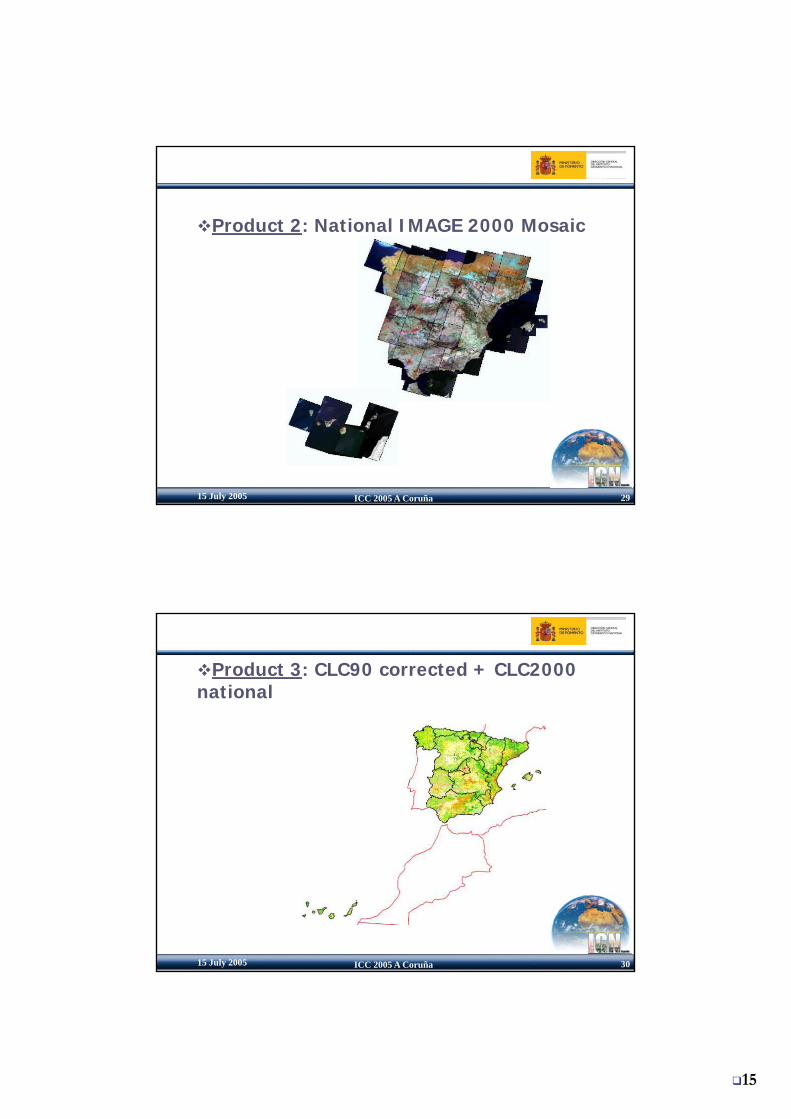
Product 2: National IMAGE 2000 Mosaic
2915 July 2005 ICC 2005 A Coruña 29
Product 3: CLC90 corrected + CLC2000 national
3015 July 2005 ICC 2005 A Coruña 30
16
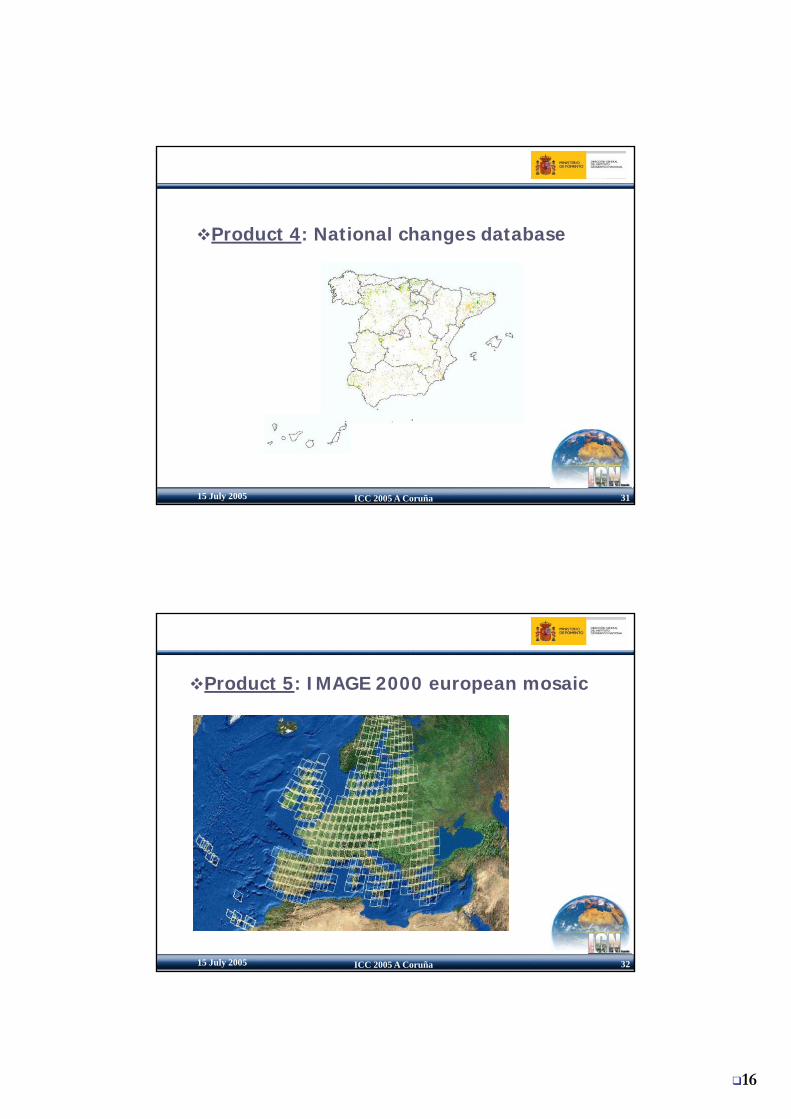
Product 4: National changes database
3115 July 2005 ICC 2005 A Coruña 31
Product 5: IMAGE 2000 european mosaic
3215 July 2005 ICC 2005 A Coruña 32

17
Product 6: European CLC2000 and CLC90corrected
3315 July 2005 ICC 2005 A Coruña 33
Product 7: European changes database
3415 July 2005 ICC 2005 A Coruña 34

18
Products 8 and 9: Raster format CLC at 250 mand 100 m
Product 10: Estadísticas CLC por km2
3515 July 2005 ICC 2005 A Coruña 35
Product 11: National Metadata
Product 12: European Metadata
3615 July 2005 ICC 2005 A Coruña 36
19
1. Background of I&CLC2000 in Spain
Summary
. Bac g ou d o &C C 000 Spa
2. Quality control
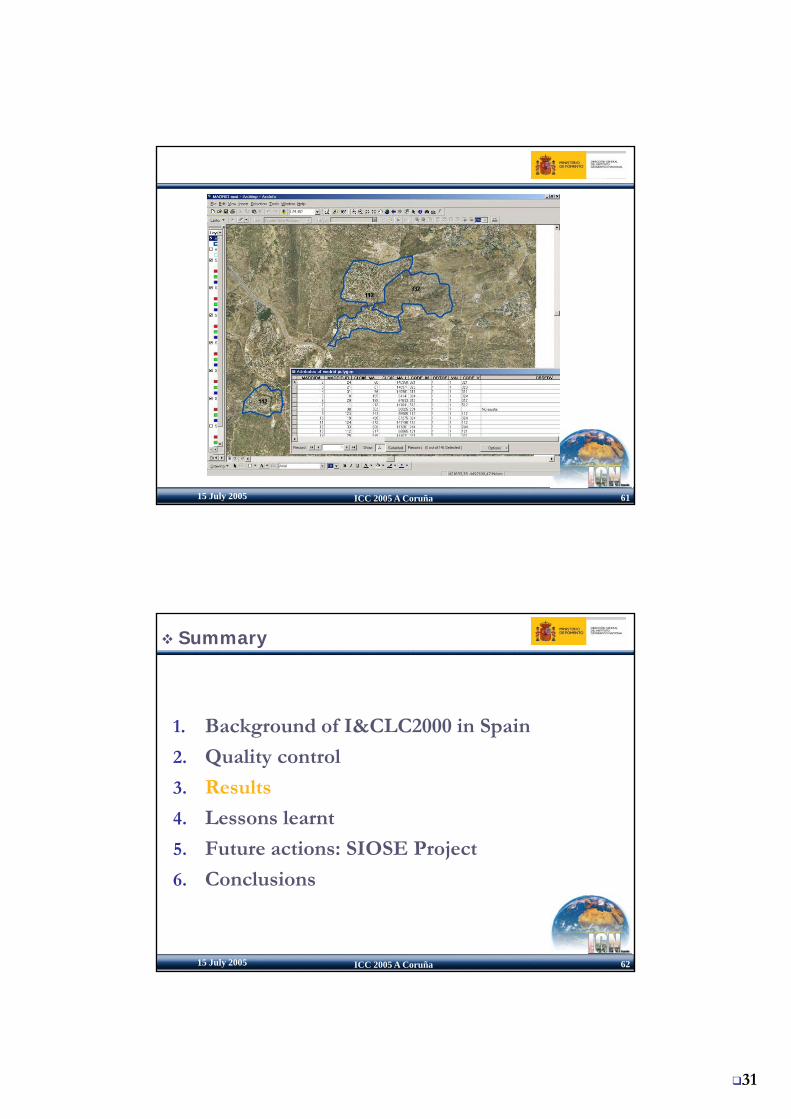
3. Results
4. Lessons learnt
5 Future actions: SIOSE Project
3715 July 2005 ICC 2005 A Coruña 37
5. Future actions: SIOSE Project
6. Conclusions
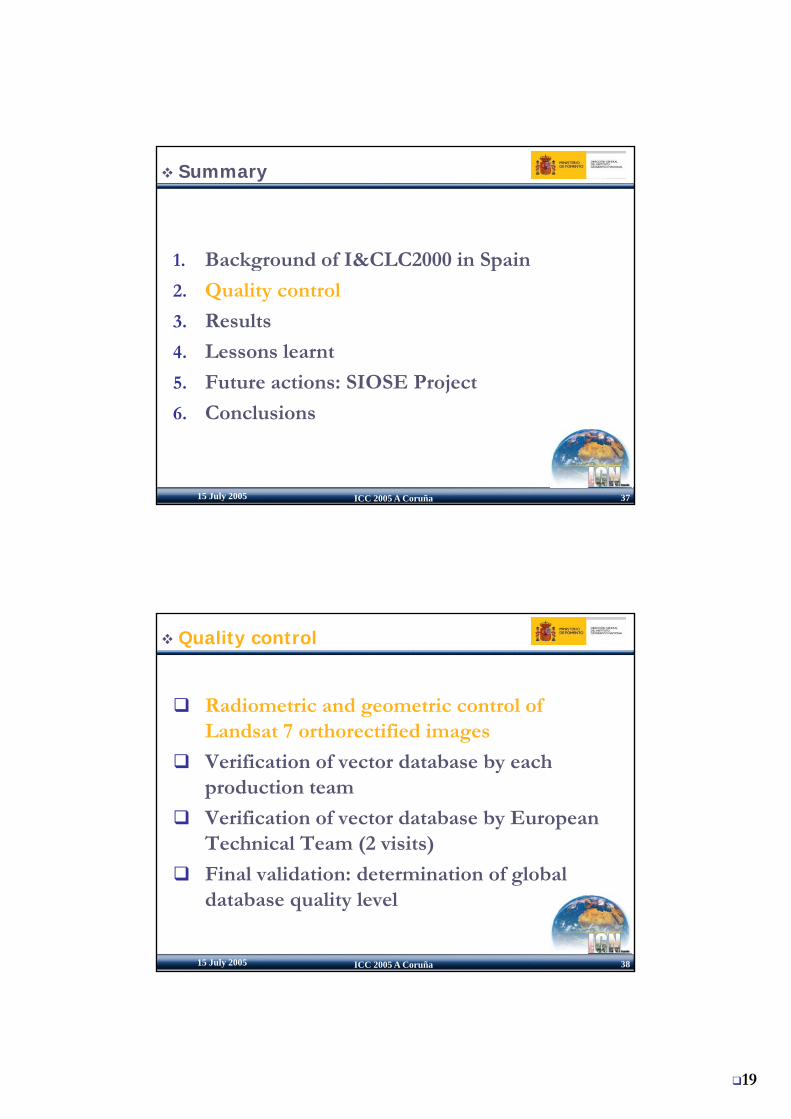
Radiometric and geometric control of Landsat 7 orthorectified images
Quality control
Landsat 7 orthorectified images
Verification of vector database by each production team
Verification of vector database by European Technical Team (2 visits)
3815 July 2005 ICC 2005 A Coruña 38
( )
Final validation: determination of global database quality level

20
3915 July 2005 ICC 2005 A Coruña 39
47 complete scenes: 41 Iberian Peninsula and Baleares Islands; 6 Canary Islands
• Check points between porthorectified Landsat 7 images and orthophotos
• 10 x 10 Km grid
4015 July 2005 ICC 2005 A Coruña 40

21
4115 July 2005 ICC 2005 A Coruña 41
RMSE xy = 17,97 m
Check points per scene: 21
Rejected images: 2
Radiometric and geometric control of Landsat 7 images
Quality control
Landsat 7 images
Verification of vector database by each production team
Verification of vector database by European Technical Team (2 visits)
4215 July 2005 ICC 2005 A Coruña 42
( )
Final validation: determination of global database quality level

22
4315 July 2005 ICC 2005 A Coruña 43
4415 July 2005 ICC 2005 A Coruña 44

23
4515 July 2005 ICC 2005 A Coruña 45
4615 July 2005 ICC 2005 A Coruña 46

24
4715 July 2005 ICC 2005 A Coruña 47
Radiometric and geometric control of Landsat 7 images
Quality control
Landsat 7 images
Verification of vector database by each production team
Verification of vector database by European Technical Team (2 visits)
4815 July 2005 ICC 2005 A Coruña 48
( )
Final validation: determination of global database quality level

25
4915 July 2005 ICC 2005 A Coruña 49
5015 July 2005 ICC 2005 A Coruña 50

26
Code 111 112 121 122 123 124 131 132 133 141 142 211 212 213 221 222 223 231 241 242 243 244 311 312 313 321 322 323 324 331 332 333 334 335 411 412 421 422 423 511 512 521 522 523 Code111 0 2 2 1 2 2 2 2 2 2 2 3 3 3 3 3 3 3 3 3 3 3 3 3 3 3 3 3 3 3 3 3 3 3 3 3 3 3 3 3 3 3 3 3 111112 1 0 1 1 2 2 2 2 1 1 1 2 2 2 2 2 2 2 2 2 2 2 2 2 2 2 2 2 2 3 3 3 3 3 3 3 3 3 3 3 3 3 3 3 112121 2 1 0 1 1 1 1 1 1 1 1 2 2 2 2 2 2 2 2 2 2 2 2 2 2 2 2 2 2 3 3 2 3 3 3 3 3 3 3 3 3 3 3 3 121122 2 1 1 0 1 1 2 2 1 1 1 2 2 2 2 2 2 2 2 2 2 2 3 3 3 3 3 3 3 3 3 2 3 3 3 3 3 3 3 3 3 3 3 3 122123 2 1 1 1 0 3 2 2 1 2 2 2 2 2 2 2 2 2 2 2 2 2 3 3 3 3 3 3 3 3 3 3 3 3 2 3 2 2 2 2 2 2 2 2 123124 2 1 1 1 3 0 2 2 1 2 2 2 2 2 2 2 2 2 2 2 2 2 2 2 2 2 2 2 2 3 3 2 3 3 3 3 3 3 3 3 3 3 3 3 124131 2 1 1 1 2 2 0 1 1 2 1 1 1 1 1 1 1 1 1 1 1 1 1 1 1 1 1 1 1 1 1 1 3 3 3 3 3 3 3 2 1 1 1 3 131132 2 1 1 1 2 2 3 0 1 2 2 2 2 2 2 2 2 1 2 2 2 2 1 1 1 1 1 1 1 2 2 2 3 3 3 3 3 3 3 3 1 3 3 3 132133 1 1 1 1 1 1 1 1 0 1 1 2 2 2 2 2 2 2 2 2 2 2 2 2 2 2 2 2 2 2 2 2 3 3 3 3 3 2 3 2 1 1 2 2 133
Probability of changes
141 1 1 1 1 2 2 3 2 1 0 1 3 3 3 3 3 3 3 3 3 3 3 3 3 3 3 3 3 2 3 3 3 3 3 3 3 3 3 3 2 2 3 3 3 141142 1 1 1 1 1 2 2 2 1 2 0 3 3 3 3 3 3 3 3 3 3 3 3 3 3 3 3 3 2 3 3 3 3 3 3 3 3 3 3 2 2 3 3 3 142211 2 1 1 1 1 1 1 1 1 1 1 0 1 1 1 1 1 1 1 1 1 1 1 1 1 2 2 1 1 3 3 3 3 3 3 3 3 3 3 2 1 3 3 3 211212 2 1 1 1 1 1 1 1 1 1 1 1 0 1 1 1 1 1 1 1 1 1 1 1 1 2 2 1 1 3 3 3 3 3 2 3 2 3 3 2 1 3 3 3 212213 2 1 1 1 1 1 1 1 1 1 1 1 1 0 2 2 3 1 1 1 1 2 2 2 2 2 3 1 1 3 3 3 3 3 2 3 3 3 3 2 1 3 3 3 213221 2 1 1 1 1 1 1 1 1 1 1 1 1 2 0 1 1 1 1 1 1 1 1 1 1 1 3 1 1 3 3 2 3 3 2 3 2 3 3 2 1 3 3 3 221222 2 1 1 1 1 1 1 1 1 1 1 1 1 2 1 0 1 1 1 1 1 1 1 1 1 1 3 1 1 3 3 2 3 3 2 3 2 3 3 2 1 3 3 3 222223 2 1 1 1 1 1 1 1 1 1 1 1 2 3 1 1 0 1 1 1 1 1 1 1 1 1 3 1 1 3 2 1 3 3 3 3 3 3 3 2 1 3 3 3 223231 2 1 1 1 1 1 1 1 1 1 1 1 1 1 1 1 1 0 1 1 1 1 1 1 1 2 3 1 1 2 3 2 3 3 1 2 2 3 3 2 1 3 3 3 231241 2 1 1 1 1 1 1 1 1 1 1 1 1 1 1 1 1 1 0 2 2 2 1 1 1 2 3 1 1 2 3 2 3 3 2 3 3 3 3 2 1 3 3 3 241242 2 1 1 1 1 1 1 1 1 1 1 1 1 1 1 1 1 1 2 0 1 2 1 1 1 2 3 1 1 2 3 2 3 3 2 3 3 3 3 2 1 3 3 3 242243 2 1 1 1 1 1 1 1 1 1 1 1 1 1 1 1 1 1 2 1 0 1 1 1 1 1 2 1 1 2 3 2 3 3 2 3 3 3 3 2 1 3 3 3 243244 2 1 1 1 1 1 1 1 1 1 1 1 1 1 1 1 1 1 2 2 2 0 1 1 1 3 3 2 1 2 3 2 3 3 2 3 3 3 3 2 1 3 3 3 244311 2 1 1 1 1 1 1 1 1 1 1 1 2 3 1 1 1 1 1 1 1 1 0 2 1 2 3 3 1 2 3 2 1 3 2 2 2 3 3 2 1 3 3 3 311312 2 1 1 1 1 1 1 1 1 1 1 1 2 3 1 1 1 1 1 1 1 1 2 0 1 2 3 3 1 2 3 2 1 3 2 2 2 3 3 2 1 3 3 3 312313 2 1 1 1 1 1 1 1 1 1 1 1 2 3 1 1 1 1 1 1 1 1 1 1 0 2 3 3 1 2 3 2 1 3 2 2 2 3 3 2 1 3 3 3 313321 2 1 1 1 1 1 1 1 1 1 1 1 1 1 1 1 1 2 1 1 1 1 1 1 1 0 3 3 1 1 1 2 3 2 2 2 2 3 3 2 1 3 3 3 321322 2 1 1 1 1 1 1 1 1 1 1 1 3 3 3 1 3 1 1 1 1 3 1 1 1 2 0 3 2 1 3 2 1 3 2 2 2 3 3 2 1 3 3 3 322323 2 1 1 1 1 1 1 1 1 1 1 1 1 1 1 1 1 1 1 1 1 3 1 1 1 2 3 0 1 1 1 1 1 3 3 3 2 3 3 2 1 3 3 3 323324 2 1 1 1 1 1 1 1 1 1 1 1 1 1 1 1 1 1 1 1 1 1 1 1 1 2 3 3 0 2 2 1 1 3 2 2 1 3 3 2 1 3 3 3 324331 2 1 1 1 1 1 1 1 1 1 1 2 2 2 2 2 2 2 2 2 2 3 1 1 1 1 1 2 1 0 2 1 3 3 3 3 2 1 3 2 1 3 3 3 331
5115 July 2005 ICC 2005 A Coruña 51
331 2 1 1 1 1 1 1 1 1 1 1 2 2 2 2 2 2 2 2 2 2 3 1 1 1 1 1 2 1 0 2 1 3 3 3 3 2 1 3 2 1 3 3 3 331332 2 1 1 1 1 1 1 1 1 2 2 3 3 3 2 2 2 3 2 2 2 3 3 3 3 2 3 2 2 2 0 1 3 1 3 3 3 3 3 3 3 3 3 3 332333 2 1 1 1 1 1 1 1 1 1 1 2 2 3 2 2 1 2 2 2 2 3 2 2 2 1 2 2 1 1 1 0 2 1 3 3 3 3 3 2 1 3 3 3 333334 3 3 3 3 3 3 3 3 3 3 3 1 1 3 2 2 2 3 3 3 3 1 1 1 1 1 1 1 1 3 3 1 0 3 3 1 3 3 3 2 1 3 3 3 334335 3 3 3 3 3 3 3 3 3 3 3 3 3 3 3 3 3 3 3 3 3 3 3 3 3 2 3 3 3 3 1 1 3 0 3 3 3 3 3 2 2 3 3 3 335411 3 2 1 1 1 1 2 2 1 2 2 2 2 1 2 2 2 1 2 2 2 3 1 1 1 1 2 3 1 3 3 2 3 3 0 3 3 3 3 2 1 3 3 3 411412 3 2 1 1 1 1 2 2 1 2 2 1 3 1 3 3 3 1 2 2 2 3 1 1 1 1 2 3 1 3 3 2 1 3 1 0 3 3 3 2 1 3 3 3 412421 3 2 1 1 1 1 2 2 1 2 2 2 3 3 3 3 3 2 2 2 2 3 2 2 2 1 2 3 1 2 3 2 1 3 3 3 0 2 2 2 1 1 2 1 421422 3 2 1 1 1 1 2 2 1 3 2 3 3 3 3 3 3 2 2 2 2 3 2 2 2 1 3 2 1 2 3 2 3 3 3 3 1 0 1 2 1 1 2 1 422423 3 2 1 1 1 1 1 2 1 3 2 3 3 3 3 3 3 3 3 3 3 3 2 2 2 2 3 3 2 2 3 2 3 3 3 3 2 1 0 2 1 3 3 1 423511 3 2 2 2 1 2 1 3 1 2 2 2 2 2 2 2 2 2 2 2 2 2 2 2 2 2 2 2 2 2 3 1 3 3 2 3 2 2 2 0 1 3 3 3 511512 3 2 2 2 1 2 1 2 1 2 2 2 2 1 2 2 2 2 2 2 2 2 2 2 2 2 2 2 2 2 3 1 3 3 1 1 1 2 2 2 0 2 3 2 512521 3 2 2 2 1 1 3 3 1 3 2 3 3 3 3 3 3 3 3 3 3 3 3 3 3 1 2 2 2 2 3 1 3 3 3 3 1 1 3 2 2 0 3 3 521522 3 2 2 2 1 1 3 3 1 3 3 3 3 3 3 3 3 3 3 3 3 3 3 3 3 3 3 3 3 2 3 2 3 3 3 3 1 1 1 3 3 3 0 3 522523 3 2 2 2 1 1 3 3 1 3 3 3 3 3 3 3 3 3 3 3 3 3 3 3 3 3 3 3 3 3 3 3 3 3 3 3 1 1 1 2 2 3 3 0 523
Code 111 112 121 122 123 124 131 132 133 141 142 211 212 213 221 222 223 231 241 242 243 244 311 312 313 321 322 323 324 331 332 333 334 335 411 412 421 422 423 511 512 521 522 523 Code
rows: CLC90 0: not a change 1 : possible (comm on) change 2: rear change (to be confirm ed) 3: unexpected change (explaination is neecolum n CLC2000
COMUNIDADNº de unidades de
verificación
CLC2000 CLC-Cambios
Hojas aceptadas Hojas rechazadas Hojas aceptadas Hojas rechazadas
Andalucía 16 16 0 8 6Andalucía 16 16 0 8 6
Aragón 11 11 0 10 1
Asturias 4 4 0 4 0
Baleares 2 2 0 2 0
Castilla-Leon11 11 0 6 5
Castilla-La Mancha 20 20 0 20 0
Galicia 3 3 0 0 0
M d id 3 3 0 1 2
5215 July 2005 ICC 2005 A Coruña 52
Madrid 3 3 0 1 2
Melilla 1 1 0 1 0
Murcia 5 5 0 3 2
La Rioja 4 4 0 0 4
País Vasco3 3 0 1 2
Valencia 5 5 0 0 4
Total: 88 88 0 57 26

27
Radiometric and geometric control of Landsat 7 images
Quality control
Landsat 7 images
Verification of vector database by each production team
Verification of vector database by European Technical Team (2 visits)
5315 July 2005 ICC 2005 A Coruña 53
( )
Final validation: determination of global database quality level
Validation Methodology
Standard overall accuracy assessment of entire CLC2000 product, based on a representative sample
Stratification
Determination of the number of sampling points
Sampling methodology: stratified random sampling
5415 July 2005 ICC 2005 A Coruña 54
points
Random selection of sampling polygons
Check photo-interpretation of polygons

28
Stratification
A) CLC2000: one stratus per class
B) Changes database:
5515 July 2005 ICC 2005 A Coruña 55
• Non-updated area
• Updated area
Determination of the numberof sampling points
z2 ph (1-ph)
For each stratum h nh =e2
h
nh : Number of sample points
ph: A previously estimated error rate for the stratum h
5615 July 2005 ICC 2005 A Coruña 56
ph p y
eh: The accepted absolute standard error for the estimationof the percentage of incorrect identified size of area forthe stratum h
z: Abscise of normal curve

29
Thematic accuracy
• Per stratum$
• Overall
Xh
h = nh
$p
: estimation of the overall accuracy of several $p
h: estimation of the percentage of correctly classified area in stratum h
Xh: number of correctly classified points in stratum h
nh: total number of points in stratum h
p
5715 July 2005 ICC 2005 A Coruña 57
Ah= Σ h
h A$p$p
strata
Ah : Total area of stratum h
A : Total area of the CORINE Land Cover inventory
p
Confidence interval
• It is necessary to have an estimation of error to obtain the
• Moivre theorem
for n Zp P
PQn
=−$
yconfidence interval
P: accuracyQ = 1-P
: accuracy estimation of the sample$p
5815 July 2005 ICC 2005 A Coruña 58
• For a confidence level = 95% the interval extremes are :
nPQ1.96p̂ ± P is unknown estimation: P ≈ $p

30
Number of validation polygons:
5915 July 2005 ICC 2005 A Coruña 59
CO
DE
_00
Anda
luci
a
Arag
ón
Astu
rias
Bale
ares
Can
tabr
ia
C-L
eón
C-M
anch
a
Can
aria
s
Cat
aluñ
a
Ceu
ta
Cha
farin
as
Extre
mad
ura
Gal
icia
La R
ioja
Mad
rid
Mel
illa
Mur
cia
Nav
arra
País
Vas
co
Vale
ncia
Tota
l
111 24 8 1 4 1 15 16 7 17 0 0 8 1 2 4 0 5 3 3 13 132112 16 3 3 9 6 9 10 4 25 0 0 2 7 0 12 0 4 1 3 17 131121 18 7 3 2 1 10 8 2 18 0 0 5 5 2 11 0 8 4 8 15 127122 11 6 7 1 2 13 4 1 1 0 0 1 2 0 3 0 1 1 2 9 65123 14 0 3 3 2 0 0 3 15 1 0 0 11 0 0 1 3 0 4 6 66124 7 1 1 3 1 3 2 6 3 0 0 1 3 1 4 1 1 1 2 2 43131 19 9 3 1 2 21 10 3 9 0 0 5 12 0 7 0 5 1 2 8 117132 10 6 6 1 1 9 0 1 3 0 0 1 1 0 9 0 3 2 1 1 55
Number of validation polygons:
132 10 6 6 1 1 9 0 1 3 0 0 1 1 0 9 0 3 2 1 1 55133 26 6 2 3 1 8 3 3 4 0 0 0 2 1 13 0 10 1 2 20 105141 7 2 1 0 1 3 1 1 2 0 0 0 0 1 15 0 1 1 4 3 43142 20 5 2 8 2 5 2 3 15 0 0 1 2 0 11 0 3 1 2 9 91211 24 25 0 3 0 18 29 5 11 0 0 8 0 1 2 0 5 2 1 4 138212 27 13 0 3 0 28 31 2 8 0 0 5 0 1 3 0 5 2 0 5 133213 5 50 0 0 0 0 2 0 2 0 0 26 0 0 0 0 4 1 0 2 92221 11 7 0 0 0 21 36 3 7 0 0 10 3 4 3 0 7 4 0 12 128222 38 9 1 5 0 1 5 4 10 0 0 6 0 1 0 0 24 0 0 27 131223 59 4 0 1 0 2 33 0 3 0 0 23 0 1 2 0 2 0 0 5 135231 0 7 35 2 19 26 1 3 11 0 0 1 1 0 2 0 0 5 18 0 131241 13 1 0 44 0 7 9 0 3 0 0 4 0 1 0 0 1 0 0 5 88242 25 15 2 3 2 13 18 0 10 0 0 4 23 1 1 0 6 1 0 12 136243 15 25 7 3 2 18 16 0 16 0 0 2 10 1 1 0 5 3 1 12 137244 52 0 0 0 0 26 23 0 0 0 0 29 0 0 3 0 0 0 0 0 133311 24 13 12 1 6 32 12 0 8 0 0 10 8 2 2 0 0 3 3 2 138312 16 20 3 4 2 20 14 1 19 0 0 3 5 2 2 0 4 4 6 11 136313 12 19 3 4 2 18 7 0 21 0 0 1 27 1 1 0 1 5 11 3 136321 20 10 3 0 2 37 26 0 5 0 0 19 3 1 4 0 0 2 1 4 137322 0 9 38 0 15 22 0 2 9 0 0 0 24 2 0 0 0 5 7 0 133323 25 22 0 2 0 23 23 1 8 0 0 10 0 1 3 0 5 4 2 8 137324 24 19 5 2 3 20 18 0 10 0 0 8 6 1 3 0 3 2 5 9 138
6015 July 2005 ICC 2005 A Coruña 60
331 18 18 1 3 3 1 1 8 11 1 0 0 10 0 1 0 7 0 1 10 94332 9 21 6 5 2 33 5 7 19 0 0 3 0 0 1 0 1 2 5 1 120333 14 25 14 0 5 20 8 6 11 0 0 4 0 3 0 0 17 2 0 2 131334 4 0 16 1 1 27 10 0 12 0 0 2 6 0 3 0 0 0 0 5 87335 0 5 0 0 0 0 0 0 0 0 0 0 0 0 0 0 0 0 0 0 5411 5 26 1 0 2 10 11 0 3 0 0 0 0 0 1 0 5 2 1 4 71412 0 3 6 0 2 0 0 0 0 0 0 0 0 0 0 0 0 0 0 0 11421 18 0 5 2 12 0 0 0 10 0 0 0 12 0 0 0 2 0 0 10 71422 31 0 0 4 0 0 1 1 1 0 0 0 0 0 0 0 3 0 0 3 44423 5 0 0 0 2 0 0 0 0 0 0 0 25 0 0 0 1 0 2 0 35511 2 2 0 0 0 5 6 0 5 0 0 4 9 3 8 0 0 5 2 1 52512 23 12 2 0 1 14 19 0 8 0 0 13 6 1 3 0 2 2 2 4 112521 1 0 0 4 2 0 0 1 6 0 0 0 4 0 0 0 1 0 0 7 26522 8 0 4 0 8 0 0 0 0 0 0 0 9 0 0 0 0 0 3 0 32523 1 0 0 1 0 0 0 0 0 0 2 0 0 0 0 0 1 0 0 1 6999 0 0 0 0 0 0 0 0 0 0 1 0 0 0 0 0 0 0 0 0 1
701 433 196 132 113 538 420 78 359 2 3 219 237 35 138 2 156 72 104 272 4210
31
6115 July 2005 ICC 2005 A Coruña 61
1. Background of I&CLC2000 in Spain
Summary
. Bac g ou d o &C C 000 Spa
2. Quality control
3. Results
4. Lessons learnt
5 Future actions: SIOSE Project
6215 July 2005 ICC 2005 A Coruña 62
5. Future actions: SIOSE Project
6. Conclusions

32
6315 July 2005 ICC 2005 A Coruña 63
6415 July 2005 ICC 2005 A Coruña 64

33
RESULTS: % changes per Region%
Supe
rfic
ie c
ambi
o /
Supe
rfic
ie C
A
%cambio en España
6515 July 2005 ICC 2005 A Coruña 65
(*) DATOS PROVISIONALES
RESULTS: changes at level 2
6615 July 2005 ICC 2005 A Coruña 66
(*) DATOS PROVISIONALES
34
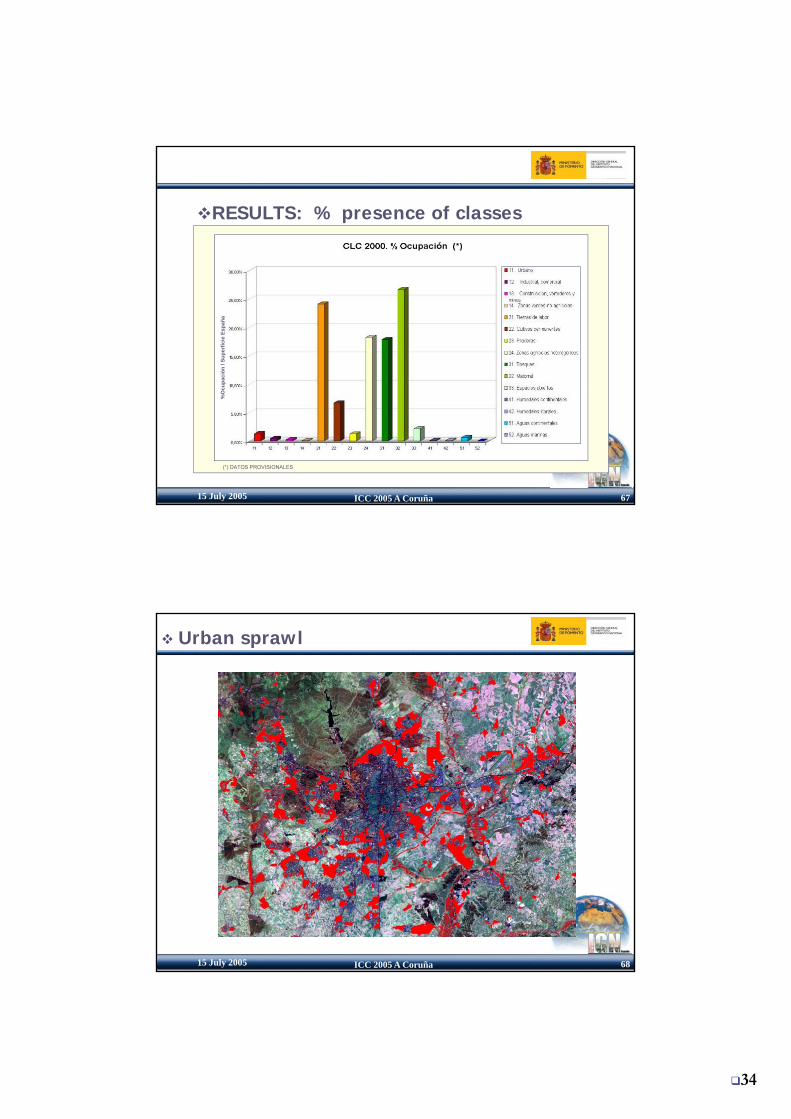
RESULTS: % presence of classesup
ació
n / S
uper
ficie
Esp
aña
6715 July 2005 ICC 2005 A Coruña 67
(*) DATOS PROVISIONALES
%O
cu
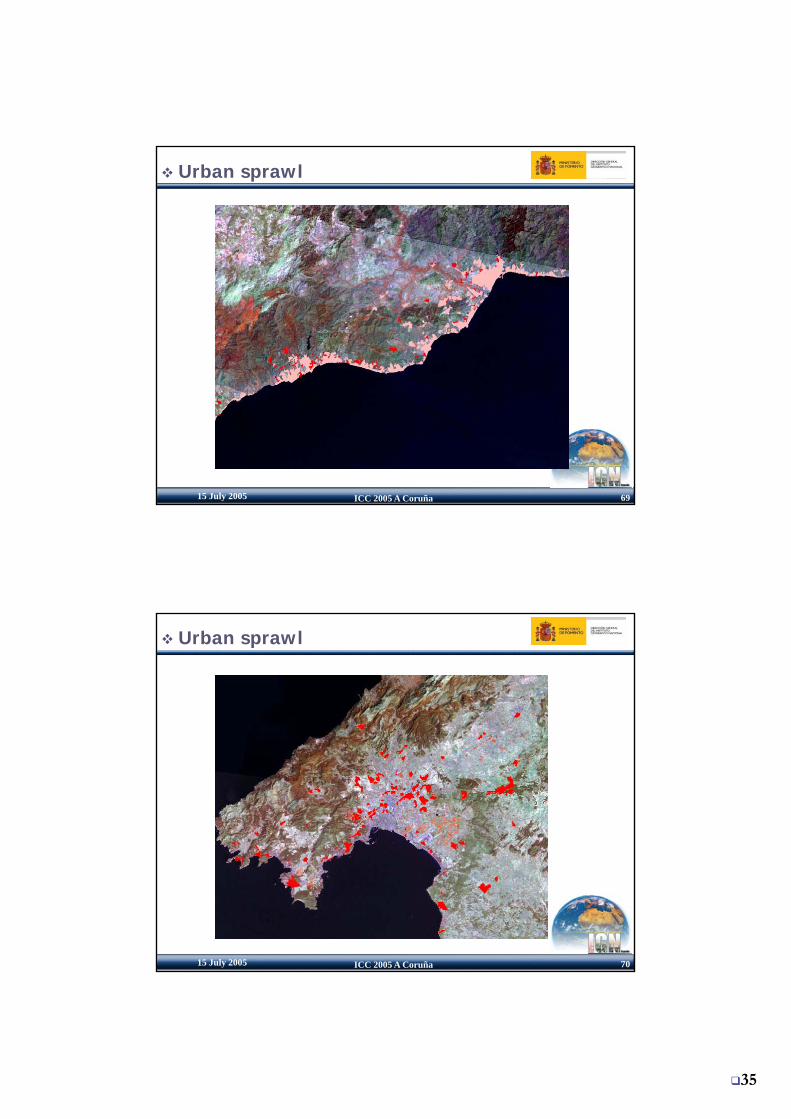
Urban sprawl
6815 July 2005 ICC 2005 A Coruña 68
35
Urban sprawl
6915 July 2005 ICC 2005 A Coruña 69
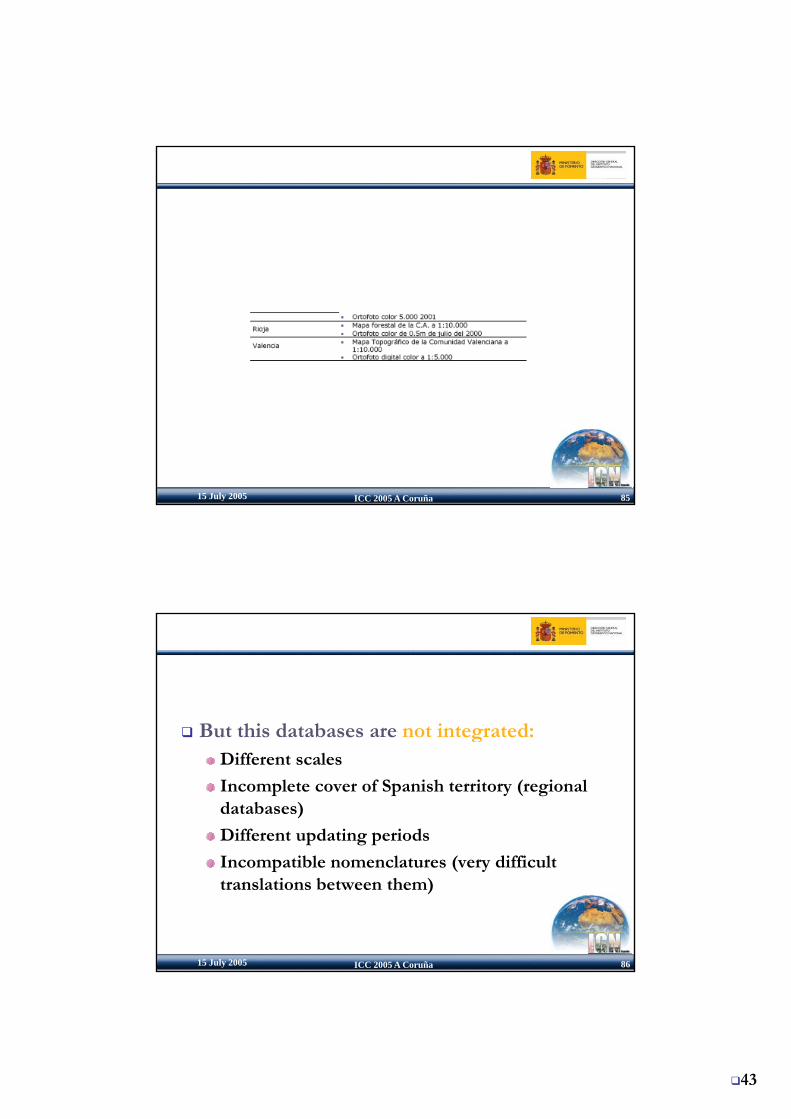
Urban sprawl
7015 July 2005 ICC 2005 A Coruña 70

36
Urban sprawl and irrigation
7115 July 2005 ICC 2005 A Coruña 71
1. Background of I&CLC2000 in Spain
Summary
. Bac g ou d o &C C 000 Spa
2. Quality control
3. Results
4. Lessons learnt
5 Future actions: SIOSE Project
7215 July 2005 ICC 2005 A Coruña 72
5. Future actions: SIOSE Project
6. Conclusions

37
Lessons learnt
1) Land use and Land cover information is a critical issue in Spain:Water supply (quantity and quality)Water supply (quantity and quality)Urban sprawl (especially in the coast)Tourism expansion/sustainabilityInfrastructure planning & ecological impactDesertificationR l E t t b (“b bbl ”?)
7315 July 2005 ICC 2005 A Coruña 73
Real Estate boom (“bubble”?)Housing problem (huge price increase)Climate change (Kyoto protocol)Very high rate of Land Cover change in Spain
Lessons learnt
2) V bi i i2) Very big impact in:
Communication media (Journals, radio, TV)
Political life
7415 July 2005 ICC 2005 A Coruña 74

38
Lessons learnt
3) Politicians “sometimes” make promises or
take decisions based on what is published ontake decisions based on what is published on
journals, not on Technical Reports →
We should be careful with the information we
send to journals and other media
7515 July 2005 ICC 2005 A Coruña 75
Databases should be easy to understand by
non expert people
Lessons learnt
4) Corine Land Cover addresses this information needs but … doesn’t solve them completely, because:
Scale too little
Minimum polygon too big
Updating period too long
7615 July 2005 ICC 2005 A Coruña 76
Nomenclature not detailed enough
Nomenclature not good enough

39
Lessons learnt
Nomenclature not good enough (1):
It is actually a “thematic map” (classification), not a complete GIS database
It mixes cover and use (→ semantic
7715 July 2005 ICC 2005 A Coruña 77
problems; erroneous conclusions,…)
Lessons learnt
Nomenclature not good enough (2):
Mixed classes → information lost
It produces incoherencies when compared with other Land Use and land Cover databases (especially when
7815 July 2005 ICC 2005 A Coruña 78
analyzed by non expert people)→ political “wars”.

40
Lessons learnt
Nomenclature not good enough (3):
Only one parameter per polygon (class label). Reality is much more complex !!:
e.g: percentage of trees in a forest, building density,…
7915 July 2005 ICC 2005 A Coruña 79
e.g. Class 244: Agroforestry areas
The “DEHESA” is an old land-use
i i fsystem consisting of scattered oak trees on pasture or crop land used by livestock.
This system is
8015 July 2005 ICC 2005 A Coruña 80
yfrequent in the west, south-west and central parts of the Iberian Peninsula

41
1. Background of I&CLC2000 in Spain
Summary
. Bac g ou d o &C C 000 Spa
2. Quality control
3. Results
4. Lessons learnt
5 Future actions: SIOSE Project
8115 July 2005 ICC 2005 A Coruña 81
5. Future actions: SIOSE Project
6. Conclusions
Present situation of Land Use/LandCover information in Spain
Various institutions feel a strong need for more big scale / high detail information
Some institutions of National and regional (Autonomous Communities) levels, keep geographic information databases related with land use/cover at higher level of detail (geometrically –bigger scale- and semantically) than CLC2000.
8215 July 2005 ICC 2005 A Coruña 82
E.g.: Minister of Agriculture, Minister of Environment, various Autonomous Communities,…

42
8315 July 2005 ICC 2005 A Coruña 83
8415 July 2005 ICC 2005 A Coruña 84
43
8515 July 2005 ICC 2005 A Coruña 85
But this databases are not integrated:But this databases are not integrated:Different scales
Incomplete cover of Spanish territory (regional databases)
Different updating periods
8615 July 2005 ICC 2005 A Coruña 86
Incompatible nomenclatures (very difficult translations between them)

44
INSPIRE visionData should be collected once and maintained at the level where this can be done most effectivelywhere this can be done most effectivelyit should be possible to combine seamlessly spatial information from different sources across Europe and share it between many users and applicationit should be possible for information collected at one level to be shared between all the different levels, detailed for detailed investigations, general for strategic purposes
8715 July 2005 ICC 2005 A Coruña 87
geographic information needed for good governance at all levels should be abundant under conditions that do not refrain its extensive use
SIOSE Project (Spanish Land Cover information system)
Nominal Scale: 1:25.000Minimum polygon:
2 Ha general1 Ha artificial coverages
8815 July 2005 ICC 2005 A Coruña 88
1 Ha artificial coveragesPeriodicity: 5 years

45
SIOSE Project
Base information:SPOT 5 images XS+P 2.5m (2005)Orthophotos 0.5 m (PNOA)
Decentralized production (regional governments)
8915 July 2005 ICC 2005 A Coruña 89
SIOSE Project
Terrestrial geo-referenced (and oriented) digital h d bphoto database
9015 July 2005 ICC 2005 A Coruña 90

46
SIOSE Project
A new Land Use / Land Cover Data Model:Multi-criteria (cover + use)M l i ( l i l ibMulti-parameter (multiple attributes possible for 1 polygon)Object oriented (UML description, GML implementation)Extensible (for future and/or specific
9115 July 2005 ICC 2005 A Coruña 91
needs)Designed in a cooperative effort to fulfill the requirements of all institutions/social agents
SIOSE Conceptual Data Model: Design Guidelines
Separation between Land Cover (biophysical criteria) and Land Use (socio-economic criteria)
There is only one geometric entity class in SIOSE (POLYGON)
Mixed Classes in SIOSE: created by association of
9215 July 2005 ICC 2005 A Coruña 92
ysingles classes

47
Thematic Working groups are using the first draft version of the SIOSE Conceptual Data model it describes abstract classes and relations, and some characteristic attributes, linked to the existing land cover / uses nomenclatures. So it is not the
SIOSE Conceptual Data Model: Design Guidelines
g /future SIOSE physical data model.SIOSE Conceptual Data model: in UML notation (Unified Modeling Language). It provides normalized notation about classes and relations between them, according to ISO TC211 and OGC recommendations.This standardized notation provides flexibility to the model, so that Thematic Working Groups and future users can
9315 July 2005 ICC 2005 A Coruña 93
so that Thematic Working Groups and future users can modify and extend it easily.
SIOSE Conceptual Data model has considered previous Spanish Land Cover and Use Nomenclatures and Databases, from national and regional institutions.
SIOSE Data Model: Conceptual Model UML Diagram
ABSTRACT CLASS
InheritanceAssociation
Olive grove Class inheritsproperties and attributes of:
9415 July 2005 ICC 2005 A Coruña 94
properties and attributes of:•Cover•Agricultural Surfaces•Woody Crops

48
4. SIOSE Conceptual Data Model: UML
9515 July 2005 ICC 2005 A Coruña 95
SIOSE Conceptual Data Model: Relation Polygon – Land Cover – Use
9615 July 2005 ICC 2005 A Coruña 96

49
Agricultural Coverages
9715 July 2005 ICC 2005 A Coruña 97
Land Uses
9815 July 2005 ICC 2005 A Coruña 98

50
Example: Translation from CLC Nomenclature to SIOSE
SIOSE: Polygon associated to the following cover:Cover 1: 1.4 Infrastructures
(C dS f P t 100%)
Spanish CLC: 1.2.2.2 Class – Railway area
(CoveredSurfacePercentage= 100%)(InfrastructureType = Road Network)(InfrastructureSubtype = railway)
9915 July 2005 ICC 2005 A Coruña 99
Example 2: Link between CLC - SIOSEMixed Classes
Spanish CLC: 2.4.1.2 class: ‘annual crops associated to permanent irrigated crops’
Non permanent crops associated to permanent irrigated crops in the same plot of land.
SIOSE: polygon associated to 3 covers:Cover 1: 2.1 Herbaceous Crops
CoveredSurfacePercentage = 50%Abandoned= NOHerbaceousType: LabourIrrigated /Non irrigated = Irrigated
Cover 2: 2.2.1 Fruit TreesCoveredSurfacePercentage = 20%
NO
For each polygon, the sum of the covered
10015 July 2005 ICC 2005 A Coruña 100
Abandoned = NOFruitTreeType: CitricIrrigated /Non irrigated = Irrigated
Cover 3: 2.2.2 VineyardCoveredSurfacePercentage = 30%Abandoned = NOIrrigated /Non irrigated = Irrigated
surface percentages of its associated covers must be 100%.

51
Example 3: Link between MCA - SIOSE
Crop Map Code = OL [Non irrigated Olive Grove]
SIOSE: polygon associated to 1 cover :Cover 1: 2.2.3. Olive GroveCoveredSurfacePercentage = 100%Irrigated /Non irrigated =Non Irrigated
10115 July 2005 ICC 2005 A Coruña 101
Non Irrigated Abandoned = NO
1. Background of I&CLC2000 in Spain
Summary
. Bac g ou d o &C C 000 Spa
2. Quality control
3. Results
4. Lessons learnt
5 Future actions: SIOSE Project
10215 July 2005 ICC 2005 A Coruña 102
5. Future actions: SIOSE Project
6. Conclusions

52
Conclusions
Land use / land cover informationLand use / land cover information critical today
This problem is not being adequately addressed by existing databases
10315 July 2005 ICC 2005 A Coruña 103
Conclusions
Wh i d d?What is needed?New technological approaches (specially data models)
Much bigger investments (until now: far too low compared with base mapping and
10415 July 2005 ICC 2005 A Coruña 104
too low compared with base mapping and other databases)
53
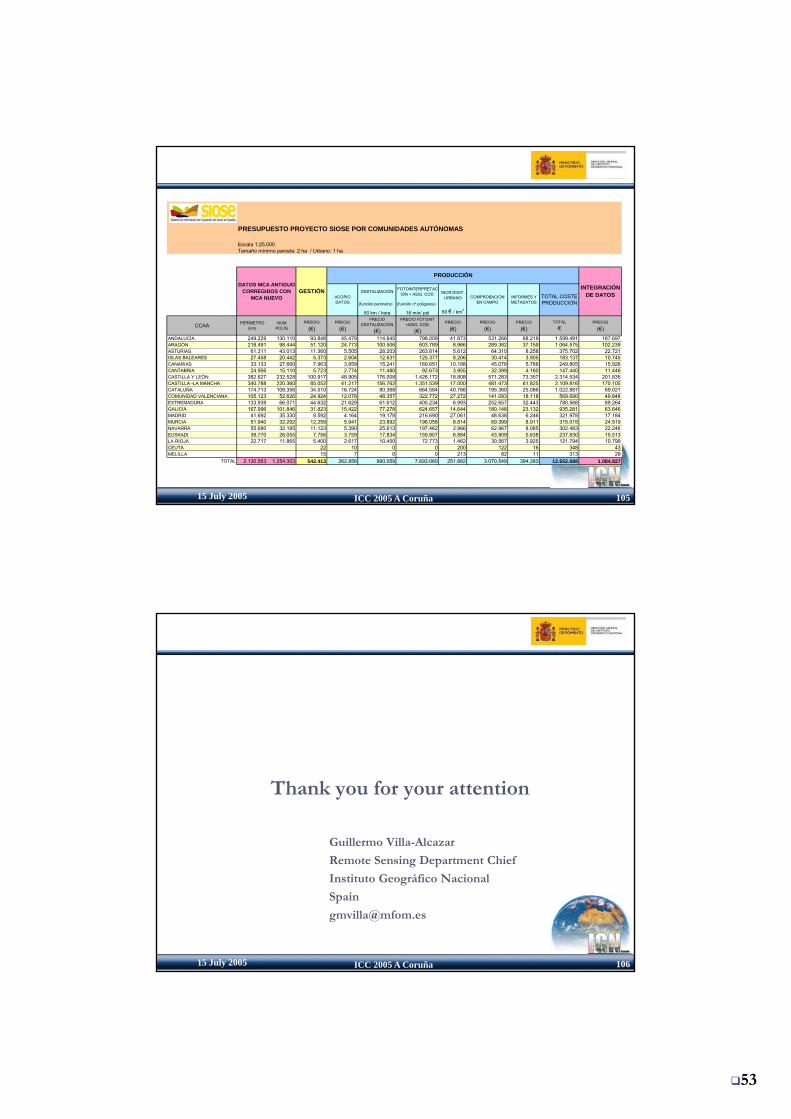
PRESUPUESTO PROYECTO SIOSE POR COMUNIDADES AUTÓNOMAS
Escala 1:25.000Tamaño mínimo parcela: 2 ha / Urbano: 1 ha
(función perímetro) (función nº polígonos)
50 km / hora 16 min/ pol 60 € / km2
CCAA PERÍMETRO(km)
NUMPOLÍG
PRECIO
(€)PRECIO
(€)
PRECIODIGITALIZACIÓN
(€)
PRECIO FOTOINT+ASIG. COD.
(€)PRECIO
(€)PRECIO
(€)PRECIO
(€)TOTAL
€PRECIO
(€)ANDALUCÍA 249.229 130.110 93.848 45.479 114.645 798.009 41.873 531.266 68.219 1.599.491 187.697ARAGÓN 218.491 98.444 51.120 24.773 100.506 603.789 8.966 289.382 37.159 1.064.575 102.239ASTURIAS 61.311 43.013 11.360 5.505 28.203 263.814 5.612 64.310 8.258 375.702 22.721ISLAS BALEARES 27.458 20.442 5.373 2.604 12.631 125.377 8.206 30.414 3.905 183.137 10.745CANARIAS 33.133 27.660 7.963 3.859 15.241 169.651 10.188 45.078 5.788 249.805 15.926CANTABRIA 24.956 15.110 5.723 2.774 11.480 92.673 3.955 32.399 4.160 147.440 11.446CASTILLA Y LEÓN 382.627 232.528 100.917 48.905 176.008 1.426.172 18.808 571.283 73.357 2.314.534 201.835CASTILLA -LA MANCHA 340.788 220.360 85.052 41.217 156.762 1.351.539 17.000 481.473 61.825 2.109.816 170.105
TOTAL COSTE PRODUCCIÓN
COMPROBACIÓNEN CAMPO
INFORMES YMETADATOS
INTEGRACIÓN DE DATOS
PRODUCCIÓN
ACOPIODATOS
GESTIÓNDATOS MCA ANTIGUO
CORREGIDOS CON MCA NUEVO
DIGITALIZACIÓN FOTOINTERPRETACIÓN + ASIG. COD. INCR.DIGIT.
URBANO
10515 July 2005 ICC 2005 A Coruña 105
CATALUÑA 174.713 108.356 34.510 16.724 80.368 664.584 40.766 195.360 25.086 1.022.887 69.021COMUNIDAD VALENCIANA 105.123 52.626 24.924 12.078 48.357 322.772 27.272 141.093 18.118 569.690 49.848EXTREMADURA 133.939 66.071 44.632 21.629 61.612 405.234 6.993 252.657 32.443 780.568 89.264GALICIA 167.996 101.846 31.823 15.422 77.278 624.657 14.644 180.148 23.132 935.281 63.646MADRID 41.692 35.330 8.592 4.164 19.178 216.690 27.061 48.638 6.246 321.978 17.184MURCIA 51.940 32.292 12.259 5.941 23.892 198.058 8.814 69.399 8.911 315.015 24.519NAVARRA 55.680 32.195 11.123 5.390 25.613 197.462 2.966 62.967 8.085 302.483 22.246EUSKADI 38.770 26.055 7.756 3.759 17.834 159.807 6.884 43.909 5.638 237.830 15.513LA RIOJA 22.717 11.865 5.400 2.617 10.450 72.773 1.462 30.567 3.925 121.794 10.799CEUTA 22 10 0 0 200 122 16 348 43MELILLA 15 7 0 0 213 82 11 313 29
TOTAL 2.130.563 1.254.303 542.413 262.856 980.059 7.693.060 251.882 3.070.549 394.283 12.652.688 1.084.827
Thank you for your attention
Guillermo Villa-Alcazar
10615 July 2005 ICC 2005 A Coruña 106
Remote Sensing Department Chief
Instituto Geográfico Nacional
Spain

54
Spanish National Plan for Observation of Territory y
(PNOT)
15 July 2005 ICC 2005 A Coruña 107
Planes Autonómicos de Ortofotografía
Aérea
0,10 a 0,25 mAlta:
Pancro: 1 a 10 mMultiesp: 4 a 30 m
Media:Pancro: 10 a 15 mMultiesp: 20 a 50 m
5 a 2 años 12 a 3 meses 4 a 1 meses
Baja:Multiespectral:100 a 1.000 m
30 a 1 día
Plan Nacional de Ortofotografía Aérea
(PNOA)
Plan Nacional de Teledetección(PNT)
Frecuencia Temporal
PLAN NACIONAL DE OBSERVACIÓN DEL TERRITORIO (PNOT)
0,5 m
Nombre del Plan
2 años
Resolución espacial
1ª fase:Obt ió t t i t d i á 5 a 2 años 12 a 3 meses 4 a 1 meses
SPOT (HRVIR) Landsat 7 (ETM+)
IRS Landsat 5 (TM)
Futuro sistema Pleiades TERRA (ASTER)
Futuro sistema español deobservación de la Tierra
IRS
Nombre del Sistema Bases de Datos Organismos 2.000 a 5.000 10.000 25.000 25.000 a 50.000 100.000 a200.000 500.000 1.000.000
AGE BCN 25 BCN 200
30 a 1 díaFrecuencia Temporal
Bases Cartográficas (BC)
Escala de la Base de DatosSistema de Información
(Armonización, síntesis y diseminación según los principios INSPIRE entre los distintos organismos que recogen o utilizan esta
información)
Terra (MODIS)
NOAA
Fotografía aérea1: 30.000
Fotografía aérea escalas
1: 10.000 a 1: 18.000
Envisat (MERIS)
SPOT (Vegetation)
2 años
Sensores
2ª Fase: Extracción y
Obtención y tratamiento de imágenes aeroespaciales
Área temática
Sistema CartográficoNacionalCartografía básica
10815 July 2005 ICC 2005 A Coruña 108
CC.AA. ♦ ♦
Ocupación del Suelo
Sistema de Informaciónde Ocupación del Sueloen España (SIOSE)
Bases de Datos de Cobertura y Usos del Suelo
AGE /CC.AA. Corine Land Cover
Otros tipos de información
AGE / CC.AA /Universidades
Parámetros Bio-físicos(NDVI, Temp. Suelo, etc…)
SIOSEMCAMFE
t acc ó ydiseminación de la información
Nacional

55
Validación estadística
Método escogido:Aleatorio estratificado se trata de determinar laAleatorio estratificado se trata de determinar la probabilidad p de acierto de cada estrato desde el punto de vista temático
Dos productos a validar:CLC2000
CLCh
10915 July 2005 ICC 2005 A Coruña 109
CLChange
Obtención del tamaño de la muestra n
El nivel de confianza ( )2 1 ppzEl nivel de confianza determina el parámetro z
Intervalo de confianza d
Estimación de la probabilidad p de acierto para cada estrato
C ió fi i d > N
( )20
1d
ppzn −=
nnn 11 0
0
−+=
11015 July 2005 ICC 2005 A Coruña 110
Corrección por finitud-> N número total de polígonos en cada estrato
N1+
56
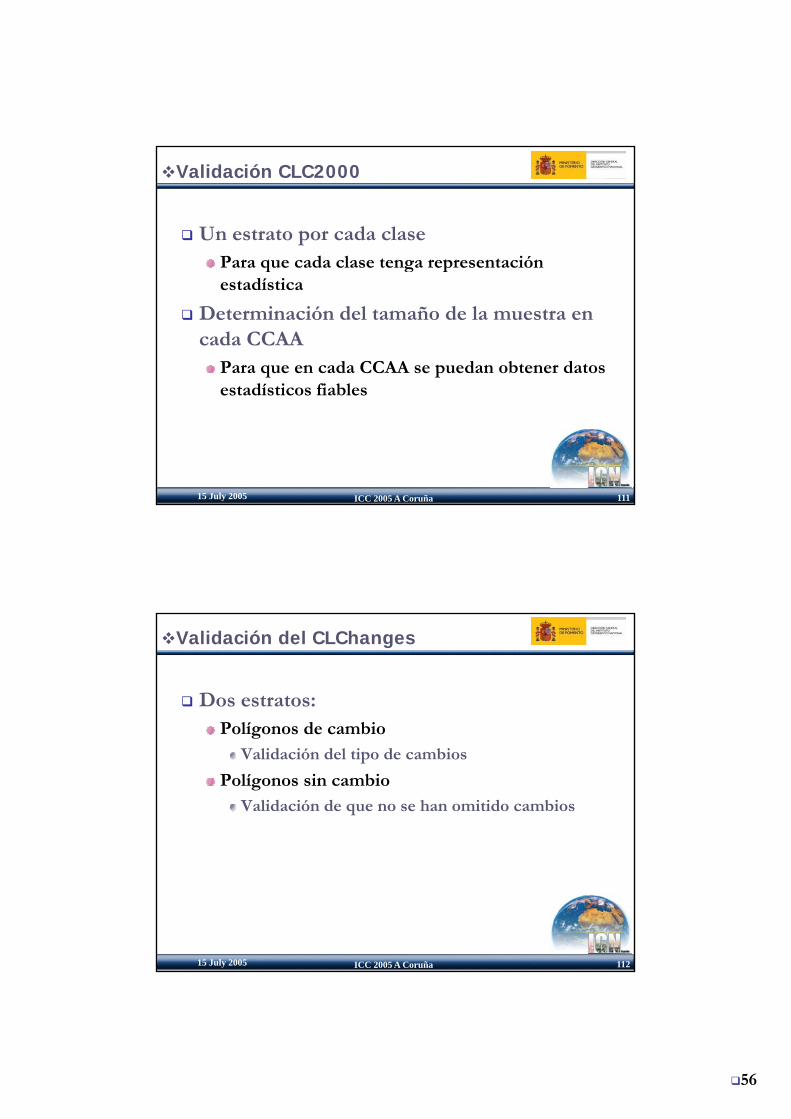
Validación CLC2000
Un estrato por cada clasePara que cada clase tenga representaciónPara que cada clase tenga representación estadística
Determinación del tamaño de la muestra en cada CCAA
Para que en cada CCAA se puedan obtener datos dí i fi bl
11115 July 2005 ICC 2005 A Coruña 111
estadísticos fiables
Validación del CLChanges
Dos estratos:Polígonos de cambioPolígonos de cambio
Validación del tipo de cambios
Polígonos sin cambioValidación de que no se han omitido cambios
11215 July 2005 ICC 2005 A Coruña 112
57
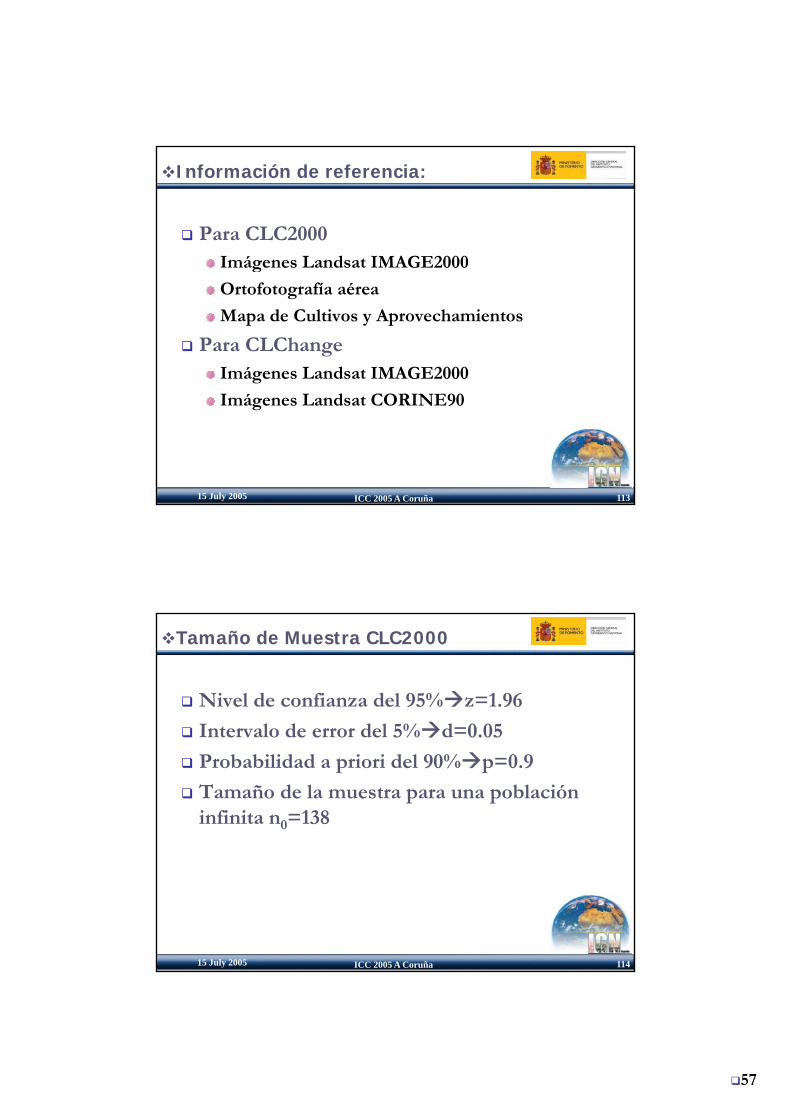
Información de referencia:
Para CLC2000Imágenes Landsat IMAGE2000Imágenes Landsat IMAGE2000
Ortofotografía aérea
Mapa de Cultivos y Aprovechamientos
Para CLChangeImágenes Landsat IMAGE2000
11315 July 2005 ICC 2005 A Coruña 113
Imágenes Landsat CORINE90
Tamaño de Muestra CLC2000
Nivel de confianza del 95% z=1.96
Intervalo de error del 5% d=0 05Intervalo de error del 5% d=0.05
Probabilidad a priori del 90% p=0.9
Tamaño de la muestra para una población infinita n0=138
11415 July 2005 ICC 2005 A Coruña 114

58
Tamaño Muestra CLC2000
Corrección por finitud
Cálculo de n teniendo en cuenta que la población q pno es infinita
Frequency de cada clase en ámbito nacional N
nn 0=
11515 July 2005 ICC 2005 A Coruña 115
Nnn 11 0 −+
=
Tamaño de la muestra por CCAA
Para determinar el número de muestras en cada CCAA se necesita un Frequency de q ytodas las clases al nivel 3 para cada CCAA
Reparto proporcional del tamaño de la muestra por CCAA
11615 July 2005 ICC 2005 A Coruña 116
59
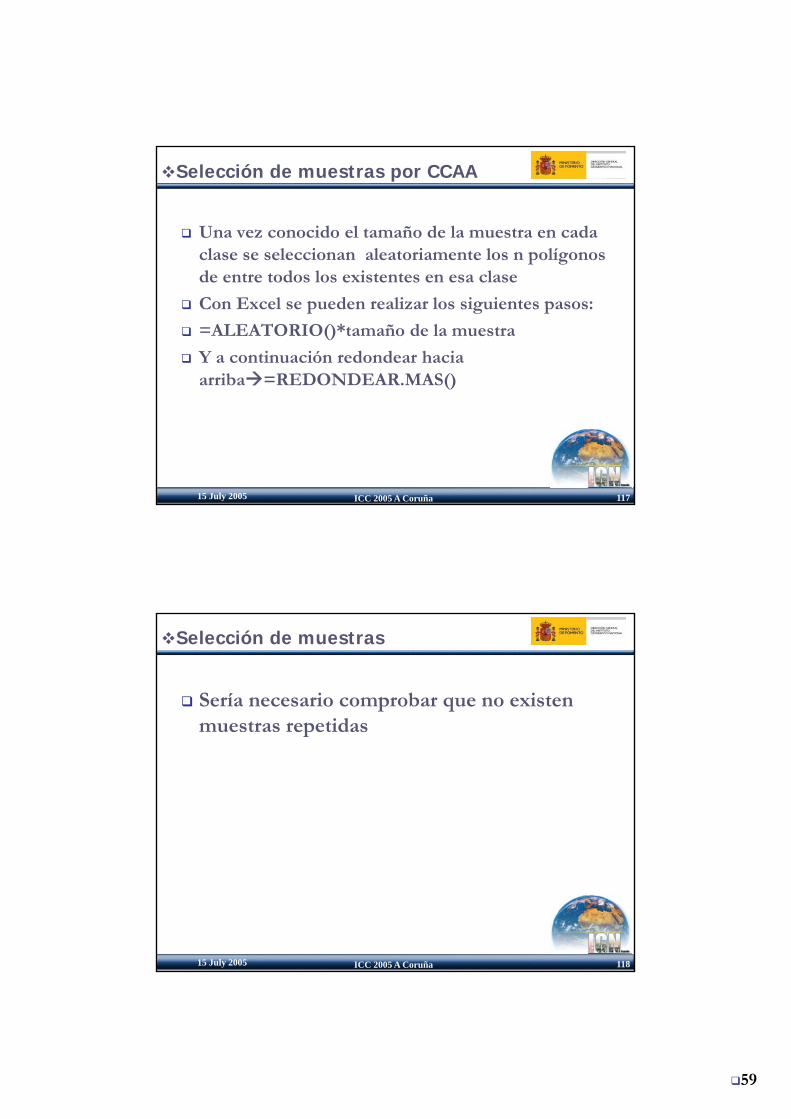
Selección de muestras por CCAA
Una vez conocido el tamaño de la muestra en cada clase se seleccionan aleatoriamente los n polígonos de entre todos los existentes en esa clase
Con Excel se pueden realizar los siguientes pasos:
=ALEATORIO()*tamaño de la muestra
Y a continuación redondear hacia arriba =REDONDEAR.MAS()
11715 July 2005 ICC 2005 A Coruña 117
()
Selección de muestras
Sería necesario comprobar que no existen muestras repetidasp
11815 July 2005 ICC 2005 A Coruña 118