quality assessment report for water quality … assessment report for water quality monitoring...
TRANSCRIPT
Quality Assessment Report for Water Quality Monitoring
October – December 2009
Submitted to the Technical Oversight Committee
February 16, 2009
Zdzislaw Kolasinski ([email protected])
Analytical Services Division Restoration Sciences Department
South Florida Water Management District West Palm Beach, Florida 33406

October – December 2009 Quality Assessment Report for Water Quality Monitoring
Quality Assessment Report for Water Quality Monitoring October ─ December 2009
1
INTRODUCTION
This report is an assessment of the South Florida Water Management District (SFWMD or District) laboratory analysis and field sampling for total phosphorus (TP) monitoring, primarily for the following projects and their associated stations from October 1, 2009, through December 31, 2009:
• Everglades National Park Inflows North (PIN): S12A, S12B, S12C, S12D, S333, S355A, S355B, and S356
• Everglades National Park Inflow East (PIE): S332DX, S18C, DS2, DS4, and BermB3
• Everglades Protection Area (EVPA): LOX3 through LOX16
Because field quality control (QC) samples are collected for sampling events that include multiple project samples for the stations of interest, the report may also cover information on stations or projects other than those in the above list.
The District’s Field Sampling Quality Manual1 provides the minimum requirements followed in field sample collection. The Chemistry Laboratory Quality Manual2 provides the minimum requirements followed in preparing and analyzing laboratory samples, as well as data verification and validation. The Field Sampling Quality Assessment and Laboratory Analysis Quality Assessment sections in this report provide the field and laboratory QC results during this quarter. The SFWMD’s Laboratory Information Management System (LIMS) provided the data used in this report. These data are considered preliminary until release into the District’s DBHYDRO database.
Additionally, this report includes an analysis of the District laboratory’s performance on the split (EVPA) and inter-laboratory studies with the Florida Department of Environmental Protection (FDEP) for a one-year period. The report also includes the results of the National Proficiency Testing Program, which is designed to evaluate the laboratory’s performance through analysis of unknown samples provided by an external source. Proficiency testing is one of the essential elements of the National Environmental Laboratory Accreditation Program (NELAP) accreditation process.
1 SFWMD. 2009. Field Sampling Quality Manual, Version 5.0. South Florida Water Management District, Water Quality Monitoring Division and Quality Assurance Staff. West Palm Beach, FL. 2 SFWMD. 2009. Chemistry Laboratory Quality Manual (Rev. No. 2009-01). South Florida Water Management District, Water Quality Monitoring Division, Environmental Resource Assessment Department. West Palm Beach, FL.
October – December 2009 Quality Assessment Report for Water Quality Monitoring
2
FIELD SAMPLING QUALITY ASSESSMENT
PROCEDURE UPDATES
This period had no major procedural updates related to TP sample collection.
MISSING DATA
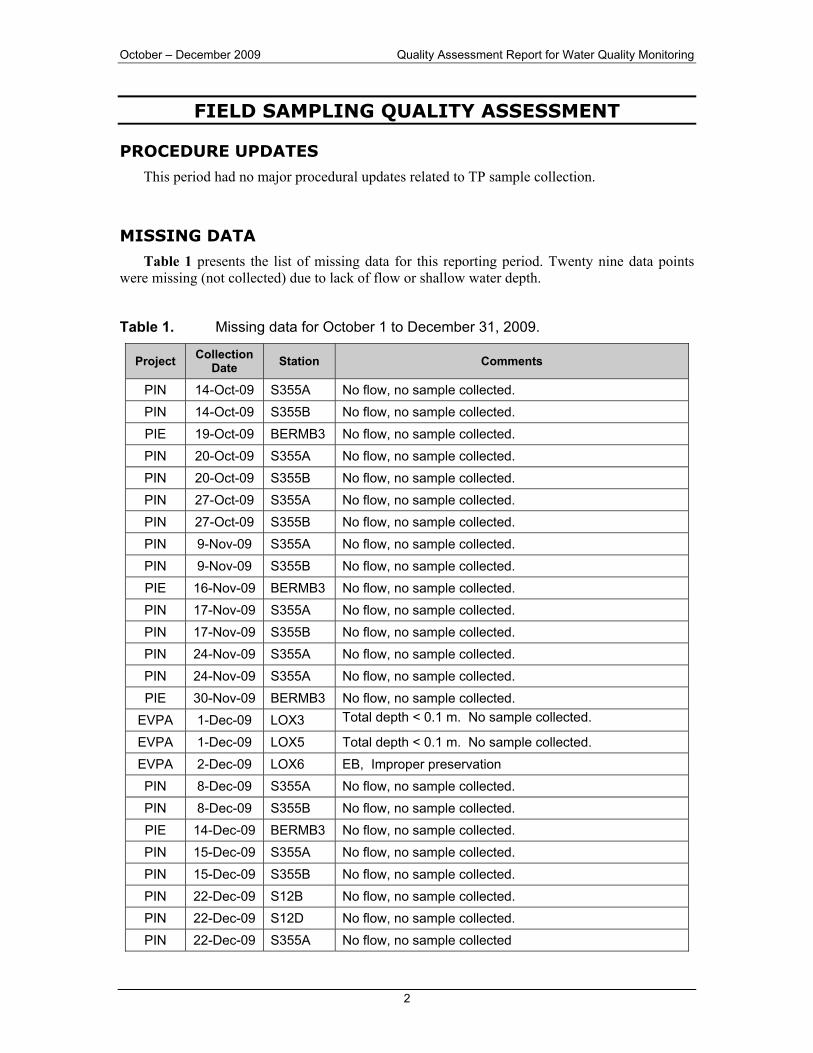
Table 1 presents the list of missing data for this reporting period. Twenty nine data points were missing (not collected) due to lack of flow or shallow water depth.
Table 1. Missing data for October 1 to December 31, 2009.
Project Collection Date Station Comments
PIN 14-Oct-09 S355A No flow, no sample collected. PIN 14-Oct-09 S355B No flow, no sample collected. PIE 19-Oct-09 BERMB3 No flow, no sample collected. PIN 20-Oct-09 S355A No flow, no sample collected. PIN 20-Oct-09 S355B No flow, no sample collected. PIN 27-Oct-09 S355A No flow, no sample collected. PIN 27-Oct-09 S355B No flow, no sample collected. PIN 9-Nov-09 S355A No flow, no sample collected. PIN 9-Nov-09 S355B No flow, no sample collected. PIE 16-Nov-09 BERMB3 No flow, no sample collected. PIN 17-Nov-09 S355A No flow, no sample collected. PIN 17-Nov-09 S355B No flow, no sample collected. PIN 24-Nov-09 S355A No flow, no sample collected. PIN 24-Nov-09 S355A No flow, no sample collected. PIE 30-Nov-09 BERMB3 No flow, no sample collected.
EVPA 1-Dec-09 LOX3 Total depth < 0.1 m. No sample collected.
EVPA 1-Dec-09 LOX5 Total depth < 0.1 m. No sample collected. EVPA 2-Dec-09 LOX6 EB, Improper preservation PIN 8-Dec-09 S355A No flow, no sample collected. PIN 8-Dec-09 S355B No flow, no sample collected. PIE 14-Dec-09 BERMB3 No flow, no sample collected. PIN 15-Dec-09 S355A No flow, no sample collected. PIN 15-Dec-09 S355B No flow, no sample collected. PIN 22-Dec-09 S12B No flow, no sample collected. PIN 22-Dec-09 S12D No flow, no sample collected. PIN 22-Dec-09 S355A No flow, no sample collected
Quality Assessment Report for Water Quality Monitoring October ─ December 2009
3
Project Collection Date Station Comments
PIN 22-Dec-09 S335B No flow, no sample collected PIN 29-Dec-09 S355A No flow, no sample collected PIN 29-Dec-09 S335B No flow, no sample collected
FIELD QUALITY CONTROL
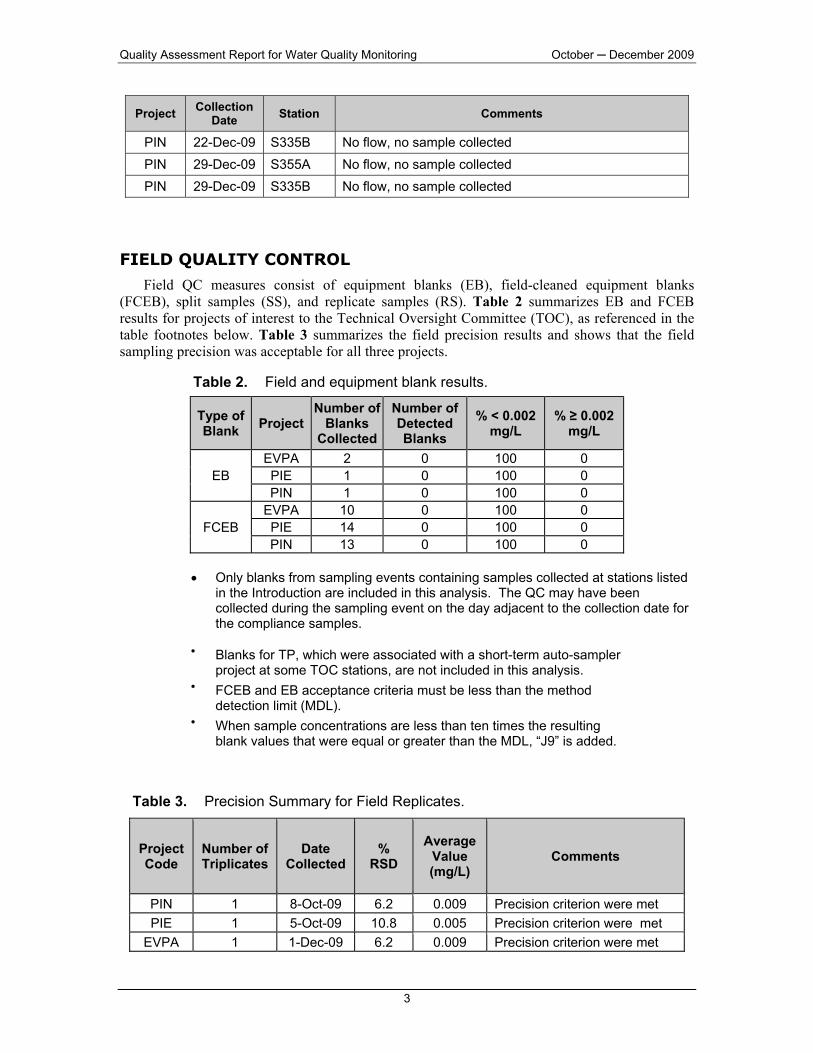
Field QC measures consist of equipment blanks (EB), field-cleaned equipment blanks (FCEB), split samples (SS), and replicate samples (RS). Table 2 summarizes EB and FCEB results for projects of interest to the Technical Oversight Committee (TOC), as referenced in the table footnotes below. Table 3 summarizes the field precision results and shows that the field sampling precision was acceptable for all three projects.
Table 2. Field and equipment blank results.
Type of Blank Project
Number of Blanks
Collected
Number of Detected Blanks
% < 0.002 mg/L
% ≥ 0.002 mg/L
EB EVPA 2 0 100 0 PIE 1 0 100 0 PIN 1 0 100 0
FCEB EVPA 10 0 100 0 PIE 14 0 100 0 PIN 13 0 100 0
• Only blanks from sampling events containing samples collected at stations listed
in the Introduction are included in this analysis. The QC may have been collected during the sampling event on the day adjacent to the collection date for the compliance samples.
• Blanks for TP, which were associated with a short-term auto-sampler project at some TOC stations, are not included in this analysis.
• FCEB and EB acceptance criteria must be less than the method detection limit (MDL).
• When sample concentrations are less than ten times the resulting blank values that were equal or greater than the MDL, “J9” is added.
Table 3. Precision Summary for Field Replicates.
Project Code
Number of Triplicates
Date Collected
% RSD
Average Value (mg/L)
Comments
PIN 1 8-Oct-09 6.2 0.009 Precision criterion were metPIE 1 5-Oct-09 10.8 0.005 Precision criterion were met
EVPA 1 1-Dec-09 6.2 0.009 Precision criterion were met
October – December 2009 Quality Assessment Report for Water Quality Monitoring
4
• Only replicates from sampling events containing samples collected at stations
listed in the Introduction are included in this analysis. The QC may have been collected during the sampling event on the day adjacent to the collection date for the compliance samples.
• The District’s chemistry laboratory conducted all TP analyses. • Field precision acceptance criterion must be ≤ 20%. The laboratory
applied this criterion only if sample values were greater than the practical quantitation limit (PQL), which is four times the MDL.
FIELD AUDIT
During the fourth quarter, no field audits were conducted related to the TOC water quality stations.
Quality Assessment Report for Water Quality Monitoring October ─ December 2009
5
LABORATORY ANALYSIS QUALITY ASSESSMENT
PROCEDURE UPDATES The TP analytical procedure did not change during this reporting period.
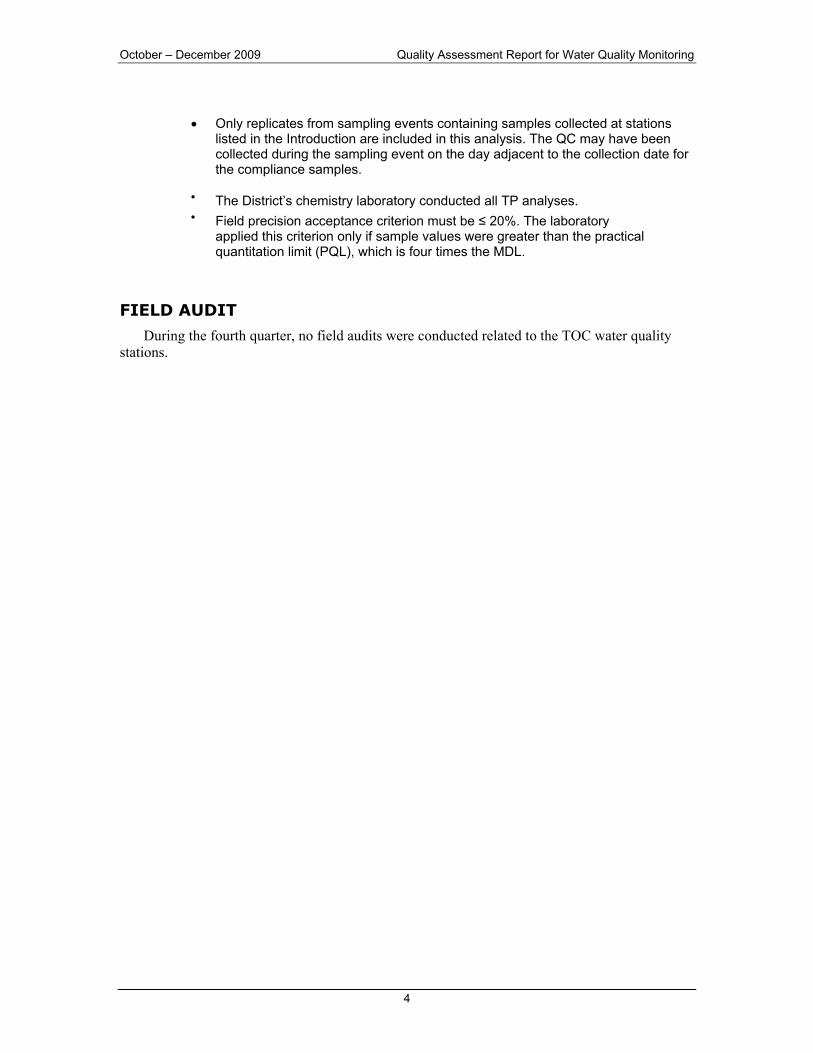
LABORATORY QUALITY CONTROL Routine laboratory QC samples include QC checks, matrix spikes, and precision checks. Figures 1 through 6 show the TP recoveries from various types and levels of QC samples at the District laboratory from October 1, 2009, through December 31, 2009
Figures 1a and 1b. QC (Laboratory Control Solution) Sample Recoveries and Histogram.
Figures 2a and 2b. QC (Laboratory Control Solution) Sample Recoveries and Histogram.
October – December 2009 Quality Assessment Report for Water Quality Monitoring
6
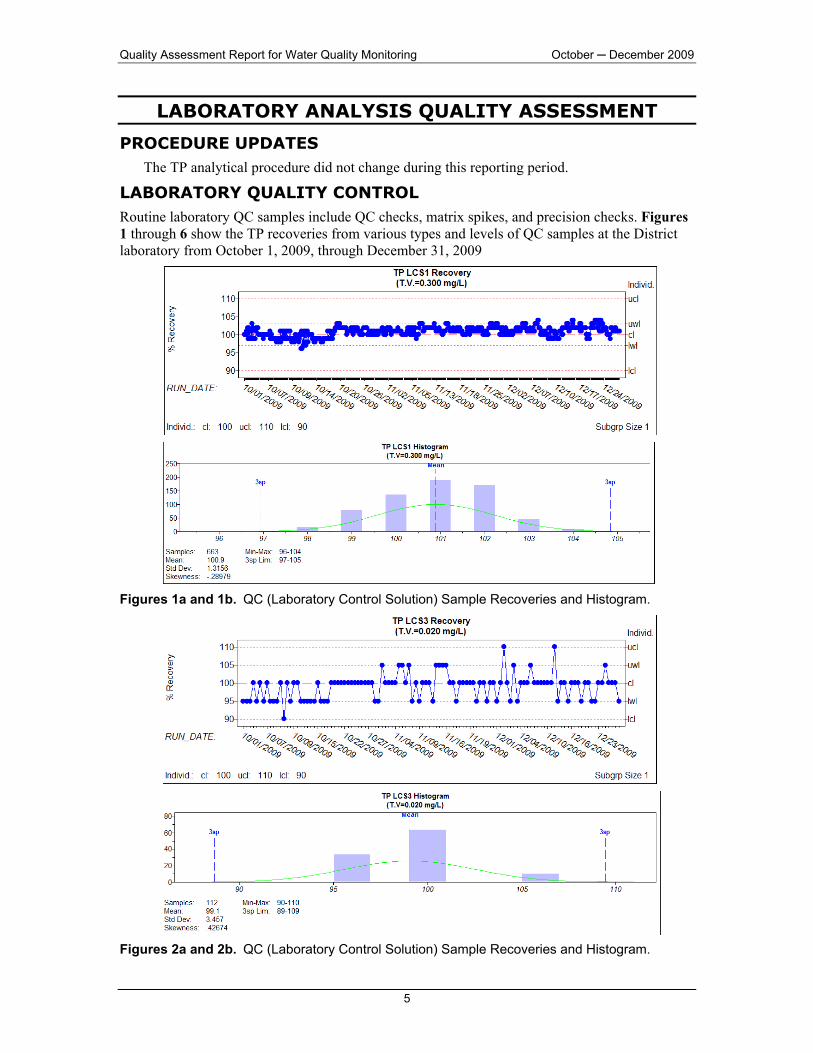
Figures 3a and 3b. QC (Continuing Calibration Verification Solution) Sample Recoveries and Histogram.
Figures 4a and 4b. QC5 (Method Detection Limit Check) Sample Recoveries and Histogram.
Quality Assessment Report for Water Quality Monitoring October ─ December 2009
7
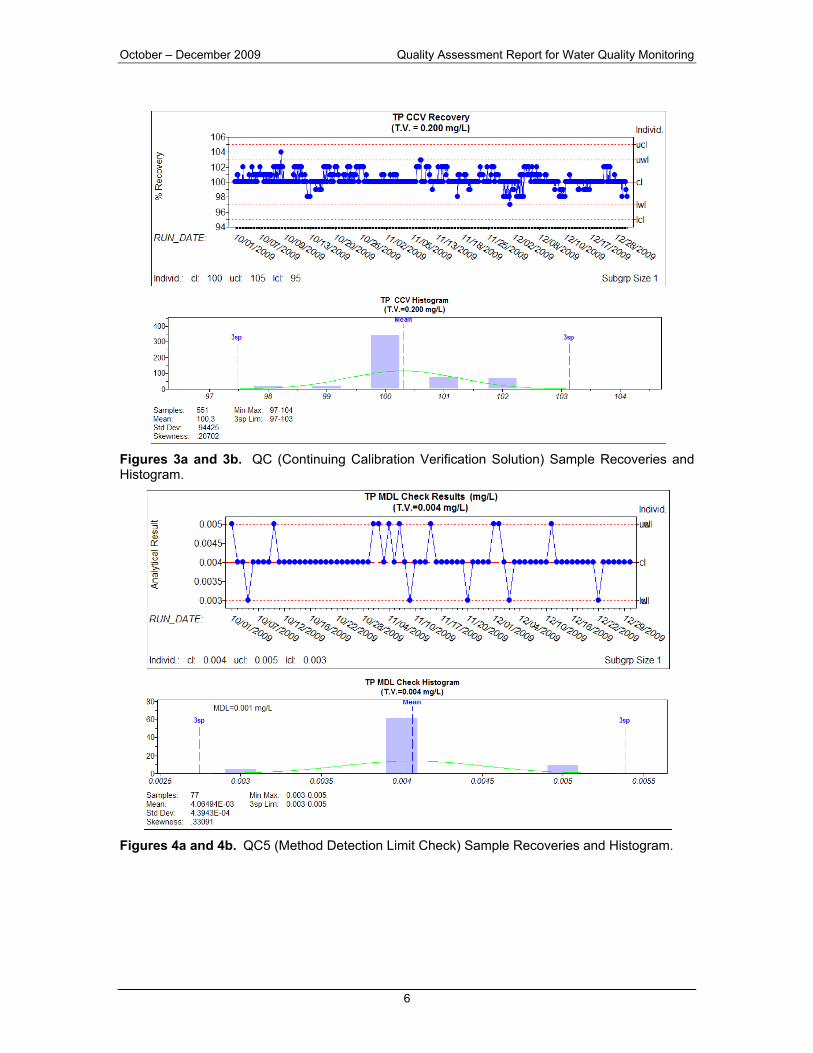
Figures 5a and 5b. TP Precision (%) Relative Percent Different and Histogram
Figures 6a and 6b. TP Spike Recovery (%) Data and Histogram
• ucl - Upper Control Limit
• uwl - Upper Warning Limit
• cl - Central Line
October – December 2009 Quality Assessment Report for Water Quality Monitoring
8
• lwl - Lower Warning Limit
• Lcl - Lower Control Limit
Figures 5 and 6 present the precision and matrix spike recoveries for TP analyses during the reporting period. If QC recoveries are outside the set limits, then the District’s laboratory usually rejects the analytical batch. If any deficiencies are noted, the samples have exceeded the required holding times, and the laboratory cannot re-analyze the data, then the sample is qualified accordingly.
Recoveries for the QC samples are within ±10 percent of the true value, which is acceptable. The daily Method Detection Limit (QC5) check with a true value of 0.004 mg/L indicates that the laboratory has consistently achieved the established MDL of 0.002 mg/L. An organic check is a solution prepared from phytic acid, which is a stable form of organic phosphate used to prepare matrix spikes, the mean recovery for which was 100.3 percent.
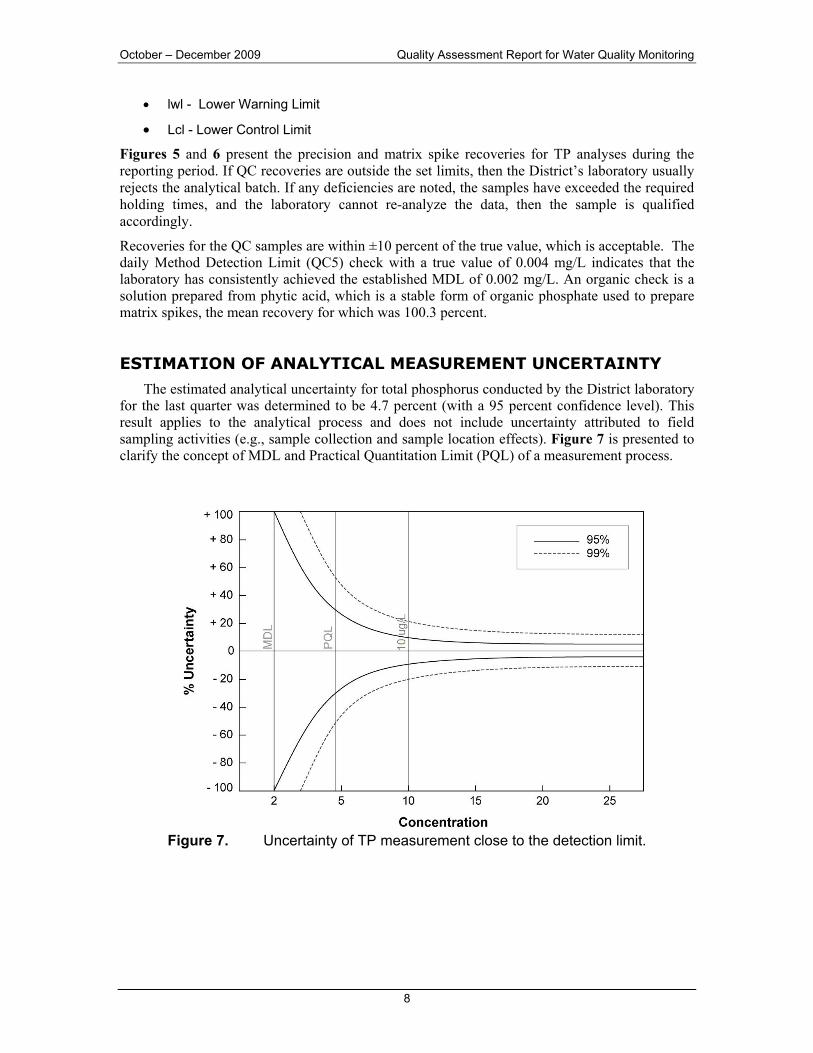
ESTIMATION OF ANALYTICAL MEASUREMENT UNCERTAINTY
The estimated analytical uncertainty for total phosphorus conducted by the District laboratory for the last quarter was determined to be 4.7 percent (with a 95 percent confidence level). This result applies to the analytical process and does not include uncertainty attributed to field sampling activities (e.g., sample collection and sample location effects). Figure 7 is presented to clarify the concept of MDL and Practical Quantitation Limit (PQL) of a measurement process.
Figure 7. Uncertainty of TP measurement close to the detection limit.
Quality Assessment Report for Water Quality Monitoring October – December 2009
9
METHOD DETECTION LIMIT (MDL) AND PRACTICAL QUANTITATION LIMIT (PQL)
MDL checks are routinely analyzed with each analytical run. From October 1 to December 31, 2009, 77 results for MDL checks were reported for total phosphorus measurements. The calculated MDL from these results was determined to be 1.0 µg/L, using the procedure described in 40 CFR 136 Appendix B and the calculated PQL for this period was 4.0 µg/L. At this concentration, the relative uncertainty in the measured value is estimated to be ±30 percent at the 95 percent confidence level3.
The reported values between the MDL (established) and PQL are assigned the “I” qualifier, indicating the uncertainty is sufficiently high that the reported values should be considered an estimate of the actual concentration.
3 Taylor, J.K. 1987. Quality Assurance of Chemical Measurements (1987) Lewis Publishers, Chelsea, MI.
October ─ December 2009 Quality Assessment Report for Water Quality Monitoring
10
INTER-LABORATORY QUALITY CONTROL ASSESSMENT
Split Studies with FDEP Laboratory
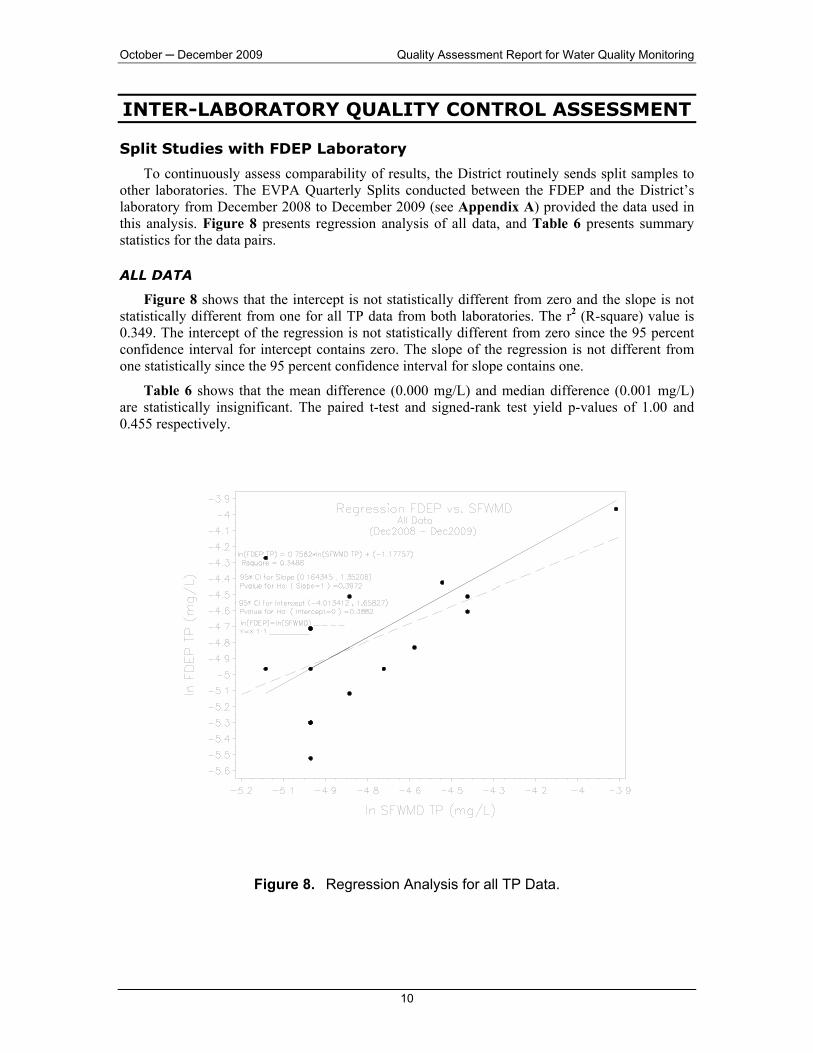
To continuously assess comparability of results, the District routinely sends split samples to other laboratories. The EVPA Quarterly Splits conducted between the FDEP and the District’s laboratory from December 2008 to December 2009 (see Appendix A) provided the data used in this analysis. Figure 8 presents regression analysis of all data, and Table 6 presents summary statistics for the data pairs.
ALL DATA
Figure 8 shows that the intercept is not statistically different from zero and the slope is not statistically different from one for all TP data from both laboratories. The r2 (R-square) value is 0.349. The intercept of the regression is not statistically different from zero since the 95 percent confidence interval for intercept contains zero. The slope of the regression is not different from one statistically since the 95 percent confidence interval for slope contains one.
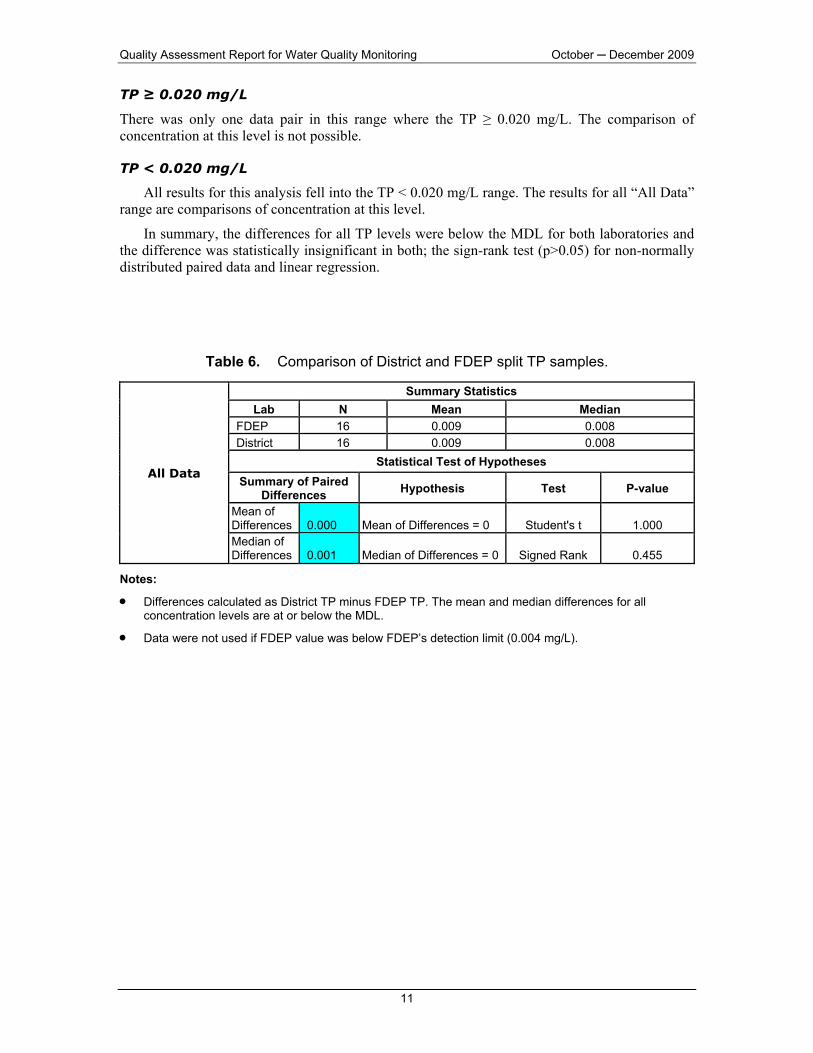
Table 6 shows that the mean difference (0.000 mg/L) and median difference (0.001 mg/L) are statistically insignificant. The paired t-test and signed-rank test yield p-values of 1.00 and 0.455 respectively.
Figure 8. Regression Analysis for all TP Data.
Quality Assessment Report for Water Quality Monitoring October ─ December 2009
11
TP ≥ 0.020 mg/L
There was only one data pair in this range where the TP ≥ 0.020 mg/L. The comparison of concentration at this level is not possible.
TP < 0.020 mg/L
All results for this analysis fell into the TP < 0.020 mg/L range. The results for all “All Data” range are comparisons of concentration at this level.
In summary, the differences for all TP levels were below the MDL for both laboratories and the difference was statistically insignificant in both; the sign-rank test (p>0.05) for non-normally distributed paired data and linear regression.
Table 6. Comparison of District and FDEP split TP samples.
All Data
Summary Statistics Lab N Mean Median
FDEP 16 0.009 0.008 District 16 0.009 0.008
Statistical Test of Hypotheses Summary of Paired
Differences Hypothesis Test P-value
Mean of Differences 0.000 Mean of Differences = 0 Student's t 1.000 Median of Differences 0.001 Median of Differences = 0 Signed Rank 0.455
Notes:
• Differences calculated as District TP minus FDEP TP. The mean and median differences for all concentration levels are at or below the MDL.
• Data were not used if FDEP value was below FDEP’s detection limit (0.004 mg/L).
October ─ December 2009 Quality Assessment Report for Water Quality Monitoring
12
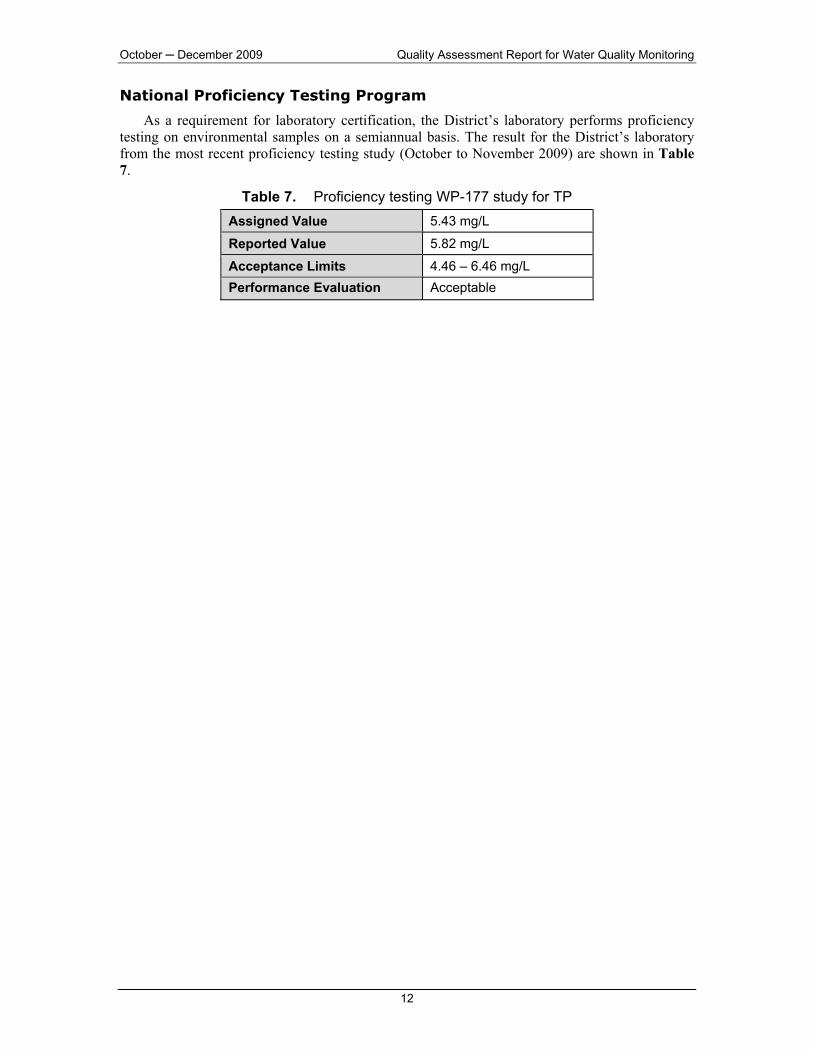
National Proficiency Testing Program
As a requirement for laboratory certification, the District’s laboratory performs proficiency testing on environmental samples on a semiannual basis. The result for the District’s laboratory from the most recent proficiency testing study (October to November 2009) are shown in Table 7.
Table 7. Proficiency testing WP-177 study for TP Assigned Value 5.43 mg/L
Reported Value 5.82 mg/L
Acceptance Limits 4.46 – 6.46 mg/L Performance Evaluation Acceptable

Quality Assessment Report for Water Quality Monitoring October ─ December 2009
13
GLOSSARY
Accuracy. The agreement between the actual obtained result and the expected result. QC-check samples, having known or “true” values, are used to test for the accuracy of a measurement system.
Equipment Blank (EB). A general term used for analyte-free water that is processed on-site through all sampling equipment used in routine sample processing. May be an assessment of effectiveness of laboratory decontamination or on-site (field) decontamination (FCEB).
Field Blank (FB). Analyte-free water that is poured directly into the sample container on site during routine collection, preserved, and kept open until sample collection is completed for the routine sample at that site. FB values are indicative of environmental contamination on site.
Field Cleaned Equipment Blank (FCEB). Analyte-free water that is processed on-site, after the first sampling site, through all sampling equipment used in routine sample processing. EB values are indicative of the effectiveness of the decontamination process.
Method Detection Limit (MDL). The smallest concentration of an analyte of interest that can be measured and reported with 99 percent confidence that the concentration is greater than zero. The MDLs are determined from the analysis of a sample in a given matrix, using accepted sampling and analytical preparation procedures, containing the analyte at a specified level. The MDL is determined by the protocol defined in section 40 CFR, Part 136, Appendix B, as established by the U.S. Environmental Protection Agency.
Practical Quantitation Limit (PQL). The smallest concentration of an analyte of interest that can be quantitatively reported with a specific degree of confidence. Generally, the PQL is 12 times the standard deviation that is derived from the procedure used to determine the MDL, or can be assumed to be four times the MDL.
Precision. The agreement or closeness between two or more results and is an indication that the measurement system is operating consistently and is a quantifiable indication of variations introduced by the analytical systems over a given time and field sampling period.
Relative Percent Difference (RPD). A measure of precision, used when comparing two values. It is calculated as %RPD = [Value1–Value2]/Mean*100.
Relative Standard Deviation (RSD). A measurement of precision, used when comparing more than two results. It is calculated as %RSD = [Std. Deviation/Mean]*100.
Replicate Sample (RS). A second sample collected from the same source as the routine sample, using the same sampling equipment. RS data are compared to routine sample to evaluate sampling precision.
Split Sample (SS). A second sample collected from the same sample obtained from the same sampling device. Results for SS are compared with routine sample results; agreement between these two results is mostly an indication of laboratory precision.
Z-Value. A measure of the deviation of the result (Xi) from the assigned value (X) for that determinant (calculated as z = (Xi–X)/σ, where σ is a standard deviation) (EURACHEM).
October ─ December 2009 Quality Assessment Report for Water Quality Monitoring
14
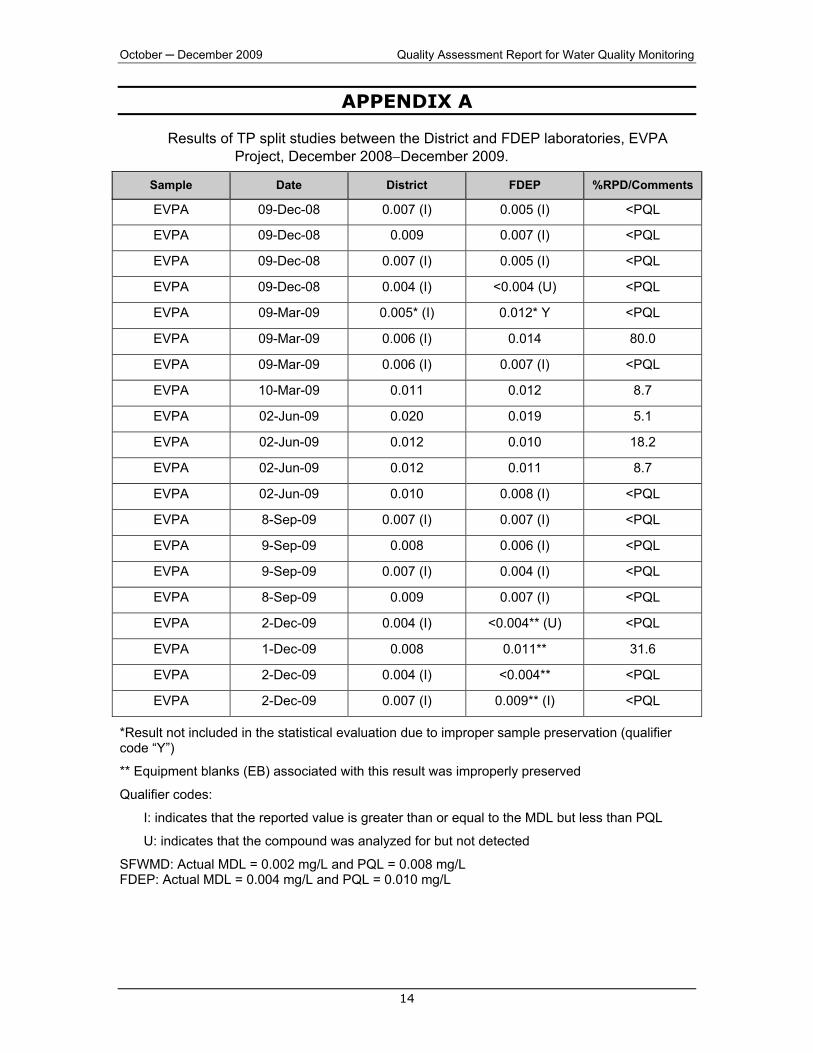
APPENDIX A
Results of TP split studies between the District and FDEP laboratories, EVPA Project, December 2008−December 2009.
Sample Date District FDEP %RPD/Comments
EVPA 09-Dec-08 0.007 (I) 0.005 (I) <PQL
EVPA 09-Dec-08 0.009 0.007 (I) <PQL
EVPA 09-Dec-08 0.007 (I) 0.005 (I) <PQL
EVPA 09-Dec-08 0.004 (I) <0.004 (U) <PQL
EVPA 09-Mar-09 0.005* (I) 0.012* Y <PQL
EVPA 09-Mar-09 0.006 (I) 0.014 80.0
EVPA 09-Mar-09 0.006 (I) 0.007 (I) <PQL
EVPA 10-Mar-09 0.011 0.012 8.7
EVPA 02-Jun-09 0.020 0.019 5.1
EVPA 02-Jun-09 0.012 0.010 18.2
EVPA 02-Jun-09 0.012 0.011 8.7
EVPA 02-Jun-09 0.010 0.008 (I) <PQL
EVPA 8-Sep-09 0.007 (I) 0.007 (I) <PQL
EVPA 9-Sep-09 0.008 0.006 (I) <PQL
EVPA 9-Sep-09 0.007 (I) 0.004 (I) <PQL
EVPA 8-Sep-09 0.009 0.007 (I) <PQL
EVPA 2-Dec-09 0.004 (I) <0.004** (U) <PQL
EVPA 1-Dec-09 0.008 0.011** 31.6
EVPA 2-Dec-09 0.004 (I) <0.004** <PQL
EVPA 2-Dec-09 0.007 (I) 0.009** (I) <PQL
*Result not included in the statistical evaluation due to improper sample preservation (qualifier code “Y”)
** Equipment blanks (EB) associated with this result was improperly preserved
Qualifier codes:
I: indicates that the reported value is greater than or equal to the MDL but less than PQL
U: indicates that the compound was analyzed for but not detected
SFWMD: Actual MDL = 0.002 mg/L and PQL = 0.008 mg/L FDEP: Actual MDL = 0.004 mg/L and PQL = 0.010 mg/L