quality assurance ptcoject plan page: 1 of 125 date: jan
TRANSCRIPT

QUALITY ASSURANCE PtcOJECT PLAN Page: 1 of 125 Date: Jan. 1987 Number: QA E415 Revision: 0
us EPA RECORDS CENTER REGION 5
513865
QUALITY ASSURANCE PROJECT PLAN FOR SAMPLING AND ANALYSIS - GROUNDWATER
AND GAG PLANT MONITORING
Prepared for The City of St. Louis Park St. Louis Park, MN 55416
ERT - A RESOURCE ENGINEERING COMPANY 696 Virginia Road, Concord, Massachusetts 01742
0053F PE-415

(
QUALITY ASSURANCE PROJECT PLAN Page: 2 of 125 Date: Jan. 1987 Number: QA E415 Revision: 0
TABLE OF CONTENTS
1.
2.
3.
4.
5.
6.
TITLE PAGE 1
TABLE OF CONTENTS 2
PROJECT DESCRIPTION 7
3.1 Background 7
3.2 Objectives 8
PROJECT:ORGANIZATION iUID RESPONSIBILITY 10
QUALITY ASSURANCE OBJECTIVES 13
SAMPLING PROCEDURES 15
6.1 Training 15
6.2 Document Control 15
6.3 Sample Control Procedures and Chain of Custody 25
6.3.1 Sample Identification 25
6.3.2 Chain-of-Custody Procedures 28
6.3.3 Field Forms 30
6.4 Sampling Procedures - GAC Plant 31
6.5 Groundwater Sampling and Water Level Measurements 33
6.5.1 Decontamination 33
6.5.2 Field Blanks 33
6.5.3 Sample Containers 34
6.5.4 Sample Collection - Monitoring Wells 36
6.5.5 Sample Collection - Piezometers 36
6.5.6 Sample Collection - Municipal Pumping Wells 36
6.6 Sample Preservation, Shipment and Storage 37
6.7 Field Measurement Equipment 37
6.8 Duplicate Samples 37
SAMPLE CUSTODY 39
7.1 Chain of Custody 39
7.2 Record Keeping 39
7.3 Final Evidence Files 47
0053F PE-415

QUALITY ASSURANCE PROJECT PLAN Page: 3 of 125 Date: Jan. 1987 Number: QA E415 Revision: 0
TABLE OF CONTENTS (Continued)
8. CALIBRATION PROCEDURES 50
8.1 Low Level (ppt) Analysis of PAH and Heterocycles 50
8.1.1 Daily GC/MS Performance Tests 50
8.1.2 Gas Chromatography/Mass Spectrometry
Analysis 55
. 'i8;V2 ^Extended Analyses Calibration 58.
8.2.1 Daily GC/MS Performance Tests 60
8.2.2 Gas Chromatography/Mass Spectrometry
Analysis 60
8.3 Calibration for Phenolics . 61
8.4 Calibration for Expanded Analyses 63
8.5 Non-criteria PAH Analysis Calibration 63
9. ANALYTICAL PROCEDURES 68
9.1 Low Level (ppt) Analysis of PAH and Heterocycles 68
9.1.1 Summary 68
9.1.2 Interf erences 6 8
9.1.3 Apparatus 68
9.1.4 Extraction 73
9.1.5 GC/MS Calibration 74
9.1.6 Daily GC/MS Performance Tests 75
9.1.7 Gas Chromatography/Mass Spectrometry Analysis 75
9.1.8 Calculations 78
9.2 Extended Analyses for Carcinogenic PAH in GAC Plant 81
9.3 Extended Analyses for Phenolics in GAC Plant 81
9.4 Expanded Analyses 81
9.5 Non-Criteria PAH Analyses 84
10. DATA REDUCTION, VALIDATION AND REPORTING 88
10.1 Data Reduction and Validation * 88
0053F PE-415

QUALITY ASSURANCE PROJECT PLAN Page: 4 of 125 Date: Jan. 1987 Number: QA E415 Revision: 0
TABLE OF CONTENTS (Continued)
10.2 Turnaround Time
10.3 Report Descriptions
10.3.1 Method Detection Limit Report
10.3.2 Sampling Report
; lO . 3^3 Analytical - Results Report
. 10.3 .<4 ^iSurrogate Recovery Report
10.3.5 Matrix Spike Recovery Report
10.3.6 Reporting Requirements for Samples
Exceeding Advisory Levels or Drinking
Water Criterion
11. INTERNAL QUALITY CONTROL CHECKS
11.1 Low Level PAH Analysis/Extended Analyses
Non-criteria PAH Analyses
11.1.1 Method Detection Limit
11.1.2 Method Blank and Solvent Blank
11.1.3 Surrogates
11.1.4 Matrix Spikes
11.1.5 Duplicates
11.2 Extended Analyses for Phenolics
11.3 Expanded Analyses
12. PERFORMANCE AND SYSTEM AUDITS
12.1 Interlaboratory Performance Surveys
12.2 Periodic In-House Audits
12.2.1 Performance Audits
12.2.2 Systems Audits
13. PREVENTIVE MAINTENANCE
13.1 Service Contracts
13.2 Instrument Logbooks
88
88
88
90
90
92
92
92
97
97
97
97
99
100
101
101
103
105
105
106
106
108
110
110
110
0053F PE-415

QUALITY ASSURANCE PROJECT PLAN Page: 5 of 125 Date: Jan. 1987 Number: QA E415 Revision: 0
TABLE OF CONTENTS (Continued)
14. SPECIFIC PROCEDURES TO ASSESS bATA PRECISION
ACCURACY AND COMPLETENESS 111
14.1 External and Internal Components 111
14.1.1 External Components: Accuracy and
Precision Measurements 111
:14.1-2iflntemal Components: Accuracy and
Precision Measurements 112
14.2 Control Charts 113
14.2.1 Accuracy 113
14.2.2 Precision 113
14.2.3 Limits 113
14.3 Suspicious/Out-of-Control Events 113
14.3.1 Outliers 114
14.3.2 Runs 114
14.3.3 Trends 114
14.3.4 Periodicity 114
14.4 Completeness 114
15. CORRECTIVE ACTION 115
15.1 Low Level PAH Analyses/Extended Analyses/
Non-criteria PAH Analyses 115
15.1.1 Surrogates 115
15.1.2 Matrix Spikes 117
15.2 Extended Analysis for Phenolics 117
15.2.1 Surrogates 117
15.2.2 Matrix Spikes 118
15.3 Expanded Analyses 118
15.3.1 Volatile Organics 118
15.3.2 Acid, Base/Neutral Extractable Organics 121
0053P PE-415

QUALITY ASSURANCE PROJECT PLAN Page: 6 of 125 Date: Jan. 1987 Number: QA E415 Revision: 0
TABLE OF CONTENTS (Continued)
15.3.3 Priority Pollutant Metals 122
15.3.4 Other Inorganic 122
15.4 Other Corrective Actions 123
15.4.1 Samples 123
15.4.2.Sample Extracts 123
.il5.4.3 JQuality Control Samples 123
15.4.4 Performance and System Audits 124
16. QUALITY ASSURANCE REPORTS TO MANAGEMENT 125
16.1 Performance and System Audits 125
APPENDIX A STANDARD OPERATING PROCEDURES
APPENDIX B ANALYTICAL METHODS
APPENDIX C HISTORY OF RESPONSE ACTIONS
0053F PE-415

QUALITY ASSURANCE PROJECT PLAN Page: 7 of 125 Date: Jan. 1987 Number: QA E415 Revision: 0
3. PROJECT DESCRIPTION
3.1 Background
Groundwater in the city of St. Louis Park, Minnesota has been contaminated by activities at a coal-tar distillation and wood preserving plant operated from 1917 to 1972. Numerous previous studies have identified polynuclear aromatic hydrocarbons (PAH) present in various aquifers beneath St. Louis Park and adjacent communities.
The United States Environmental Protection Agency (EPA), the Minnesota Pollution Control Authority (MPCA), the Minnesota Department of Health (MDH),^ the .City of St. Louis park -CRLP), and Me illy. Tar & Chemical Corporationi.yXiReHly) '.'.have agreed to acceptable^water quality criteria for PAH. yiThese :'.c.riterra, as..incorporated into the 'Consent .Decree, include the following concentration levels:
Advisory Level
Drinking Water Criteria
Sum of benzo(a) pyrene and dibenz(a,h) anthracene 3.0 ng/1*
Carcinogenic PAH IS ng/1
Other PAH 175 ng/1
5.6 ng/1
28 ng/1
280 ng/1
*or the lowest concentration that can be quantified, whichever is greater
In conjunction with the implementation of remedial measures to limit the spread of contaminants, a granular activated carbon (GAC) treatment system has been installed to treat water from St. Louis Park (SLP) wells 10 and 15. Further provisions of the Remedial Action Plan (RAP) call for long-term monitoring of the influent and effluent of the GAC treatment plant and the major aquifers underlying the region. The general objective of the monitoring program is to identify the distribution of PAH and/or phenolics in the ground water. The analytical data will be used to evaluate contamination by comparing the levels of PAH and/or phenolics found in the various samples with historical water quality data and with water quality criteria established in the consent Decree-RAP. The specific objectives of the sampling and analysis program, and therefore, the intended end use of the data vary slightly for the different aquifers being monitored in accordance with the Consent Decree-RAP.
0053F PE-415

QUALITY ASSURANCE PROJECT PLAN Page: 8 of 125 Date: Jan. 1987 Number: QA E415 Revision: 0
3.2 Objectives
The GAC plant monitoring is being done to assess and continuously evaluate the performance of the treatment system. Analytical results for influent and effluent samples will be compared to the drinking water criteria for PAH as established in the Consent Decree-RAP. Based on these comparisons, decisions will be made on: 1) possible modifications to the treatment system (e.g., adding another carbon column), 2) system operations (e.g., when the carbons should be replaced), and 3) cessation of the treatment system, if desired, when sufficiently low concentrations of PAH in influent sans>les are demonstrated.
. .•^ :The'iv?object.i^« of Tsamplihg the f our «xisting'VMt . Simon--Hinckley Aquif er rmunicipal^-drinkir^ -waterswells,, .and /sampling any .new Mt. Simpn-Hinckley Aquifer municipal drinking water wells installed within one mile of well W23, and analyzing for PAH is to assure the continued protection of these wells from PAH resulting from activities of Reilly at the site. The analytical data will be used to make comparisons between the levels of PAH found in the Mt. Simon-Hinckley Aquifer, and the drinking water criteria established in the Consent Decree-RAP.
The objective of sampling and ainalyzing the Ironton-Galesville Aquifer source control well (U105) is to assess the levels of PAH in the discharge from W105 when it is pumping a monthly average of 25 gallons per minute. The data will be used to compare the concentration of total PAH in the samples to a cessation criterion of 10 micrograms per liter of total PAH established in the Consent Decree-RAP. Also, if any new Ironton-Galesville Aquifer drinking water wells are installed within one mile of well W23, then those wells will be sampled and analyzed for PAH to meet the objective of assuring protection of the well from PAH resulting from the activities of Reilly at the site. The analytical data would be used to compare the levels of PAH found in potential Ironton-Galesville Aquifer drinking water wells to the drinking water criteria established in the Consent Decree-RAP.
The objectives of monitoring the many Prarie du Chien-Jordan Aquifer wells, including municipal drinking water wells, private or industrial wells, and monitoring wells are to: 1) monitor the distribution of PAH in the aquifer, thus evaluating the source and gradient control system, and 2) assure the continued protection of drinking-water wells from PAH resulting from the activities of Reilly at the site. The analytical data will be used to compare the levels of PAH in the Prarie du Chien-Jordan aquifer to historical PAH data and to various criteria established in the Consent Decree-RAP (e.g., drinking water criteria for drinking water wells, and a cessation criterion of 10 micrograms per liter of total PAH for source control well W23). Analytical data for samples of the discharge from gradient control well SLP4 will be compared to discharge limitations in and NPDES permit which will be applied for at the conclusion of a Feasibility Study to determine the appropriate disposition of SLP4 discharge. Water
0053F PE-415

QUALITY ASSURANCE PROJECT PLAN Pa^ge: 9 of 125 Date: Jan. 1987 Number: QA E415 Revision: 0
level data will be used to evaluate ground-water flow patterns in the Prarie du Chien-Jordan Aquifer.
The objective of monitoring St. Peter Aquifer wells is to determine the nature and extent of PAH in the St. Peter Aquifer resulting from the activities of Reilly at the site. The analytical data will be used to compare the levels of PAH in the St. Peter Aquifer to historical PAH data and to the drinking water criteria established in the Consent Decree-RAP. Water level data will be used to evaluate ground-water flow patterns in the St. Peter Aquifer.
The objectives of monitoring the Orift-Platteville Aquifer wells are to: (1) monitor the distribution of PAH and phenolics in the aquifer, thus evaluating the source andV gradient? :Control systems, Nend ((2?) to .further ;define the nature and ̂ extent -of PAH' and phenolics in the Northern Area of the Drift-Platteville 'Aquifer resulting form the activities of Reilly at the site. The analytical data will be used to compare levels of PAH and phenolics in the Drift-Platteville Aquifer with historical water quality data for the aquifer and with various criteria established in the Consent Decree-RAP for PAH and phenolics. Water level data will be used to evaluate ground-water flow patterns in the Drift-Platteville Aquifer.
This Site Management Plan outlines the scope of work to be performed in order to monitor the ground water in the St. Louis Park, MN area in accordance with the Consent Decree-RAP related to the Reilly Tar & Chemical Corp. N.P.L. site. Included in this plan are: (1) the identity of wells to be monitored, (2) the schedule for ground-water monitoring, and (3) a description of the procedures that will be used for sample collection, water level measurement, sample handling, sample analysis, and reporting.
The time period covered by the Initial Sampling Plan is from the date of its acceptance and approval by the agencies, to December 31, 1987. This is one year longer than the initial Plan is required to cover as stated in the RAP (Section 3). The reason for this change is that, according to the schedule in the RAP, a Sampling Plan for 1987 would be due before comments were received on the Initial Sampling Plan. Therefore, to avoid that situation, and to present a clear picture of ground-water monitoring activities through the first year of monitoring, this Plan covers sampling through the 1987 calendar year. The first subsequent Sampling Plan (RAF Section 3.3) will be submitted by October 31, 1987, covering the 1988 calendar year.
This Plan incorporates the requirements of RAP Sections 3.2, 3.3, 4.3, 5.1, 6.1.4, 7.3, 8.1.3, 9.1.3, 9.2.3, 9.3.3, and 9.6. Some of the sampling required under RAP Section 4.3 (Monitoring the GAC System) has already taken place prior to the Effective Date. Therefore, only the monitoring that will take place from the approval date of this Initial Sampling Plan through December 31, 1987 is included in this Plan.
0053F PE-415

QUALITY ASSURANCE PROJECT PLAN Page: 10 of 125 Date: Jan. 1987 Number: QA E415 Revision: 0
4. PROJECT ORGANIZATION AND RESPONSIBILITIES
This project is being conducted in accordance with the Consent Decree Remedial Action Plan for the Reilly Tar & Chemical Corporation N.P.L site in St. Louis Park, Minnesota. The parties to the Consent Decree include Reilly, the City of St. Louis Park, U.S. EPA, MPCA, and HDH. The project organization shown in Figure 4-1 indicates the involvement of the parties to the Consent Decree, as appropriate. The Laboratory Quality Control Coordinator is appointed by the Chemistry Division Quality Control Manager, who reports directly to the Division Director, with ancillary -responsibilities .to the Laboratory ..Manager and. the Corporate Quality !<Assurance..Manager. All rother functions in .the organizational structure '.report idirectly.through .'line management. -Responsibilities of :the key positions in the organization are described below:
• Project Manager: The Project Managers' responsibilities include scheduling of activities, project communication, and general overview of the program progress.
e Laboratory Manager: The Laboratory Manager is responsible for overall management of laboratory operations to meet project commitments, including scheduling of personnel and physical resources.
• Quality Assurance Officer: The Quality Assurance Officer is responsible for overall quality control oversight. His duties will include performance and system audits and supervision of activities of the Project QC Officer.
• Laboratory QC Coordinator: The Laboratory QC Coordinator is responsible for maintaining the laboratory Quality Control program. The Laboratory QC Coordinator maintains laboratory standards and traceability documentation and performs analytical data package validation. The Laboratory QC Coordinator reports directly to the Laboratory Manager, but also has indirect reporting responsibility to the Quality Assurance Manager.
• Field Coordinator: The Field Coordinator is responsible for the coordination and effective use of all personnel on site and for maintaining a record of field activities. The Field Coordinator trill also be responsible for field quality control including issuance and tracking of measurement and test equipment, the proper labeling, handling, storage, shipping, and chain of custody procedures used at the time of sampling, and control and archiving of all field documentation, (log books, notebooks, data sheets, etc.) generated during the'field investigation.
e Sampling Personnel: The Sampling Personnel responsibilities include collecting samples; conducting field measurements (e.g. water level); and maintaining proper decontamination procedures;
0053F PE-415

QUALITY ASSURANCE PROJECT PLAN Page: 11 of 125 Date: Jan. 1987 Number: QA E415 Revision: 0
Figure 4-1 Project Organ1rational Chart
0053F PE-415

QUALITY ASSURAHCE PROJECT PLAN Page: 12 of 125 Date: Jan. 1987 Number: QA E415 Revision: 0
all according to documented procedures stated in the Quality Assurance Project Plan and the corresponding' SOPs. Analyst: The Analyst is responsible for the analysis of water samples for the requested parameters utilizing the methods prescribed by this plan. Technician: The Technician -is responsible for sample extraction (according to documented procedures). This requires practical experience and knowledge in the techniques of liquid- liquid solvent extraction, Kudema Danish evaporation, and the quantitative preparation of sample extracts for analysis.
0053F PE-415

QUALITY ASSURANCE PROJECT PLAN Page: 13 of 125 Date: Jan. 1987 Number: QA E41S Revision: 0
5. QUALITY ASSURANCE OBJECTIVES
The principal objectives of this plan pertain to the collection of data that are sufficient to monitor the effectiveness of the GAC treatment system and to detect changes in groundwater quality. Therefore, the quality of the data gathered in this project can be defined in terms of the following elements:
e Completeness - a sufficient number of successful (valid) measurements to characterize the concentrations of PAH in the influent and effluent of the treatment system and in the aquifeirs
soi^f ;.int a period of. time. , .'J# ' . .Representativeness - .the extent tO'%rt»ich/reported analytical
results truly depict the PAH concentrations in the sampled environment. Representativeness is optimized through proper selection of sampling sites, times and procedures, through proper sample preservation, and through prompt extraction and analysis.
e Accuracy and Precision - Accurate and precise data will be achieved through the use of sampling and analytical procedures that minimize biases, through the use of standard procedures, through the meticulous calibration of analytical equipment and by implementing corrective action whenever measured accuracy and precision exceed pre-established limits. Accuracy and precision will be measured by the analysis of method spikes and duplicate samples.
e Sensitivity - determination of instrument sensitivity is . accomplished by calibration using multiple concentrations of the analytes of interest. Once instrument sensitivity is demonstrated, analysis of replicate spiked samples of deionized reagent rater at a concentration of 1-5 times the instrument sensitivity, is used to determine method sensitivity (i.e. method detection limit)
e Comparability - the extent to Which comparisons among separate measurements will yield valid conclusions. Comparability among measurements in the SLP monitoring program will be achieved through the use of rigorous standard sampling and analytical procedures.
e Traceability - the extent to Which results can be substantiated by hard-copy documentation. Traceability documentation exists in two forms: that Which links final numerical results to authoritative measurement standards, and that Which explicitly describes the history of each san^le from collection to analysis.
The fundamental mechanisms that will be employed to achieve these quality goals can be categorized as prevention, assessment and correction, as follows:
0053F PE-415

QUALITY ASSURANCE PROJECT PLAN Page: 14 of 125 Date: Jan. 1987 Number: QA E415 Revision: 0
1) Prevention of defects in the quality through planning and design, documented instructions and procedures, and careful selection and training of skilled, qualified personnel;
2) Quality assessment through' a program of regular audits and inspections to supplement continual informal review;
3) Permanent correction of conditions adverse to quality through a closed-loop corrective action system.
The ,St. .Louis Park sampling program Quality Assurance Project Plan has been .prepared an^ idirect .resp'onse ii.o these goals... "This plan: describes sthe quality v-assurance program'to ibe .iimplamented and the quality control procedures-to-be followed by ERT during the course of the site investigation studies for the St. Louis Park (SLP) site. The QA objectives will include field blanks, method blanks, field duplicates, surrogate spikes, and matrix spikes. Precision, accuracy and completeness criteria are established for each parameter of interest. The specific criteria for each analysis and parameter are set forth in detail in the following sections:
Sections Objective Frequency Discussinx Criteria Field Duplicates 10% 6.8, 11.1.5 Field Blanks 10% 6.5.2 Method Blanks 10% 11.1.2 Surrogate Spikes 100% of GC/MS 11.1.3, 15
analyses Matrix Spikes 5% 11.1.4, 15
0053F PE-415

QUALITY ASSURANCE PROJECT PLAN Page: 15 of 125 Date: Jan. 1987 Number: QA E415 Revision: 0
6. SAMPLING PROCEDURES
Samples will be collected by ERT and SLP personnel. The overall sampling program is summarized in Tables 6-1 and 6-2, and Figures 6-1 through 6-5. This section discusses general QAPP provisions relevant to sample collection, containerization, packaging and shipping activities.
6.1 Training
All..CRT and; Slf ipersonnel working on the -project will.obe properly Vtraiined., :qualxfied :.individuals. Prior to commencement of work, personnel will be given instruction specific to this project, covering the following areas:
Organization and lines of communication and authority Overview of the Site Management Plan and QA Project Plan, Documentation requirements. Decontamination requirements. Health and Safety considerations.
Training of field personnel will be provided by tha Field Coordinator or his/her qualified designee.
The analysts performing chemical analyses of samples will be trained in and will have exhibited proficiency in the analytical methods to be employed.
6.2 Document Control
Document Control for the Initial Sampling Plan serves a two-fold purpose. It is a formal system of activities that ensures that:
1) All participants in the project are promptly informed of revisions of the Quality Assurance Project Plan; and
2) All documents generated during the course of the program are accounted for during, and at the end of the project.
This QA Project Plan and all Standard Operating Procedure documents have the following information on each page:
0053F PE-415

i
QUALITY ASSURANCE PROJECT PLAN Page: 16 of 125 Date: Jan, 1987 Number: QA E415 Revision: 0
TABLE 6-1 INITIAL SAMPLING PLAN GAC PLANT MONITORING SCHEDULE W
RAP ScglioB
Sampling Points
Start of
43.1(C) -iTreated water(TRTD)
'^Date bfplan approval
433(C) Feed water(FEED)
Date of plan approval
43.4 Treated water
Date of plan approval
43.4 Treated or Feed water
Date of plan approval
Sampling FreqwcBCY
'Montbly
Quarterly
Annually
Annually
Analyses^)
PAH(ppt)<®)
PAH(ppt)
Extended PAH(ppt)
Add fraction compounds in EPA Test Method 625.
(a)
(b)
(c)
This schedule does not mdude certain contingendes (eg. exceedance monitoring) and, therefore, represents the minimum program that is likely to occur between the date this Plan is approved and December 31,1987. Sections 4 and 12 of the RAF outline the additional sampling that will be conduct^ if PAH criteria are exceeded. The first samples will be collected during the period indicated by the monitoring frequency following the date of the start of monitoring. The location of the GAC plant is shown in Rgure 6-1.
Usts of parameters and methods for analysis of PAH, extended PAH, and add fraction compounds in EPA Test Method 625 are prodded in the QAPP. Field blanks will be collected and analyzed at a frequency of one per day. Duplicate samples will be coDected and analyzed at a frequent of one per 10 samples.
ppt ° parts per trillion. This signifies analysis using selected ion monitoring gas chromatography mass spectrometry.

QUALITY ASSURANCE PROJECT PLAN Page: 19 of 125 Date: Jan. 1987 Number: QA E41S Revision: 0
TABLE 6-2 (continued)
(g) Or within 30 days of the approval date of this Plan, whichever is later.
(h) SLP4 analytical program will be determined by the results of the Feasibility Study.
(i) AHM B American Hardware Mutual, MGC » Minikahda Golf Course.
0) f > otheriwells on^these lists. They will be sampled^in conjunction with the monitoring performed in
accordance with the schedule shown, once they are available for sampling.
(k) If the six new Drift-Platteville Aquifer monitoring wells have not been installed by the appropriate time, then monitoring of the wells listed here will be done semi-atmually for the first year following the effective date. There will be other opportunities for concurrent sampling. If the six new Drift-Platteville Aquifer monitoring wells are available for concurrent sampling, then the following eight wells will be omitted from the first sampling round, due to the Regional Administrator and Director's request for the eight expanded analysts as shown for RAP Section 933: Wl, W2, W22, W116, W123, W128, W130, and PB140.
If any of the wells listed here become damagrd, destroyed, or otherwise unsuitable for sampling, ahemate wells will be selected fay the Project Leaders for monitoring.
(1) Sampling points are located on the maps shown in Figures 6-1 through 6-5. Letter prefixes to well codes are defined as follows:
W • 4-inch monitoring well
P - monitoring piezometer
PB - 2-inch monitoring well
SLP - St. Louis Park supply well
E - Edina supply well
H - Hopkins supply well
MTK - Minnetonka supply well
(m) Water level measuremenU will be made quarterly at these wells, except for those wells which prove to be inaccessible for such measurements.
(n) The sue St Peter Aquifer monitoring wells that will be monitored according to RAP.Section 8.1.3 will be selected by the Project Leaders based on the results of the first monitoring round.

QUALITY ASSURAHCB PROJECT PLAN Page: 17 of 125 Date: Jan. 1987 Number: QA E415 Revision: 0
TABLE 6-2 INITIAL SAMPUNG FLAN GROUNDWATER MONITORING SCHEDULE W
Source of Water
Mt. Simon-Hinckley Aquifer
Ironton-Galesville Aquifer
Prairie du Chien-Jordan Aquifer
SL Peter Aquifer
RAP Section
5.1
532
6.1.4
6.2.1
73(A)
73(B)
73(C)
73(D)(®)
73(E)(°)
73(F)
A13
Sampling^ Pointa
SLP11.SLP12, SLP13,SLP17
New municipal wells within
vonemileof weUW23
New municipal wells within one mile of weIlW23
SLF4
W23
SLP6,SLP7 orSLP9.W48
Start of Monitoring
Sampling Freouencv
Within six Annually mon^of Effective
At the time of installation
Start of pumping
At the time of installation
Start of pumping
Start of pumping
Date of plan approval
AHM or MGC^')' Date of plan E2,E13.H3. approval SLPlOorSLPlS, SLP14,SLP16,W4O20) W403,W119
SLP5,H6,E3, E15,MTK6. W29.W40, WTO, W401W
W112,W32, SLP8.SLP10, E4,E7
SLP3,W14, W24,W33. W122,W129 W133,P116, plus 5 new wells
SLP3plus six of the wells listed aboveW
Date of plan approval
Date of plan approval
Within 30 days of
new wells
Within 6 months of above
Annually
Quarterly
Annually
Quarterly
Quarterly
Quarterly
Annually
Quarterly
Once
Once
g(b)
PAH (ppt)W
PAH(ppt)
PAH(ppb)W
PAH(ppt)
PAH(ppt)<'') phenoUcs
PAH(ppb)
PAH(ppt)
PAH(ppt)
PAH (ppt)
No chemiod analyses
PAH (ppt)
PAH (ppt)

QUALITY ASSURANCE PROJECT PLAN Page: 18 of 125 Date: Jan. 1987 NunA>er: QA E41S Revision: 0
TABLE 6-2 (continued)
Source of Water
RAP Section
Sampling^) Points
Start of Monitoring Frequency AaahsEs^)
Drift-Platteville Aquifer
9.13 and 933
Source and gradient control wells (3 wells)
Start of pumping
Quarterly PAH (ppb) and total phenols
933 Wm,W136, plus 6 new wells
Within 30 days of well isstflllAtioiis
Once Expanded an^ysis
:933 W131,W136 • / phis 6 new
wells /months of above
'/'43nce ^SFAH(ppb) /'.and total phenols
9.6 Drift: W2,W5 Concurrent^^ Concurrent^'') PAH (ppb) W15,W11,W12, W16,W116, W117,W128, W135,W136, FB140; Platte^e: Wl. W19, W20, W22,W115, W120, W121, W123,W130 W131,W132, W143.pliis6 new wells
with 933 sunpling
with 933 sampling
and total phenols
(a)
(b)
(c)
(d)
(e)
(0
This schedule does not include certain contingencies (eg. exceedance monitoring) and, therefore, represents the minimum program that is likely to occur between the date this Plan is approved and December 31,1987. Section 12 of the RAP outlines the additional sampling that will be conducted if the drinking water criteria are exceeded in samples from water supply wells. The first samples will be collected during the period indicated by the monitoring frequency following the date of the start of monitoring. Field blanks will be collected at a frequency of one per day, and one duplicate sample will be collected for every 10 samples.
Lists of parameters and descriptions of the methods for analysis of PAH, phenolics, and expanded analyses are provided in the QAPP. Water levels will be measured each time samples are collected for analysis, except for those wells udiich prove to be inaccessible for such measurements.
ppt = parts per trillion. This signifies analysis uwg selected ion monitoring gas chromatography mass spectrometry.
ppb = parts per billion. This signifies analysis by EPA Method 625. If analytical results for individual wells are below 20 micrograms per liter (20 ppb) using this method, then the part per trillion method will be used on subsequent monitoring rounds.
Water levels m W38 will be measured each time W105 is sampled.
Water levels only (no monitoring) will be measured at these wells, except for those wells which prove to be inaccessible for such measurements.

QUALITY ASSURANCE PROJECT PLAN Page: 20 of 125 Date: Jan. 1987 Number: QA E415 Revision: 0
<rT ""v -y ^
KEY A-W«niocatkin
Figure 6-1 Location of Mt. Simon - Hinkley Monitoring Wells and St. Louis Park GAC Water-treatment Plant
Scale in Feel
0 1000 2000 3000
0053F PE-415

QUALITY ASSURAHCE PROJECT PLAN Page: 21 of 125 Date: Jan. 1987 Number: QA E415 Revision: 0
Figure 6-2 Location of Praire du Chien-Jordan Aquifer Wells
NON-RESPONSIVE

QUALITY ASSURAHCE PROJECT PLAN Pase: 22 of 125 Date: Jan. 1987 Number: QA E415 Revision: 0
Figure 6-3 Location of Source and Gradient Control Wells
0053F PE-415
EXEPTION 9-WELL

QUALITY ASSURANCE PROJECT PLAN Page: 23 of 125 Date: Jan. 1987 Number: QA E415 Reviaion: 0
EXPLANATION
• EXISTING DRIFT WELLS
• EXISTING PLATTEVILLE WELLS
® PROPOSED DRIFT AND PLATTEVILLE WELLS
—— NORTHERN AREA REMEDIAL INVESTIGATION
SCALE
0 500 1000
Figure 6-4 Location of Drift-PIatteville Monitaring Hells

QUALITY ASSURANCE PROJECT PLAN Pase: 24 of 125 Date: Jan. 1987 Number: QA E415 Revision: 0
AW33 LOCATION AND PROJECT WELL NUMBER
A OBSERVATION WELL COMPLETED IN ST. PETER AQUIFER
U OBSERVATION WELL COMPLETED IN BASAL ST. PETER CONFINING BED
(V) PROPOSED ST. PETER MONITORING WELLS
® WELL IN WHICH WATER LEVELS WERE MONITORED WITH A DIGITAL RECORDER DURING PART OF 1978-81
1 BEDROCK VALLEY/CONTACT WHERE UNCONSOLIDATED DRIFT DEPOSITS OVERLIE ST. PETER SANDSTONE
Figure 6-5 Location of St. Peter Monitoring Wells
NON-RESPONSIVE

QUALITY ASSURANCE PROJECT PLAN Page: 25 of 125 Date: Jan. 1987 Number: QA E415 Revision: 0
• Document Number ^ • Page Number • Total number of pages in document • Revision number • Revision date
When any of these documents are revised, the affected pages are reissued to all personnel listed as document holders with updated revision numbers and dates. Issuance of revisions is accompanied by explicit instructions as to t«hich documents or portions of documents have become obsolete.
Control of, and accounting for documents generated during the course of thev.proj«ct iS'^achieved 'by iassigjrinig: 'theii:TOspon5lbi-lity for document -issuance tend jarchi^ng. .Table 8-3 lists the key .documentation media :f or the project and-corresponding responsible parties for issuance, execution and archiving.
Table 6-4 is a list of ERT Standard Operating Procedures applicable to the field sampling and field analysis portion of the project. These Standard Operating Procedures are contained in Appendix A. Procedures stated in the Site Management Plan or this QAPP which are different from those in the appended SOPs shall supercede these SOPs.
6.3 Sample Control Procedures and Chain of Custody
In addition to proper sample collection, preservation, storage and handling, appropriate sample identification procedures and chain of custody are necessary to help insure the validity of the data.
6.3.1 Sample Identification
Sample labels shall be completed for each sample, using waterproof ink, unless prohibited by weather conditions. For example, a logbook notation would explain that a pencil was used to fill out the sample tag because a ballpoint pen muld not function in freezing weather. The information recorded on the sample label includes:
Sample Number - Unique coded sanq>le identification number as described below.
Time - A four-digit number indicating the military time of collection.
Sampler - Signature of person collecting the sample.
0053F PE-415

QUALITY ASSURANCE PROJECT PLAN Page: 26 of 125 Date: Jan. 1987 Number: QA E415 Revision: 0
Item
Field Notebooks
Field Equipment Calibration Forms
Sample Logs
.,Chain-.o£^Custody.. Forms
Sample Labels
TABLE 6-3 DOCUHENT CONTROL
Issued By
Field Coordinator
Field Coordinator
Field iZoordinator
Lab.'^Sample Custodian
Field Coordinator
Issued To
Sampling Team
Sampling Team
Sampling Team
Field Coordinator
Sampling Team
Archived Bv
Field Coordinator
Field Coordinator
Field .Coordinator
Lab Sample Custodian
Lab Sample Custodian
0053F PE-41S

QUALITY ASSURANCE PROJECT PLAN Page: 27 of 125 Date: Jan. 1987 Number: QA E415 Revision: 0
TABLE 6-4
ERT STANDARD OPERATING PROCEDURE LIST
Name Title
7320 Operation of Hydrolab
'>7510 : Patleagingj'and'Shipment, of Samples
0053F PE-415

QUALITY ASSURANCE PROJECT PLAN Page: 28 of 125 Date: Jan. 1987 Number: QA E415 Revision: 0
Remarks - Any pertinent observations or further sample description. The sample number includes three parts (source code, sampling point
code, and date code) in the following sequence:
XXX-YYYYY-ZZZZZZ
XXX = Source Code GAC Plant » GAC Mt. Simon-Hinckley Aquifer = MSH Ironton-Galesville Aquifer s IGV Prairie du Chien Jordan Aquifer = PCJ
. St. Peter Aquifer .= .STP ^J)rift-Flatteville .Aquifer = DPV
•>YYYYY =vSampling Point Code Well identification as abbreviated in Tables 6-1 and 6-2
ZZZZ s Date Code Month, day, year
After collection, identification, and preservation, the sample will be maintained under chain-of-custody procedures discussed below.
6.3.2 Chain-of-Custody Procedures
To maintain and document sample possession, chain-of-custody procedures will be followed. A sample is under custody if:
a It is in someone's possession, or • It is in someone's view, after being in their possession, or a It was in someone's possession and they locked it up to
prevent tampering, or a It is in a designated secure area.
TRANSFER OF CUSTODY AND SHIPMENT
1. Samples are accompanied by a Chain-of-Custody Record (Figure 6-6). When transferring the possession of samples, the Individuals relinquishing and receiving will sign, date, and note the time on the record. This record documents sample custody transfer from the sampler, often through another person, to the analyst at the laboratory.
2. Minimum information recorded on the chain-of-custody record in addition to the signatures and dates of all custodians will Include:
• Sampling site indentification
a Sampling date and time
0053F PE-415

QUALITY ASSURANCE PROJECT FLAN Page: 29 of 125 Date: Jan. 1987 Number: QA E415 Revision: 0
\0 I
vO
« 3 00
o
i u
i
I
I
i <£ I
\\
|1
I
fi
111
I
I
ii I I
Yi S
1
!
I I s 1 s
•i
& w
I %
in
e* Z
\A'-s liM illll IOT if

QUALITY ASSUBAMCE PROJECT PLAN Page: 30 of 125 Date: Jan. 1987 Number: QA E415 Revision: 0
• Chain-of-custody tape number
e Identification of sample collector
e Sample identification
e Sample description (type and quantity)
a Analyses to be performed.
3. Samples will be packaged properly for shipment and dispatched to the appropriate laboratory for analysis, with a separate custody !;reca«Hlt;acoo!n!panying each^^hipment. ;'aiipping ̂ containers ̂ U
1 .^sealed 'K£or shipment to the .laboratory. . .oBef ore -sealing aach ' container, select two pieces of chain-of-custody tape and enter their numbers on the chain-of-custody form (in your "relinquished by" signature box). The method of shipment, cou'rier name(s) and other pertinent information are entered in. the "Remarks" box. Then tear off the last copy of the form and place the original and remaining copies in the container. After the container is sealed, place the chain-of-custody tape over the seal on opposite comers of the container.
4. Vlhenever samples are split with another laboratory, it is noted in the "Remarks" section. The note indicates with whom the samples are being split and is signed by both the sampler and recipient. If either party refuses a split sample, this will be noted and signed by both parties. The person relinquishing the samples to the facility or agency should request the signature of a representative of the appropriate party, acknowledging receipt of the samples. If a representative is unavailable or refuses to sign, this is noted in the "Remarks" space. When appropriate, as in the case where the representative is unavailable, the custody record should contain a statement that the samples were delivered to the designated location at the designated time.
6.3.3 Field Forms
In addition to sample labels and chain-of-custody forms, a bound field notebook will be maintained by the sample team leader to provide a daily record of significant events. All entries will be signed and dated. All inend}ers of the of the sampling team will use this notebook. The notebook will be kept as a permanent record.
0053F PE-415

QUALITY ASSURANCE PROJECT PLAN Page: 31 of 125 Date: Jan. 1987 Number: QA E41S Revision: 0
6.4 Sampling Procedures - GAC Plant
Chain-of-custody forms will be completed and all samples shipped to ERT's laboratory by overnight delivery on the same day they are collected.
Sampling points will be flushed for at least five minutes before collecting a sample. Each PAH sample will be collected in four one liter amber glass bottles, which should be filled and capped in succession. PAH sample bottles will not be rinsed before being filled. The lids of all sample bottles trill be taped using plastic adhesive tape after they are capped.
The GAC treated trater samples will have to be collected from two sample taps — one for each column (see Figure 6-7J. This will be done by filling *.wo one-:liter rbotties from :the Xlrst column isample tap end then two more ^bottles 'froTO ithe iisecofid (tour: from each for duplicate samples) . No notations distinguishing the two taps will be made on the labels. All four PAH bottles will be extracted and the extracts composited for analysis.
Field blank samples will be prepared by transferring contaminant-free deionized water provided by ERT into sample bottles in a fashion as closely similar to actual sample collection as possible. Field blank sample bottles will be filled, capped and taped in succession with individual bottles open to the atmosphere for an equal time as for actual process samples. Field blanks will be prepared in the area in tfhich GAC treated. «rater samples are collected.
Duplicate samples will be obtained by filling eight 1-liter bottles at the sampling point by the procedure described above, splitting these into two groups of four bottles, and assigning a different sample number to each of the resulting four-bottle samples. All samples will be packed, cooled to a temperature less than 4"C, and shipped on the day they are collected. All sample handling, packaging and shipping will follow ERT's Standard Operating Procedure No. 7510 (Appendix A).
The sampling team must recognize that great care is required to collect samples for part-per-trillion-level PAH analysis that are free from outside contamination. PAH compounds are present in cigarette smoke, engine exhaust and many petroleum derived oils, among other sources. There will be no smoking anywhere in the GAC treatment building on a day on Which PAH samples are to be collected until the samples have been collected, sealed and packaged for shipment. Similarly, no vehicles will enter the GAC treatment building and the large access door will stay closed on sampling days. Disposable gloves will be worn when collecting, handling and packaging samples. Sample bottles will remain in closed shipping coolers until they are needed, and will be packaged and sealed for shipment as soon as possible after sampling.
0053F PE-415

QUALITY ASSURANCE PROJECT PLAN Page: 32 of 125 Date: Jan. 1987 Number: QA E415 Revision: 0
Existing Treatment BIdg.
Sampling Points for Wellhead Water
Well 10 Pump House
Overflow to Storm Sewer
GAC Treatment BIdg.
Sampling Point for
Feed Water
Sampling Points
Figure 6-7 Sampling Locations
0053F PE-415

QUALITY ASSURANCE PROJECT PLAN Page: 33 of 125 Date: Jan. 1987 Number: QA E415 Revision: 0
6.5 Ground-water Sampling and Water Level Measurements ^
Ground water samples will be collected and water level measured in accordance with the procedures outlined in the Site Management Plan and this Quality Assurance Project Plan. The wells involved in the monitoring program include municipal and commercial wells, piezometers and groundwater monitoring wells (see Table 6-2). Sampling procedures to accomn^odate the dimensions and configuration of each type of well are described below. Further details on well dimensions, trater level measurements and sample acquisition strategies are given in the Site Management Plan.
The importance of proper sampling of wells cannot be over-emphasized. Even though the well being sampled may be correctly located and constructed, special txrecautions: must be taken to ensure ithat the sample taken from that 4well is representative of'the -that location, and that the sample is neither altered'nor contaminated by the sampling and handling procedure. Sample collection will always proceed from the less contaminated sampling points to the monitoring wells containing progressively higher concentrations of PAH or phenolics.
6.5.1 Decontamination
The decontamination procedure to be used on sampling equipment Which comes into contact with the ground%irater is as follows:
e scrub with soap and water, e rinse with deionized water, e rinse with acetone, e rinse with hexane, • rinse with acetone, e rinse with deionized water, and a air dry for 15 minutes.
6.5.2 Field Blanks
Field blank samples will be prepared by transferring contaminant-free deionized «rater, provided by ERT, into sample bottles in a fashion as closely similar to actual sample collection as possible. This will involve collecting samples through any non-dedicated sanple equipment that is decontaminated between samples. Field blank sample bottles will be filled, capped and taped in succession with individual bottles open to the atmosphere for an equal time as for actual process saiiq>les. Field blanks will be prepared in the area tfhere samples are being collected at a rate of one per day or tdiere more than ten samples are collected in a day at a rate of one field blank per ten samples.
0053F PE-415

QUALITY ASSURANCE PROJECT PLAN Page: 34 of 125 Date: Jan. 1987 Number: QA E415 Revision: 0
6.5.3 Sample Containers (See Table 6-5)
For PAH and Phenolics, 1 liter amber glass bottles will be used. Caps will be fitted with pre-cleaned Teflon liners. Four bottles are required for each PAH sample collected. One bottle is required for phenolics.
Bottles will be prepared as follows:
1. Wash bottles with hot detergent water.
2. Rinse thoroughly with tap water followed by three or more rinses with organic-free water.
•3., ".^Rinse-*ribh Burdick .& -iJackson quality ̂ redistilled acetone, • :'rfoMo«red .by <equivalent quality, methylene chloride.
4. Allow to air dry in a contaminant free area.
5. Caps and liners must be washed and rinsed also.
Bottles should be stored and shipped with the Teflon-lined caps securely fastened.
For parameters on the expanded list for the Northern Area of the Drift and Platteville Aquifer, 1-liter amber glass bottles will again be used for the acid and base/neutral extractable organics. Each volatile organics sample will be collected in two forty-milliliter VOA vials. The vials will be prepared in the laboratory before sampling by baking at 110*C for approximately 15 minutes. Samples for metals and ions will be collected in 1-liter polyethylene cubitainers.
0053F PE-415

o o V/l w •>« •0
in Parameter
Water: PAH (PPT)
PAH (PPB)
i'henolica
Acid, Base/Heutral BxLractables
Volatile Organlcs
Metale
S0^ and CI
Hereurjr
Cyanide
Total phenols
mj
Na
(jontalners
TABLE 6-S
SAMPLE CONTAIHERS, PRE5ERVATI0M PROCEDURES, AND
MAXIMUM HOLDIHG TIMES
Preservation^
Four 1-llter amber glass bottles. Teflon-lined caps
TWO 1-llter amber glass bottles. Teflon-lined caps
one 1-llter amber glass bottle.
Two 1-llter amber glass bottles. Teflon-lined cap
Three 40-ml VOA vials. Teflon septum
Two 1-llter cubltalners
One 1-llter cubltalner
One 1-llter cubltalner
One 1-liter cubltalner
One 1-llter aiid>er glass bottle
One 1-llter cubltalner
One 1-llter cubltalner
cool, 4*C: protect from light
cool, 4*C, protect from light
cool, 4*C
cool, 4*C (0.008X Na2S203, If residual CI Is present)
cool, 4-C
HN03 to pH <2
cool, 4*C
HHO3 to pH <2
cool. 4*C: NaOH to pH >12
cool, 4>C; H2SO4 to pH <2
cool, 4*C; H2SO4 to pH <2
HNO3 to pH <2
Maximum Hoidihg Time
7 days (until extraction), 40 days after extraction
7 days (until extraction), 40 days after extraction
7 days (until extraction), 40 days after extraction
7 days (until extraction), 40 days after extraction
14 days
6 months
28 days
28 days
14 days
28 days
28 days
6 months
Ref: Federal Register Guldellnes/Vol.49, Ro.209/Frlday, October 26, 1984/p. 43260.
^ Sample preaervatlon will be performed Immediately upon sample collection.
^ Sauries will be analyzed as soon as possible after collection. The times listed are the maximum times that samples may be held before analysis and still be considered valid.
I M
5
n 3
Sf n (0 e* <1 O •• 3
" -0 >
° PJ
m
O *0 » » rr OS (D (9
U W g tn
O H «» <0 CO H ^ M
W

QUALITY ASSURANCE PROJECT PLAN Page: 36 of 125 Date: Jan. 1987 Number: QA E415 Revision: 0
6.5.4 Sample Collection > Monitoring Wells - ^
Monitoring wells having a riser pipe inside diameter of 2 inches or greater will be purged and sampled using a stainless steel submersible pump with teflon seals and fittings. The pump discharge will be brought to the surface using a tygon tube. One tube will be dedicated to each well.
The submersible pump will be decontaminated before use and between sampling points as described in Section' 6.5.1.
During the purging of each well, temperature, pH and specific conductance of the purge water will be monitored using a Hydrolab water quality monitor (or equivalent). Readings will be taken once per well volume. Stabilization of these readings will indicate that purging is ,coiiq>Xete .and .sampling may commence. All ..pump, discharge not containerized as :aaiiq>les.<w:ill ia>esidisiposed of' as ;<outiined >in .the..>Site .Management -Plan.
v:>Sample5. are COliected by,-filling eachJbf: the^eppropriate^raample containers in rapid succession, without prerinsing the containers with sample. The bottle is held under under the sample stream without allowing the mouth of the bottle to come in contact with tubing, pipes, etc and filled completely, and the cap securely tightened. Amber glass bottles and VGA vials are checked for air and if air is visible, the cap removed and more sample added. All sample labels will be checked for completeness, sample custody forms completed and a description of the sampling event recorded in the field notebook.
6.5.5 Sample Collection - Piezometers
Piezometers, having a riser pipe inside-diameter of less than 4 inches, will be purged and sampled with a peristaltic pump and Tygon tubing. Pump decontamination will not be required, as the water to be sampled will never come in contact with the pump. Well purging and purge water monitoring for stabilization of temperature, pH and specific conductance will be performed as described in 6.4.4. Sample collection and containerization will also be as described in 6.4.4.
6.5.6 Sample Collection - Pumping Wells
Samples will be collected from municipal and private pumping wells in accordance with the procedures given in the Site Management Plan. Municipal well samples will be acquired from a 8anq>ling point as close to the well head as possible. The sampling port will be purged for at least five minutes before a sample is collected. Procedures for sample containerization will be as described in 6.4.4.
0053F PE-415

QUALITY ASSURANCE PROJECT PLAN Page: 37 of 125 Date: Jan. 1987 Number: QA E415 Revision: 0
6.6 Sample Preservation, Shipment and Storage '
The samples will be iced or refrigerated at 4*C from the time of collection until extraction. PAH's are known to be light sensitive; therefore, samples will be stored in amber bottles and kept away from prolonged exposure to light. All si^mples will be extracted within seven days of collection, and analysis completed within forty days following extraction.
Samples will be protected from breakage and shipped in coolers at a temperature of A'C or less. An overnight carrier will be selected to insure delivery at the laboratory within 24-36 hours after collection.
Samples received at the laboratory will be checked for leakage and a rmotation.made. regarding sample temperature et -time nf receipt.. .All eamples should .be .stored in an organic-tree: refrigerator et 4*.C. Storage refrigerators-%riil be ikept locked to prevent unauthorized entry, and to satisfy chain-of-custody requirements.
6.7 Field Measurement Equipment
All field measurement equipment will be controlled to ensure that measurements obtained are accurate and defensible. Table 6-6 summarizes the parameters to be monitored, the instruments to be used fpr each measurement, procedures including calibration and frequency, and quality control criteria.
In addition, these measurement devices will be issued through a formal equipment tracking system and operated by trained personnel, in accordance with the appropriate SOPs.
6.8 Duplicate Samples
Duplicate samples will be collected by alternately filling sample bottles from the source being sampled. For four liter sample collection one bottle will be filled for the sanq>le, then one bottle for the duplicate, then a second bottle for the sample and then a second bottle for the duplicate, etc. Duplicates will be taken for each analysis type and each sample type, at a rate of one duplicate sample being collected for each ten samples, with a minimum of one duplicate for any sample batch. There are two sample types for this program: GAG Plant treated water and groundwater. For purposes of fulfilling the 10% duplicate requirement, all the sampling points shotm on Table 6-2 are the same sample type.
0053F PE-415

TABLE 6-6
FIELD MEASUREMENT EQUIPMENT QUALITY CONTROL
Routine Check Device
pH Meter
(Hydrolab)
Calibration
Standardize in three or
more standard buffer
solutions
Conductivity Meter Standardize usinE two
(Hydrolab) or siore KCL solutions
Method Frequency
Calibration check-analyze aHer every
standard buffer solution sample
Analyze duplicates
Calibration check-analyze
standard KCL solution
after every
saiiipie
i/ib Samples
Control Limits
i:0.1 pH units
±0.1 pH units
4-10% full scale
I M C
o n
n a
Analyze duplicates 1/ib Samples ±10% full scale
99 SB O >0 (D C 0) «) < 3 r^- 0» H- o* » © W (0 •• ••
ft o •• .. B, OB
W H SI <0
I-* 00 H Ui ISJ
Ui

QUALITY ASSURANCE PROJECT PLAN Page: 39 of 125 Date: Jan. 1987 Number: QA E415 Revision: 0
7. SAMPLE CUSTODY
The ERT Analytical Laboratory operates under a formal quality control program. The Chain-of-Custody contains three major elements; the field sampling, the laboratory analysis and the final evidence file. Section 6.3 discusses the field sampling aspects. This section covers quality related activities applicable to the St. Louis Park Groundwater Study from the receipt of samples at the laboratory through the issuance of validated analytical data and the storage of data in the final evidence file.
7.1 Chain-of-Custody
. Alhen^^samples are'3X«ceived'into ̂ -the laborabory the> ̂ Sample Custodian will -veriTy; their as they,.are unpacked and, will explicitiy .state .in the log-in records whether the chain-of-custody seal is intact, whether the sample is received intact or broken, and whether the sample is appropriately identified. If the integrity requirements are met, or when any discrepancies are resolved, ERT assigns the sample a laboratory control number, stores the sample in a refrigerator and enters the pertinent information into the sample log. Once the samples are in the laboratory, a sample usage log is maintained on the LIHS computer to track the transport and use of each sample within the laboratory.
The laboratory will retain a copy of each chain-of-custody record, with the shipper's traybill or air bill attached. After sample log-in, a second copy of the chain-of-custody record will be sent to the Field Coordinator, indicating sample receipt and associated ERT laboratory number. The laboratory will use a Sample Usage Log Sheet (Figure 7-1) to track sample usage through preparation and analysis stages. Spaces are provided to document the initial sample size stored, who, when, for »/hat purpose, and how much of a sample was removed and when and who returned the remainder to its assigned storage location. After disposition, the final copy of the chain-of-custody will be sent documenting the disposition method and date.
7.2 Recordkeep ing
In addition to sample chain-of-custody, the laboratory will maintain the necessary documentation to reconstruct the entire process of sample preparation through analysis and report generation. This documentation is found in logbooks, data packages and stored on tape.
The logbooks and information they contain are listed below.
a Chemical Inventory Log - ERT Chemical Inventory control number, compound/reagent name, manufacturer, lot number, grade, date received, expiration date and disposition date.
0053F PE-415

QUALITY ASSURANCE PROJECT PLAN Page: 40 of 125 Date: Jan. 1987 Number: QA E415 Revision: 0
Figure 7-1 Sample Usage Log Sheet
ERT SAMPLE USAGE LOG Nil
O.iio.
By.
/I
ERT Lab No.: . Storagn Lnennnn'
Cliant:
Pro|aei No.:
Satnola Matrix: _ Haz.
Samola Tyni. Wasia Trace
Samola Contamar:
Analvsas--
Sampia Removaa • Roturr
Data lima By (g or ml) Purpoae (Date.)
1 1 1 1 1 1 1 1 1 . 1 1 1 1
1 !
i 1 1 1 1 !
1 ,
1 Mt/«^

QUALITY ASSURANCE PROJECT PLAN Page: 41 of 125 Date: Jan. 1987 Number: QA E415 Revision: 0
a Reference Standard Inventory Log - ERT Reference Standard Inventory control number, compound name, manufacturer, lot number, concentration, solvent, date received, expiration and disposition date.
a Super Stock Preparation Log - ERT Super Stock Standard number; neat compound and solvent.or carrier name and their pertinent data such as lot number, manufacturer, percent activity, expiration date <if any), weights and volumes taken and balance used; final stock standard concentration, expiration date of standard, storage requirements and location, preparation date and time, preparer's initials, approval signature and date.
• Mixed and/or Dilution Standards Log - ERT Mixed Standard number; . -.^."pertinent.' information' of; Supercstock .Standards ;used . such as
. "»3.tattdard.mund>ers, concentration, ̂preparation date, volume.: taken, volume.'diluted to and solvent used (including lot number, manufacturer); mixed and/or dilution standards preparer's initials, date, final concentration of each component, storage, location, approval signature (of supervisor) and date disposed.
a Instrument Maintenance Log - initialed and dated entries pertaining to instrument set-up, routine preventative maintenance, and instrumental malfunction and resolutions.
e Instrument Sample Sequence Log - initialed and dated listing of standards and samples analyzed.
• Instrument Tuning Log - initialed and dated mass intensity listings of daily 6C/MS DFTPP tunes.
The data package contains only data pertinent to the individual project. This package is filed alphabetically by project and date and includes the following records:
Data Approval Form - a form which lists the contents of the Data Package and routes the data review process (Figure 7-2). Out-of-Control Event Form - a form t/hich describes any out-of-control events which may affect the quality of data to be reported and explains the causes and corrective actions taken (Figure 7-3). Sample Receipt Checklist - a checklist describing sample integrity upon receipt into the laboratory (Figure 7-4). Initial Page - a sheet %d\ich Lists the signatures and initials of all personnel involved in the preparation and review of the Data Package (Figure 7-5). Daily Log Sheet - a log containing daily entries or comments pertaining to any part of sample preparation and/or analysis. Which are not described on- the other forms such as instrument fluctuations and tuning or where the sample analysis sequence can be found, etc. (Figure 7-6)
0053F PE-415

QUALITY ASSURANCE PROJECT PLAN Page: 42 of 125 Date: Jan. 1987 Number: QA E415 Revision: 0
Figure 7-2 Data Approval Form
Eia fio.
QUALITY ASSURANCE FORM
SUBJECT: DATA APPROVAL
aiENT: PROJECT NO:
iAIWLYSIS • PARAMETER (5):
PLEASE REVIEW AND APPROVE/OISAPOROVE THE ATTAC-iEO DATA SHEE'lS', ANO/CR NC-EECCCi' AND ROUTE THROUGH THE PERSONNEL LISTED BELOW. IF YOU DISAPOPCVE OF ANV'HING ".EASE RETURN THIS PACKAGE TO THE I.MITIATCR. THE CORRECTIONS WILL BE MACE ANC -HE Apss.Ovi. PROCESS WILL BEGIN AGAIN.
WauOED IN THIS DATA PACKAGE (PLEASE LIST BELOW):
ROUTING I 1 ^ SIG.NArjRr
TITLE NAME DATE OrSAPopoviw
APPROVAL 'SEE SIDE 2'
INITIATOR i
1
1 •
i i j
O.A. UNIT 1
i
(0VER1 ao20/n.«A

QUALITY ASSURANCE PROJECT FLAN Page: 43 of 125 Date: Jan. 1987 Number: QA E415 Revision: 0
Figure 7-3 Qut-of-Control Event Form
Date Time Analyst_
Hethod Matrix
Initials flf individual initially notified
;*^Suspect -^lab nuBbers ^
Out-^-contxol lab nunbers
Indication of out-of-ccntxol event
^use determined
Action taken
Date and time QAC notified
Data and time ujiUul
Precision criteria net Accuracy criteria mBt_
Reanalysis of data ccepleted
0053F PE-415

QUALITY ASSURAHCE PROJECT PLAH Page: 44 of 125 Date: Jan. 1987 Number: QA E415 Revision: 0
ERT
Client:
COG Record «(s|:
Figure 7-4 Sample Receipt Cheek List
SAMPLE RECEIPT CHECK UST
Matrix Container ERT «{s)
1. Wera samples shipped or hand>delivered7
Notes:
2. Was COC record present upon receipt of semples?
Notes:
3. Was COC tape present/unbroken on outer package?
Notes;
4. Were samples received ambient or chilled?
Notes:
5. Were eny samples received broken/leaking (improperly sealed)?
Notes:
6. Were samples properly preserved?
Notes:
7. Were COC types present/unbroken en samples?
Notes:
8. Any discrepancies between sample labels end COC records?
Notes:
9. Were samples received within holding times?
Notes:
Yes No • •
Yes No • •
Yes No • •
Yes No Q •
Yes No • •
Yes No • •
Yes No • •
Additional Comments:
Samples inspected and logged in by. .Date:

QUALITY ASSURANCE PROJECT PLAN Page: 45 of 125 Date: Jan. 1987 Number: QA E415 Revision: 0
Figure 7-5 Initial Page
ERT INITIAL PAGE
Page:
SIGNATURE INITIALS
1
•
eiAia/n.aA

QUALITY ASSURAHCE PROJECT PLAN Page: 46 of 125 Date: Jan. 1987 Number: QA E415 Revision: 0
Figure 7-6 Daily Log Sheet
ERT QUALITY ASSUAA:iC& FOR.M -
PACE :
SUaJECT: DAILY LOG DATS A.SD SlCt: SACH

QUALITY ASSURANCE PROJECT PLAN Pase: 47 of 125 Date: Jan. 1987 Number: QA E415 Revision: 0
• Serial Dilution Sheet - a sheet which is used to describe how dilutions were made from mixed standards to be used as calibration standards or in-house spiking solutions. The following is required: Information about the super stock standards such as parameter, concentration, date prepared, ERT stock standard number, etc. and information about the serial standard preparation such as volume of standard taken, volume diluted to, solvent used, final concentrations, storage location, who prepared it and the date prepared (Figure 7-7).
• Analytical Results of QA/QC Fortified Samples (Matrix Spikes) - on this sheet one records pertinent preparation infot^tion for spiking samples (6AC treated water) such as volume or weight of sample spiked, concentration of standard used for spiking, and ,-volurae. of ..spike uused. . From this information, u>ne .ran then •calculate vtlie expected .concentration V.of^.parameter iispiked into .the
: .^inatrix.'fspike sample (Figure 7-8).
In addition to these forms, a Data Package will contain other pertinent information such as daily instrument calibration, check standard results, chromatographic charts, computer printouts, references to other logbook entries and correspondences. Copies of all GC/MS raw data files are also transferred to magnetic storage media.
7.3 Final Evidence Files
All data files are maintained in a final evidence file. The ERT laboratory stores all final evidence files in a locked and alarmed sample data vault. Access to the final evidence files is limited to authorized laboratory personnel. Final evidence files for this program will be stored for the life of the consent decree.
0053F PE-415

QUALITY ASSURANCE PROJECT PLAN Page: 48 of 125 Date: Jan. 1987 Number: QA E415 Revision: 0
Figure 7-7 Serial Dilution Sheet
ERT OATI;
ANALYSIS .
PREPARATION OP SERIAL DILUTION STANDARDS
Oiwic. .Sainela Matni:, .Proiaa Nor.
.Starao* naquiranianu;.
Qllnliawi ay;. .Data;.
iSaa Vaga ' oT TNit Naiabeok or Anaehad Shaat for Suear Sfoea naw Oaial
.iOaia StoetaMa Araoarad:.
Cancamrauon Of
of Standard Utad far iha Dilution
Vatuma fmit of Standard
Taun
Votuma «mt Oilutad
To
Soivani Utad
Ainti
Cancaniration
Oiiootiiion of 1 Sianoarot and/or ' Sioraga Location
- 1 ! 1 •
*
OilutwM Rv n..-
Hi Snwa Uun far DituoM-
iSaa Aaga of Ttiia ftotaoo Ok or Anacnao Sliaai far Suoar Stack Raw Oitai
Cancantraoon Of
at Stafidard Uaad far ma OiluiMn
Votuma Imt) of Sunaara
Taaan
Votuma tmtl Oituiaa
To
^ tMNWI II Utad
Knot Ditaotmon of Stanaarot ano/ or Storage Location j
1 j
j
lar .Data;.
Cane of Sloet Utad tor Olludon: (SaaAaga at Thia Notaoook or Attaehad Shaai tor Suoar Stack Raw Oatal
.AoaraMOSr.
_Oaia Stack waa Ari
Cancamtaoon Of
at Standard Uaad tar did Otfudon
VWumatmll at Standard
Tatan
Vaiuma (inti Oiluiad -
To
Wnal Cancaniration
0» Star
of ana/or
Siaraga Mcaiion

§ tn w
•fl n I
Ln
''"OO
QUAIITY ASSURANCE FORM
SUBJECT: ANALYTICAL RESULTS OF QA/QC FORTIFIED (QVERSPIKEOI SAMPLES
riia.ii Sainiila Maiiii-
Projacl No.; Analvia: Projacl No.; " -
ERT Sainiila
No.
Spikad By/Oaia
Voluma |ml| Waiolil (Bl
Sampla Spikad
Cone, ol Siamlaid
Uiail (daia. inig |
' Volume (mil Spikad
E«|iaclad Cone Blind
Sample
Total Recovered
Mimit Cone ol dtlQinal
Sauijile
Analyiieal Retiilie
Commantt
t
•
po as o 7) » c at (» < 3 fi-0« f O* (D » m (0 .• ..
3 * ' C« ».
" o 5 o ^ ' o
P9 H H» Xs «0 t-> OB H ui is»
Figure 7-8 Analytical Results of QA/QC Fortified (Overspiked)
Samples Sheet

QUALITY ASSURANCE PROJECT PLAN Page: 50 of 125 Date: Jan. 1987 Number: QA E415 Revision: 0
8. CALIBRATION PROCEDURES
8.1 Low-Level (ppt) Analysis of PAH and Heterocycles
Prior to use of the method for low level analysis of PAH and Heterocycles, a five-point response factor calibration curve must be established showing the linear range of" the analysis. For every 12 hours of GC/MS analysis, the mass spectrometer response for each PAH or heterocycle relative to the internal standard is determined, as described in the Calculations Section, using daily check standards at concentrations of 40 ng/mL. Daily response factors for each compound must be compared to the initial calibration curve. If the daily response factors are within
;r^35^rf>ercent :of thei corresponding calibration curve value the analysis may ^proceed. . If.v-<tor any analyte, the daily response factor is not .within +35 percent of the corresponding calibration curve value, a five-point calibration curve must be repeated for that compound prior to the analysis of samples.
Chromatographic peak location criteria will be established using relative retention time. An initial determination of retention times for each PAH or heterocycle relative to its respective internal standard (Table 8-1) will be made using five-point calibration standards. Representative average relative retention times, standard deviations and 95 percent confidence limits are presented in Table 8-2. Relative retention times of daily check standards must be within the 95 percent confidence limits calculated from the calibration standards for each PAH or heterocyclic compound. In addition, sample component relative retention times must be within ̂ .1 relative retention time units of the standard component relative retention time.
8.1.1 Daily GC/MS Performance Tests
At the beginning of each 12 hour shift that analyses are to be performed, the GC/MS system must be checked to see that acceptable performance criteria are achieved for decafluorotriphenylphosphine (DFTFP). This DFTPP performance test requires the following instrumental parameters:
Electron Energy 70 volts (nominal) Mass Range - 35 to 450 amu Scan Time - 1.0 sec.
At the beginning of each 12 hour shift, inject 2 pL (50 ng) of DFTFP standard solution. Obtain a background corrected mass spectrum of DFTFP and check that all the key ion criteria in Table 8-3 are achieved. If all the criteria are not achieved, the analyst must retune the mass spectrometer and repeat the test until all criteria are achieved.
0053F PE-415

QUALITY ASSURANCE PROJECT PLAN Page: 51 of 125 Date: Jan. 1987 Number: QA E415 Revision: 0
TABLE 8-1
COMPOUNDS AND MS QUANTITATION MASS IONS
Compound Quantitation Confirmation Ion
Mass Ion (% Abundance)
jPolynucIear Aromatic Hydrocarbons (PAH)
Internal Standard Reference
Naphthalene
Acenaphthylene
Acenaphthene
Fluorene
Phenanthrene
Anthracene
Fluoranthene
Pyrene
Benzo(a)anthracene
Chrysene
Benzofluoranthenes
Benzo(a)pyrene
Indeno(1,2,3,cd)pyrene
Dibenz(a,h)anthracene
Benzo(g,h,i)perylene
Internal Standards
1) Acenaphthene-dlO
2) Phenanthrene-dlO
3} Benzo(a)pyrene-dl2
Surrogates
1) Naphthalene-d8
2) Flourene-dlO
3) Chrysene-dl2
128
152
154
166
178
178
202
202
228
228
252
252
276
278
276
164
188
264
136
176
240
102 (20)
151 (20)
153 (90)
165 (80)
176 (20)
176 (20)
200 (20)
200 (20)
226 (20)
226 (20)
250 (25)
250 (25)
274 (20)
276 (20)
274 (20)
1
1
1
2
2
2
2
2
3
3
3
3
3
3
3
1
2
3

QUALITY ASSURAHCE PROJECT PLAN Page: 52 of 125 Date: Jan. 1987 Number: QA E415 Revision: 0
Compound
TABLE 8-1 (Continued)
COMPOUNDS AND MS QUANTITATION MASS IONS
Quantitation Confirmation Ion Internal Mass Ion (% Abundance) Standard Reference
Heterocyeles and Other PAH
Indene
Indole
2,3-dihydroindene
2,3-benzofuran
Quinoline
Benzo(b)thiophene
2-methyl napthalene
1-methyl napthalene
Biphenyl
Carbazole
Dibenzofuran
Acridine
Dibenzothiophene
Perylene
Benzo(e)pyrene
116
117
118
118
129
134
141
141
154
16 7
168
179
184
252
252
115 (90)
90 (40)
117 (50)
90 (40)
102 (30)
115 (40)
115 (40)
153 (30)
166 (25)
139 (25)
178 (25)
139 (20)
250 (30)
250 (30)
1
1
1
1
2
2
2
2
3
3
3
3
3
3
3
Internal Standards
1) Acenaphthene-dlO
2) Phenanthrene-dlO
3) Benzo(a)pyrene-dl2
Surrogates
1) Naphthalene-dB
2) Flourene-dlO
3) Chrysene-dl2
164
188
264
136
176
240
1
2
3

QUALITY ASSURANCE PROJECT PLAN Page: 53 of 125 Date: Jan. 1987 Number: QA E415 Revision: 0
TABLE 8-2
RELATIVE RETENTION TIMES AND CONFIDENCE LIMITS FOR THE COMPOUNDS
ASSOCIATED WITH THE LOU LEVEL PAH AND HETEROCYCLE METHODOLOGY
Group 1 Ave. RRT X RSD 95% Confidence Limits
benzofuran 0.550 0.015 2.807 0.520-0.580 dihydroindene 0.590 0.016 2.765 0.558-0.622 indene 0. 598 0.016 2^ 699 .0.566-0.630 iNaphthAlene-^ilS '(Surr.) 0.133 0.017 2.289 0.699-0.767 '^Naphthalene 0.735 0.017 2.289 0.701-0.769 Benzo(b)thiophene 0.743 0.017 2.258 0.709-0.777 Quinoline 0.783 0.017 2.140 0.749-0.817 Indole 0.824 0.018 2.167 0.788-0.860 2-roethyl 0.832 0.017 2.084 0.798-0.866 1-methyl 0.848 0.017 2.055 0.814-0.882 Biphenyl 0.901 0.017 1.921 0.867-0.935 Acenaphthylene 0.962 0.018 1.822 0.927-0.988 Acenaphthene 0.988 0.018 1.849 0.952-1.024 Dibenzofuran 1.011 0.018 1.791 0.975-1.047
Group II
Fluorene-dlO (Surr.) 0.872 0.015 1.735 0.842-0.902 Fluorene 0.875 0.015 1.745 0.845-0.905 Dibenzothiophene 0.974 0.016 1.617 0.942-1.006 Phenanthrene 0.988 0.016 1.589 0.956-1.020 Anthracene 0.994 0.016 1.597 0.962-1.026 Acridine 0.999 0.016 1.572 0.967-1.031 Carbazole 1.013 0.015 1.487 0.983-1.043 Fluoranthene 1.130 0.017 1.461 1.096-1.164 Pyrene-dlO (Surr.) 1.155 0.017 1.444 1.121-1.189 Pyrene 1.157 0.017 1.443 1.123-1.191
Group III
Benz(a)anthracene 0.873 0.012 1.325 0.849-0.897 Chrysene-dl2 (Surr.) 0.874 0.012 1.320 0.850-0.898 Chrysene 0.876 0.012 1.320 0.852-0.900 Benzofluoranthenes 0.960 0.014 1.501 0.932-0.988 Benzo(e)pyrene 0.984 0.016 1.590 0.952-1.016 Benzo(a)pyrene 0.988 0.016 1.615 0.956-1.020 Perylene-dl2 (Surr.) 0.944 0.016 1.634 0.962-1.026 Perylene 0.996 0.016 1.644 0.964-1.028 Indeno (123,cd)pyrene 1.114 0.025 2.276 1.064-1.164 Dibenz(ah)anthracene 1.113 0.031 2.743 1.051-1.175 Benzo(ghi)perylene 1.149 0.028 2.422 1.093 1.205

QUALITY ASSURANCE PROJECT PLAN Page: 54 of 125 Date: Jan. 1987 Number: QA E415 Revision: 0
TABLE 8-3
DFTPP ION ABUNDANCE CRITERIA
Mass Ion Abundance Criteria
51 30 to 60 percent of mass 198
68 less than 2 percent of mass 69
70 "less than .2 i>ercent ofi:-mass -69
127 »40 to'60 percent of mass 198
197 less than 1 percent of mass 198
198 base peak, 100 percent
199 5 to 9 percent of mass 198
275 10 to 30 percent of mass 198
365 greater than 1 percent of mass 198
441 present but less than mass 443
442 greater than 40 percent of mass 198
443 17 to 23 percent of mass 442
0053F PE-415

QUALITY ASSURANCE PROJECT PLAN Page: 55 of 125 Date: Jan. 1987 Number: QA E415 Revision: 0
8.1.2 Gas Chromatography/Mass Spectrometry Analysis
Just prior to analysis a 125 yl aliquot of internal standard solution is transferred to the sample vial using a 250 yL syringe, giving a final internal standard concentration of approximately 40 ng/mL in the extract. Representative aliquots are injected into the capillary column of the gas chromatograph using the following conditions:
Injector Temp - 290®C Transfer Line Temp - 310^*0 Initial Oven Temp - 35*C Initial Hold Time - 2 min. Ramp Ra.te - 10*C/min. Pinal iXenqrerature - ̂ lO^C
The effluent from the GC capillary column is fed directly into the ion source of the mass spectrometer. The MS is operated in the selected ion monitoring (SIM) mode using appropriate windows to include the quantitation and confirmation masses of each PAH or heterocycLe as shown in Table 8-1. The time programmed SIM acquisition vindows are listed in Table 8-4. Each SIM sequence is acquired at a total scan speed of 1.1 seconds per scan. Typical retention behavior of the combined PAH and heterocycle analytes and corresponding SIM sequences are shown in Table 8-5. For all compounds detected at a concentration above the MDL, a check is made to insure the confirmation ion is present.
Calculations
The following formula is used to calculate the response factors of the internal standard to each of the calibration standards.
^ = (AsCis)/(AisCs) Where:
kg = Area of the characteristic ion for the parameter to be measured.
k^g = Area of the characteristic ion for the internal standard.
Cis = Concentration of the internal standard, (ng/mL). Cg =• Concentration of the parameter to be measured,
(ng/mL).
Based on these response factors, sample extract concentration for each PAH is calculated using the following formula.
0053F PE-415

QUALITY ASSURANCE PROJECT PLAN Page: 56 of 125 Date: Jan. 1987 Number: QA E415 Revision: 0
TABLE 8-4
SELECTED ION MONITORING (SIM) SEQUENCE FOR
PAH AND HETEOROCYCLES
M/2 Scanned Scan It Ranae Start Time (Min)
1 90,« 115, 116, 117, .118 .300-499 5.50
2 102, 028, 129, 134, 136 500-599 9;17
3 90, 115, 117, lAl, 153. 154 600-719 11.00
4 139, 151, 152, 153. 154. 164. 720-899 13.20
165, 166, 168, 176
5 139, 166, 167, 176, 178. 179. 900-1049 16.50
184, 188
6 200, 202, 212 1050-1249 19.25
7 226, 228, 240 1250-1399 22.92
8 250, 252, 264 1400-1649 25.67
9 274, 276, 278 1650-1850 30.25
0053F PE-415

QUALITY ASSURANCE PROJECT PLAN Page: 57 of 125 Date: Jan. 1987 Number: QA E415 Revision: 0
TABLE 8-5
6C RETENTION BEHAVIOR FOR PAH AND HETEROCYCLES
Retention Scan SIM
Compound M/Z Number Sequer
2,3-benzofuran 118 383 1 2,3-dihydroindene 118 420 1 ilndene -116 429 1 ^Napthal<ene-dB; CSurr.) 136 548 2 '^apthalene 128 551 2 Benzo(b)thiophene 134 557 2 Quinoline 129 593 2 Indole 117 635 3 2-methylnapthalene 141 640 3 1-methyInapthalene 141 653 3 Biphenyl 154 703 3 Acenaphthylene 152 756 4 Acenaphthene-dlO (IS-1) 164 776 4 Acenaphthene 154 781 4 Dibenzofuran 168 802 4 Fluorene-dlO (Surr.) 176 843 4 Fluorene 166 848 4 Dibenzothiophene 184 956 5 Phenanthrene-dlO (IS-2) 188 970 5 Phenanthrene 178 974 5 Anthracene 178 980 5 Acridine 179 985 5 Carbazole 167 1004 5 Fluoranthene 202 1134 6 Pyrene 202 1162 6 Benz(a)anthracene 228 1333 7 Chrysene-dl2 (Surr.) 240 1335 7 Chrysene 228 1339 7 Benzofluoranthenes 252 1496 8 Benzo(e)pyrene 252 1536 8 Benzo(a)pyrene-dl2 (IS-3) 264 1539 8 Benzo(a)pyrene 252 1543 8 Perylene 252 1546 8 Indeno (1,2,3-cd}pyrene 276 1713 9 Dibenz(a,h)Anthracene 278 1718 9 Benzo(g,h,1}Perylene 276 1750 9
0053F PE-415

QUALITY ASSURANCE PROJECT PLAN Page: 58 of 125 Date: Jan. 1987 Number: QA E415 Revision: 0
(AgXIg) ' ,
" (ATHRF)
where:
Ce = Sample extract concentration (ng/ml) kg s Area of the characteristic ion for the parameter to be
measured. A£S S Area of the characteristic ion for the internal standard. Ig s Amount of internal standard added to each extract (ng/mL).
The actual sample concentration (C) for each compound is calculated by the .following/formula:
(*E) C . (C, .
Where
C = Concentration of sample (ng/1) Vg = The final extract volume (mL), and Vg 3 The original volume of sample extracted (L).'
8.2 Extended Analyses for Carcinogenic PAH in 6AC Plant
Prior to use of the low-level method, a five-point response factor calibration curve will be established showing the linear range of the analysis for the compounds listed in Table 8-6. For every 12 hours of 6C/MS analysis, the mass spectrometer response for each PAH relative to the internal standard is determined, as described in the Calculations Section, using daily check standards at concentrations of 40 na/mL. Daily response factors for each compound must be compared to the initial calibration curve. If the daily response factors are within +35 percent of the corresponding calibration curve value the analysis may proceed. If, for any analyte, the daily response factor is not within +35 percent of the corresponding calibration curve value, a five-point calibration curve must be repeated for that compound prior to the analysis of samples.
Chromatographic peak location criteria will be established using relative retention time. An initial determination of retention times for each PAH will be made using five-point calibration standards. Sample component relative retention times must be within +0.1 relative retention time units of the standard component relative retention time.
0053F PE-415

QUALITY ASSURANCE PROJECT PLAN Page: 59 of 125 Date: Jan. 1987 Number: QA E415 Revision: 0
TABLE 8-6
EXTENDED ANALYSIS CARCINOGENIC PAH
Compound Quantitation Mass
benzo(c)phenanthrene
. dibenz(a,c)anthracene
'idibenzo (a >pyr ene
dibenzo(a,h}pyrene
d ibenzo(a,1}pyrene
7,12-dimethylbenz(a)anthracene
3-methyIcholanthrene
226
278
276
276
276
256
268
0053F PE-415

QUALITY ASSURANCE PROJECT PLAN Page: 60 of 125 Date: Jan. 1987 Number: QA E415 Revision: 0
8.2.1 Daily GC/MS Performance Tests - ^
At the beginning of each 12 hour shift that analyses are to be performed, the GC/MS system must be checked to see that acceptable performance criteria are achieved for DFTPF. This DFTPP performance test requires the following instrumental parameters:
Electron Energy 70 volts (nominal> Mass Range - 35 to 450 amu Scan Time - 1.0 see.
At the beginning of each 12 hour shift, inject 2 jiL (50 ng) of DFTPP standard solution. Obtain a background corrected mass spectrum of DFTPP and check that all the Itey ion criteria in Table 8-3 -are achieved. If all the criteria are not i-achieved, the analyst -iiiust xetune the mass,- spectrometer . and repeat the test until all criteria are achieved.
8.2.2 Gas Chromatography/Mass Spectrometry Analysis
Representative aliquots are re-injected into the capillary column of the gas chromatograph using the following conditions:
Injector Temp - 290'C Transfer Line Temp - 310®C Initial Oven Temp - 35*C Initial Hold Time - 2 min. Ramp Rate - 10*C/min. Final Temperature - 310*C
The effluent from the GC capillary column is fed directly into the ion source of the mass spectrometer. The MS is operated in the selected ion monitoring (SIM) mode using appropriate windows to include the quantitation masses of each PAH as sho%m in Table 8-6. The time programmed SIM acquisition is acquired at a total scan speed of 1.1 seconds per scan.
Calculations
The following formula is used to calculate the response factors of the internal standard to each of the calibration standards.
RF = (A8Cis)/(Ai8Cg)
0053F PE-415

QUALITY ASSURANCE PROJECT PLAN Page: 61 of 125 Date: Jan. 1987 Number: QA E415 Revision: 0
where:
Ag = Area of the characteristic ion for the parameter to be measured.
Ais = Area of the characteristic ion for the internal standard.
Cis = Concentration of the internal standard, (ng/mL). Cg = Concentration of the parameter to be measured,
(ng/mL).
Based on these response factors, sample extract concentration for each PAH is calculated using the following formula.
(AgXlg)
' (AjgXRF)
where:
Ce = Sample extract concentration (ng/ml) kg = Area of the characteristic ion for the parameter to be
measured. Aig = Area of the characteristic ion for the internal standard. Ig s Amount of internal standard added to each extract (ng/mL).
The actual sample concentration (C) for each compound is calculated by the following formula:
C = (Ce) x|^j , where
C = Concentration in sample (ng/1) VE = The final extract volume (mL), and Vg s The original volume of sample extracted (L).
8.3 Extended Analysis for Phenolics in GAC Plant
The analyst will select three appropriate internal standards. Calibration standards will be prepared for each parameter listed in Table 8-7 at three concentrations. A knoim constant amount of the three internal standards will be added to each standard mixture. The standard
0053F PE-415

QUALITY ASSURANCE PROJECT FLAN Page: 62 of 125 Date: Jan. 1987 Number: QA E415 Revision: 0
TABLE 8-7
EXTENDED ANALYSES ACID EXTRACTABLES
4-chloro-3-inethylphenol
2-chloropheno1
2,4-dichlorophenol
2,4-dimethylphenol
. 2.,'4-dinitroiphenol
i 2-methy1-4,6-dinitropheno1
2-nitrophenol
4-nitrophenoI
PentachlorophenoI
Phenol
2,4,6-trichIorophenol
0053F PE-.415

QUALITY ASSURANCE PROJECT PLAN Pa&e: 63 of 125 Date: Jan. 1987 Number: QA E415 Revision: 0
mixtures will be analyzed according to Section 13 of EPA Method 625 (see Appendix B). Response factors (RF) will be calculated for each compound using the following formula:
RF = (A.^)(Cs)
Where
kg = Area of the characteristic m/z for the parameter to be measured.
Ais = Area of the characteristic :m/z ;for the iintemal standard. Cis = ''Concentration of the :intemal standard (yg/L).. Cg = Concentration of the parameter to be measured (yg/L).
If the RF value over the working range is a constant (<35% relative standard deviation (RSD)), the RF can be assumed to be invariant and the average RF can be used for calculations. Alternatively, the results can be used to plot a calibration curve of response ratios, kg/k^g, vs. RF.
The working calibration curve or RF will be verified on each working day by the measurements of one or more calibration standards. If the response for any parameter varies from the predicted response by more than HK20%, the test will be repeated using a fresh calibration standard. Alternatively, a new calibration curve will be prepared for that compound.
8.4 Expanded Analyses
Table 8-8 lists the parameters to be included in the expanded analyses with appropriate analytical method references. Detailed calibration procedures are included in each EPA method. Copies of these analytical methods are included in the appendices. Calibration for all parameters in the expanded analyses will be performed as set forth in the methods.
8.5 Non-Criteria PAH Analyses
Non-criteria trater samples for PAH will be analyzed according to EPA Method 625 %rith the following changes. The compounds to be analyzed will be only those shown on Table 8-9 using the Indicated internal standards and surrogates. ERT will prepare a five-point calibration curve as described in EPA 625 Section 7. The standard mixtures will be analyzed according to
0053F PE-415

QUALITY ASSURANCE PROJECT PLAN Page: 64 of 125 Date: Jan. 1987 Number: QA E415 Revision: 0
TABLE 8-8
EXPANDED ANALYSES ANALYTE LIST AND
METHOD REFERENCE
Analytes Method Reference
Volatile Organics EPA 624^
AcidVVBase/Neutral ̂^Extractablo Orsanics :EPA 625^
Priority Pollutant Metals EPA 200.7, 204.2, 206.2, 245.1, 270.2, 279.22
Ammonia EPA 350.22
Chloride EPA 325.22
Sodium EPA 200.7
Sulfate EPA 375.42
Total Phenol 420.l2
Cyanide 335.22
1 "Guidelines Establishing Test Procedures for the Analysis of Pollutants Under the Clean Water Act" Federal Register. Friday, October 26, 1984.
2 "Methods for Chemical Analysis of Water and Wastes" EPA-600/4-79-020, March 1979 (Revised March 1983).
0053F PE-415
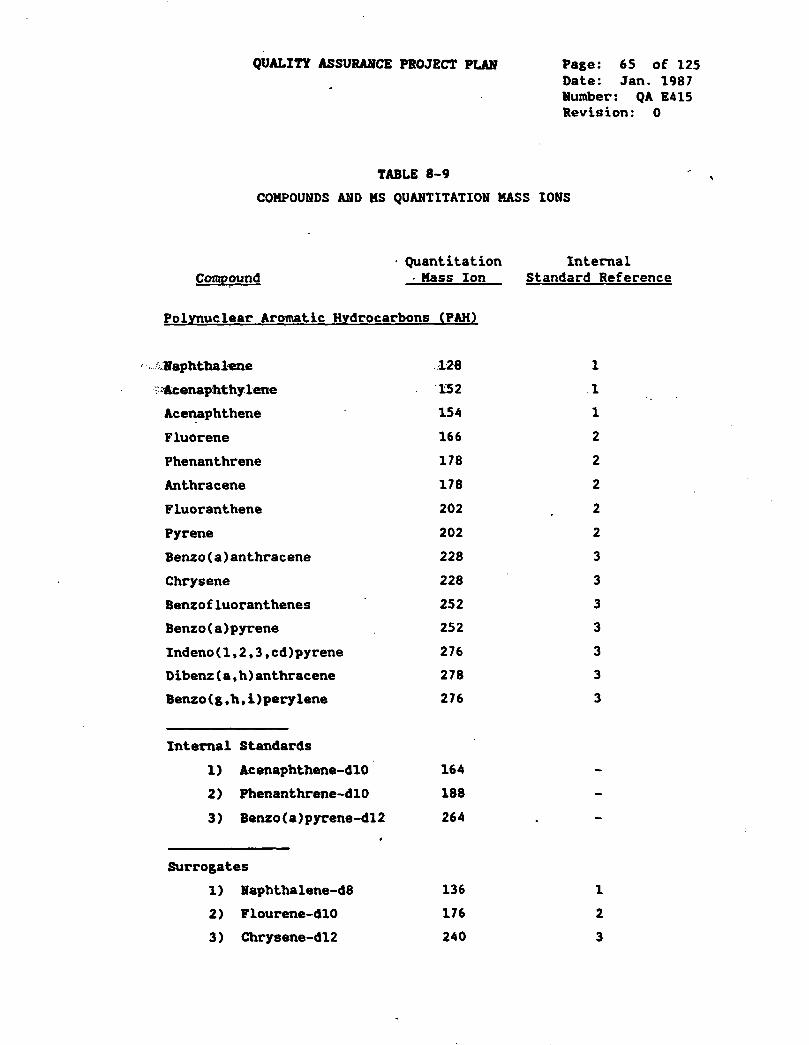
QUALITY ASSURANCE PROJECT PLAN Page: 65 of 125 Date: Jan. 1987 Number: QA E415 Revision: 0
TABLE 8-9
COMPOUNDS AND MS QUANTITATION MASS IONS
Compound Quantitation Internal
- Mass Ion Standard Reference
Polvnuelear Aromatic Hydrocarbons (PAH)
Naphthalene
i-'^Acenaphthy lene
Acenaphthene
Fluorene
Phenanthrene
Anthracene
Fluoranthene
Pyrene
Benzo(a)anthracene
Chrysene
Benzofluoranthenes
Benzo(a)pyrene
Indeno(1,2,3,cd)pyrene
Dibenz(a,h)anthracene
Benzo(g,h,i)perylene
Internal Standards
1) Acenaphthene-dlO
2) Phenanthrene-dlO
3) Benzo(a)pyrene-dl2
Surrogates
1) Naphthalene-dS
2) Flourene-dlO
3) Chrysene-dl2
128
152
154
166
178
178
202
202
228
228
252
252
276
278
276
164
188
264
136
176
240
1
1
1
2
2
2
2
2
3
3
3
3
3
3
3
1
2
3

QUALITY ASSURANCE PROJECT PLAN Page: 66 of \25 Date: Jan. 1987 Number: QA E415 Revision: 0
TABLE 8-9 (Continued)
COMPOUNDS AND MS QUANTITATION MASS IONS
, Quantitation Internal Compound Mass Ion Standard Reference
Heterocycles and Other PAH
-Indene 116 1
'Xndole 117 1
2,3-dihydroindene 118 1
2,3-benzofuran 118 1
(Juinoline 129 2
Benzo(b)thiophene 134 2
2-methyI napthalene 141 2
1-methyl napthalene 141 2
Biphenyl 154 3
Carbazole 167 3
Dibenzofuran 168 3
Acridine 179 3
Dibenzothiophene 184 3
Perylene 252 3
Benzo(e)pyrene 252 3
Internal Standards
1) Acenaphthene-dlO 164
2) Phenanthrene-dlO 188
3) Benzo(a)pyrene-dl2 264
Surrogates
1) Naphthalene-d8 136 1
2) Plourene-dlO 176 2
3) Chrysene-dl2 240 3

QUALITY ASSURANCE PROJECT PLAN Page: 67 of 125 Date: Jan. 1987 Number: QA E415 Revision: 0
Section 13 of EPA Method 625 (see Appendix B). Response factors (RF) will ̂ be calculated for each compound using the quantitation masses shown on Table 8-9 and the following formula:
RF (A,s)(Cs)
where
Ag = Area of the characteristic m/z for the parameter to be measured.
,Ais « • .Area of the characteristic 10/2 <£orrthe.'-internal:standard. ;Cis = I/Concentration of^ the internal standard ̂ (^g/L). Cg . ' ' 'Concentration of the parameter to be measured (pg/L).
If the RF value over the working range is a constant (<35% RSD), the RF can be assumed to be invariant and the average RF can be used for calculations. Alternatively, the results can be used to plot a calibration curve of response ratios, Ag/A^g, vs. RF.
The working calibration curve or RF will be verified on each working day by the measurements of one or more calibration standards. If the response for any parameter varies from the predicted response by more than ±20%, the test will be repeated using a fresh calibration standard. Alternatively, a new calibration curve will be prepared for that compound.
0053F PE-415

QUALITY ASSURANCE PROJECT PLAN Page: 68 of 125 Date: Jan. 1987 Number: QA E415 Revision: 0
9. ANALYTICAL PROCEDURES ' ,
9.1 Low Level Analysis of PAH and Heterocycles
9.1.1 Summary
This method has been designed for the analysis of PAH and heterocycles at the part per trillion level (ppt, ng/L) in water. The analysis is carried out by isolation of the target analytes by liquid-liquid extraction of the water sample with an organic solvent. Quantitation of the isolated target analytes is performed by gas chromatography mass spectrometry (GC/MS) in the selected ion monitoring mode (SIM). The compounds listed in Table 9-1 can be quantitatively determined usins this analytical method.
- TFOUT l-Mt^er ̂ volumes of sample are separated itrto ttwo :'2-:l-it;er . sanqples -and ..extracted .*d:^^th metliylene: chloride. Analysis of the combined and concentrated extract is performed by gas chromatography/mass spectrometry using the selected ion monitoring scanning mode under electron impact ionization conditions.
9.1.2 Interferences
Method interferences may be caused by contaminants in solvents, reagents, glassware, and other sample processing hardware that lead to discrete artifacts and/or elevated baselines in the ion current profiles. All of these materials must be routinely demonstrated to be free from interferences under the conditions of the analysis by running laboratory reagent blanks.
Matrix interferences may be caused by contaminants that are coextracted from the sample. The extent of matrix interferences will vary considerably from source to source, depending upon the nature of the environment being sampled.
9.1.3 Apparatus
Glassware
Glassware must be scrupulously cleaned. Clean all glassware as soon as possible after use by rinsing with the last solvent used in it. This should be followed by detergent trashing with hot water, and rinses with tap water, reagent trater, then methanol. It should then be oven dried at 150*C for 30 minutes, and heated in a muffle furnace at 400*C for IS to 30 minutes. Solvent rinses with methylene chloride may be substituted for the muffle furnace heating. Volumetric glassware should not be heated in a muffle furnace. After drying and cooling, glassware should be sealed and stored in
0053F PE-415

QUALITY ASSURANCE PROJECT PLAN Page: 69 of 125 Date: Jan. 1987 Number: QA E415 Revision: 0
Compound
Irtlill <» I
COMPOUNDS AND MS QUANIIinilON MASS IONS
QuanI j tat i'on Conf irmat. inn Ion Internal Mass Ion Abundance)., Standard Jteterence
•'«>Jynuclear Aromat ic Hydrocarbons (PAH)
Naphthalene
'^tenaphlhylene
• Acenopht+tene
Iluorene
Phenanthrene
Anthracene
f'luoranthene
Pyrene
Ben/o(a)anthracene
Chrysene
Benzufluoranthenes
Benzo(a)pyrene
lndeno(1,2,3,cd)pyrene
l)iben7(a,h)anthracene
Ben7o(q,h,i)perylene
Internal Standards
1) Acenaphthene-dlO
2) Phenanthrene-dlO
3) Benz(a)pyrene-dl2
Surrogates
1) Naphthalene-dS
2) Flourene-dlO
3) Chrysene-dl2
128
1S2
ISA
166
178
178
202
202
228
228
252
252
276
278
276
164
188
264
136
176
240
102 (20)
151 (20)
•153 (90)
165 (80)
176 (20)
176 (20)
200 (20)
200 (20)
226 (20)
226 (20)
250 (25)
250 (25)
274 (20)
276 (20)
274 (20)
0053F PE-415

QUALITY ASSURANCE PROJECT PLAN Page: 70 of 125 Date: Jan. 1987 Number: QA E415 Revision: 0
t«Hll 9 1 (Tonl inunri)
(-.OMPOUNO!) AND MS QUnNtirAIInN MASS. IONS
t.umpound
HclprocycJos and Other PAH
Quantitation Confirmation Jon I^n _ Abundance)
I nt erria 1 Standard Rof erento
J.ijdrrn-
•Indole
1 . d i:h.ydT'iti tideno
? . 3 -ben/of uran
Qij i ricij i no
Benio(b) f.hiophene
? methyl napthalene
t methyl napthalene
Bj phenyl
Carbaznle
Oiben/of uran
Acridine
Oi ben/u< hiophene
Perylene
Ben/o(e)pyrene
Internal Standards
1) Acenaphthene-dlO
2) Phenanthrene-dlO
3) Ben7(a)pyrene-dl2
Surrugat es
1) Naphthalene-dS
2) Flourene-dlO
3) Chrysene-dl2
J16
117
1 18
118
129
131
141
141
1S4
167
168
179
184
262
262
164
188
264
136
176
240
J J". ,(90)
90 (40)
117 (60)
90 (40)
102 (30)
116 (40)
116 (40)
163 (30)
166 (26)
139 (26)
178 (26)
139 (20)
260 (30)
260 (30)
0053F PE-415

QUALITY ASSURANCE PROJECT PLAN Page: 71 of 125 Date: Jan. 1987 Number: QA E415 Revision: 0
a clean environment to prevent any accumulation of dust or other ' ̂ contaminants. Store it inverted or capped td.th aluminum foil. The use of high purity reagents and solvents helps to minimize interference problems. Purification of solvents by distillation in all-glass systems may be required.
a) Separatory funnel - 3000 mL, with Teflon stopcock.
b) Concentrator tube, Kudema-Danish - 10 mL, graduated (Kontes K-570050-1025 or equivalent). Calibration must be checked at the volumes employed in the test. Ground-glass stopper is used to prevent evaporation of extracts.
:'C) : :'.;Snyder xolumn, Kudema-Danish - .'.Three-ball :macro X'JContes K-503000-0121 or equivalent).
d) Evaporative flask, Kuderna-Danish - 500 mL (Kontes K-570001-0500 or equivalent). Attach to concentrator tube with springs.
e) Snyder column, Kudema-Danish - two-ball micro (Kontes ' K-569001-0219 or equivalent).
f) Micro reaction vessels, 2.0 niL (Supelco 3-3295).
Gas ChromatORraph
The analytical system is complete with a temperature programmable gas chromatograph and all required accessories including syringes, analytical columns, and gases. The injection port is designed for on-column injection When using packed columns and for splitless injection when using capillary columns.
Column
A J&U 15-meter fused silica capillary column coated with DB-5 bonded phase, or equivalent.
Mass Spectrometer
A mass spectrometer operating at 70 ev (nominal) electron energy in the electron impact ionization mode and producing a mass spectrum which meets all the ion abundance criteria when 50 ng of decafluorotriphenyl phosphine (DFTPP; bis(perfluorophenyl) phenyl phosphine) is injected through the GC inlet. The GC capillary column is fed directly into the ion source of the mass spectrometer.
0053F PE-415

QUALITY ASSURANCE PROJECT PLAN Pafte: 72 of 125 Date: Jan. 1987 Number: QA E415 Revision: 0
A computer system interfaced to the mass spectrometer allows the continuous acquisition and storage on machine-readable media of all mass' ^. spectra obtained throughout the duration of the chromatographic program. The computer has software that allows searching any GC/MS data file for ions of a specific mass and plotting such ion abundances versus time or scan number. The computer allows acquisition at pre-selected mass windows for selected ion monitoring.
Reaaents
a) Reanent water - Reagent water is defined as a water in Which an interferent is not observed at the method detection limit of each parameter of interest.
-b) • •.:.'''i:Solvcnts - /Acetone, miethanol.«:wmethylene :chlt^ benzene, •cyclohexane —burdick & Jackson, distilled in glass,' or equivalent.
c) Sodium sulfate - (ACS) Granular, anhydrous. Purify by heating at 400*C for 4 hrs. in a shallow tray.
d) Surrogate Spikina Solution - A solution containing 10 ng/mL of each of naphthalene-dg, fluorene-d^Q» chrysene-dj2 (or equivalent weight deuterated PAH) is prepared by weighing appropriate aliquots of the purified crystals into a volumetric flask and dilution to volume with methanol or acetone.
e) Internal Standard Solutions - A solution containing ca. 200 ng/mL of each internal standard is prepared by weighing an appropriate aliquot of each purified crystal into a volumetric flask and diluting to volume with methylene chloride. The internal standard compounds are acenaphthene-dlO, phenanthrene-dlO, and benzo(a)pyrene-dl2, or equivalent weight deuterated PAH, not used as a surrogate.
f) Matrix Recovery Standard Spiking Solution - A solution containing the following compounds at the listed concentrations is prepared by weighing an appropriate aliquot of each purified crystal into a volumetric flask and diluting to volume with methanol or acetone.
0053F PE-415

QUALITY ASSURANCE PROJECT PLAN Pafie: 73 of 125 Date: Jan. 1987 Number: QA E415 Revision: 0
Compound Concentration (na/mL) • ^
Naphthalene 100 Fluorene 20 Chrysene 20 Benzo(g,h,i) perylene 20 Indene 20 Quinoline 20 Benz(e)pyrene 20 2-methyInaphthaIene 20
9.1.4 Extraction
-Samples
-Samples are extracted at pH >12. Each 4-liter sample is separated into two 2-liter aliquots in two 3-liter separatory funnels. Each 2-liter aliquot is spiked in the separatory funnel with the surrogate spiking solution. A 2.00 mL volume of mixed surrogate spiking standard is added to each 3-liter separatory funnel, to give an approximate concentration of 10 ng/L (10 ppt) of each surrogate. Each aliquot is then extracted three times (80 mL/80 mL/80 inL) with methylene chloride. The three methylene chloride extracts are passed through an anhydrous sodium sulfate drying column, and combined in a Kudema-Danish evaporative concentrator.
Concentrate the extract to approximately 0.5 mL and transfer to a 2.0 mL microreaction vessel containing 0.5 mL (500 ul) of benzene. The methylene chloride is evaporated using a nitrogen stream. The evaporative concentrator tube is successively rinsed with methylene chloride, the rinsings added to the reaction vessel and the methylene chloride again evaporated. Continue this process until at least five (5) 1 mL rinsings of the tube have occurred. Evaporate the final methylene chloride, leaving the 500 ul of benzene. All microreaction vessels should be permanently marked at the 500 yt level and additional benzene added, tdien necessary, to insure a final 500 yi extract volume. Cap with a Teflon fitted septum cap and store the extract at 4*C prior to 6C/MS analysis.
Method Blank
For a minimum of 5X of the analyses performed, prepare a method blank by treating a 4-L sample of laboratory reagent water exactly as described above.
0053F PE-415

QUALITY ASSURANCE PROJECT PLAN Page: 74 of 125 Date: Jan. 1987 Number: QA E415 Revision: 0
Solvent Blank ,
For a minimum of 10% of the analyses performed, prepare a solvent blank by introducing methylene chloride into two clean 3-liter separatory funnels (SO mL/80 mL/80 mL). Combine the methylene chloride extracts and continue the concentration exactly as described above.
Matrix Recovery Sample
For a minimum of 5% of the analyses performed, prepare a matrix recovery sample by spiking 2.00 mL of the matrix recovery standard spiking solution into two 2-L volumes of water collected from the GAC plant for ppt analyses and flmld collected .for ppb.analyses. Extract the fortified sample (exactly ̂as ilescribe:d above for samples. At fhis level of spiking, the cfolloiring:>compounds will be introduced into, the A-L sample at the .following concentrations:
Compound Concentration (nx/mL)
Naphthalene 100 Fluorene 20 Chrysene 20 Benzo(g,h,i) perylene 20 Indene 20 ^incline 20 Benz(e)pyrene 20 2-methylnaphthalene 20
Duplicate Sample
For a minimum of 10% of the samples analyzed a duplicate sample will be taken at sampling and a duplicate analysis will be performed. This will be carried out to insure that an estimate of precision will be available.
9.1.5 GC/MS Calibrations
Prior to use of method for low level analysis of PAH and Heterocycles, a five-point response factor calibration curve must be established showing the linear range of the analysis. For every 12 hours of GC/HS analysis, the mass spectrometer response for each PAH or heterocycle relative to the internal standard is determined, as described in the Calculations Section, using daily cheek standards at concentrations of 40 ng/mL. Daily response factors for each compound must be compared to the initial calibration curve. If the daily response factors are within ̂ 35 percent of the corresponding calibration curve value the analysis may proceed. If, for any
0053F PE-41S

QUALITY ASSURANCE PROJECT PLAN Page: 75 of 125 Date: Jan. 1987 Number: QA E415 Revision: 0
analyte, the daily response factor is not within ̂ 35 percent of the ^ ^ corresponding calibration curve value, a five-point calibration curve must be repeated for that compound prior to the analysis of samples.
Chromatographic peak location criteria will be established using relative retention time. An initial determination of retention times for each PAH or heterocycle relative to its respective internal standard (Table 9-1) will be made using the five-point calibration standards. Representative average relative retention times, standard deviations and 95 percent confidence limits are presented in Table 9-2. Relative retention times of daily check standards must be within the 95 percent confidence limits calculated from the calibration standards for each PAH or heterocyclic compound. In addition, sample component relative retention times jnust be within 4Q..1, relative retention time units of the standard component xeiative '-Ttetenticm time.
9.1.6 Daily GC/HS Performance Tests
At the beginning of each 12 hour shift that analyses are to be performed, the GC/MS system must be checked to see that acceptable performance criteria are achieved for DFTPP. This DFTPP perfomance test requires the following instrumental parameters:
Electron Energy 70 volts (nominal) Mass Range - 35 to 450 amu Scan Time - 1.0 sec.
At the beginning of each 12 hour shift, inject 2 pL (50 ng) of DFTPP standard solution. Obtain a background corrected mass spectrum of DFTPP and check that all the key ion criteria in Table 9-3 are reasonably achieved. If all the criteria are not achieved, the analyst must retune the mass spectrometer and repeat the test until all criteria are achieved.
9.1.7 Gas Chromatography/Mass Spectrometry Analysis
Just prior to analysis a 125 pi aliquot of internal standard solution is transferred to the sample vial using a 250 pL syringe, giving a final internal standard concentration of ca. 40 ng/mL in the extract. Representative aliquots are injected into the capillary column of the gas chromatograph using the following, or similar, conditions:
Injector Temp - 290*0 Transfer Line Temp - 310*C Initial Oven Temp - 35*0 Initial Hold Time - 2 min. Ramp Rate - 10*C/min. Final Temperature - 310*0
0053F PE-415

QUALITY ASSURANCE PROJECT PLAN Page: 76 of 125 Date: Jan. 1987 Number: QA E41S Revision: 0
» TABLE 9-•2 y.
RELATIVE RETENTION TIMES AND CONFIDENCE LIMITS FOR THE COMPOUNDS
ASSOCIATED WITH THE LOW LEVEL PAH AND HETEROCYCLE METHODOLOGY
Group 1 AVR, RRT • SD % RSD 95% Confidence Limits
benzofuran 0.550 0.015 2.807 0.520-0.580 dihydroindene 0.590 0.016 2.765 0.558-0.622 indene 0.598 0.016 2.699 0.566-0.630 Naphthalene-dS (Sure.) 0.733 0.017 2.289 0.699-0.767 Naphthalene 0.735 0.017 2.289 0.701-0.769 ^Benzfh) thiopliene 0,743 Di017 .2,258 D:709_O.777 vQuinolliie i0.T83 0.017 2.T.40 iO,74S-D.B17 Indole 0.824 0.018 2.167 0.788-0.860 2-methyl 0.832 0.017 2.084 0.798-0.866 l-methyl 0.848 0.017 2.055 0.814-0.882 Biphenyl 0.901 0.017 1.921 0.867-0.935 Acenaphthylene 0.962 0.018 1.822 0.927-0.988 Acenaphthene 0.988 0.018 1.849 0.952-1.024 Dibenzofuran 1.011 0.018 1.791 0.975-1.047,
Group II
Fluorene-dlO (Surr.) 0.872 0.015 1.735 0.842-0.902 Fluorene 0.875 0.015 1.745 0.845-0.905 Dibenzothiophene 0.974 0.016 1.617 0.942-1.006 Phenanthrene 0.988 0.016 1.589 0.956-1.020 Anthracene 0.994 0.016 1.597 0.962-1.026 Acridine 0.999 0.016 1.572 0.967-1.031 Carbazole 1.013 0.015 1.487 0.983-1.043 Fluoranthene 1.130 0.017 1.461 1.096-1.164 Pyrene-dlO (Surr.) 1.155 0.017 1.444 1.121-1.189 Pyrene 1.157 0.017 1.443 1.123-1.191
Group III
Benz(a}anthracene 0.873 0.012 1.325 0.849-0.897 Chrysene-dl2 (Surr.) 0.874 0.012 1.320 0.850-0.898 (Hirysene 0.876 0.012 1.320 0.852-0.900 Benzofluoranthenes 0.960 0.014 1.501 0.932-0.988 Benzo(e)pyrene 0.984 0.016 1.590 0.952-1.016 Benzo(a)pyrene 0.988 0.016 1.615 0.956-1.020 Perylene-dl2 (Surr.) 0.944 0.016 1.634 0.962-1.026 Perylene 0.996 0.016 1.644 0.964-1.028 Indeno (123,cd)pyrene 1.114 0.025 2.276 1.064-1.164 Dibenz(ah)anthracene 1.113 0.031 2.743 1.051-1.175 Benzo(ghi)perylene 1.149 0.028 2.422 1.093 1.205

QUALITY ASSURANCE PROJECT PLAN Page: 77 of 125 Date: Jan. 1987 Number: QA E415 Revision: 0
TABLE 9-3
DFTPP ION ABUNDANCE CRITERIA
Mass Ion Abundance Criteria
51 30 to 60 percent of mass 198
68 less than 2 percent of mass 69
70 less than 2 percent of mass 69
127 40 to 60 percent mass :i.98
197 less than 1 percent of mass 198
198 base peak, 100 percent
199 5 to 9 percent of mass 198
275 10 to 30 percent of mass 198
365 greater than 1 percent of mass 198
441 present but less than mass 443
442 greater than 40 percent of mass 198
443 17 to 23 percent of mass 442
0053F PE-415

QUALITY ASSURANCE PROJECT PLAN Page: 78 of 125 Date: Jan. 1987 Number: QA E415 Revision: 0
The effluent from the GC capillary column is fed directly into the ion source of the mass spectrometer. The MS is operated in the selected ion ' monitoring (SIM) mode using appropriate windows to include the quantitation and confirmation masses of each PAH or heterocycle as shown in Table 9-1. The time programmed SIM acquisition windows are listed in Table 9-4. Each SIM sequence is acquired at a total scan speed of 1.1 seconds per scan. Typical retention behavior of the combined PAH and heterocycle analytes and corresponding SIM sequences are shown in Table 9-5. For all compounds detected at a concentration above the MDL, a check is made to insure the confirmation ion is present.
9.1.8 Calculations
? :The lolloinng formula is izsed to calculate rthe response, factors of the 'iint:ernal < standaxd^^::!^ each; of: hhe calibration standards.
RF = (AgC^g)/(Aj^gCg)
where:
Ag = Area of the characteristic ion for the parameter to be measured.
Aig = Area of the characteristic ion for the internal standard.
Gig s Concentration of the internal standard, (ng/mL). Cg = Concentration of the parameter to be measured,
(ng/mL).
Based on these response factors, sample extract concentration for each PAH is calculated using the following formula.
(A^)(I^) Ce (A.^)(RF)
Where:
Ce = Sample extract concentration (ng/mL) Ag = Area of the characteristic ion for the parameter to be
measured. A^g = Area of the characteristic ion for the internal standard. Ig = Amount of internal standard added to each extract (ng/mL).
The actual sample concentration (C) for each compound is calculated by the following formula:
0053F PE-415

QUALITY ASSURANCE PROJECT PLAN Page: 79 of 125 Date: Jan. 1987 Number: QA E415 Revision: 0
TABLE 9-4
SELECTED ION MONITORING (SIM) SEQUENCE FOR
PAH AND HETEOROCYCLES
Sequence # M/2 Scanned Scan # Ranae Start Time (Min)
1 90. 115, 116, 117, 118 300-499 5.50
2 102^ 028, 129, 134, 136 500-599 9.17
3 SO, 115, 017, 141, 153, 154 miO-^719 ll^OO
4* 139, 151, 152, 153, 154, 164, 720-899 13.20
165, 166, 168, 176
5 139, 166, 167, 176, 178, 179, 900-1049 16.50
184, 188
6 200, 202, 212 1050-1249 19.25
7 226, 228, 240 1250-1399 22.92
8 250, 252, 264 1400-1649 25.67
9 274, 276, 278 1650-1850 30.25
0053F PE-415

QUALITY ASSURANCE PROJECT PLAN Pase: 80 of 125 Date: Jan. 1987 Number: QA E415 Revision: 0
TABLE 9-5
GC RETENTION BEHAVIOR FOR PAH AMD HETEROCYCLES • Retention " Scan SIM
Compound N/Z Number Sequence ^
2,3-benzofuran 118 383 1 2,3-dihydroindene 118 420 1 Indene 116 429 1
i^Sap thalene-^JdS ;tSuiT.) 136 548 2 'Napthalene 128 551 2 Benzo(b)thiophene 134 557 2 Quincline 129 593 Z Indole 117 635 3 2-me thyInapthalene 141 640 3 1-methyInapthalene 141 653 3 Biphenyl 154 703 3 Acenaphthylene 152 756 4 Acenaphthene-dlO (IS-1) 164 776 4 Acenaphthene 154 781 4 Dibenzofuran 168 802 4 Fluorene-dlO (Surr.) 176 843 4 Fluorene 166 848 4 Dibenzothiophene 184 956 5 Phenanthrene-dlC (IS-2) 188 970 5 Phenanthrene 178 974 5 Anthracene 178 980 5 Acridine 179 985 5 Carbazole 167 1004 5 Fluoranthene 202 1134 6 Pyrene 202 1162 6 Benz(a)anthracene 228 1333 7 Chrysene-dl2 (Surr.) 240 1335 7 Chrysene 228 1339 7 Benzofluoranthenes 252 1496 8 Benz(e)pyrene 252 1536 8 Benz(a)pyrene-dl2 (IS-3) 264 1539 8 Benz(a)pyrene 252 1543 8 Perylene 252 1546 8 Indeno (1,2,3-cd)pyrene 276 1713 9 Dibenz(a,h)Anthracene 278 1718 9 Benzo(s,h,i)Perylene 276 1750 9
0053F PE-415

QUALITY ASSURANCE PROJECT PLAN Page: 81 of 125 Date: Jan. 1987 Number: QA E415 Revision: 0
(*E) C . <C«) ' W)'
%/here
C = Concentration in Sample (ng/L) Vg s The final extract volume (mL), and Vg = The original volume of sample extracted (L).
9.2 Extended Analyses for Carcinogenic PAH in GAC Plant
To satisfy the requirements of the RAP Section 4.3.4, ERT will analyze one sample per year of the GAC treated water for.the additional carcinogenic «oiiq»ounds.-shown on^'Table:.:9-6 and .rsearch for . additional compounds ..that may be .^present. f^ERT. .the «amp^le;j<according to Section 9.1 of this 'QAPP.' A-eaiibration standard containing the compounds shown on Table 9-6 will be prepared and used to establish a five point calibration curve. All procedures outlined in Section 8.2 for instrument calibration will be followed.
The sample extract will be prepared and analyzed as outlined in Section 9.1 generating quantitative results for the compounds being regularly measured. A second injection will be made with a selective ion monitoring program using the quantitation masses shown in Table 9-6. This will allow the extended analysis compounds to be quantitated at an approximately 2 ppt detection limit.
Following the quantative analyses of the regular and extended analysis compounds, the extract will be reduced to a 50 ul final volume. An aliquot will be analyzed using full-scan GC/MS (40-500 amu). Any peaks having a signal to noise ratio of 5 or larger will be identified, if possible, using the EPA/NIH mass spectral library. Compounds so identified will be quantitated using the nearest internal standard and a response factor of 1.0, to a detection limit of approximately 5 ppt.
9.3 Extended Analyses for Phenolics in GAC Plant
To satisfy the requirements of the RAP Section 4.3.4, ERT will analyze one sample per year of GAC treated water for the aciid extractable compounds shown on Table 9-7. These compounds will be analyzed according to sections applicable to acid extractables in EPA Method 625 ("Guidelines Establishing Test Procedures for the Analysis of Pollutants Under the Clean Water Act". Federal Register, Friday. October 26, 1984).
9.4 Expanded Analyses
In accordance with RAP Section 9.3.3, the Regional Administrator, the Director, or the Commissioner may request expanded analyses of groundwater
0053F PE-415

QUALITY ASSURANCE PROJECT PLAN Page: 82 of 125 Date: Jan. 1987 Number: QA E415 Revision: 0
TABLE 9-6
EXTENDED ANALYSIS CARCINOGENIC PAH
Compound Ouantitation Mass
benzo(c)phenanthrene 226
dibenz(a,c)anthracene 278
dibenz(a,e)pyrene 276
dibenzXarlOpyrene 27.6
tflbenz'(AVi^)pyrene 276
7,12-d imethyIbenz(a)anthracene 256
3-methylchoIanthrene 268
0053F PE-415

QUALITY ASSURANCE PROJECT FLAN Page; 83 of 125 Date: Jan. 1987 Number: QA E415 Revision: 0
TABLE 9-7
EXTENDED ANALYSES ACID EXTRACTABLES
4-chloro-3-methylphenol
2-chloroptieno 1
2,4-dichlorophenol
2,4-dimethyIphenol
2,4-dinitrophenol
- 2-iBethyl—4>6-dinitrophenoI
2^nitrophenol
4-nitrophenol
Pentachlorophenol
Phenol
2,4,6-trichlorophenol
0053P PE-41S

QUALITY ASSURANCE PROJECT PLAN Page: 84 of 125 Date: Jan. 1987 Number: QA E415 Revision: 0
samples in conjunction with the Northern Area Remedial Investigation. The list of possible analyses are shotm on Table 9-8. Organic analyses and -metals analyses will be performed at ERT's Concord laboratory facility. Th^e inorganic analyses will be performed at ERT's Houston laboratory facility.
The analytical methods to'be used for each analyte are also shown on Table 9-8 and attached as Appendix B.
9.5 Non-Criteria PAH Analyses
Non-criteria PAH samples will be analyzed, according to EPA Method 625 (see Appendix B) with the following exceptions:
1) The compounds analyzed list will be limited to those compounds listed in QAPP Table 9-9.
;2^ - will ibe used internal standards, : -^.:.>as<<ehown .on Table 9-9.
3) Matrix spikes will be analyzed as detailed in QAPP Section 11.1.4 using the select list of matrix spike compounds as shown therein.
4) Surrogate and matrix spike acceptance criteria will be those given in QAPP Section 15.1.
As described in EPA 625, a one-liter water sample will be extracted and . analyzed, to give a reported detection limit of 10 parts per billion for each compound.
0053F PE-415

QUALITY ASSURANCE PROJECT PLAN Page: 85 of 125 Date: Jan. 1987 Number: QA E415 Revision: 0
TABLE 9-8
EXPANDED ANALYSES ANALYTE LIST AND
METHOD REFERENCE
Analvtes Method Reference
Volatile Organics
Acid, Base/Neutral Extractable Organics
:^riority ̂ PoIIu tant -Metals
Ammonia
Chloride
Sodium
Sulfate
EPA 6241
EPA 6251
EPA 200.7, ;;204..2, 206.2, 245.1. 270.2, 279.2^
EPA 3502
EPA 3252
EPA 200.72
EPA 3752
"Guidelines Establishing Test Procedures for the Analysis of Pollutants Under the Clean Water Act" Federal Reftister. Friday, October 26, 1984.
"Methods for Chemical Analysis of Water and Wastes" EPA-600/4-79-020, March 1979.
0053F PE-415

QUALITY ASSURANCE PROJECT PLAN Page: 86 of 125 Date: Jan. 1987 Number: QA E41S Revision: 0
TABLE 9-9
COMPOUNDS AND MS QUANTITATION MASS IONS
(^antitation Internal Compound Mass Ion Standard Reference
Polvnuclear Aromatic Hydrocarbons (PAH)
Naphthalene 128 1
;.Aeet»phthylene 152 1
Acenaphthene 154 1
Fluorene 166 2
Phenanthrene 178 2
Anthracene 178 2
Fluoranthene 202 2
Pyrene 202 2
Benzo(a)anthracene 228 3
Chrysene 228 3
Benzofluoranthenes 252 3
Benzo(a)pyrene 252 3
Indeno(1,2,3,cd)pyrene 276 3
DibenzCa,h)anthracene 278 3
Benzo(g,h,i}perylene 276 3
Internal Standards
1) Acenaphthene-dlO 164
2) Phenanthrene-dlO 188
3} Benzo(a)pyrene-dl2 264
Surrogates
1) Naphthalene-d8 136 1
2) Flourene-dlO 176 2
3) Chrysene-dl2 240 3

QUALITY ASSURANCE PROJECT PLAN Page: 87 of 125 Date: Jan. 1987 Number: QA E415 Revision: 0
TABLE 9-9 (Continued)
COMPOUNDS AND MS QUANTITATION MASS IONS
.Quantitation Internal Compound .Mass Ion Standard Reference
Heterocyeles and Other PAH
Indene 116 1
Indole 117 1
2,3-dihydroindene 118 1
2,3-benzofuran 118 1
Quinoline 129 2
Benzo(b)thiophene 134 2
2-methyl napthalene 141 2
1-methyl napthalene 141 2
Biphenyl 154 3
Carbazole 167 3
Dibenzofuran 168 3
Acridine 179 3
Dibenzothiophene 184 3
Perylene 252 3
Benzo(e)pyrene 252 3
Internal Standards
1) Acenaphthene-dlO 164
2) Phenanthrene-dlO 188
3) Benzo(a)pyrene-dl2 264
Surrogates
1) Naphthalene-d8 136 1
2) Flourene-dlO 176 2
3) Chrysene-dl2 240 3

QUALITY ASSURANCE PROJECT PLAN Page: 88 of 125 Date: Jan. 1987 Number: QA E415 Revision: 0
10. DATA REDUCTION. VALIDATION AND REPORTING
10.1 Data Reduction and Validation
All data will be subjected to a rigorous review process before being reported. All data forms must be dated, signed and completely filled out in ink by the preparer. Notes will be n»ade if information requested is non-applicable for the specific analysis. Each data sheet will be checked, signed, dated and approved by someone other than the preparer.
Out-of-control events or potential out-of-control events are noted on an out-of-control event form. This form is part of the data package and will be completed upon data approval. If no out-of-control events are encountered then this will also be documented. If an out-of-control event
; ̂oes nccurv'durxng;f,ianalysis,. for^dnstance a/rsurrogate recovery, falls outside ;^e .i«q»cted ranges-^analyst Swtllrfdescribe the ;aventv the investigative .^athdH'«orrective ac:tion>t.aken and the cause of the event on this form," and will notify the Quality Control Coordinator (QCC).
After an analyst completes a Data Package, it is given to the Supervisor for review. The Supervisor reviews the entire Data Package for completeness, discrepancies and errors and writes comments, when necessary, on the back of the Data Approval Form. If the supervisor disapproves the Data Package it is given back to the analyst for correction. If it is approved the Supervisor passes it along to the QCC.
The QCC then reviews the Data Package with extra emphasis on the acceptability of quality control data. If the QCC disapproves the Data Package it is rerouted to the Supervisor for corrective action; if the QCC approves it, it is sent to the Laboratory Manager for final approval and report preparation.
Before submission to the client, the final typed report is reviewed by the Program Manager, Laboratory Manager, Supervisors and Quality Control Coordinator for their approval and signatures.
10.2 Turnaround Time
In accordance with Section 3.2 of the RAP, ERT has agreed to a 28-day turnaround. The City, however, makes no enforceable commitment under the RAP except for a maximum of 7 days for extraction of organics and 40 days following extraction for analysis of organics. For non-organic analyses, the City makes no enforceable commitment under the RAP except to meet the recommended maximum analytical holding times.
10.3 Report Descriptions
10.3.1 Method Detection Limit Report
The Method Detection Limit Report will consist of a tabulation of method detection limits (MDL) and lower confidence limits (LCD for each compound analyzed. These concentration limits will be utilized in completing the Analytical Results Report (10.3.2) for all samples analyzed. An example of this report is included as Figure 10-1.
0053F PE-415

QUALITY ASSURANCE PROJECT PLAN Page: 89 of 125 Date: Jan. 1987 Number: QA E415 Revision: 0
FIGURE 10-1
BRT AKALYTICAL LABORATORy METhOD DETECTIOH LIMITS
POLyAROHATIC HyOROCARBONS
Compound
naphthalene
Acenapthylene
Aeenapthene
Fluorene
Phenanthrene
''^iAnthraceoe
•^Aueranthene Pyrene |
Benz(a)anthrac ene
Chrysene
Benzofluoranthenes
Benzo(a)pyrene
Indeno(1,2,3,cd)pyrene
Dibenz(a,h)anthracene
Dlbenzo(g,h,l)perylene ̂
Indene
Indole
2,3-dihydrolndene
2,3-benzofuran
Quinoline
Benzo(b)thiophene
2-methylnaphthalene
l-methylnaphthalene
Biphenyl
Carbozole
Dibenzofuran
Acridine
Dibenzothiophene
Perylene
Benzo(e)pyrene
Method Detection Limit tMDP
47 •
1.7
1.3
0.88
3.1
3.4
•• -4-4
4.1
4.4
4.4
9.7
3.4
4.4
3.4
5.3
2.9
1.9
3.4
1.9
1.9
2.2
5.0
3.1
17
2.6
1.2
2.5
6.3
1.6
1.5
Lower Control Limit (LCD
30
1.1
0.83
0.56
2.0
.2.2
2.8
2.6
2.8
2.8
6.2
2.2
2.8
2.2
3.4
1.8
1.2
2.2
1.2
1.2
1.4
3.2
2.0
11
1.7
0.77
1.6
4.0
1.0
0.96
All values expressed in part per trillion (ppt)

QUALITY ASSURANCE PROJECT PLAN Pase: 90 of 125 Date: Jan. 1987 Number: QA E415 Revision: 0
10.3.2 Sampling Report ' v
The sampling report will contain the following information associated with each sample and sample analysis:
1) Field Identification Designation 2) ERT Laboratory Sample Number 3) Field .Logbook/Page Number 4) Date of Collection 5) Date Received at ERT 6) Date Extracted 7) Date Analyzed
• 8) c GC/MS File » 9) <^GC/MS ^Tape # 10) ^Corresponding DFTPF File # 11) Corresponding Matrix Spike Sample It 12) Corresponding Method Blank Sample it 13) Corresponding Solvent Blank Sample It 14) Corresponding GC/MS Calibration Standard File it 15) Description of any problems encountered
10.3.3 Analytical Results Report
Each analytical results report will contain the following:
1) Field Identification Designation 2) ERT Laboratory Sample Number 3) Analytical Results (ppt or ppb), in terms of a) individual PAH
identification and quantitation b) Total Carcinogenic PAH c) Total Other PAH and d) Total PAH
The analytical results report will be validated and signed by the Laboratory Manager.
List of Carcinogenic PAH and Other PAH
The analytical method will provide for identification and quantitation of two groups of target compounds - the Carcinogenic PAH and the other PAH group. Listed in Table 10-1 are the two groups of target compounds. Analytical results will be reported for individual compounds, with the exception of the three benzofluoranthene isomers (b,j, and k). Due to the difficulty in maintaining chromatographic separation of this isomeric series, a total benzofluoranthenes analytical result will be reported (unless advances in chromatographic technology allow for separation in the future). This benzoflouranthenes quantitative result will be utilized in the calculation of total carcinogenic PAH.
0053F PE-415

QUALITY ASSURANCE PROJECT PLAN Page: 91 of 125 Date: Jan. 1987 Number: QA E415 Revision: 0
TABLE 10-1
STANDARD PAH AND OTHER PAH COMPOUNDS
FOR IDENTIFICATION AND QUANTITATION
a. Carcinogenic PAH
Compound
benzo(a}anthracene ybenzo< b.) f luoranthene f)l>enzo>;CjJifauoranthene s^benzo(k>f luoranthene benzo(ghi)perylene benzo(a}pyrene chrysene dibenz(a,h}anthracene indeno(1,2,3-cd}pyrene quinoline
b. Other PAH
Compound
acenaphthene acenaphthylene acridine anthracene 2,3-benzofuran benzo(e)pyrene benzo(b}thiophene biphenyl carbazole dibenzofuran dibenzothlophene 2,3-dihydro indene fluoranthene fluorene indene indole 1-methylnaphthalene 2-methyInaphthalene naphthalene perylene phenanthrene pyrene
0053F PE-415
Chemical Abstract Service ReziBtrv No.
( 56-55-3) (205-99-2) (205-^82-3) (207-08-9) (191-24-2) ( 50-32-8) (218-01-9) ( 53-70-3) (193-39-5) ( 91-22-5)
Chemical Abstract Service Registry No.
( 83-32-9) (208-96-8) (260-94-6) (120-12-7) (271-98-6) (192-97-2) ( 95-15-8) ( 92-15-8) ( 86-74-8) (132-64-9) (132-65-0) (496-11-7) (206-44-0) ( 86-73-7) ( 95-13-6) (120-72-9) ( 90-12-0) ( 91-57-6) ( 1-20-3) (198-55-0) ( 85-01-08) (129-00-0)

QUALITY ASSURANCE PROJECT PLAN Page: 92 of 125 Date: Jan. 1987 Number: QA E415 Revision: 0
Analytical Results Reporting Protocol
The quantitative results for any of the identified target compounds trill be reported in one of three possible trays. Concentrations of analytes equal to or greater than the method detection limit (MDL) trill be assigned a numerical concentration value reported to ttro (2) significant figures (i.e. 52 ng/L). Concentrations of analytes identified as present at a level less than the MDL but equal to or greater than the lotrer confidence limit (LCL) of the 95% confidence interval of the MDL are reported as less than the MDL (<MDL, i.e. <3.0 ng/L). Concentrations of target analytes less than the LCL (95% confidence interval) of the MDL are reported as not detectable (i.e. in»:. ^~'Ail ':<cases ,^^t3ie ^lantiitative :resultsv.<«d;ll ;l>e:%orx«cied levels '^observed ̂i2i=:£tlie.?imetbodr bl»nk,'^vas>Mescxd;bed: ̂iul^iSectfion vJ.l..;2. ^An ̂ example iol this report is included as Figure 10-2.
10.3.4 Surrogate Recovery Report
Each surrogate recovery report will contain the following:
1) Field Identification Designation 2) ERT Laboratory Sample Number 3) Spiking concentration for each of the three deuterium labelled
surrogate compounds (naphthalene-d3, fluorene-d^Q, chrysene-d^2)
4) Percent recovery result for each of the three surrogate compounds.
An example of this report is included as Figure 10-3.
10.3.5 Matrix Spike Recovery Report
Each matrix spike recovery report will contain the following:
1) Field identification designation 2) ERT laboratory sample number 3) Spiking concentrations for each of the eight compounds selected
(naphthalene, fluorene, chrysene, benzo(g,h,i) perylene, indene, quinoline, benz(e)pyrene, and 2-methylnaphthalene).
4) Percent recovery results for all the method spike compounds. 5) Average percent recovery for the group of eight compounds spiked.
An exaiiq>le of this report is Included as Figure 10-4.
10.3.6 Reporting Requirements for Samples Exceeding Advisory Levels or Drinking Water Criterion
For active drinking water mils, ERT will notify the City of St. Louis Park by telephone, within 24 hours of completing an analysis, %/henever a sample analysis is shown to exceed the following Advisory Levels or Drinking Water Criterion:
00S3F PE-415

QUALITY ASSURANCE PROJECT PLAN Page: 93 of 125 Date: Jan. 1987 Number: QA E41S Revision: 0
rZCURE 10-2
BBT AMALrriCAL LABORATORY
SUMMARY OF ARALYTICAL RESULTS
POLYAROHATIC HYDROCARBONS
Field ID: W-02 ERT No: 37015
CARCINOCEUIC PA^s
farawieters
-Quinollna ''.B«nso (A)«nthraeane iChrraaha
" Banzofluoranthenes ' Banto(a)pyrehe XndenoU^O-CD Diber/f^a^nth BenssI a Silkier
Analytical Result
m.
InoRenie PAH
OTHER PAHS
2,3-banzofuran 2.3-dihydroindena indene •aphthalena Banco(b)thiophana Indola 2-iaathy Inaththalana 1-mathylnaphthalana Biphanyl Aeanaphthylana Aeanaphthane Dibenzofuran Fluorana Dibanzethiephana Anthracana Aeridina Carbazola fluoranthana Pyrana Banzo(a)pyrana Parylana
Total Otbar PAH: Total PAHa:
ND 7.7 ND ND ND ND ND NO ND 7.5 11 <1.2 4.5 ND <3.4 ND BO ND 4.5 BO ss_ 35 35
BO • Concentration <LCL of MOL <IIOL • Concentration >LCL but <HDL
0053F PE-415

QUikLITY ASSURAHCE PROJECT PLAH Pase: 94 of 125 Date: Jan. 1987 Humber: QA E415 Revision: 0
FIGURE 10-3
ERT ANALYTICAL LABORATORY SUMMARY OF ANALYTICAL RESULTS
SURROGATE RECOVERY REPORT
POLYAROMATIC HYDROCARBONS
Field Id: W-02 ERT No: 37015
Surroaate
fitatlHtthalene ^ T>8
Fluorene -
Chrysene -
0053F PE-415

QUALITY ASSURANCE PROJECT PLAN Page: 95 of 125 Date: Jan. 1987 Number: QA E415 Revision: 0
FIGURE 10>4
ERT ANALYTICAL MATRIX SPIKE RECOVERY REPORT
Field Id: MS-02 ERT No: 37018
Parameters
,:^ap.htbalene
^luorene
Chrysene
Benzo(g,h,i)peryI
Indene
Quinoline
Benzo(e)pyrene
2-methylnaphthalene
Average X Recovery:
Spike Level Observed Recovery
%
49
43
60
9
28
52
12
50_
38
0053P PE-415

QUALITY ASSURAHCE PROJECT FLAN Page: 96 of 125 Date: Jan. 1987 Number: QA E415 Revision: 0
Parameter Advisory Level
Drinking Water Criterion
Sum of Benzo(a)pyrene and 3.0 ng/L Dibenz(a,h)anthracene* Total Carcinogenic PAH 15 ng/L** Total Other PAH 175 ng/L
5.6 ng/L
28 ng/L** 280 ng/L
*0r the detection limit. Whichever is largest. **Different concentrations for additional carcinogenic PAH may be established in accordance with the procedure specified in Part D.l of the Consent Decree.
0053F PE-415

QUALITY ASSURANCE PROJECT PLAN Page: 97 of 125 Date: Jan. 1987 Number: QA E415 Revision: 0
11. INTERNAL QUALITY CONTROL CHECK
11.1 Low-level PAH Analyses/Extended Analyses/Non-Criteria PAH Analyses
11.1.1 Method Detection Limit
The method detection limit (HDL) is defined as the minimum concentration of a substance that can be identified, measured, and reported with 99% confidence that the analyte concentration is greater than zero. This is determined from duplicate analyses of a sample of a given matrix containing the analyte near the estimated detection limit.
. ERT has .determined the method detection limits for .the part per t^iliion^:PAH analiysis KOf water samples, utilizing GC/MS selected vion monitoring, as. per the ̂ method described'in Appendix. B to ;Part 136-of uthe Friday, October 26, 1984 Federal Register, Vol. 49, No. 209 - Definition and Procedure for the Determination of the Method Detection Limit - Revision 11.1. Table 11-1 lists the compounds, the mean observed concentration of seven replicates spiked at 5 parts per trillion, the standard deviation, the method detection limit and the lower control limit (defined as 0.64 MDL).
These calculated method detection limits will be used in sample reporting as follows:
a Concentrations of samples (after blank correction, if applicable) less than the lower control limit of the method detection limit will be reported as not detectable (NO).
e Concentrations of samples (after blank correction, if applicable) greater than or equal to the lower control limit of the method detection limit, but less than the method detection limit will be reported as less than the MDL, or BDL (below detection limit).
11.1.2 Method Blank and Solvent Blank
The laboratory will analyze 10% laboratory solvent blanks and 5% method blanks as described in Section 9.0, Analytical Method.
The method blank results associated with the sample batch will be used to correct the observed sample concentrations in that batch as indicated below:
• If the concentration in the blank is less than or equal to half of the method detection limit, samples will not be corrected for the blank.
• If the concentration in the blank is greater than half of the method detection limit and is less than or equal to half the concentration detected in the sample, samples will be corrected for the blank by subtracting the value observed for the compound in the blank from the value observed for the same compound in the sanple.
0053F PE-415

QUALITY ASSURANCE PROJECT PLAN
TABLE ii-i METHOD DETECTION LIMIT STUDY
GC/MS/SIM PART PER TRILLION PAH/HETEROCYCLES IN WATER
Page: 98 of 125 Date: Jan. 1987 Number: QA E415 Revision: 0
Compound
Naphthalene
Acenapthylene
Acenapthene
Fluorene
Phenanthrene
Anthracene
: Fluoranthene
Pyrene
Benz(a}anthracene
Chrysene
Benzofluoranthenes
Benzo(a}pyrene
Indeno(1,2,3,ed)pyrene
Dibenz(a,h)anthracene
Dibenzo(g,h,i}perylene
Indene
Indole
2,3>dihydroindene
2,3-benzofuran
Quinoline
Benzo(b)thiophene
2-aathyInaphthalene
l-methylnaphthalene
Biphenyl
Carbozole
Dibenzofuran
Acridine
Dibenzothiophene
Perylene
Benzo(e)pyrene
Standard Lower Mean Deviation MDL Control Limit
29 15 47 30
0.53 1.7 1.1
0.42 1.3 0.83
0.28 0.88 0.56
1.0 3.1 2.0
1.1 3.4 2.2
1.4 4,4 2.8
1.3 4.1 2.6
1.4 4.4 2.8
1.4 4.4 2.8
3.1 9.7 6.2
1.1 3.4 2.2
1.4 4.4 2.8
1.1 3.4 2.2
1.7 5.3 3.4
0.92 2.9 1.8
0.61 1.9 1.2
1.1 3.4 2.2
0.61 1.9 1.2
0.61 1.9 1.2
0.71 2.2 1.4
1.6 5.0 3.2
0.98 3.1 2.0
5.4 17 11
0.84 2.6 • 1.7
0.38 1.2 0.77
0.81 2.5 1.6
2.0 6.3 4.0
0.52 1.6 1.0
0.49 1.5 0.96
All values expressed in part per trillion (ppt)

QUALITY ASSURANCE PROJECT FLAM Page: 99 of 125 Date: Jan. 1987 Number: QA E415 Revision: 0
• If the concentration in the blank is greater than half the method' detection limit and is greater than half the concentration detected in the sample, correction is not possible and the compound in the sample should be reported as not applicable (NA). If this situation occurs, the cause of the high blank must be determined and corrective actions taken.
The solvent blank is not used to correct sample concentrations, but to help determine the cause of contamination in high blanks.
11.1.3 Surrogates
:The laboratory^-will ̂ spike allvsamples and quality control ̂ samples with .^euteratediJ'PJUlv •surrogate icompounds. 4 The, surrogate compound s wi 11 ;be spiked into the sample prior to-extraction and, thus, will measure individual sample matrix effects associated with sample preparation and analysis. They will include naphthalene-dg, fluorene-dj^o chrysene-di2» ® sample concentration level of 10 ng/L (ppt) or 20 pg/L (ppb). ERT will calculate the percent recovery of each surrogate for each sample. Prior to beginning work on the project ERT will calculate the 95% confidence limits for each surrogate using historical data. ERT will plot control charts for each surrogate with warning limits at two standard deviations. The control charts will be updated as sample surrogate recoveries are plotted, as a means of observing trends or changes in method precision. Control charts will be used to alert ERT to the need to check method procedures, but failure of a surrogate to fall within the 95% confidence limits of the ongoing control charts does not necessarily invalidate the sample data.
A sample will be invalid for quantitative use in this program only if the recovery of any one or more of the surrogates falls outside the acceptance criteria. The acceptance criteria used for this program are the criteria established by ERT for these surrogates during 1986. ERT will take corrective action idienever the surrogate recovery for any one or more surrogates is outside the following acceptance criteria:
Surrogate Acceptance Criteria % Low-level Non-criteria
Naphthalene-d8 14-108 25-175 Fluorene-dlO 41-162 25-175 Chrysene-dl2 10-118 25-175
0053F PE-415

QUALITY ASSURANCE PROJECT PLAN Page: 100 of 125 Date: Jan. 1987 Number: QA E41S Revision: 0
The following corrective action will be taken when required as stated above:
a) Check calculations to assure there are no errors; b) Check internal standard and surrogate solutions for degradation,
contamination, etc., and check instrument performance; c) Reanalyze the sample or extract if the steps in part a) or b) fail
to reveal a problem. If reanalysis of the extracts yields surrogate spike recoveries within the stated limits, then the reanalysis data will be used. Both the original and reanalysis data will be reported.
d) If a), .b) or c), do-not.xorrect the; problem, -the;data :f'or that rsample; 'iwill be ̂reported .^t .••will .not oount towards. aaitisfying • the
-;-TOonitoring requirements of the RAP.
11.1.4 Matrix Spikes
The laboratory will spike and analyze 5* matrix spike samples. Following the Contract Laboratory Program rationale, ERT will spike eight representative compounds into water from the 6AC plant for ppt analyses and field collected for ppb analyses. These compounds and the spiking levels are listed below:
PPT PPB Naphthalene 100 ng/L 50pg/L Fluorene 20 50 Chrysene 20 50 Benzo(g,h,i)perylene 20 50 Indene 20 50 Quinoline 20 50 Benz(e)pyrene 20 50 2-methyl naphthalene 20 50
Naphthalene is spiked at a higher level in the ppt method, because of the higher method detection limit. The spiking procedure is outlined in Section 9.0 of this QAPP.
ERT will validate the analytical data by utilizing the matrix spike sample criteria in conjunction with the surrogate recovery criteria. If the criteria for the matrix spike are met, only samples Which do not meet the surrogate recovery criteria in that batch tall be considered invalid. If the matrix spike criteria are not met, the matrix spike analysis will be repeated. If the subsequent matrix spike analysis meets the criteria, the data will be considered valid.
0053F PE-415

QUALITY ASSURANCE PROJECT PLAN Page: 101 of 125 Date: Jan. 1987 Number: QA E415 Revision: 0
The matrix spike criteria for data validity are as follows: ^
• The average of the percent recoveries for all eight compounds must fall between 20 and 150 percent.
• Only one compound can be below its required minimum percent recovery. These minimum percent recoveries are:
1) 10% for chrysene, benzo(g,h,i)perylene, and benz(e)pyrene, and
2) 20% for all other compounds.
Both matrix spike and surrogate spike recoveries will be used in assessing quality assurance/qua lilyA control iforu^ERT'a : analytical >.work-
11.1.5 Duplicates
The laboratory will analyze 10% duplicate samples. Percent difference between duplicates will be calculated for each detected compound. The results will be plotted onto control charts and mean and standard deviation will be calculated.
11.2 Extended Analyses for Phenolics in GAC Plant
The laboratory will, on an ongoing basis, spike at least 5% of the samples to assess accuracy. For 1 to 20 samples per month, at least one spiked sample per month is required.
The concentration of the spike in the sample will be 100 pg/L. The percent recovery for each parameter will be compared with the corresponding QC acceptance criteria shown in Table 11-2. If any individual recovery falls outside the designated ranges, that parameter has failed the criteria.
If any parameter fails the acceptance criteria for recovery, a QC check standard containing each parameter that failed must be prepared and analyzed. The QC check sample will be prepared at a concentration of 100 pg/L for each parameter tdiich failed in deionized trater. The QC check sample will be analyzed and the percent recovery for each parameter calculated.
The percent recovery for each parameter in the QC check sample will be compared to the acceptance criteria in Table 11-2. If the recovery of any parameter falls outside the designated range, the analytical result for that parameter in the original unspiked samples is suspect and will not be used.
0252F PE-415

QUALITY ASSURANCE PROJECT PLAN Page: 102 of 125 Date: Jan. 1987 Number: QA E415 Revision: 0
TABLE 11-2
ACCEPTANCE CRITERIA - EXTENDED ANALYSES FOR PHENOLICS^
Acceptance Criteria
Parameter JX}
4-chloro-3-methylphenol 22-147
2-chloropheno1 23-134
2,4-dichlorophenol 39-135
.2^,4^i]iiethylphenol ^32-119
2,4-dinitrophenol D-191
2-methyl-4,6-dinitrophenol D-181
2-nitrophenol 29-182
4-nitrophenol D-132
Pentachlorophenol 14-176
Phenol 5-112
2,4,6-trichlorophenol^ 37-144
D = Detected: result must be greater than zero.
^Reprinted from Table 6, page 43392 of "Guidelines Establishing Test
Procedures for the Analysis of Pollutants Under the Clean Water Act",
Federal Register. Friday, October 26, 1984.
0252F PE-415

QUALITY ASSURANCE PROJECT PLAN Page: 103 of 125 Date: Jan. 1987 Number: QA E415 Revision: 0
The laboratory will also spike all samples with a minimum of three surrogate compounds and calculate the percent recoveries. On-going quality control charts plotting surrogate percent recoveries will be prepared. The control charts will be updated as sample surrogate recoveries are plotted, as a means of observing trends or changes in method precision. Control charts will be used to alert ERT to the need to check method procedures, but failure of a surrogate to fall within the 95% confidence limits of the ongoing control charts does not necessarily invalidate the sample data.
11.3 Expanded Analyses
i/The Expanded . Analyses required, .in this program will be oarriedv out with the associated ̂ internal quality control program as summarized in Table 11-3. The quality control checks encompass the use of method blanks, field blanks, matrix spikes, and duplicates for all the analyses conducted. In addition, the GC/HS based methods for Volatile Organics (EPA 624} and Acid/Base/Neutral Extractable Organics (EPA 625) will be conducted by spiking multiple surrogate recovery compounds in all samples. Specific details to be followed for each analysis are contained in the appropriate Method Reference, all of which have been included in Appendix B.
0252F PE-415

QUALITY ASSURAHCE PROJECT PLAN Page: 104 of 125 Date: Jan. 1987 Number: QA E415 Revision: 0
TABLE 11-3
EXPABDED ANALYSES INTERNAL
QUALITY CONTROL CHECKS
Recovery Matrix Method Field
Analytes Method Reference Surroeates Spike Blank Duplicate Blank
Volatile Organics EPA 6241 X3 X X X X
Acid, Base/Neutral Extractable Organics EPA 625^ X* X X X X
Priority Pollutant Metals EPA 200.7, 204.2, 206.2, 245.1.
. 270.2, 279.22
X X X X
Aasnonia iEPA 350.22 :X X .X X
Chloride EPA 325.22 X X X X
Sodium EPA 200.72 X X X X
Sulfate EPA 375.42 X X X X
Total Phenol 335.22 X X X X
Cyanide 335.22 X X X X
1"Guidelines Establishing Test Procedures for the Analysis of Pollutants Under the Clean Water Act" Federal Register. Friday, October 26, 1984.
2 "Methods for Chemical Analysis of Water and Wastes" EPA-600/4-79-020, March 1979 (Revised March 1983).
' l,2-dichloroethane-d4, benzene-d(, toluene-dg, and 4-broino fluorobenzene spiked at 50 ug/L.
* phenol-d5, 2-fluorophenol, 2,4,6-tribrofflophenol, nitrobenzene-ds, 2-fluorobiphenyl, and benzo(a)pyrene-d2^2 spiked at 100 vg/L in all samples.
0252F PE-415

QUALITY ASSURANCE PROJECT PLAN Pa&e: 105 of 125 Date: Jan. 1987 Number: QA E415 Revision: 0
12. PERFORMANCE AND SYSTEM AUDITS
ERT's Concord Analytical Chemistry Laboratory participates in a variety of interlaboratory testing and performance checks to provide periodic assessment of the effectiveness of the overall quality control program.
12.1 Interlaboratory Performance Surveys
Performance surveys conducted by the EPA and the Massachusetts Department of Environmental Quality Engineering (DEQE) constitute the bulk of interlaboratory comparisons.
• DEQE Performance .^valuations - Water .Supply - Semiannual (May .and ^^iNovember)
Trace Metals Pesticides Herbicides THMs Residual Free Chlorine Turbidity Total Filterable Residue Calcium (as CaC03) Alkalinity pH Corrosivity (9 20"C)
- Sodium
• EPA Performance Evaluations - Water Pollution - Semiannual (April and October)
Trace Metals Minerals Nutrients Orthophosphate
- Demands - Organics
Total Cyanide Oil and Grease
0252F PE-415

QUALITY ASSURANCE PROJECT PLAN Page: 106 of 125 Date: Jan. 1987 Number: QA E415 Revision: 0
ERT's performance is evaluated by the respective agency after each ' round of testing, and reported to ERT's Laboratory Quality Control Manager. The Laboratory Quality Control Manager summarizes the results in a report to the Corporate QA Manager who reports to upper management.
12.2 Periodic In-House Audits
In-house auditing is conducted by the Corporate QA Manager, and the National Laboratory QC Manager with the assistance of the Laboratory QC Coordinator. These audits occur at least every six months, and typically focus on a specific project. In-house audits take two forms - performance audits and systems audits. Performance audits involve submittal of blind ..spikes to -the laboratory, by the Quality Assurance Department for assessment •:of stialytLcal accuracy-. rSystems audits consist 'of- a tihorough>:ceview of vprbject procedures ̂^and;documen tat ion to. confirm that>work was perfopned in accordance with the Quality Assurance Project Plan and that adequate documentation exists to satisfy the project requirements.
12.2.1 Performance Audits
Audit Standards
As required on specific projects, the Quality Assurance Division provides spikes for analysis as independent check samples (audit standards). The QA Department prepares any audit standards that can be prepared readily from relatively non-hazardous, neat materials or certified concentrated standards. In some cases, preparation of reliable audit standards requires special facilities and equipment due to the hazardous nature of the materials and/or the requirement for precise measurement of minute quantities. In such cases, audit standards are obtained from the USEPA, Environmental Monitoring and Support Laboratory (EMSL), Cincinnati, Ohio, or from an equivalent source. The nature of the audit standards and the frequency of performance audits are specified in the Quality Assurance Plan of each project for which performance auditing is required. When practical, audit standards are be provided in matrices resembling real project sample matrices, and undergo the full sample preparation and analysis procedure. However in many cases this is impractical, and it is necessary to submit audit samples as extracts, for analysis only. All measurable constituents in the audit standards should be within the expected range of concentrations to be encountered in the real samples (or in the extracts). They must be within the linear calibration range of the analytical equipment to be used.
0252F PE-415

QUALITY ASSURANCE PROJECT PLAN Page: 107 of 125 Date: Jan. 1987 Number: QA E415 Revision: 0
Documentat ion ' >
Performance audit standards are submitted to the Laboratory Quality Control Coordinator by the Quality Assurance Manager or the Project Quality Assurance Officer, in the appropriate, labeled containers. The label on each audit standard contains the following information (as applicable):
ERT-Prepared Standards
Date prepared Initials of preparer Project number Audit standard .number 'Analysis to :be .performed
EPA-Supplied Standards
e EPA EMSL identification number • Project number • Audit standard number • Analytical method to be employed
All audit standards submitted to the Laboratory are Logged in the Quality Assurance Department in a bound logbook. The following information is entered for each standard:
• Project number • ERT audit standard number • EPA EMSL identification number (if applicable) • Date prepared or received • Description of matrix • Name and quantity of each measurable constituent • Identification and expiration date of each primary standard used • Identification of any analytical equipment used (e.g. analytical
balance) e Date submitted to laboratory • Analytical method to be employed
Interpretation of Performance Audit Results
The audit standards are analyzed by the same procedures as the real samples. Analytical results are included in the analytical data packages.
0252F PE-415

QUALITY ASSURANCE PROJECT PLAN Page: 108 of 125 Date: Jan. 1987 Number: QA E415 Revision: 0
The Project Quality Assurance Officer obtains the analytical results from the Laboratory Quality Control Coordinator and compares them to the' , true concentrations entered for each audit standard in the Quality Assurance Logbook. For each measurable constituent of each audit standard the percent recovery is determined. These results are interpreted as the accuracy of analyses represented by the performance audit.
12.2.2 Systems Audits
There are two different types of laboratory systems audits. Systems audits of laboratory operations (Operations Audits) are performed at a minimum frequency of once every six months. Operations audits address general laboratory operations and conformance to the applicable methodolo&ias.
'Systems 'Audit Procedures
The systems audits are performed by the (Quality Assurance Manager or his qualified designee. The Laboratory Quality Control Coordinator participates in the audits as the laboratory's representative. It is the QC Coordinator's responsibility to provide the auditor with access to relevant data files, facilities and records, and to assist the auditor in obtaining an objective assessment.
Audit checklists are used to ensure that all salient points are addressed and documented. The checklists are filled out legibly and reproducibly, in ink, by the auditor, and are signed and dated by the auditor when completed. The operations audit checklist is based on EPA laboratory evaluation criteria.
Audit checklists will cover at least the following areas:
• Operations Audit
- Personnel qualifications and training records Adequacy of laboratory facilities, including work space, lighting, ventilation, and supplies
- Organization of lab facilities, including cleanliness, chemical storage, and waste disposal Maintenance and calibration recordkeeping for analytical equipment
0252F PE-415

QUALITY ASSURAMCE PROJECT PLAN Page: 109 of 125 Date: Jan. 1987 Number: QA E415 Revision: 0
Safety (facility configuration and practices) * General operations, including glassware cleaning, inventory and checking of reagents and standards, and storage procedures Recordkeeping, including sample log-in and tracking, traceability of standards, control charts, data packages, and organization of filing system
Project Audit
Sample log-in and chain-of-custody records Sample storage procedures and records
-a Sample preparation and/analysis procedures 'Method wa1idationi(where appiicable) Control charts Precision and accuracy assessment Method blanks, reagent blanks, duplicates, check samples, fortifications, surrogates," etc. Calibration Data packages Analyst qualifications Data validation and reporting
0252F PE-415

QUALITY ASSURANCE PROJECT PLAN Page: 110 of 125 Date: Jan. 1987 Number: QA E415 Revision: 0
13. PREVENTIVE MAINTENANCE
Since instrumental methods of analysis require properly maintained and calibrated equipment, the operation and maintenance of modem analytical instrumentation is of primary importance in the production of acceptabLe data. In order to provide this data; ERT subscribes to the following programs:
• maintenance agreements/service contracts with instrument manufacturers
• laboratory preventive maintenance program
^•IB-l iService;:Con'tracts
Analytical equipment utilized by ERT laboratory personnel for this project are covered by maintenance agreements with the instrument manufacturers. These manufacturers provide for both periodic "preventive" service calls as well as the non-routine or emergency calls.
13.2 Instrument Logbooks
Individual instrument logbooks are maintained for each piece of equipment and located near the instrument. General information contained in the logbooks include:
• Inventory information: equipment name, model number, serial number, manufacturer, date of acquisition, original cost
• Service tasks and intervals: cleaning, calibration, operation based on the manufacturer's recommended schedule, and previous laboratory experience
• Service record: date of breakdotm, date of return to service, do%mtime, problems, repairs, cost of repairs, %#ho performed the repairs, parts required, etc.
e calibration/performance checks e daily operational notes
Analysts are referred to manufacturers* operating manuals for specific procedures to be followed in the operation and/or maintenance of the individual instruments.
Laboratory preventive maintenance includes any tasks that can be performed in-house, i.e., systematic cleaning of component parts as recommended in the instrument manual. If problems cannot be corrected by laboratory personnel, the instrument service representative is contacted and a service call requested to correct the problem.
0252F PE-415

QUALITY ASSURANCE PROJECT PLAN Page: 111 of 125 Date: Jan. 1987 Number: QA E415 Revision: 0
14. SPECIFIC PROCEDURES TO ASSESS DATA PRECISION. ACCURACY AND COMPLETENESS
A quality control program is a systematic process that controls the validity of analytical results by measuring the accuracy and precision of each method and matrix, developing expected control limits, using these limits to detect errors or out-of-control events, and requiring corrective action techniques to prevent or minimize the recurrence of these events.
14.1 External and Internal Components
'::The' accuracy.^and precision cf sample measurements are inf luenced by iboth .extenlal ii-and mntemai sfactors,. ::'Extemal factors or errors .are bhose associated mth'field collection ahd sample transportation. Internal factors or errors are those associated with sample preparation and analysis. External factors are defined briefly in Section 14.1.1. Internal factors are defined in Section 14.1.2. These internal components associated with laboratory practices, procedures, and controls of data quality confidence are presented in further depth.
14.1.1 External Components: Accuracy and Precision Measurements
The results for quality control samples taken in the field represent the best estimates of accuracy and precision for the samples, since these values reflect the entire process from sample collection through sample analysis. Below is a brief description of the information provided by each of these control samples:
e Field matrix spike - provides an estimate of bias based on recovery; includes matrix effects associated with sample preservation, shipping, preparation, and analysis.
e Field collected samples or replicates - independent samples collected at the same point in space and time. These give the best measurement of precision for sanq>le collection through analysis.
e Field duplicate - a sample that has been divided into two or more portions. The analytical values obtained for each of these portions gives a second best measurement of precision for the entire sampling and analysis scheme.
0252F PE-415

QUALITY ASSURAHCE PROJECT PLAN Page: 112 of 125 Date: Jan. 1987 Number: QA B415 Revision: 0
14.1.2 Internal Components: Accuracy and Precision ^ Measurements
The results of quality control samples created in the laboratory represent estimates of analysis and precision for the preparation and analysis steps of sample handling. This section tlescribes the quality control-type information provided by each of these analytical measurements. The frequency of each of these measurements is discussed in Section 11.0, Internal Quality Control Checks. »
Accuracy Measurements
-sLaiboratt>ry f®t±if ioatitms .-.^i>roviide an lastiroate of bias l>ased on /•rectwery :!of i^the xompounds v analyzed if or ?the,:sample. batch, 'incorporating matrix effects associated with sample preparation and analysis.
• Surrogates - provide an estimate of bias based on recovery of similar compounds, but not the compounds analyzed, for each sample, incorporating matrix effects associated with sample preparation and analysis.
a Internal standard - an analyte that has the same characteristics as the surrogate, but is added to each sample In a batch, just prior to analysis. It measures bias or change in instrument performance from sample to sample, incorporating matrix effects associated with the analysis process only. Analysis matrix spikes - The analysis matrix spike is added prior to analysis. These spikes are similar to the internal standard; however, the analyte used is the same as that being analyzed and usually is added to a selected few samples in a batch of analyses. It incorporates matrix effects associated with the analysis step only.
Precision Measurements
• Laboratory duplicates - a sample that has been homogenized and split into two equal portions before the method sample preparation process. It measures sample precision associated with the preparation through analysis.
e Analysis replicate - a sample solution or extract that has been split before analysis; measures sample precision associated with the analysis only.
K
0252F PE-415

QUALITY A5SURAMCE PROJECT PLAN Page: 113 of 125 Date: Jan. 1987 Number: QA E415 Revision: 0
14.2 Control Charts
Control charts are quality control tools which graphically display the progression or' movement of similar points taken at regular intervals in a process or over time. Both accuracy >and precision control charts are maintained for each method and matrix. .
14.2.1 Accuracy
Accuracy charts are maintained for surrogate and laboratory fortification recoveries. Each sample is identified by the date it was prepared and.'^^analyzed and. its '£RT sample tuimber. /The amount for each method and matrix is ̂approximately five times the <MDL. -Values are plotted as percent recovered by computer program on an x-y graph. The mean, warning and control limits are presented graphically to enable a concise review of accuracy of the analysis.
14.2.2 Precision
Precision charts are maintained for laboratory duplicates. Both samples are identified by the date(s) prepared and analyzed and their ERT number. Values are plotted as percent difference on an x-y graph. The mean, warning and control limits are presented graphically to enable review of the precision of the analysis.
14.2.3 Limits
Both upper and lower warning limits and upper and lower control limits are established to aid in interpretating a suspicious or an out-of-control event. Warning limits express a narrower confidence interval and are used to warn the analyst or supervisor of possible system inconsistencies or failures, before an out-of-control event occurs. Control limits express the outer limits of excepted method variability.
14.3 Suspicious/Out-of-Control Events
Graphing and connecting successive data points on control charts enables the laboratory to detect many types of suspicious and out-of-control situations. These events can be caught by monitoring for the following: outliers (suspicious and out-of-control), runs (suspicious), trends (suspicious), and periodicity (suspicious).
0252F PE-415

QUALITY ASSUBANCE PROJECT PLAN Page: 114 of 125 Date: Jan. 1987 Number: QA E415 Revision: 0
14.3.1 Outliers \
There are two types of outliers: any particular point that falls outside the control limits or any point that falls outside the warning limits. A point that falls outside the control limits is classified as an out-of-control event; a point that falls outside the warning limits is classified as a suspicious event.
14.3.2 Runs
A run is defined as a series of points that line up on one side of the central line (the mean). Any run that has a length of seven points is indicative of a potential abnormality in the process, a suspicious event. A ;run canisuggest.iseveral- potemtialV^oblems-'^^s^ as a rl^ak in the system, .elevated contamination, or incorrect dilutions of standards.
14.3.3 Trends
A trend is defined as a series of points that are marked by an unbroken rise or fall. Any trend with a length of five points is classified as a suspicious event. A trend may indicate a change in instrument sensitivity due to a dirty source or injection port or standard degradation, to name a few.
14.3.4 Periodicity
Periodicity is a term used to describe a recurring pattern of change over equal intervals. This occurrence may be of any length or amplitude; thus, careful observation of the control chart is necessary.
14.4 Completeness
The City will submit to EPA a minimum of 90% of the analytical data required under this QAPP, with the following exception. Analytical data required for active drinking water sources will be 100% complete.
0252F PE-415
QUALITY ASSURANCE PROJECT PLAN Page: 115 of 125 Date: Jan. 1987 Number: QA E415 Revision: 0
15. CORRECTIVE ACTION
Corrective actions are required whenever an out-of-control event or potential out-of-control event is noted. The investigative action taken is somewhat dependent on the analysis and the event.
Generally, out-of-control events or potential out-of-control events are noted on an out-of-control event form (see Figure 15-1). This form is part of the data package and, thus, must be completed prior to data approval. If an out-of-control event does occur during analysis, for instance, a surrogate recovery falls outside the expected range, the analyst must describe on this form: the event, the investigative and corrective action taken, and the cause of the event, :and notify -the ̂ laboratory quality .control coordinator (QCC).. • In -son^e .-cases , -iinves:ti%at'ion of.janr out-of-control event wil 1 .reveal no problems. In such cases, only the event and the investigative action is recorded. If an out-of-control event is discovered during data package review, the QCC notifies the supervisor for corrective action.
15.1 Low-level PAH Analyses/Extended Analyses/Non-Criteria PAH Analyses
15.1.1 Surrogates
The laboratory will use the surrogates: naphthalene-dg; fluorene-d^o ^nd chrysene-di2 ^t a sample concentration level of 10 ng/L (ppt) or 20 ug/L (ppb). ERT will calculate the percent recovery of each surrogate for each sample. Corrective action will be taken whenever the surrogate recovery for any one or more surrogates is outside the following acceptance criteria:
Surrogate Acceptance Criteria % Low-level Non-criteria
Naphthalene-dS 14-108 25-175 Fluorene-dlO 41-162 25-175 Chrysene-dl2 10-118 25-175
The following corrective action will be taken when required as stated above:
a) (Hieck calculations to assure there are no errors; b) Check internal standard and surrogate solutions for degradation,
contamination, etc., and check instrument performance; c) Reanalyze the sample or extract if the steps in part a) or b) fail
to reveal a problem. If reanalysis of the extracts yields * surrogate spike recoveries within the stated limits, then the reanalysis data will be used. Both the original and reanalysis data will be reported.
0252F PE-415

QUALITY ASSURANCE PROJECT PLAN Page: 116 of 125 Date: Jan. 1987 Number: QA E415 Revision: 0
Figure 15-1 Out-of-Control Event Form
Date Tine _Analyst_
Mfetbod Matrix
•Initials .:of iniivldual .initially.;notiTied
•Suspect lab -ntEbers
Oit-cf-ccntrol lab numbers
Indication of out-of-ccntrol event
Cause detezadned
Action ta]cen
Date and tine CAC notified
Date and tine ccnteol resiaaed
Precision criteria net Accuracy criteria net_
Beanalysis of data ccnpleted
0252F PE-415

QUALITY ASSURANCE PROJECT PLAN Page: 117 of 125 Date: Jan. 1987 Number: QA E415 Revision: 0
d) If a), b) or c) do not correct the problem, the data for that ^ sample will be reported but will not count towards satisfying the monitoring requirements of the RAP.
15.1.2 Matrix Spikes
ERT will use eight representative, compounds spiked into a sample of water collected in the field. These compounds and the spiking levels are listed below:
PPT PPB Naphthalene 100 ng/L 50pg/L Pluorene 20 50
^ .Chrysene 20 50 ''Bertro (g ,'h i i ) pery lene 20 50 Indene 20 50 Quinoline 20 50 Benzo(e)pyrene 20 50 2-methyl naphthalene 20 50
Naphthalene is spiked at a higher level in the ppt method, because of the higher method detection limit.
The matrix spike criteria for data validity are as follows:
e The average of the percent recoveries for all eight compounds must fall between 20 and 150 percent.
e Only one compound can be below its required minimum percent recovery. These minimum percent recoveries are:
1) 10% for chrysene, benzo(g,h.i)perylene, and benzo(e)pyrene, and
2) 20% for all other compounds.
If the matrix spike criteria are hot met, the matrix spike analysis will be repeated. If the subsequent matrix spike analysis meets the criteria, the data will be considered valid. Both matrix spike and surrogate spike recoveries will be used in assessing quality assurance/quality control for ERT's analytical work.
15.2 Extended Analyses for Phenolics in GAC Plant
15.2.1 Surrogates
The laboratory will spike all samples with a minimum of three surrogate compounds and calculate the percent recoveries. On-going quality control charts plotting surrogate percent recoveries will be prepared. The control charts will be updated as sanq>le surrogate recoveries are plotted, as a
0252F PE-415

QUALITY ASSURANCE PROJECT PLAN Page: 118 of 125 Date: Jan. 1987 Number: QA E415 Revision: 0
means of observing trends or-changes in method precision. Control charts will be used to alert ERT to the need to check method procedures, but the failure of a surrogate to fall within the 95% confidence limits of the ongoing control charts does not necessarily invalidate the sample data.
15.2.2 Matrix Spikes
The percent recovery for each parameter in the matrix spike will be compared with the corresponding QC acceptance criteria shown in Table 15-1. If any individual recovery falls outside the designated ranges, that parameter has failed the criteria. If any parameter fails the acceptance criteria for recovery, a QC check standard containing each parameter that failed must be prepared and analyzed. The QC check sample will be prepared vat a ::;concenbrablonv of ̂ 0 ug/L^vfor jeach ̂ parameter which^;failed,, an oleionized water. viTheiiQC -Oheck sample will be analyzediandlthe percent recovery for each parameter calculated.
The percent recovery for each parameter in the QC check sample will be compared to the acceptance criteria in Table 15-1. If the recovery of any parameter falls outside the designated range, the analytical result for that parameter in the original unspiked samples will be reported but will not count towards satisfying the monitoring requirements of the RAP.
15.3 Expanded Analyses
Table 15-2 shows the analytes to be measured for expanded analyses This section discusses the criteria to be used for evaluating the results of the quality control analyses discussed in Section 11.3 and the corrective actions to be taken whenever a sample or samples fail to meet the criteria.
15.3.1 Volatile Organics
Volatile organics will be analyzed according to EPA Method 624 (see Appendix B), which contains specific quality control procedures and criteria. Corrective action will be taken Whenever the results of the required quality control, as set forth in Section 8 of EPA 624, fail to meet the compound specific acceptance criteria given on Table 5 of EPA 624.
The percent recovery for each parameter in the matrix spike will be compared with the corresponding QC acceptance criteria shown in Table 5 of EPA 624. If any individual recovery falls outside the designated ranges, that parameter has failed the criteria.
If any parameter fails the acceptance criteria for recovery, a QC check standard containing each parameter that failed must be prepared and analyzed 0^ check sample will be prepared at a concentration of jlOQ ua/L for each parameter Which failed in deionized %#ater. The QC check sample will be analyzed and the percent recovery for each parameter calculated.
0252F PE-415

QUALITY ASSURANCE PROJECT PLAN Page: 119 of 125 Date: Jan. 1987 Number: QA EAIS Revision: 0
TABLE 15-1
ACCEPTANCE CRITERIA - EXTENDED ANALYSES FOR PHENOLICS^
Parameter
Acceptance Criteria
iiy
4-chloro-3-methylphenoi
2-chlorophenoI
2,4-dichlorophenol
. 2 « 4-dimei thylpheno 1
2 ̂4^'dinitrophenol
2-methy1-4,6-dinitropheno1
2-nitrophenol
4-nitrophenol
Pentachlorophenol
Phenol
2,4,6-trichlorophenol
22-147
23-134
39-135
r32-.T19
D-191
D-181
29-182
D-132
14-176
5-112
37-144
D = Detected; result must be greater than zero.
^Reprinted from Table 6, page 43392 of "Guidelines Establishing Test
Procedures for the Analysis of Pollutants Under the Clean Water Act'
Federal Register. Friday, October 26, 1984.
0252F PE-415

QUALITY ASSURAMCE PROJECT PLAN Page: 120 of 125 Date: Jan. 1987 Number: QA E415 Revision: 0
TABLE 15-2
EXPANDED ANALYSES ANALYTE LIST AND
METHOD REFERENCE
Analvtes Method Reference
Volatile Organics EPA 624^
Acid, Base/Neutral Extractable Orxanics EPA 625^
'Priority £:Pold<utant .'Metals iEPA;.200.7., i204 .2., 206.2, 245.1, 270.2, 279.22
Ammonia EPA 350.22
Chloride EPA 325.22
Sodium EPA 200.72 '?
Sulfate EPA 375.42
Total Phenol 335.22 420. |
Cyanide 335.22
^ "Guidelines Establishing Test Procedures for the Analysis of Pollutants Under the Clean Water Act" Federal Register. Friday, October 26, 1984.
2 "Methods for Chemical Analysis of Water and Wastes" EPA-600/4-79-020, March 1979 (Revised March 1983).
0252F PE-415

QUALITY ASSURANCE PROJECT PLAN Page: 121 of 125 Date: Jan. 1987 Number: QA E415 Revision: 0
The percent recovery for each parameter in the QC check sample will be compared to the acceptance criteria in Table 5 of EPA 624. If the recovery of any parameter falls outside the designated range, the analytical result for that parameter in the original unspiked samples will be reported but will not count towards satisfying the monitoring requirements of the RAP.
The laboratory will also spike all samples with a minimum of three surrogate compounds and calculate the percent recoveries. On-going quality control charts plotting surrogate percent recoveries will be prepared. The control charts will be updated as sample surrogate recoveries are plotted, as a means of observing trends or changes in method precision Control charts will be used to alert ERT to the need to check method procedures, but failure of a surrogate to fall within the 95% confidence limits of the ^ongoing :'ContT'oI ̂charts idoes:^ not 'necessarily 2in«allidate jthe sample data.
15.3.2 Acid, Base/Neutral Extractable Organics
Extractable organics will be analyzed according to EPA Method 625 (see Appendix B). EPA Method 625 contains detailed quality control procedures. All samples analyzed for extractable organics will include the quality control requirements outlined in Section 8 of EPA 625. Corrective action will be taken whenever the matrix spike recovery compounds (a rotating representative group of 10-12 parameters) fall outside the ranges for acceptance criteria in Table 6 of EPA 625. If any parameter fails the acceptance criteria for recovery, a QC check standard containing each parameter that failed must be prepared and analyzed. The QC check sample will be prepared at a concentration of 100 ug/L for each parameter which failed, in deionized water. The QC check sample will be analyzed and the percent recovery for each parameter calculated.
The percent recovery for each parameter in the QC check sample will be compared to the acceptance criteria in Table 6 of EPA 625. If the recovery of any parameter falls outside the designated range, the analytical result for that parameter in the original unspiked samples will be reported but will not count towards satisfying the monitoring requirements of the RAP.
The laboratory will also spike all samples with a minimum of three surrogate compounds and calculate the percent recoveries. On-going quality control charts plotting surrogate percent recoveries will be prepared. The control charges will be updated as sample surrogate recoveries are plotted, as a means of observing trends or changes in method precision. Control charts will be used to alert ERT to the need to check method procedures, but failure of a surrogate to fall within the 95% confidence limits of the ongoing control charts does not necessarily invalidate the sample data.
0252F FE-415

QUALITY ASSURAHCE PROJECT PLAH Page: 122 of 125 Date: Jan. 1987 Number: QA E415 Revision: 0
15.3.3 Priority Pollutant Metals ' ̂
Priority pollutant metals method references are shovm on Table 15-2. All samples analyzed for metals will follow the detailed quality control procedures outlined in the individual methods. The methods are included in Appendix B. Corrective action will be taken %#henever the percent recovery for individual metals for matrix spike? is outside the range of 75-125%. Whenever a matrix spike fails to meet the criteria for any metal, the following corrective action will be taken:
a) Check calculations to assure there are no errors. b) Check standards for degradation, contamination, etc., and check
iviiistxniment performax^e. : Klf Jt^^sstieps dn ̂a?) ̂or vreveal «T^pt^ w:'isample^wlll' be prepared by spiking'deionixed water-with those metals which failed to meet the criteria in the original matrix spike.
d) The QC check sample will be analyzed and the results compared to the criteria. If the QC check standard meets the criteria no further corrective action will be taken.
—If any metal contained in the QC check standard fails the criteria, the data for that metal for those samples associated with the matrix spike will not be valid.
15.3.4 Other Inorganics
Method references for ammonia, chloride, sodium, sulfate, total cyanide, and total phenol are shown on Table 15-2. All samples analyzed for these parameters will follow the quality control procedures outlined in those methods and discussed in Section 11.3 of the QAPP. The methods are included in Appendix B. Corrective action will be taken whenever the percent recovery for the analyte in question for matrix spikes is outside the range of 75-125%. Whenever a matrix spike fails to meet the criteria the following corrective action will be taken:
a) Check calculations to assume there are no errors. b) Check standards for degradation, contamination, etc., and check
instrument performance. c) If the steps in (a) or (b) fail to reveal a problem, a QC check
standard will be prepared by spiking deionized water with the analyte in question.
d) The QC check standard will be analyzed and the result compared to the criteria. If the QC check standard meets the criteria no further corrective action will be taken.
e) If the QC check standard fails the criteria, the data for samples associated with that matrix spike for the analyte in question will be considered invalid.
0252F PE-415

QUALITY ASSU8ANCE PROJECT PLAH Page: 123 of 125 Date: Jan. 1987 Number: QA E'415 Revision: 0
15.4 Other Corrective Actions
These sections discuss corrective actions kdiich will be taken in the event that a sample or sample extract is lost or destroyed during shipment, storage or analysis, or in performance and system audits.
15.4.1 Samples
In order to minimize the possibility of sample destruction during shipment, six 1-liter bottles will be taken for all low-level (ppt) samples. For all sampl'es,. field blanks^ ̂ duplicates, ;^<and ̂ m)atr;ix spikes, ^subsequent extrac tion >and enalys is > will itbe conducted . ion :^four .intact 1-liter ,!bottles. ,yAli field blanks will be collected in duplicate. One field hlank will be analyzed with the sample set and the duplicate will be extracted and .held. In the event that the field blank is lost during analysis or invalidated, the duplicate field blank will be analyzed and reported.
If less than four liters of a sample remains after shipment and storage for analysis, the City will be notified and another sample will be collected and shipped to the laboratory for analysis. The analysis report for the sample batch containing the affected sample will clearly note in the discussion section that a replacement sample was taken.
15.4.2 Sample Extracts
If a sample extract is broken or lost during analysis, the City will be notified and another sample will be collected and shipped to the laboratory for analysis if necessary, depending upon the data completeness requirements for the specific sample type. The analysis report for the sample batch containing the affected sample will clearly note in the discussion section that a replacement sample was taken.
15.4.3 Quality Control Samples
If a solvent blank, method blank, or matrix spike is lost or broken during analysis, a replacement QC sample will be sampled and analyzed. The analysis report will clearly note that a replacement QC sample was analyzed.
If a field blank is lost or broken during shipment, storage, or analysis, no replacement will be analyzed. The analysis report for the sample batch associated with the field or shipping blank will clearly note in the discussion section why the data is unavailable. If the interpretation of the data from samples associated with the affected field blank warrant it, resampling of the entire batch may be conducted. This decision would be reached by concurrence of the EPA, MPCA and City project leaders.
0252F PE-415

QUALITY ASSURANCE PROJECT PLAN Page: 124 of 125 Date: Jan. 1987 Number: QA E415 Revision: 0
15.4.4 Performance and System Audits
Each systems audit is immediately followed by a debriefing, in which the auditor discusses his findings with the laboratory representatives. The debriefing serves a two-fold purpose. First, laboratory management is afforded an early summary of findings, which allows them to begin formulating corrective strategies, and second, the auditor has a chance to test preliminary conclusions and to correct any misconceptions before drafting his report.
The systems audit report (which may or may not contain performance audit findings) is first issued in draft to the Laboratory Quality Control Coordinator. The QC Coordinator distributes the draft to the Laboratory Manager and appropriate supervisors to solicit comments and/or rebuttals. These xesponsesv.are vYorwarded, in'writing, to .the auditor.. The auditor rmakes ct«visions .tn:-.thei/draft., on the basis of these responses., vat his discretion. Any points of disagreement between the QA department and the laboratory organization are resolved through discussion before the final report is issued. Written responses to the draft report are attached to the final report as an appendix.
Final audit reports are issued to project management and to corporate management. Items requiring corrective action are documented on a Corrective Action Request Form addressed to the project manager. One copy is retained by QA upon issuance. The project manager receives the original and one copy. When satisfactory progress has been achieved on each requested action, the project manager or designee enters descriptions of actions and results on the form, then retains the copy and returns the original to QA to close the loop.
Results of interlaboratory performance surveys and in-house audits, along with unresolved corrective action items are summarized in a quarterly report from the Quality Assurance Manager to the Executive Vice President.
0252F PE-415

QUALITY ASSURANCE PROJECT PLAN Page: 125 of 125 Date: Jan. 1987 Number: QA E415 Revision: 0
16. QUALITY ASSUARANCE REPORTS TO MANAGEMENT
The ERT Quality Assurance Department is completely independent of line function. Its manager reports directly and exclusively to the ERT Executive Vice President. The Laboratory Quality Control Coordinator is appointed by the Chemistry Division Quality Control Manager who reports directly to the Division Director with ancillary responsibilities to the Laboratory Manager and the Corporate Quality Assurance Manager.
Reports summarizing any changes in quality control procedures and guidelines, updated control limits and any deviations are made on a periodic basis to both laboratory and corporate management. These occur through a /regular quarterly report from the Laboratory/'QC- Coordinator to .the Division :QC Manager. Copies of vthis report are also aubnritted to the Corporate QA Manager, the'Division.. Director, the Laboratory Manager and iSupervisors. Should the circumstances warrant more frequent communication between the laboratory QCC, the QC Manager or, any other persons in management, both verbal and written communication will be implemented.
16.1 Performance and System Audits
Final performance and system audit reports are issued to project management and to corporate management. Items requiring' corrective action are documented on a Corrective Action Request Form addressed to the project manager. The Corrective Action Request is a three-part NCR-type form. The first copy is retained by the Quality Assurance Department upon issuance. The project manager receives the original and one copy. When satisfactory progress has been achieved on each requested action, the project manager or designee enters descriptions of actions and results on the fotmi, then retains the copy and returns the original to the Quality Assurance Department to close the loop.
Results of interlaboratory performance surveys and in-house audits, along with unresolved corrective action items are summarized in a quarterly report from the Quality Assurance Manager to the Executive Vice President.
0252F PE-415