quality-assurance system for cement-aggregate...
TRANSCRIPT

Quality-Assurance System for Cement-Aggregate Concrete
Charles D. Fehnel, Lone Star Industries, Inc., Greenwich, Connecticut
The concrete construction industry is unique because it involves qualitycontrol systems that must be exercised on the production and performance of individual materials {cement and aggregate) and also of concrete, the ultimate product in which these materials are used. Therefore, specifications written for one material will generally affect the performance and ultimate consumer cost of all three materials because of the degree of quality control required for each material. To demonstrate the effect specifications may have on the ultimate cost to the consumer, examples from a concrete supplier's quality-control and quality-assurance program are presented. The equipment and manpower required for carrying out these programs and the ultimate effect of these requirements on the economics of product processing are described.
Prior presentations have dealt with the significant aspects of quality-assurance programs for individual components. As a producer of cement and other building materials, we are keenly aware of the problems associated with the production of these components. As a supplier of these mate1·ials to the construction industry, we have likewise been keenly 11w11rP of t'1" pl:'rform.?.rrre requirements necessary to make these products acceptable in the marketplace. For this reason, we look at quality-assurance programs from a broader viewpoint. The relation between the components and the system plays a significant part in our ability to produce a quality product that can be sold competitively in the marketplace.
Techniques for quality control have been consistently improved through the years. Improved production, process control, monitoring, testing, and data processing equipment and techniques have been the basic factors in our ability to establish new process and product performance standards. In cement plants, for instance, quality-control systems control and monitor the functions of quarrying, proportioning and blending at two stages, raw grinding, burning and cooling, finish grinding, and storing and withdrawing cement. For each function, specific sampling and control testing procedures are carried out and documented. Our particular control
Publication of this paper sponsored by Committee on Quality Assurance and Acceptance Procedures.
62
system involves almost 23 000 man-hours of work annually. Backup technical assistance involves at least 10 000 man-hours of work by our research laboratory personnel.
Depending on the degree of sophistication built into the system control, the data are collected, recorded, and analyzed either manually or automatically through the use of computers for maintaining control over the operating parameters. In addition to the traditional cementtesting equipment, X-ray, atomic absorption, DTA, microscopic, and mineralogical tests are also conducted.
A diagram of the cement process flow and the qualitycontrol function exercised at various stages is shown in Figure 1. We have established separate standards for each production phase. In effect, each department has its own quality-assurance or quality-control program. Standard deviations and coefficients of variation have been the basic statistical tools for evaluating the variations in the chemical and physical properties of the l"I.Ol"'nOnt Tho ronn+....-nl An+t:1 ""'rl ....,.,...,.......,.1,...;,.. ... ...,1,..,...,u.- .;...,. ,;i.;,..,.~-.-. ............................. .... ..... '"' "'..., ....................................................... 5 ......... .t' ..... .a.~o 0.1..avYV.a..1. .a..1.1. ..&. .1.5u,1.c
2 are used for visual-trend studies. At each plant, quality-control personnel observe these trends and are responsible for controlling them.
In the aggregate industry, we have similar controls over the production process with particular emphasis on size reduction (crushing), beneficiation, and size gradation. For concrete, the emphasis is placed on the proper blending of materials of a given quality so that a concrete of a defined quality is produced,
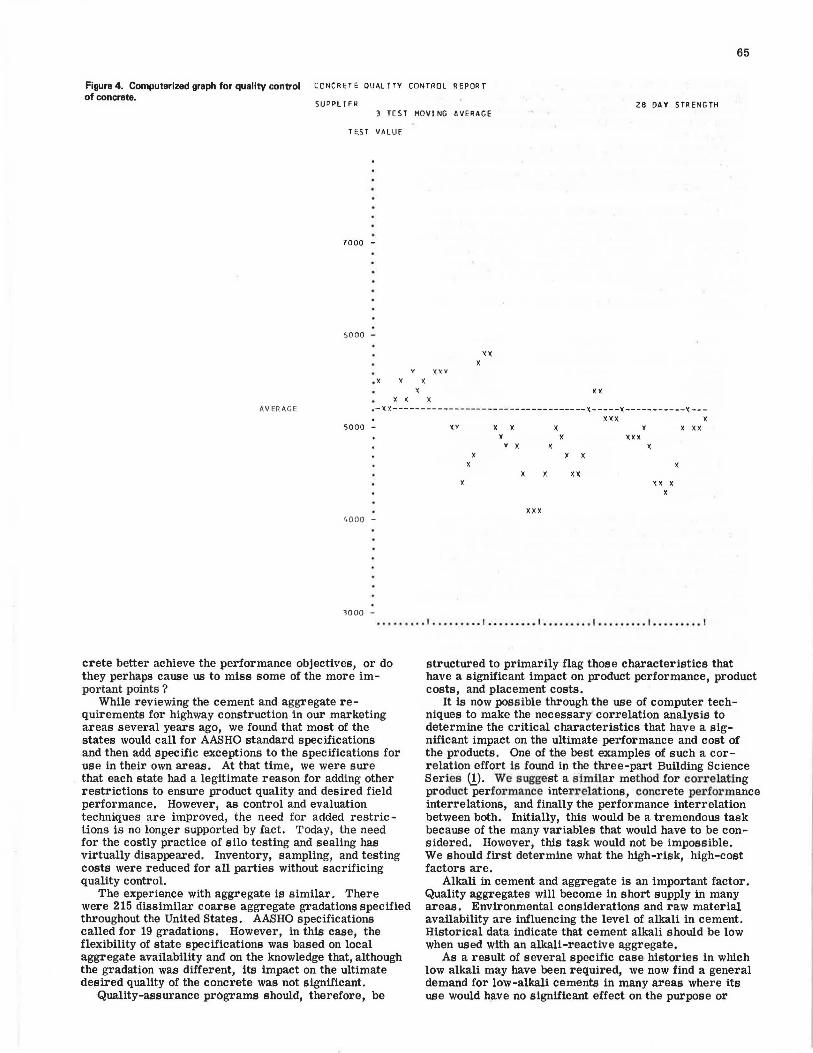
Concrete control data and graphics, similar to those based on the American Concrete Institute (ACI) code, are prepared. Examples of such information are shown in Figures 3 and 4. Our desire is to maintain a low standard deviation from the norm. We believe that greater flexibility can be allowed in specifications without sacrificing quality standards.
To further strengthen these quality-assurance procedures, test programs are established to evaluate the testing personnel and equipment, sine e the evaluation cone erns the testing agreement between testing laboratories and testing personnel. Many laboratories, like ours, are certified by the Cement and Concrete Reference Laboratories of the National Bureau of Standards,
Therefore, quality-assurance programs for individual

Figure 1. Quality-control systems for process flow, sampling, and control loops.
SAMPLES
(I)
MATERIALS 1, 2 .
CONTROL
QUARRY (*
Limestone Uaeable Overburden (Alumina & Iron)
Chemical Composition by blending materials in rough predetermined proportions.
SAMPLES
(•) COOLING
(V) -- J MATERIALS
Clinker
CONTROL Chemical Composition and clinker quality
Material Flow Control Loop
(*) Sample Point
PROPORTIONI NG BLENDt!IG
(U l
1. 2.
Quarry Rock Purchase Materials
a. Sand b, Iron Ore c, Useable Overburden
(Alumina & Iron)
Chemical Composition Volumetric proportioning and blending of materials in predetermined amounts .
PROPORTIOlllNG
RAW GRINDING III
Slurry Raw Hix
Fineness Water Content Chemical Composition
BLENDING FINISH GRINDING (VI) ...._V ... I .. 1---.--- -a _.__ __ _
1 , Clinker Cement 2. Gypsum 3. Additives
1, Gypsum Addition 2. Fineness
• I
--1
(*)
so3 content and chemical composition with volumetric and gravimetric proportioning,
3. Chemical Composition 4. Physical Characteristics
Figure 2. Computerized production analysis report of type 1 cement.
• CHE•ICAL ANALYSIS . C ZF
l V
PROPORTIONING BLENDING
---Slurry Raw Hi x
Chemical Composition Volumetric proportioning and blending of slurry to predetermined set point .
CEMENT STORAGE VIlI
HIPMENTS
Cement
R.lndom c hecks of shipments for specification conformance .
FREE INS T NO !:iC!:illl::t :.l~ ALiLl.1 f.UCll .[.AQ !lliD .SDl Lll.S.S lil.IAL f. a AL£ C.l.S. C.ll C.ll UAf. i;Ailli J:AD au lilAZll .UO AU Ill
JUL V •21. 7 l 5,0d 2. JI M,1l l, 05 •2.<:.6 l,1 4 ~s.o 2,46 2,94 2 . 20 52,6 22 .s 9 .6 1.0 s.o , 6 1 .42 .09 .12 .56 19 AUGUST 2 l .42 5, lJ 2,)1 b4 ,53 l, Jq 3.22 l. 3 5 99.0 2,48 2.89 2,2l 53. 2 21,3 9,6 1.0 5,5 . 12 .38 .10 .13 .58 11 SEPTEM~ER ll. 33 5,Qq 2.26 64,63 , 95 3 .21 t .4 3 99,0 2,49 2,90 2 . 25 54.2 20.2 9 .7 6. 9 5. 6 • 79 .47 .10 • 74 .59 30 OCTOBER 2l ,33 5.05 2,4l 64.67 l, J 6 3,28 t. 2 5 qq. l 2,49 2,86 2.lU 54.4 2J,U 9 ,3 7,3 5.6 .63 .JO .ll • 77 .62 23 NCVEMBER 2 l ,4<.l 5.04 2 .38 64.5l l , 06 3.3l l,ll 98,8 2. 4 B 2,88 2 . 12 53,] 2 l. l 9 .] 1.2 5. 6 .48 .29 .10 .7B .61 14 DECfM•ER 2l,26 5,06 • 2 .• 55 *65.00 ,q 9 3.2l .96 99 .a 2,52 l,19 l .98 56.l LB. 5 ~-l 7.8 5,5 .46 ,43 • LL .16 .61 ll J A~llARV l l .26 5, l2 l.44 64,/17 . 9 7 3. 24 l. lb q9 .L 2. 51 2 .8 l 2 , LO 55.4 19.l ? .4 1,,. s.s .41 ,43 •.15 • 76 .65 7 FEBRUA~V 2 l ,2 5 5.l4 l,<R 64.&5 l , 0 3 3,]l l. l 5 98.9 2.50 2 .n 3 l. 16 54,] 19,9 9 ,6 7. 2 5,6 .63 ,40 • LL • 77 .62 9 MARCH ll .34 5.06 2 • '•b 64,16 l, 13 3.21 l , 06 90,l 2.50 l ,8 4 2.06 54 .6 l9.9 9 .2 7,5 5.6 .41 .36 .07 • 73 .55 11 APP IL ll .3J 5 .J9 l ,4 l 64,67 t.l~ 3.24 l, 14 99,u 2.50 2,84 ?, l l 54.5 19,9 9 ,4 7,3 5.5 . 4 6 .H .01 • 71 .54 1B MAV 21.31 s. 09 2.30 64. 12 l ,1 9 3 .21 l.20 •N.I 2.50 2.SB 2, 2 1 54,T 19.8 9. 6 1.0 5.6 • 52 .37 .08 .12 . 55 18 JU~E 21.11 •5.23 2. 3 7 6 1+ .c; 1 1, 1 7 3.25 l, 30 9G.2 2 ,48 2,SO 2 , 21 53, I 21.0 9 ,8 1. 2 s.s .50 .38 .08 , 76 .58 14
HIGH 21. Tl 5. 2 J 2.55 65.00 l.10 3.31 l.43 gq.z 2,52 2.94 l.25 %.2 22.s 9,8 1,B 5. 6 • 79 .47 .15 .78 .65 LCW Zl,25 5,04 2,26 64, 52 • 9 5 2,Y6 .% 98,8 2,46 2.19 l,SH 52 .6 18,5 9.l 6 ,9 5.0 .41 .29 .01 .11 .54 AVERAGE ll.<6 5, 09 L.36 64 .6 T 1.u 7 3.23 1.22 99,J 2,49 2 ,BI 2 .16 54. l 20.4 9,5 1.2 5. 5 .59 .38 .10 .74 .59
STD.DEV, , IL .JS .oo ,LL ,OB , 09 .LJ , I . 0 1 , 0 4 . 0 1 . 9 1. 0 .2 , 2 .2 .1 2 • 06 .02 .02 .03
• PHYS[CAL ANALYSIS•
FIN v-r-c-A-T G-1-L-M-O-R-E FALSE N.J~M Al ~ COMPRESS I VE STRENGTH AUTO NO _ __MJc.tiHL __ .J!:li.5 _Jt,l(.ll.l;• -ilU.lC;E _l!il 1 fl.IS Ull Utl ill L..il~ !lliD flil. JJlil l!a:L l.llAl ZJIJlil ~ ill
JULY dh.2 l ltl 5 ]JOO "5 l~O 2.20 4 ,15 BO 25 .o 4B.5 l l.O 1950 3240 4230 5410 .005 19 AUGUST tjC:,. l l 7HJ 3215 BJ 115 2.20 ,.1s b5 24.5 48.5 11,4 1965 3275 4125 5245 .001- 17 SEPTEMdER d T. 3 l !J 15 35}5 15 l75 2.10 4, 10 B2 24.5 48, 5 l l. 2 2090 338 0 4270 5565 .003- 30 ocrn~E• d6.3 l li55 jc90 75 175 2. 15 4 ,15 "1 24,5 48,5 11. 0 •22&0 351 0 4450 5485 .008 23 ~CV~M8E> SI,? 1"2v 3315 ijl) LBJ 2, l 5 4, I u il6 24.) 48. 5 LL.I 20 75 342 0 43 0 0 5490 .010- 14 DEU•PER db.9 1710 Jlrrn 85 • l '10 2,25 4 ,15 S4 24, 5 4H.5 l l, 5 2130 H10 4365 5400 .012- LL JANUASY ~b.7 ld Lu 314 5 BJ 18V 2. I 5 4.1 0 86 24.5 48.a ll.T 208 0 •3S 5 5 435 0 5525 .002- 7 FE~P.UARV 85 ,4 lTdJ 323<.l Bu 115 2. l 5 4, l 5 85 24,5 48. 5 10.0 2090 ]2Q0 4215 5395 .ooz- 9 MAP.CH 83.8 •1705 3210 75 \ 75 2,20 4. l5 88 24,5 48.5 11, l 1945 3195 •4025 •SOJO .002- 11 APR IL 1)4 .4 l Tdu 3265 85 l 12 2.25 4,15 83 24.v 48,5 11.3 1910 3315 4280 5491 .015- 18 •Av 04. 8 l>HJ .B70 85 l 15 2.20 4. 15 88 24. 0 48,5 11.2 1940 33 30 4245 5276 .011- 18 JUNL j6. L •19 50 3-H>C. UJ I I~ 2,15 4 , 12 B3 24,l 48,5 10.9 1920 32 8 7 4323 .010- 14
HIGH dl,3 1450 3535 85 190 2,25 4 . 15 aa 7.5.0 ll.8 2260 3555 4450 5565 .008 LOW d3. H LTO~ 314 5 TS 172 2.10 4 , 10 82 24,J I J , 8 1910 31 9 5 402 5 5030 .018-AVE:RAGF rl5 .9 l:J24 jj/1 BJ lib 2. l 7 "'· 1 3 85 24, 4 11. 2 2034 H 4 8 4211 5410 ,005-
STD. llf v. I.I ss L1>e 4 . 0 4 . 02 l . J . 3 lll 9 4 10] 141 .000
• V Al UE S WHICH EXCEED THE AVERAGE BV MORE THAN TWO STANDARD DEVIATIONS
63

64
Figure 3. Computerized concrete quality-control report.
CONCRETE QUAL ITV CONTROL REPORT
PROJECT CONTRACTOR ARCH! TECT fNGTNEER SUPPLIER
SLUMP l ~IR
SPECIFIED 28 DAV STRENGTH 4,000 I 101 CEMENT TYPE LONE STAR I LB/CU VO 564 16SKI W/C 5. 25G/SK • 41/WT AG~REGATE 1 • GRAVEL AD'4!~TURE: A-E NONE OZ/SK OTHER 30Z POZ 1905 GRAVEL/VO, 1336 SANO/VO
7 DH STREN:HH 28 DAV STRENGTH
TEST MOVING TEST MOVING TEST '40VING TEST '40VING OAH
04-ll -7J 04-12-n 04-13-73 04-20-7] 04-24-n 04-25-7 3 04- 2'>-7] !14-27-73 04-3Cl-73 ()5-01-73 05-0'l-73 05-11-73 05-15-7] 05-16-73 ()5-17-73 05-18-73 05-22-73
02-28-74 02-28-74 03-05-74 01-05-74 03-08-74 03-08-74
HIGH LOW PANGE
NO OF TESTS ~VER AGE STAND. DEVIATION CClEF. OF VAR.
AVF. RANGE
VALUE
4.75 3.75 4.0J 5 .?.5 4.50 5. 2 5 5.00 ].75 4.00 4. 75 ?.. 75 5.00 5.25 4. 75 4.25 5.Lh) 4.50
545u 470!) 4521) 5080 '•620 so10
WITHIN TEST STAPIID.DEV. WITHIN TEST (DEF.OF VAR.
AVE ]
4.17 4.33 4.58 5.00 4.92 4.67 4.25 4.17 3.83 4.17 4.33 s.oo 4.75 4.67 4.5A
5340 110 5395 4550 150 4625 5100 580 4810 5110 30 5095 5040 420 4830 5360 290 5215
6535 1620 ?915
101 5209
606 11.6
274 243 4.7
VALUE AVE 3 VHUo AVE 3 VALUE AVE 3
4545 6320 4570 5650 3150 4121 lt63'5 5535 4315 4045 5255 5180 4605 4023 5615 5168 4305 4408 5160 5343 4395 41t]5 5800 5525 3430 4043 481t5 5268 4810 4211 1>270 5638 3785 4008 4990 5368 4505 436'> 5330 5530 3995 4095 5605 5308 4505 4335 5905 5613 4155 4213 5280 5597 4040 42B 5475 5553 3510 3901 4200 lt985
5735 5224 5297 5218 4q43 5214 4843 5213 4912 5209 5047 5209
6247 4077 2169
APPROXIMATELY 2.31 OF THE TESTS ARE EXPECTED TO FALL BELOW THE DESIGN STRENGTH OF 4000
components are already in effect. Primarily, they are designed to provide the producer and consumer with a system by which process control and product quality optimization can be measured and cost reduction can be realized. These programs do, however, require many man-hours, sophisticated test equipment, and computerization.
However, is the quality-assurance system itself optimized? Does it assure that the most favorable quality and cost conditions under specific circumstances are realized? Or, are quality-assurance systems for individual components compatible with the objective of the ultimate quality-assurance system that requires a combination of several related systems? Too often, we zero in on one condition and perhaps later on we find we are headed in the wrong direction.
Within our construction-related activities such optimization is difficult to achieve. What are the variables that affect our quality-assurance systems and that relate to quality and cost control? Some of these are type and source of raw materials, type and availability of fuels, processing machinery and equipment, control and test equipment, type and cost of transportation, placing equipment, personnel, and specifications or design criteria. Each of these items obviously plays an important part in establishing the ultimate product quality and the cost of the product.
Some quality-control experts say that one should never consider cost when establishing criteria for optimum
quality of the product. For this discussion, we will consider these factors jointly. Usually, there are many ways to achieve the same objectives; therefore, we must ask some basic questions. To what degree is the ultimate use of the concrete product flexible in chemical and physical performance characteristics? What do the specifications allow? To what degree can chemical and physical characteristics of each product (cement and aggregate) vary without affecting the performance criteria of the concrete? What flexibility can be allowed in processing, transporting, and placing without affecting the performance criteria? I have stressed flexibility rather. than rigidity because we think a quality-assurance program should have flexibility.
Obviously, these questions indicate the need for correlation analysis. The chemical and performance characteristics of each component must be correlated with the chemical and performance characteristics of every other component to determine what variables have the greatest impact on achieving the ultimate objective, and how the variables can be controlled. Otherwise, illconceived quality-assurance programs may be too costly and cumbersome to maintain.
The programs often call for control efforts and information that have an insignificant effect on the final objective and are costly. Mainly these efforts include what we might call cookbook criteria such as organization structure, job descriptions, and internal plant communication forms. Do such requirements make the con-
65
Figure 4. Computerized graph for quality control of concrete.
CONCRETE QUALITY CONTROL REPORT
SUPPL! FR Z B DAY STRENG TH 3 TEST MOVING avERAGE
TEST VALUE
7000 -
sooo -
X V ){'(Y
• X X X
X X X AVERAGE r -XX-----------------------------------X-----X-----------X---
XXX X
50 00 - XY X X X Y X XX
4000 -
3000 -
X
X
y Y. X
X X
X X XX
XXX
XXX
XX X X
•• ••• •• •• 1 •••• • • • • • 1 ••••••••• 1 ••• • • • ••• , ••• • ••••• , • •• • • •• •• ,
crete better achieve the performance objectives, or do they perhaps cause us to miss some of the more important points ?
While reviewing the cement and aggregate requirements for highway construction in our marketing areas several years ago, we found that most of the states would call for AASHO standard specifications and then add specific exceptions to the specifications for use in their own areas. At that time, we were sure that each state had a legitimate reason for adding other restrictions to ensure product quality and desired field performance. However, as control and evaluation techniques are improved, the need for added restrictions is no longer supported by fact. Today, the need for the costly practice of silo testing and sealing has virtually disappeared. Inventory, sampling, and testing costs were reduced for all parties without sacrificing quality control.
The experience with aggregate is similar. There were 215 dissimilar coarse aggregate gradations specified throughout the United States. AASHO specifications called for 19 gradations. However, in this case, the flexibility of state specifications was based on local aggregate availability and on the knowledge that, although the gradation was different, its impact on the ultimate desired quality of the concrete was not significant.
Quality-assurance programs should, therefore, be
structured to primarily flag those characteristics that have a significant impact on product performance, product costs, and placement costs.
It is now possible through the use of computer techniques to make the necessary correlation analysis to determine the critical characteristics that have a significant impact on the ultimate performance and cost of the products. One of the best examples of such a correlation effort is found in the three-part Building Science Series (1). We suggest a similar method for correlating product performance inter r elations, concrete performance interrelations, and finally the performance interrelation between both. Initially, this would be a tremendous task because of the many variables that would have to be considered. However, this task would not be impossible. We should first determine what the high-risk, high-cost factors are.
Alkali in cement and aggregate is an important factor. Quality aggregates will become in short supply in many areas. Environmental considerations and raw material availability are influencing the level of alkali in cement. Historical data indicate that cement alkali should be low when used with an alkali-reactive aggregate.
As a result of several specific case histories in which low alkali may have been required, we now find a general demand for low-alkali cements in many areas where its use would have no significant effect on the purpose or

66
performance of the concrete produced. In other areas, the available aggregate or crushed stone may not require low-alkali cement. Good quality-assurance programs would build in such flexibility by using historical performance facts.
Fineness of cement is another area of controversy. Some demand a coarse cement and others demand fine cement for better strength; however, the actual supporting correlation data are not available to substantiate such demands.
I have already mentioned the numerous sizes of gradation required. Suppose each gradation used with the same cement produced the desired strength and durability required. Would the specific gradation specifications have been necessary? A properly designed qualityassurance program would determine if such flexibility could be acceptable.
Some of the criteria for each component relate to the following:
Cement Aggregate Concrete
Chemical composition Chemical composition Cement content Silicates Limestone Aggregate con-Aluminates Basalt tent and size Alkalies Slag Sand content Sulfates Gravel and size Rare element Sand Water content
impurities Admixtures Physical characteristics Physical characteristics Setting time
Fineness Size Workability Setting time Gradation Volume change Workability Soundness Durability Strength Volume change
This list makes it obvious that, if we are to design a quality-assurance program to satisfy the hopes that variability will not occur, we must use all the informaation available from producers, testing agencies, and laboratories and put them together in a well-designed quality-assurance program. Certainly, even these variables are not all the variables related to the chemical and physical properties.
Has anyone conducted a correlation analysis based on the performance characteristics of these three components? Such analyses have to be conducted to determine what significant effect the variables of the components will have on the ultimate concrete. Has anyone _, __ _____ _:..] ____ 1 .&.1 __ _! __ ,&. ________________ ..... ---'1-.&..! ____ ..__ .Ll_. _
d.LOU \;UUOJ.Ut::'.1.t::'U Lilt' J.11Lt::'.l"l,;UU1.l)Ullt:IU. .l"~J.ct.LJ.UJU:i LU Ult: t.;UU-
Crete performance? We feel the industry or specification writers still have an important step to take before establishing the true relation of each variable to the final product. We may well find that some of our specifications, as written, could be made more flexible and still protect the consumer. At the same time, producer and user would realize significant cost savings in mineral resource conservation, energy requirements, and capital costs. Quality-assurance programs need not be cumbersome or costly to protect the consumer and still minimize process and product costs.
REFERENCE
1. Interrelations Between Cement and Concrete Properties. National Bureau of Standards, U.S. Department of Commerce, Series 1, 2, and 3, 1965-1968.