quality, equity, dignity
TRANSCRIPT

1
Quality, Equity, Dignity
A Network for Improving Quality of Care for Maternal, Newborn and Child Health
QUALITY OF CARE FOR MATERNAL AND NEWBORN HEALTH: A MONITORING FRAMEWORK FOR NETWORK COUNTRIESUpdated February 2019

2
AbbreviationsCEmONC comprehensive emergency obstetric and
newborn careC-section caesarean sectionDHIS2 District Health Management Information
System 2ENAP Early Newborn Action PlanEPMM Strategies for Ending Preventable Maternal
MortalityHMIS health management information systemsICD International Statistical Classification of
Diseases and Related Health ProblemsICD-10 International Statistical Classification of
Diseases and Related Health Problems, 10th Revision
ICD-MM The WHO application of ICD-10 to deaths during pregnancy, childbirth, and puerperium: ICD–maternal mortality
ICD-PM The WHO application of ICD-10 to deaths during the perinatal period: ICD–perinatal mortality
IHP+ International Health PartnershipKMC kangaroo mother care
LMIS logistics management information systemM&E monitoring and evaluationMNH maternal and newborn healthMPDSR Maternal and Perinatal Deaths Surveillance
and ResponsePDSA Plan-Do-Study-Act (cycle)PE/E pre-eclampsia/eclampsiaPHCPI Primary Health Care Performance InitiativePLA participatory learning and actionPPH postpartum haemorrhageQED Quality, Equity, DignityQI quality improvementQoC quality of careSARA Service Availability and Readiness
AssessmentSI staff interviewsSPA Service Provision AssessmentTWG Thematic Working GroupWHO World Health Organization
ContentsAcknowledgment .............................................................2
Abbreviations .....................................................................2
1. Network Goals .............................................................3
2. Purpose of the Monitoring Framework ...........3
3. Monitoring Components .........................................3
4. Measurement Methods and Data Sources ......5
5. QI Measures and District Performance Measures: QED Indicator Catalogue .................7
6. The Monitoring Logic Model ...............................9
7. Using Data to Improve Quality: Model for Improvement and Plan-Do-Study-Act (PDSA) Cycles ...............................................................9
8. Network Resources ................................................10
Annex 1. Common Indicators for Monitoring Across Network Countries ..............11
Annex 2. Quality Improvement Measures – An Example ......................................................................13
Annex 3: QED Indicator Catalogue ........................14
Annex 4. Implementation Milestones ................25
References ............................................................28
AcknowledgmentThe preparation of the monitoring framework was led by the co-chairs of the Maternal and Newborn Health Quality of Care Metrics Technical Working Group, Theresa Diaz (WHO), Kathleen Hill (Jhpiego-MCSP) and Debra Jackson (UNICEF).
This technical guidance document was prepared by the WHO-based secretariat of the Network,
Moise Muzigaba and Ben Nemser, with input from expert members of the Technical Working Group. We specifically would like to acknowledge experts from the Network countries and other working groups working on maternal and newborn health and on quality of care issues, including MoNITOR, ENAP, EPPM, the Health Data Collaborative and UN partner organizations.

3
1. Network Goals • Reduce maternal and newborn mortality –
reduce maternal and newborn deaths and stillbirths in participating health facilities by 50% over five years.
• Improve experience of care – enable measurable improvement in user satisfaction with the care received.
2. Purpose of the Monitoring Framework
This Monitoring Framework provides basic guidance on the monitoring and evaluation (M&E) needs for the Network for Improving Quality of Care for Maternal, Newborn and Child Health (the Network). The Monitoring Framework aligns with the Network goals, strategic objectives, implementation frame-work and World Health Organization (WHO) standards for improving maternal and newborn care in health facilities (2016)1 and the WHO standards for improving quality of care for children and young adolescents in health facilities (2018).2
With diverse stakeholders in the Network, the Monitoring Framework attempts to balance the monitoring needs across unique Network countries and data users at multiple levels of the health system: facility, district, national and global. To this end, the Framework articulates conceptual guidance for review by stakeholders rather than prescriptive instructions. Each country has an existing data and monitoring system and its monitoring needs will vary depending on the country context. The Monitoring Framework builds on the WHO maternal and newborn quality standards and measures1 and also on complementary monitoring frameworks, indicators and measurement methods, including global monitoring frameworks within the Strategies for Ending Preventable Maternal Mortality (EPMM),3,4 Every Newborn Action Plan (ENAP),5,6 and the Global Strategy for Women’s, Children’s and Adolescents’ Health.7 The Network encourages countries to incorporate, as appropriate, quality of care indicators, tools and methodologies into their existing information systems to support improved quality of care for mothers, newborns and children. A common set of indicators is recommended for measurement in all Quality, Equity, Dignity (QED) participating facilities in Network countries to monitor performance on a small number of common indicators and to facilitate learning within and across Network countries.
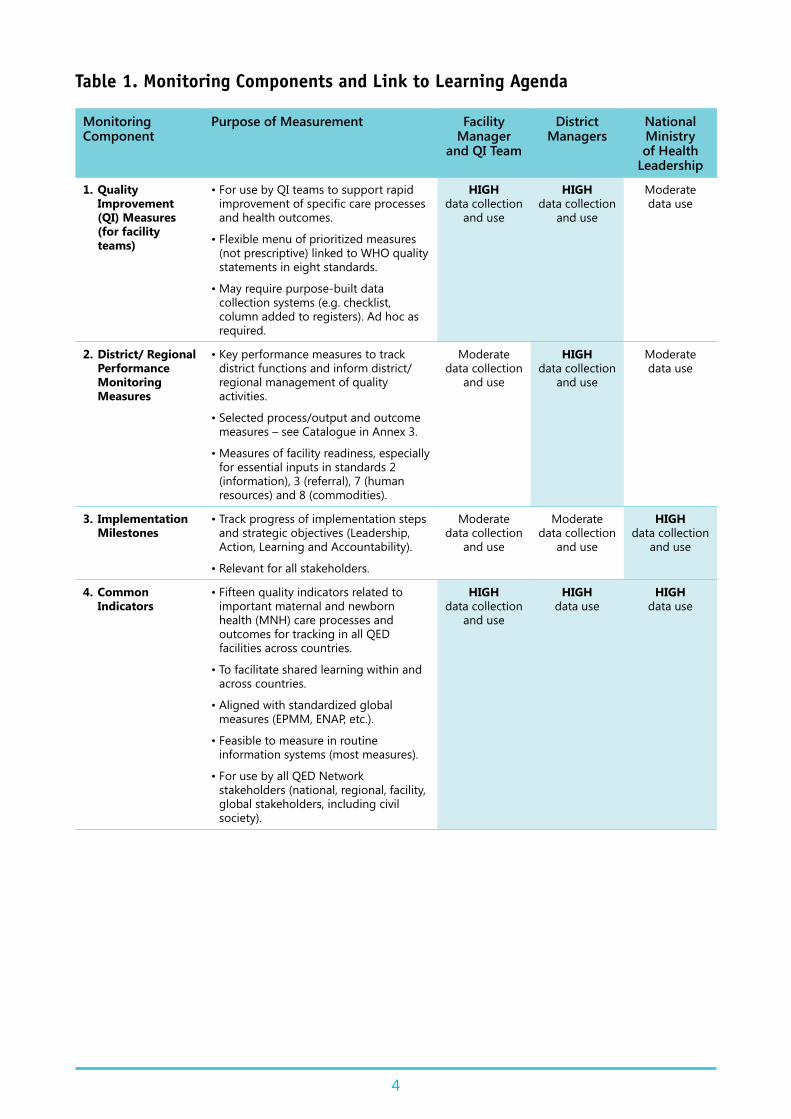
3. Monitoring ComponentsThe Monitoring Framework outlines four key components visualized and summarized in Table 1, which can be adapted and integrated into existing country health information and monitoring systems:
1. Quality Improvement Measures (for health facilities): to support rapid improvements in quality of care (QoC) led by facility Quality Improvement (QI) Teams and supported by district/regional (or other subnational administrative and managerial unit) managers.
2. District/Regional Performance Measures: to support district and regional managerial and leadership functions in support of improving and sustaining quality care in facilities.
3. Implementation Milestones: to track implementation steps and progress against strategic objectives (Leadership, Action, Learning and Accountability) in line with QED implementation guidance.
4. Common Indicators: to provide a common set of standardized indicators for monitoring in all participating QED facilities in Network countries and to facilitate shared learning within and across countries.
Table 1 describes the primary stakeholders (users) and measurement purpose of each component. Indicators and key data users in each component are not mutually exclusive and some indicators may be selected for use as part of more than one monitoring component (e.g. postpartum haemorrhage [PPH] incidence and case fatality may be useful as a QI and district/regional performance measure). The results generated in each of the monitoring components will contribute to in-country and cross-country learning as part of the quality network global learning platform.
Annex 1 lists the maternal and newborn common indicators for monitoring in every participating QED facility in Network countries. These common MNH measures represent a small number of standardized indicators for monitoring in every QED facility and are intended to facilitate shared learning within and across countries. Selection of a set of child health common indicators is in progress (as of November 2018) and, once finalized, will be added to this Framework as an annex.
4
Table 1. Monitoring Components and Link to Learning Agenda
Monitoring Component
Purpose of Measurement Facility Manager
and QI Team
District Managers
National Ministry of Health
Leadership
1. Quality Improvement (QI) Measures (for facility teams)
• For use by QI teams to support rapid improvement of specific care processes and health outcomes.
• Flexible menu of prioritized measures (not prescriptive) linked to WHO quality statements in eight standards.
• May require purpose-built data collection systems (e.g. checklist, column added to registers). Ad hoc as required.
HIGH data collection
and use
HIGH data collection
and use
Moderate data use
2. District/ Regional Performance Monitoring Measures
• Key performance measures to track district functions and inform district/regional management of quality activities.
• Selected process/output and outcome measures – see Catalogue in Annex 3.
• Measures of facility readiness, especially for essential inputs in standards 2 (information), 3 (referral), 7 (human resources) and 8 (commodities).
Moderate data collection
and use
HIGH data collection
and use
Moderate data use
3. Implementation Milestones
• Track progress of implementation steps and strategic objectives (Leadership, Action, Learning and Accountability).
• Relevant for all stakeholders.
Moderate data collection
and use
Moderate data collection
and use
HIGH data collection
and use
4. Common Indicators
• Fifteen quality indicators related to important maternal and newborn health (MNH) care processes and outcomes for tracking in all QED facilities across countries.
• To facilitate shared learning within and across countries.
• Aligned with standardized global measures (EPMM, ENAP, etc.).
• Feasible to measure in routine information systems (most measures).
• For use by all QED Network stakeholders (national, regional, facility, global stakeholders, including civil society).
HIGH data collection
and use
HIGH data use
HIGH data use

5
It is important to note that common indicators are complementary to other QED monitoring components (Table 1), including implementation milestones, district performance, and facility QI measures, which collectively represent the heart of monitoring to improve QoC in Network learning districts and participating facilities.
Selection criteria for common indicators include:
• Relevant and useful for most QED stakeholders.• Aligned to extent possible with standardized
global MNH indicators (Every Woman Every Child, EPMM, ENAP, WHO 100 core indicators).
• Clearly provide information regarding whether (or not) health outcomes, care processes or inputs are improving.
A set of draft maternal and newborn common indicators was presented at the launch of the QED MNH Network in February 2017 in Malawi and subsequently reviewed and further prioritized based on a series of consultations with country-based and regional and global technical experts between July and December 2017.
Consultations held to review and prioritize QED MNH common indicators include the following (notes are available for each consultation):
• QED M&E Thematic Working Group (TWG) feedback on updated measures
• Country consultations: – 9 countries participating in QED MNH meeting, Tanzania, December 2017
– 12 countries participating in routine health management information systems (HMIS) MNH content meeting, Nepal, November 2017
• EPMM virtual consultation, 29 December 2017 • ENAP/EPMM virtual consultation, 5 December
2017• In-person meeting of QED M&E TWG, Geneva,
July 2017 • In-person MONITOR meeting, Geneva, July 2017 • Working group meeting to review the common
measures proposed at the February 2017 launch of the QED Network.
4. Measurement Methods and Data Sources
With the exception of the common indicators, the Network indicators, measurement methods and data sources will vary according to each
country’s context, monitoring framework and data systems. Indicators will usually be calculated and used by facility QI teams and regional/district managers as part of regular monitoring to improve care. Most indicators will be calculated using routine measurement methods and data sources. Supplemental collection methods (e.g. periodic facility assessment/baseline assessment) can complement routine monitoring to inform understanding of critical quality gaps and to inform the design and evaluation of QI interventions.
Each country’s monitoring framework will leverage a diverse set of data sources, including, but not limited to:
Continuous (routine) data collection sources:
• Patient records/facility registers: These can provide more detailed information on interventions provided and adherence to standards of care for more complex processes of care that are not typically aggregated in HMIS at subnational or national levels. – Data aggregated within HMIS or District Health Management Information System 2 [DHIS2]): Selected data from facility registers are typically aggregated in HMIS (e.g. DHIS2). To varying degrees, HMIS can provide routine (e.g. monthly) information on service utilization, provision of high-impact interventions, incidence of institutional complications, number and causes of death, and case fatality.
• Maternal death surveillance and response and perinatal death audits: These can provide detailed case-by-case information about cause of death and underlying contributors, including QoC provided.
• Civil registration and vital statistics: These provide information on mortality and population-based denominators (e.g. estimated births).
• Logistics management information systems (LMIS) and supply chain management: The availability, distribution and quantity of medicines, commodities and medical supplies are often routinely tracked in LMIS or other supply chain management systems from central warehousing to service delivery points, such as health facilities.
• Human resources and staff training: The placement, availability and training of health staff are often routinely tracked at facility, district and/or national levels in human resource information systems.

6
Periodic data collection sources:
• Client surveys: Structured quantitative questionnaires (e.g. brief client exit survey) can provide information on a client’s priorities for care and experience of care. Since three of the eight WHO QoC standards address experience of care, it is likely that QED facilities may support episodic brief surveys of women and families (e.g. brief structured exit questionnaire).
• Staff/provider interview (and vignettes): These are useful for assessing provider knowledge, self-reported practice and training.
• Simulations of care: These assess provider competence and skills for discrete tasks (e.g. resuscitation of newborn using mannequin; postpartum counselling).
• Observation: Provider performance and adherence to standards of care during real-time clinical care can be assessed through observations (e.g. as part of baseline assessment or periodic peer-to-peer observation). Service readiness (e.g. stock availability or condition of water and sanitation facilities) or other operations can also be assessed.
Other data collection sources:
• Periodic health facility assessments using standardized tools (e.g. Service Availability and Readiness Assessment [SARA], Service Delivery Indicator, Service Delivery Platform, Service Provision Assessment [SPA]): These tools generate important supplemental information (e.g. baseline or periodic facility assessment) using a combination of routine and non-routine data sources (such as those highlighted above). Facility assessments can be an important source for data that are not routinely available in most health systems to provide a deeper and more nuanced understanding of the QoC. More in-depth information on users’ and providers’ care experience and priorities can be collected through baseline and/or periodic client interviews and focus group discussions and other qualitative methods to supplement routine quantitative data sources (e.g. client survey).
• Population-based health surveys (e.g. Demographic and Health Surveys, Multiple Indicator Cluster Surveys, Lot Quality Assurance Sampling): These can provide information on intervention coverage, treatment-seeking behaviour, patient self-reported practices and experience of care and other variables.
• Desk review and stakeholder interviews: Information on activities undertaken or completed and achievement of specific implementation milestones can be obtained through these two methods.
Each measurement method and data source has inherent strengths and weaknesses that will need to be considered as countries define an optimal and feasible monitoring framework for their country context. For example, health facility assessments provide tremendous depth of information, but are resource intensive and thus are usually not feasible for routine (e.g. monthly) monitoring of performance to inform QI efforts led by facility teams and regional/district managers.
As part of each country’s monitoring framework, stakeholders will need to define priority quality measures for routine tracking at national, regional/district and facility levels. While some quality measures will be tracked and analysed on a routine basis, other measures will be monitored by a QI team for a finite period of time (sometimes using purpose-built data sources such as checklists or columns added to patient registers) while the team works to improve a specific process of care (e.g. improve management of newborn asphyxia). Not all such measures will need to be, or should be, incorporated into routine national or local health information systems.
Many countries have information systems that lack the primary data elements needed for routine measurement of QoC processes and health outcomes. Registers often do not include the data elements to assess the QoC processes (e.g. percentage of newborns with asphyxia resuscitated), especially for more complex clinical processes. In some instances, a standardized facility patient record may not be available. Many national health information systems contain relatively few quality indicators, making it difficult to extract and aggregate performance across multiple facilities at subnational level (e.g. district, region). Health-care workers and staff often lack exposure to and capabilities for monitoring QoC, including knowledge of how to calculate quality measures and the ability to visualize and analyse trends over time (e.g. using time series trend or run chart).
Countries will need to consider many factors as they define the specific measures that will be included in their country’s quality network monitoring system. For example, they will need to consider existing data availability, data sources,

7
and which new measurement methods will be feasible in their context. Data quality issues are common in many settings and regular data quality assurance will be an important activity as part of continuous monitoring. Countries can use the Network resources to leverage standardized indicators, data collection methods and tools; leveraging validated tools and analysis methods can save time and resources.
The Network will help support countries to build information systems and health worker capabilities for monitoring QoC through several mechanisms, including a user-friendly web-based platform of resources. For example, the Network will act as a repository for lists of standardized quality indicators, measurement methods and tools for countries to review. Currently, certain areas of quality measurement remain relatively undeveloped with respect to methods and validated tools, particularly in terms of experience of care and patient satisfaction. The Network web-based platform will be an important communication vehicle and repository of resources as new methods and tools are developed across countries. Importantly, countries are encouraged to identify and communicate information gaps, which can help push researchers to develop methods of common interest.
5. QI Measures and District Performance Measures: QED Indicator Catalogue
The WHO QoC standards include a menu of input, output/process and outcome measures categorized by each quality statement for use by district managers and facility teams to support QI efforts.1 Quality statements are concise prioritized statements designed to help drive measurable improvements in care. Three types of measures are defined for each quality statement:
• Inputs: what must be in place for the desired care to be provided
• Outputs (process): whether the desired process of care was provided as expected
• Outcomes: the effect of the provision and experience of care on health and people-centred outcomes.
Annex 2 gives an example of how a QED learning district might select maternal and newborn quality indicators (input, process and outcome) for use by district managers and/or facility teams to achieve specific quality statements (e.g. women with PPH receive appropriate interventions according to WHO guidelines).
To help district managers and facility managers prioritize indicators for monitoring as part of local QI efforts, the QED monitoring framework includes a streamlined set of indicators (categorized by quality statements) called the QED indicator catalogue. The indicators included in the maternal and newborn indicator catalogue are summarized in Annex 3. Prioritization of child health measures by quality statement for inclusion in a QED child health indicator catalogue is in progress (as of November 2018) and will be added to this monitoring framework as an annex once finalized.
The QED indicator catalogue categorizes indicators by quality statement and indicator type (input, output/process and outcome) and specifies potential data sources for each indicator to help QED country stakeholders design their monitoring plans. For the most part, QED catalogue indicators will be collected by district managers and/or facility QI teams using routine data collection sources as described above.
The monitoring logic model used to establish links between the strategic objectives and the outcomes of the Network is illustrated in Fig. 1.

8
Improved health outcomes
Halving maternal and newborn deaths in health facilities in five years
Improved health outcomes
Existing health system structures
Improved care seeking and client practices
Improved user satisfaction
Provision of care: Safe and effective
• Evidence-based practices (S1)• Actionable information system (S2)• Functional referral system (S3)• Safety
Access to care: Equitable and timely
• Timeliness of care• Provider availability• Minimized access barriers
(cultural, financial, geographic)
Experience of care: Person-centred
• Effective communication with patients (S4)
• Respect and dignity (S5)• Emotional support (S6)
• Continuity of care
Management and organization
• Competent and motivated staff (S7)
• Supportive supervision• Population health management
(community)• Monitoring and continuous quality
improvement• Essential physical resources
available (S8)
Measure of success
Outcomes
Outputs/processes
Inputs
Strategic objectives
Quality improvement teams (using QoC standards): Through leadership at national, district and facility levels
Cont
ext
and
soci
al d
eter
min
ants
(com
mun
ity,
pol
itic
al, s
ocia
l, de
mog
raph
ic, S
ES)
Drugs and supplies Workforce Information
systems Financing Governance
LEADERSHIPCountry-led, structures, plans, mobilization
ACTIONStandards and resources, phased implementation, institutionalization
LEARNINGData systems, audit/team meetings, PLA and PDSA cycles, global learning
ACCOUNTABILITYNational framework, institutionalization, evaluation
Fig. 1. Monitoring Logic Model: Unpacking the Links Between the Strategic Objectives and the Outcomes of the Network
NOTE: S1–S8 reflect the numbering from the WHO Standards for Improving Quality of Maternal and Newborn Care in Health Facilities.1

9
6. The Monitoring Logic Model The monitoring logic model (Fig. 1) visually unpacks the links between the Network’s strategic objectives (i.e. Leadership, Action, Learning and Accountability) and the goal of reducing maternal and newborn mortality.8 The monitoring logic model builds on several important conceptual models, including the WHO vision paper9 and framework of standards, quality statements and measures, the Primary Health Care Performance Initiative (PHCPI),10 International Health Partnerships (IHP+),11 and the WHO health system building blocks.12 The model is a helpful organizing principle that users can reorganize as needed for their unique context or priority. Building on existing monitoring systems, each country’s monitoring needs are unique, but all should attempt to capture at least some indicators from each of the logic model’s four central elements: (a) management and organization; (b) access to care; (c) provision of care; and (d) experience of care.
7. Using Data to Improve Quality: Model for Improvement and Plan-Do-Study-Act (PDSA) Cycles
The Model for Improvement (Fig. 2) is one implementation model that provides a structured way to improve the delivery of care. This model uses three questions to structure an improvement plan for better care:
1. What are we trying to accomplish? (a specific numeric and time-bound aim)
2. What change can we make that will result in improvement? (the ideas for change that we can test)
3. How will we know that a change is an improvement? (the measures we will use to track progress for improving care)
Quality statements are a good starting point for developing the first question as part of local improvement efforts. The concept of “trying out” ideas and learning what works and what does not is an essential part of implementation designs that can be adapted to local context. One method for testing new ideas for improvement is the Plan-Do-Study-Act (PDSA) cycle. The PDSA cycle is designed to help QI teams methodically test and iteratively refine ideas on a small scale before committing to larger scale and implementation. QI teams need to collect real-time data to undertake these tests and track performance of the maternal newborn care system.
In most cases, the data tracked in the monitoring framework will be used to assess whether PDSA tests and other QI interventions are (or are not) improving care. Some PDSA cycles will require ad hoc measures.
Fig. 2: PDSA Cycle
Model for improvement
What are we trying to accomplish?
What change can we make that will result in improvement?
How will we know that a change is an improvement?
ACT
STUDY
PLAN
DO

10
Note that the PDSA cycle is just one example of a test system for new ideas – countries can use other problem-solving or implementation research strategies as needed.
8. Network Resources To support countries with the development and implementation of their Quality Monitoring Framework, the Network will provide resources that include, but are not limited to:
(a) Web-based repository of monitoring tools and guidance: These include indicator sets, data collection tools, analysis methods, manuals and capacity-building materials.
(b) Technical assistance: When requested by countries, the Network can facilitate technical assistance to help design and implement a QI monitoring framework.
(c) Web-based dashboard and tools to track performance: The Network will develop a web-based dashboard to showcase implementation status and progress towards the collective goals across countries.
(d) Links to related initiatives: Countries with related M&E and HMIS initiatives can be connected through the Health Data Collaborative, PHCPI and other maternal and newborn child health monitoring frameworks and platforms such as Every Woman Every Child, ENAP and EPMM.
Midwife Susan Acom, in Apeitolin Health centre II in Uganda checks a mother during her antenatal care visit to the facility, in July 2018.©UNICEF/Adriko

11
Anne
x 1.
Com
mon
Indi
cato
rs fo
r Mon
itor
ing
Acro
ss N
etw
ork
Coun
trie
s –
Base
d on
Con
sult
atio
ns w
ith
Coun
try
and
Glob
al S
take
hold
ers
in 2
017
Indi
cato
rO
pera
tiona
l Def
initi
on
Num
erat
orD
enom
inat
orD
ata
Sour
ceFr
eque
ncy
of
Dat
a Co
llect
ion
1Pr
e-di
scha
rge
Mat
erna
l dea
ths
Num
ber o
f wom
en w
ho d
eliv
ered
in
the
faci
lity
and
died
prio
r to
disc
harg
eN
umbe
r of w
omen
who
del
iver
ed in
the
faci
lity
and
died
prio
r to
disc
harg
e N
/A (c
ount
indi
cato
r)H
MIS
/fac
ility
re
gist
erM
onth
ly
2M
ater
nal
deat
hs b
y ca
use
(pre
-dis
char
ge)
Num
ber o
f ins
titut
iona
l pre
-dis
char
ge
mat
erna
l dea
ths
by c
ause
(ICD
-MM
)N
umbe
r of m
ater
nal d
eath
s by
cau
se (I
CD-
MM
) am
ong
wom
en w
ho d
eliv
ered
in th
e fa
cilit
y an
d di
ed p
rior t
o di
scha
rge
N/A
HM
IS/f
acili
ty
regi
ster
Mon
thly
3N
eona
tal
deat
hs b
y ca
use
(pre
-dis
char
ge)
Num
ber o
f ins
titut
iona
l pre
-dis
char
ge
neon
atal
dea
ths
(28
days
or l
ess)
by
caus
e (IC
D-P
M)
Num
ber o
f neo
nata
l dea
ths
by c
ause
(ICD
-PM
) am
ong
babi
es b
orn
live
in th
e fa
cilit
y w
ho d
ie p
rior t
o di
scha
rge
from
the
faci
lity
(up
to 2
8 da
ys o
f com
plet
ed li
fe).
This
ex
clud
es re
adm
issi
on fo
r illn
ess.
N/A
HM
IS/f
acili
ty
regi
ster
Mon
thly
4In
stitu
tiona
l st
illbi
rth
rate
(d
isag
greg
ated
by
fres
h an
d m
acer
ated
)
Perc
enta
ge o
f bab
ies
born
in a
hea
lth
faci
lity
with
no
sign
s of
life
at b
irth
Num
ber o
f bab
ies
deliv
ered
in a
faci
lity
with
no
sig
ns o
f life
and
bor
n w
eigh
ing
at le
ast
1000
gra
ms
or a
fter
28
wee
ks o
f ges
tatio
n,
per 1
000
birt
hs (a
live
or d
ead
at b
irth)
Num
ber o
f bab
ies
born
in th
e fa
cilit
y (li
ve a
nd s
tillb
irth)
HM
IS/f
acili
ty
regi
ster
Mon
thly
5Pr
e-di
scha
rge
neon
atal
mor
talit
y ra
te
Perc
enta
ge o
f bab
ies
born
live
in a
fa
cilit
y w
ho d
ie p
rior t
o di
scha
rge
Num
ber o
f bab
ies
born
live
in a
faci
lity
who
di
e du
ring
the
first
28
of c
ompl
eted
day
s of
life
and
die
prio
r to
disc
harg
e fro
m th
e fa
cilit
y, p
er 1
000
live
birt
hs in
a g
iven
yea
r or
perio
d
Num
ber o
f bab
ies
born
in th
e fa
cilit
y (li
ve a
nd s
tillb
irth)
HM
IS/f
acili
ty
regi
ster
Mon
thly
6O
bste
tric
cas
e fa
talit
y ra
te
(dis
aggr
egat
ed b
y di
rect
and
indi
rect
ca
uses
whe
n po
ssib
le)
Perc
enta
ge o
f wom
en w
ho d
eliv
ered
at
the
faci
lity
and
expe
rienc
ed
com
plic
atio
ns (r
egar
dles
s of
tim
e of
ons
et) a
nd d
ied
from
thes
e co
mpl
icat
ions
bef
ore
disc
harg
e
Num
ber o
f wom
en w
ho d
eliv
ered
at t
he
faci
lity
and
expe
rienc
ed c
ompl
icat
ions
(re
gard
less
of t
ime
of o
nset
) and
die
d fro
m th
ese
com
plic
atio
ns b
efor
e di
scha
rge
(obs
tetr
ic a
nd n
on-o
bste
tric
com
plic
atio
ns)
Num
ber o
f wom
en
who
del
iver
ed
at th
e fa
cilit
y an
d ex
perie
nced
co
mpl
icat
ions
(o
bste
tric
and
no
n-ob
stet
ric)
HM
IS/f
acili
ty
regi
ster
Mon
thly
7Pr
e-di
scha
rge
coun
selli
ng fo
r m
othe
r and
bab
y
Prop
ortio
n of
wom
en w
ho re
ceiv
ed
pre-
disc
harg
e co
unse
lling
for t
he
mot
her a
nd th
e ba
by in
a g
iven
pe
riod
Num
ber o
f wom
en w
ho re
ceiv
ed p
re-
disc
harg
e co
unse
lling
for t
he m
othe
r and
th
e ba
by in
a g
iven
per
iod
(for m
inim
um
elem
ents
)
Num
ber o
f wom
en
who
del
iver
ed a
t the
fa
cilit
y
Clie
nt q
uest
ionn
aire
(s
ampl
e of
wom
en)
(e.g
. exi
t int
ervi
ew)
Qua
rter
ly
8Co
mpa
nion
of
choi
cePr
opor
tion
of w
omen
who
wan
ted
and
had
a co
mpa
nion
sup
port
ing
them
dur
ing
[labo
ur] [
child
birt
h] in
th
e he
alth
faci
lity
Num
ber o
f wom
en w
ho w
ante
d an
d ha
d a
com
pani
on s
uppo
rtin
g th
em d
urin
g [la
bour
] [c
hild
birt
h] in
the
heal
th fa
cilit
y
Num
ber o
f wom
en
who
wan
ted
a co
mpa
nion
dur
ing
[labo
ur] [
deliv
ery]
Clie
nt q
uest
ionn
aire
(s
ampl
e of
wom
en)
Qua
rter
ly

12
Indi
cato
rO
pera
tiona
l Def
initi
on
Num
erat
orD
enom
inat
orD
ata
Sour
ceFr
eque
ncy
of
Dat
a Co
llect
ion
9W
omen
who
ex
perie
nced
ph
ysic
al o
r ver
bal
abus
e in
labo
ur,
child
birt
h or
po
stpa
rtum
per
iod
Prop
ortio
n of
wom
en w
ho re
port
ph
ysic
al o
r ver
bal a
buse
at a
ny
time
durin
g la
bour
, chi
ldbi
rth
or
post
part
um p
erio
d
(Phy
sica
l abu
se in
clud
es: s
lapp
ed,
pinc
hed
or p
unch
ed b
y a
heal
th
wor
ker o
r oth
er fa
cilit
y st
aff.
Verb
al
abus
e in
clud
es: s
hout
ed a
t, sc
ream
ed
at, i
nsul
ted,
sco
lded
or m
ocke
d by
a
heal
th w
orke
r or o
ther
sta
ff.*)
Num
ber o
f wom
en w
ho re
port
phy
sica
l or
verb
al a
buse
dur
ing
labo
ur o
r chi
ldbi
rth
Num
ber o
f wom
en
inte
rvie
wed
Cl
ient
que
stio
nnai
re
(sam
ple
of w
omen
) (e
.g. e
xit i
nter
view
)
Qua
rter
ly
10N
ewbo
rns
brea
stfe
d w
ithin
on
e ho
ur
Perc
enta
ge o
f new
born
s bo
rn a
live
in
a fa
cilit
y w
ho a
re b
reas
tfed
with
in o
ne
hour
of b
irth
Num
ber o
f bab
ies
born
aliv
e in
a fa
cilit
y w
ho
are
brea
stfe
d w
ithin
one
hou
r of b
irth
Num
ber o
f bab
ies
born
aliv
e in
the
faci
lity
HM
IS/f
acili
ty
regi
ster
Mon
thly
11Im
med
iate
po
stpa
rtum
ut
erot
onic
for P
PH
prev
entio
n
Perc
enta
ge o
f wom
en w
ho g
ave
birt
h in
a fa
cilit
y w
ho re
ceiv
ed a
pr
ophy
lact
ic u
tero
toni
c im
med
iate
ly
afte
r birt
h (id
eally
with
in o
ne m
inut
e)
for p
reve
ntio
n of
PPH
Num
ber o
f wom
en w
ho g
ave
birt
h in
a
faci
lity
who
rece
ived
a p
roph
ylac
tic
uter
oton
ic im
med
iate
ly a
fter
birt
h (id
eally
w
ithin
one
min
ute)
for p
reve
ntio
n of
PPH
Num
ber o
f wom
en
who
gav
e bi
rth
in th
e fa
cilit
y
HM
IS/f
acili
ty
regi
ster
Mon
thly
12N
ewbo
rns
with
bi
rthw
eigh
t do
cum
ente
d
Perc
enta
ge o
f bab
ies
born
in a
faci
lity
with
birt
hwei
ght d
ocum
ente
d N
umbe
r of b
abie
s bo
rn (l
ive
birt
hs a
nd
still
birt
hs) i
n a
faci
lity
with
doc
umen
ted
birt
hwei
ght
Tota
l num
ber o
f ba
bies
bor
n in
the
faci
lity
(live
birt
hs a
nd
still
birt
hs)
HM
IS/f
acili
ty
regi
ster
Mon
thly
13Pr
emat
ure
babi
es
initi
atin
g KM
CPr
opor
tion
of n
ewbo
rns
wei
ghin
g ≤
200
0 gr
ams
who
are
initi
ated
on
KMC
Num
ber o
f new
born
s w
eigh
ing
≤ 2
000
gram
s w
ho a
re in
itiat
ed o
n KM
C (o
r ad
mitt
ed to
KM
C un
it if
sepa
rate
uni
t exi
sts)
Tota
l num
ber o
f ne
wbo
rns
wei
ghin
g ≤
200
0 gr
ams
HM
IS/f
acili
ty
regi
ster
Mon
thly
14Ba
sic
hygi
ene
prov
isio
nPr
opor
tion
of Q
ED fa
cilit
ies
in w
hich
de
liver
y ro
oms
have
at l
east
one
fu
nctio
nal h
andw
ashi
ng s
tatio
n w
ith
wat
er a
nd s
oap
avai
labl
e
Num
ber o
f QED
faci
litie
s in
whi
ch [a
ll] [a
t le
ast o
ne] d
eliv
ery
room
(s) h
ave
at le
ast o
ne
func
tiona
l han
dwas
hing
sta
tion
with
wat
er
and
soap
ava
ilabl
e
Num
ber o
f QED
fa
cilit
ies
asse
ssed
Faci
lity
surv
ey (e
.g.
dist
rict s
uper
visi
on)
Qua
rter
ly
15Ba
sic
sani
tatio
n av
aila
ble
to w
omen
an
d fa
mili
es
Prop
ortio
n of
QED
faci
litie
s w
ith b
asic
sa
nita
tion
avai
labl
e fo
r wom
en d
urin
g an
d af
ter l
abou
r and
chi
ldbi
rth
Num
ber o
f QED
faci
litie
s w
ith b
asic
sa
nita
tion
avai
labl
e fo
r wom
en d
urin
g an
d af
ter l
abou
r and
chi
ldbi
rth
(cle
an ru
nnin
g w
ater
, was
te d
ispo
sal f
acili
ties,
toile
ts a
nd
sani
tatio
n m
ater
ial f
or w
omen
)
Num
ber o
f QED
fa
cilit
ies
asse
ssed
Faci
lity
surv
ey (e
.g.
dist
rict s
uper
visi
on)
Qua
rter
ly
*Phy
sica
l and
ver
bal a
buse
que
stio
ns b
ased
on
WH
O m
ultic
ount
ry s
tudy
and
val
idat
ion
of s
urve
y qu
estio
ns.
HM
IS: h
ealth
man
agem
ent i
nfor
mat
ion
syst
em; I
CD-M
M: W
HO
app
licat
ion
of IC
D-1
0 to
dea
ths
durin
g pr
egna
ncy,
chi
ldbi
rth,
and
pue
rper
ium
; ICD
-PM
: WH
O a
pplic
atio
n of
ICD
-10
to d
eath
s du
ring
the
perin
atal
per
iod;
KM
C, k
anga
roo
mot
her c
are;
N/A
: not
app
licab
le; P
PH: p
ostp
artu
m h
aem
orrh
age;
QED
: Qua
lity,
Equ
ity, D
igni
ty.
13
Indi
cato
rO
pera
tiona
l Def
initi
on
Num
erat
orD
enom
inat
orD
ata
Sour
ceFr
eque
ncy
of
Dat
a Co
llect
ion
9W
omen
who
ex
perie
nced
ph
ysic
al o
r ver
bal
abus
e in
labo
ur,
child
birt
h or
po
stpa
rtum
per
iod
Prop
ortio
n of
wom
en w
ho re
port
ph
ysic
al o
r ver
bal a
buse
at a
ny
time
durin
g la
bour
, chi
ldbi
rth
or
post
part
um p
erio
d
(Phy
sica
l abu
se in
clud
es: s
lapp
ed,
pinc
hed
or p
unch
ed b
y a
heal
th
wor
ker o
r oth
er fa
cilit
y st
aff.
Verb
al
abus
e in
clud
es: s
hout
ed a
t, sc
ream
ed
at, i
nsul
ted,
sco
lded
or m
ocke
d by
a
heal
th w
orke
r or o
ther
sta
ff.*)
Num
ber o
f wom
en w
ho re
port
phy
sica
l or
verb
al a
buse
dur
ing
labo
ur o
r chi
ldbi
rth
Num
ber o
f wom
en
inte
rvie
wed
Cl
ient
que
stio
nnai
re
(sam
ple
of w
omen
) (e
.g. e
xit i
nter
view
)
Qua
rter
ly
10N
ewbo
rns
brea
stfe
d w
ithin
on
e ho
ur
Perc
enta
ge o
f new
born
s bo
rn a
live
in
a fa
cilit
y w
ho a
re b
reas
tfed
with
in o
ne
hour
of b
irth
Num
ber o
f bab
ies
born
aliv
e in
a fa
cilit
y w
ho
are
brea
stfe
d w
ithin
one
hou
r of b
irth
Num
ber o
f bab
ies
born
aliv
e in
the
faci
lity
HM
IS/f
acili
ty
regi
ster
Mon
thly
11Im
med
iate
po
stpa
rtum
ut
erot
onic
for P
PH
prev
entio
n
Perc
enta
ge o
f wom
en w
ho g
ave
birt
h in
a fa
cilit
y w
ho re
ceiv
ed a
pr
ophy
lact
ic u
tero
toni
c im
med
iate
ly
afte
r birt
h (id
eally
with
in o
ne m
inut
e)
for p
reve
ntio
n of
PPH
Num
ber o
f wom
en w
ho g
ave
birt
h in
a
faci
lity
who
rece
ived
a p
roph
ylac
tic
uter
oton
ic im
med
iate
ly a
fter
birt
h (id
eally
w
ithin
one
min
ute)
for p
reve
ntio
n of
PPH
Num
ber o
f wom
en
who
gav
e bi
rth
in th
e fa
cilit
y
HM
IS/f
acili
ty
regi
ster
Mon
thly
12N
ewbo
rns
with
bi
rthw
eigh
t do
cum
ente
d
Perc
enta
ge o
f bab
ies
born
in a
faci
lity
with
birt
hwei
ght d
ocum
ente
d N
umbe
r of b
abie
s bo
rn (l
ive
birt
hs a
nd
still
birt
hs) i
n a
faci
lity
with
doc
umen
ted
birt
hwei
ght
Tota
l num
ber o
f ba
bies
bor
n in
the
faci
lity
(live
birt
hs a
nd
still
birt
hs)
HM
IS/f
acili
ty
regi
ster
Mon
thly
13Pr
emat
ure
babi
es
initi
atin
g KM
CPr
opor
tion
of n
ewbo
rns
wei
ghin
g ≤
200
0 gr
ams
who
are
initi
ated
on
KMC
Num
ber o
f new
born
s w
eigh
ing
≤ 2
000
gram
s w
ho a
re in
itiat
ed o
n KM
C (o
r ad
mitt
ed to
KM
C un
it if
sepa
rate
uni
t exi
sts)
Tota
l num
ber o
f ne
wbo
rns
wei
ghin
g ≤
200
0 gr
ams
HM
IS/f
acili
ty
regi
ster
Mon
thly
14Ba
sic
hygi
ene
prov
isio
nPr
opor
tion
of Q
ED fa
cilit
ies
in w
hich
de
liver
y ro
oms
have
at l
east
one
fu
nctio
nal h
andw
ashi
ng s
tatio
n w
ith
wat
er a
nd s
oap
avai
labl
e
Num
ber o
f QED
faci
litie
s in
whi
ch [a
ll] [a
t le
ast o
ne] d
eliv
ery
room
(s) h
ave
at le
ast o
ne
func
tiona
l han
dwas
hing
sta
tion
with
wat
er
and
soap
ava
ilabl
e
Num
ber o
f QED
fa
cilit
ies
asse
ssed
Faci
lity
surv
ey (e
.g.
dist
rict s
uper
visi
on)
Qua
rter
ly
15Ba
sic
sani
tatio
n av
aila
ble
to w
omen
an
d fa
mili
es
Prop
ortio
n of
QED
faci
litie
s w
ith b
asic
sa
nita
tion
avai
labl
e fo
r wom
en d
urin
g an
d af
ter l
abou
r and
chi
ldbi
rth
Num
ber o
f QED
faci
litie
s w
ith b
asic
sa
nita
tion
avai
labl
e fo
r wom
en d
urin
g an
d af
ter l
abou
r and
chi
ldbi
rth
(cle
an ru
nnin
g w
ater
, was
te d
ispo
sal f
acili
ties,
toile
ts a
nd
sani
tatio
n m
ater
ial f
or w
omen
)
Num
ber o
f QED
fa
cilit
ies
asse
ssed
Faci
lity
surv
ey (e
.g.
dist
rict s
uper
visi
on)
Qua
rter
ly
*Phy
sica
l and
ver
bal a
buse
que
stio
ns b
ased
on
WH
O m
ultic
ount
ry s
tudy
and
val
idat
ion
of s
urve
y qu
estio
ns.
HM
IS: h
ealth
man
agem
ent i
nfor
mat
ion
syst
em; I
CD-M
M: W
HO
app
licat
ion
of IC
D-1
0 to
dea
ths
durin
g pr
egna
ncy,
chi
ldbi
rth,
and
pue
rper
ium
; ICD
-PM
: WH
O a
pplic
atio
n of
ICD
-10
to d
eath
s du
ring
the
perin
atal
per
iod;
KM
C, k
anga
roo
mot
her c
are;
N/A
: not
app
licab
le; P
PH: p
ostp
artu
m h
aem
orrh
age;
QED
: Qua
lity,
Equ
ity, D
igni
ty.
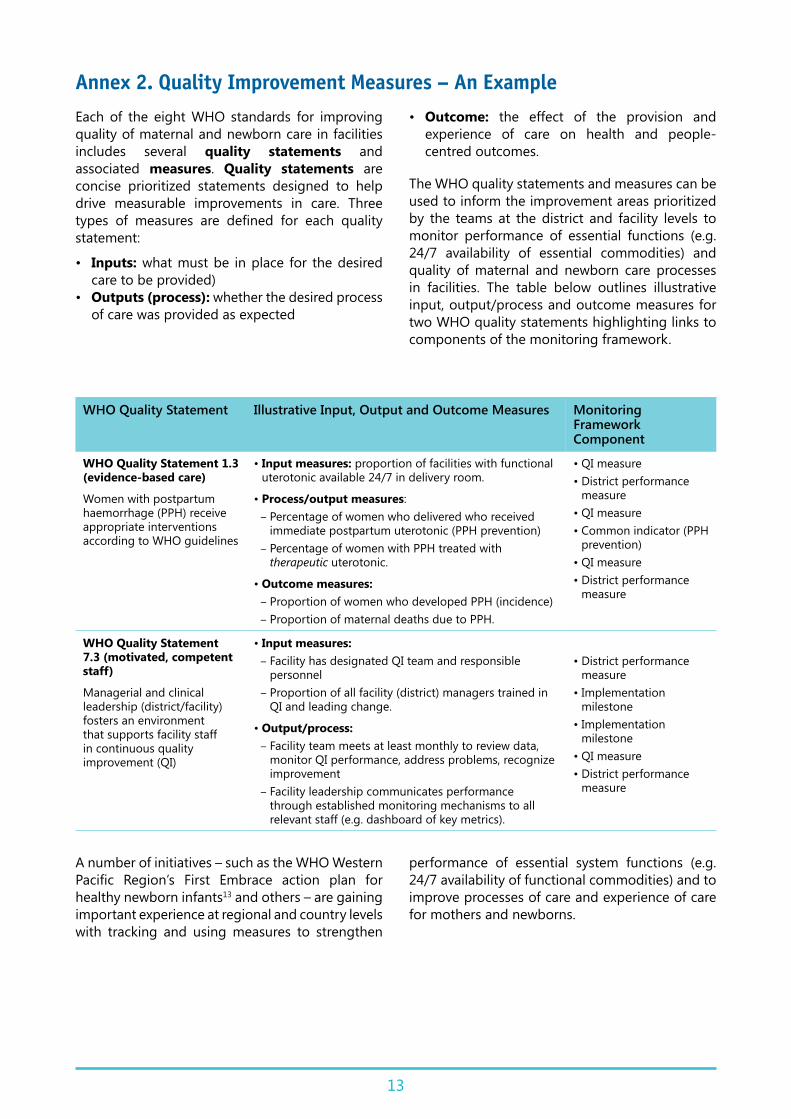
Annex 2. Quality Improvement Measures – An ExampleEach of the eight WHO standards for improving quality of maternal and newborn care in facilities includes several quality statements and associated measures. Quality statements are concise prioritized statements designed to help drive measurable improvements in care. Three types of measures are defined for each quality statement:
• Inputs: what must be in place for the desired care to be provided)
• Outputs (process): whether the desired process of care was provided as expected
• Outcome: the effect of the provision and experience of care on health and people-centred outcomes.
The WHO quality statements and measures can be used to inform the improvement areas prioritized by the teams at the district and facility levels to monitor performance of essential functions (e.g. 24/7 availability of essential commodities) and quality of maternal and newborn care processes in facilities. The table below outlines illustrative input, output/process and outcome measures for two WHO quality statements highlighting links to components of the monitoring framework.
WHO Quality Statement Illustrative Input, Output and Outcome Measures Monitoring Framework Component
WHO Quality Statement 1.3 (evidence-based care)
Women with postpartum haemorrhage (PPH) receive appropriate interventions according to WHO guidelines
• Input measures: proportion of facilities with functional uterotonic available 24/7 in delivery room.
• Process/output measures: – Percentage of women who delivered who received immediate postpartum uterotonic (PPH prevention)
– Percentage of women with PPH treated with therapeutic uterotonic.
• Outcome measures: – Proportion of women who developed PPH (incidence) – Proportion of maternal deaths due to PPH.
• QI measure • District performance
measure• QI measure• Common indicator (PPH
prevention)• QI measure• District performance
measure
WHO Quality Statement 7.3 (motivated, competent staff)
Managerial and clinical leadership (district/facility) fosters an environment that supports facility staff in continuous quality improvement (QI)
• Input measures: – Facility has designated QI team and responsible personnel
– Proportion of all facility (district) managers trained in QI and leading change.
• Output/process: – Facility team meets at least monthly to review data, monitor QI performance, address problems, recognize improvement
– Facility leadership communicates performance through established monitoring mechanisms to all relevant staff (e.g. dashboard of key metrics).
• District performance measure
• Implementation milestone
• Implementation milestone
• QI measure• District performance
measure
A number of initiatives – such as the WHO Western Pacific Region’s First Embrace action plan for healthy newborn infants13 and others – are gaining important experience at regional and country levels with tracking and using measures to strengthen
performance of essential system functions (e.g. 24/7 availability of functional commodities) and to improve processes of care and experience of care for mothers and newborns.

14
Annex 3: QED Indicator CatalogueThe table below is a catalogue (or menu) of possible indicators for use by QI teams and district/subnational managers to monitor improvements in QoC based on the standards and quality statements prioritized for improvement. The catalogue indicators, categorized by WHO maternal newborn standards and quality statements, include a subset of indicators from the 2016 WHO Standards for Improving Quality of Maternal and Newborn Care in Health Facilities1 and additional indicators recommended during QED metrics consultations. Potential data sources or methods of data collection are noted for each indicator. See notes below the table for more
details on data sources. Common indicators are noted with a double asterisk (**).
Please note that the catalogue indicator list is a menu and not an exhaustive list. As appropriate to their selected area of improvement work, district managers and QI teams should consider other indicators, including the more exhaustive list of indicators in the 2016 WHO standards.
The QED indicator catalogue is considered a “living” document that will be regularly updated based on learning in Network countries measuring and using specific indicators to help improve care.
Indicator Category (under revision)
Potential Data Sources or Methods
Routine Information
Systems
Client Interview
Observation (clinical or
operational)
Other
STANDARD 1. EVIDENCE-BASED CARE
WOMEN
Women: Outcome Measures
Number of maternal deaths (per 100 000 live births in health facility)**
Outcome 1
Number of maternal deaths classified by cause (ICD-MM)**
Outcome
% women with specific obstetric complication (PPH, PE/E, prolonged labour, infection/sepsis)
Outcome 1
Obstetric case fatality rate (disaggregated by direct and indirect causes when possible)**
Outcome 1
Maternal cause-specific case fatality rate (PPH, PE/E, infection/sepsis, prolonged labour)
Outcome 1
1.1.a. Women receive routine assessment and appropriate care
% facilities with basic essential equipment and supplies available
Input (Commodities / Equipment)
1
% facilities with written, up-to-date clinical protocols
Input (Policy / Protocol)
1
% staff with recent in-service training Output (Training)
1 [2] SI
% facilities with recent supportive supervision Output (Supervision)
1 [2]
% women assessed appropriately at admission in labour [prenatal history/risk factors, vital signs, danger signs, physical examination]
Output (Service Delivery)
% women monitored appropriately during labour [see forthcoming 2018 WHO intrapartum care recommendations]
Output (Service Delivery)

15
Indicator Category (under revision)
Potential Data Sources or Methods
Routine Information
Systems
Client Interview
Observation (clinical or
operational)
Other
% women with blood pressure, pulse and temperature monitored appropriately [admission, labour, postpartum period]
Output (Service Delivery)
1
% women with appropriate monitoring during postpartum period for danger signs, including bleeding [per local protocol and national/global guidelines]
Output (Service Delivery)
1.2. Women with PE/E
% facilities with magnesium sulfate and antihypertensives available
Input (Commodities / Equipment)
[2] 1
% women with severe PE/E treated with magnesium sulfate
Process/Output (Service Delivery)
1
% women with PE/E managed appropriately based on maternal/fetal status and gestational age (composite indicator) (see WHO MCPC 2nd edition, 2017)
Process/Output (Service Delivery)
1
% women with pre-eclampsia who progressed to eclampsia
Outcome (Service Delivery)
1
PE/E case fatality rate (valid only in high-volume facilities or when aggregated across multiple facilities)
Outcome
1.3. Women with PPH
% facilities with uterotonic drugs available Input (Commodities / Equipment)
[2] 1
% CEmONC facilities with functional blood transfusion service
Input Commodities / Equipment)
% women administered immediate postpartum uterotonic (PPH prevention)*
Process/Output (Service Delivery)
1
% women who developed PPH receiving appropriate treatment (composite indicator, e.g. uteronic, tranexamic acid, uterine balloon tamponade, etc.) (see WHO MCPC 2nd edition 2017)
Output (Service Delivery)
1
PE/E case fatality rate (valid only in high-volume facilities or when aggregated across multiple facilities)
Outcome
1.4. Women with delayed or obstructed labour
% facilities with supplies/equipment for vacuum or forceps-assisted delivery
Input (Commodities / Equipment)
[2] 1
% women with prolonged labour (active labour > 12 hours) managed appropriately (composite indicator) (see WHO 2018 intrapartum care recommendations)
Process/Output (Service Delivery)
% women with prolonged/obstructed labour who gave birth by C-section
Output (Service Delivery)
1

16
Indicator Category (under revision)
Potential Data Sources or Methods
Routine Information
Systems
Client Interview
Observation (clinical or
operational)
Other
% all women who gave birth in the facility whose active first stage of labour > 12 hours
Outcome 1
% women with obstructed labour with unmet need for C-section
Outcome 1
Case fatality rate for women with prolonged labour (valid only in high-volume facilities or when aggregated across multiple facilities)
Outcome 1 [2]
Newborn asphyxia rate (adverse intrapartum outcome)
Outcome 1 [2]
1.6.a. Women in preterm labour
% facilities with antenatal corticosteroids available Input (Commodities / Equipment)
[2] 1
% women with preterm pre-labour rupture of membranes who received prophylactic antibiotics
Process/Output (Service Delivery)
% preterm newborns whose mothers received corticosteroids when indicated
Process/Output (Service Delivery)
1
1.7.a. Women with or at risk for infections
% facilities with first- and second-line antibiotics available
Input (Commodities / Equipment)
[2] 1
% women with C-section who received prophylactic antibiotics before C-section
Process/Output (Service Delivery)
1
% women with pre-labour rupture of membranes who received antibiotics
Process/Output (Service Delivery)
1
% women who gave birth in the facility with signs of infection treated with appropriate antibiotics
Process/Output 1
Maternal infection/sepsis case fatality rate (valid only in large facilities or when aggregated across multiple facilities)
Outcome
1.8 Women and newborns: prevent hospital-acquired infections
(See Standard 8.1 for more indicators.)
1.9. Women (and newborns): harmful practices
% uncomplicated, vaginal births where episiotomy performed
Process/Output (Service Delivery)
1
NEWBORN
Newborn Outcome Measures
Pre-discharge neonatal mortality rate** Outcome 1
Facility stillbirth rate (disaggregated by fresh and macerated)**
Outcome 1
Neonatal deaths classified by cause (ICD-PM)** Outcome 1 SI (if needed)

17
Indicator Category (under revision)
Potential Data Sources or Methods
Routine Information
Systems
Client Interview
Observation (clinical or
operational)
Other
Facility intrapartum stillbirth rate (plus fetal heart rate documented at admission)
Outcome 1
% newborns with specific complications (prematurity, possible serious bacterial infection, asphyxia)
Outcome 1
Neonatal cause-specific case fatality rate Outcome 1
1.1.b. Newborns receive routine care immediately after birth
% facilities with essential supplies available Input (Commodities / Equipment)
[2] 1
% facilities with written, up-to-date clinical protocols
Input (Policy / Protocol)
1
% staff with recent in-service training Input (Training) 1 SI
% facilities with supportive supervision Output (Supervision)
1
% newborns breastfed within one hour of birth** Output (Behaviour)
1 [2]
% newborns with documented birthweight** Output (Service Delivery)
1
% newborns who received essential early newborn care (drying, skin to skin, delayed cord clamping, breastfeeding)
Process/Output
1.1.c. (Women and) newborns receive routine postnatal care
% postnatal mothers/babies monitored appropriately for danger signs (vital signs/clinical signs)
Process/Output 1
% newborns receiving vitamin K and full vaccination
Process/Output (Service Delivery)
1
% newborns breastfed exclusively at time of discharge
Process/Output 1
% postpartum women counselled on birth spacing and postpartum contraception options
Process/Output
% women discharged postpartum with contraceptive method of choice
Output/Process
% live births delivered in the facility that were notified by the facility to the civil registrar (in the context where health workers/health facilities have responsibility to notify live birth to the civil registrar)
Output/Process 1 SI
% women/families who received postpartum counselling on importance of birth registration and obtaining a birth certificate and the process for registration of their infants with the civil registrar to obtain a birth certificate (applicable for all facilities, regardless of civil registration laws and policies in the country)
Process/Output 1
SI

18
Indicator Category (under revision)
Potential Data Sources or Methods
Routine Information
Systems
Client Interview
Observation (clinical or
operational)
Other
% live births delivered in the facility that were registered in the civil registry by the facility (applicable where health workers/health facilities have responsibility to register live births into the civil registry)
Process/Output 1 SI
1.5. Newborns who are not breathing spontaneously
% facilities with suction device, mask and bag (size 0 and 1)
Input (Commodities / Equipment)
[2] 1
% live-born newborns not breathing after additional stimulation who were resuscitated with bag and mask
Outcome (Service Delivery)
1
1.6.b. Preterm and small babies receive appropriate care
% facilities with supplies/equipment for thermal care and feeding of small babies
Input (Commodities / Equipment)
[2] 1
Proportion of newborns < 2000 grams initiated on KMC (or admitted to KMC unit if separate unit exists)**
Process/Output (Service Delivery)
1
% eligible neonatal babies (≤ 2000 grams) who receive near continuous KMC
Process/Output (Service Delivery)
1
1.7.b. Newborns with suspected/risk factors for infection
% facilities with first- and second-line antibiotics available
Input (Commodities / Equipment)
[2] 1
% newborns of mothers with signs of infection who are evaluated for infection and treated as appropriate
Process/Output (Service Delivery)
1
% newborns with signs of infection who received appropriate antibiotics
Process/Output (Service Delivery)
1
1.9. (Women and) newborns: harmful practices
% facilities with no displays of infant formula, bottles, teats
Input (Other) 1
% women who received augmentation of labour (uterotonics) with no indication of delay in labour progress
Process/Output (Service Delivery)
1
% women with uncomplicated, spontaneous vaginal birth in whom episiotomy performed
Process/Output (Service Delivery)
1
STANDARD 2. HEALTH INFORMATION SYSTEMS
2.1. Complete, accurate, standardized medical record
% facilities with birth and death registration linked to vital national registration system
Output (Information Systems)
1
% facilities with standardized registers, patient charts and data collection forms
Input (Information Systems)
1

19
Indicator Category (under revision)
Potential Data Sources or Methods
Routine Information
Systems
Client Interview
Observation (clinical or
operational)
Other
% facilities with system for classifying maternal and newborn diseases and health outcomes, including death, aligned with ICD (e.g. ICD-MM/ICD-PM)
Input (Information Systems)
1
% newborns discharged with accurately completed record
Output (Information Systems)
1
% newborns with patient identifier and individual clinical medical record
Output (Information Systems)
1
% postpartum women discharged with accurately completed record
Process/Output (Information Systems)
1
2.2. Mechanism for data collection, analysis and feedback
% facilities in which QI team regularly extracts data, calculates and visualizes prioritized quality indicators
Output/Process 1 SI
% facilities where data regularly reviewed and used to make decisions on QI
Outcome 1
% facilities conducted at least one recent review of maternal and perinatal death
Output (Information Systems)
1 MPDSR
% facilities with standard operating procedures for checking, validating and reporting data
Input (Policy / Protocol)
1
% maternal deaths reviewed with standard audit tools
Process/Output (Information Systems)
[2] MPDSR
% perinatal deaths reviewed with standard audit tools
Process/Output (Information Systems)
[2] MPDSR
% QED facilities implementing “full” cycle of MPDSR according to WHO technical guidance (maternal and perinatal) (Global MPDSR TWG to consider facility MPDSR assessment tools)
Output (Information Systems)
[2] MPDSR
STANDARD 3. REFERRAL
3.1. Decision to refer made without delay
% facilities with standardized referral protocol for identification, management and referral of women/newborns with complications
Input (Policy / Protocol)
1
% facilities with supplies for stabilization and pre-referral treatment
Input (Commodities / Equipment)
[2] 1
% women/newborns who fulfilled criteria for referral and were referred
Process/Output (Service Delivery)
1
% women/newborns with complications transferred to appropriate care level with referral note
Process/Output (Service Delivery)
1 Admin
% women presenting to labour ward who report receiving immediate attention upon arrival
Process/Output 1

20
Indicator Category (under revision)
Potential Data Sources or Methods
Routine Information
Systems
Client Interview
Observation (clinical or
operational)
Other
3.2. Referral follows predetermined plan without delay
% facilities with ready access to functioning ambulance or emergency transport
Input (Commodities / Equipment)
1 Admin
% facilities with up-to-date list of network facilities providing referral services
Input (Information Systems)
1
% newborns who died before or during transfer to higher-level facility
Outcome 1
% newborns referred from facility who completed referral
Outcome 1
% pregnant or postpartum women who died before or during transfer to higher-level facility
Outcome 1
% women referred from facility who completed referral
Outcome 1
3.3. Appropriate information exchange between facilities
% facilities with reliable communication methods for referrals and consultation
Input (Information Systems)
1
% facilities with standardized referral form Input (Information Systems)
1
% referred newborns with counter-referral feedback information
Output (Information Systems)
[2] Admin
% referred women with counter-referral feedback information
Output (Information Systems)
[2] Admin
STANDARD 4. COMMUNICATION
4.1. Women and families receive information about care and have effective interactions with staff
% facilities with accessible health education materials
Input (Other) 1
% facilities with written policy to promote interpersonal communication and counselling
Input (Policy / Protocol)
1
% staff with recent training on interpersonal communication
Output (Training)
1 1 SI
% facilities receiving supportive supervision that addresses counselling
Output (Supervision)
1 Admin
% women receiving postnatal information and counselling before discharge**
Output (Service Delivery)
[2] 1
% women who felt they were adequately informed by the health workers about their care, including examinations
Outcome 1
% women who reported they were given an opportunity to discuss their concerns and preferences
Outcome 1

21
Indicator Category (under revision)
Potential Data Sources or Methods
Routine Information
Systems
Client Interview
Observation (clinical or
operational)
Other
4.2. Coordinated care, with clear, accurate information exchange
% facilities with standard form for documenting clinical progress and care
Input (Information Systems)
1
% facilities with written protocols for verbal and written handovers (shift change, intra-facility transfer, referral, discharge)
Input (Policy / Protocol)
1
% women for whom a partograph has been completed
Process/Output (Information Systems)
1
STANDARD 5. RESPECT AND DIGNITY
5.1. Privacy around the time of labour and childbirth, and their confidentiality is respected
% facilities where physical environment allows privacy
Input (Other) 1
% facilities with written, up-to-date protocols to ensure privacy and confidentiality
Input (Policy / Protocol)
1
% women reported receiving dignified and respectful care during maternity visit
Outcome 1
5.2. Not subjected to mistreatment
% facilities with written accountability mechanism in the event of mistreatment
Input (Policy / Protocol)
1
% facilities with written, up-to-date zero-tolerance nondiscriminatory policies on mistreatment
Input (Policy / Protocol)
1
% staff with recent training on respectful care Output (Training)
Admin, SI
% women who gave birth in facility who reported physical or verbal abuse to themselves [or their newborns]**
Outcome 1
5.3. Informed choices about the services
% facilities with written, up-to-date policies on obtaining informed consent
Input (Policy / Protocol)
1
% facilities with standard informed consent form Input (Other) 1
% women who felt adequately informed by health workers about their health and care
Outcome 1
STANDARD 6. EMOTIONAL SUPPORT
6.1. Offered option of companion of choice
% facilities with written, up-to-date policies for one person of woman’s choice
Input (Policy / Protocol)
1
% facilities with labour and childbirth areas organized to allow for private space
Input (Infrastructure)
1 Admin
% women who wanted and had a companion of their choice in labour [childbirth]**
Output (Service Delivery)
1
% women reported receiving supportive care during maternity stay
Output 1

22
Indicator Category (under revision)
Potential Data Sources or Methods
Routine Information
Systems
Client Interview
Observation (clinical or
operational)
Other
6.2. Support to strengthen her capabilities
% facilities with written, up-to-date protocol on minimizing unnecessary interventions
Input (Policy / Protocol)
1
% staff with recent training on providing emotional support
Output (Training)
1 SI
% women undergoing bereavement or adverse outcome who report additional emotional support from facility staff
Outcome 1
STANDARD 7. MOTIVATED STAFF
7.1. Access at all times to skilled birth attendant
% facilities displaying roster of staff on duty, shift times
Input (Other) 1
% facilities with skilled birth attendant available all the time in sufficient numbers to meet workload
Input (Other) 1 Admin
% available posts that are filled by staff with necessary competence
Input (Other) Admin
% births attended by a skilled birth attendant Process/Output 1 [2] [2]
% women reporting sufficient staff at health facility Outcome 1
7.2. Skilled birth attendants have competence and skills
% facilities with standard procedures for recruitment, motivation and retention
Input (Other) 1
% facilities with programme for continuing professional and skills development
Input (Policy / Protocol)
1
% skilled birth attendant staff with recent in-service training
Input (Training) 1 SI
% staff who supervised/mentored to support clinical competence and QI in last quarter
Output (QI) 1 Admin, SI
% staff who can identity and report on at least one clinical activity in which they are personally involved
Output (QI) 1 Admin, SI
Measure of health worker experience of providing care in the facility and/or support – to be determined
Output/Process Health worker
interview
7.3. Leadership in continuous QI
% facilities with written, up-to-date plan for improving quality of care and patient safety
Input (QI) 1 Admin, SI
% facilities with designated QI team Input (QI) 1 SI
% facilities with QI review meeting within at least past one month
Output (QI) 1 Admin, SI
% leaders at facility trained in QI and leading change
Output (QI) 1 Admin, SI
% facilities with mechanism for regular collection of information on patient and provider experiences
Input (QI) 1
% facilities with an established liaison mechanism to district (and/or national level) on quality issues
Input (QI) 1 SI
% QI meetings held in last 12 months Output (QI) Admin, SI

23
Indicator Category (under revision)
Potential Data Sources or Methods
Routine Information
Systems
Client Interview
Observation (clinical or
operational)
Other
% facilities that participated in data sharing with district and community to inform user decision-making, prioritization and planning
Output (QI) 1 Admin, SI
% leaders communicated performance through established mechanisms (e.g. dashboards)
Output (QI) Admin, SI
STANDARD 8. PHYSICAL ENVIRONMENT
8.1. WASH functioning, reliable, safe and sufficient
% facilities with basic water supply in maternity care areas (labour, birth, postnatal)
Input (WASH) 1 [2]
% facilities with basic environmental cleaning practices in maternity areas (labour, birth, postnatal); written cleaning protocols, trained cleaning staff and providers
Input (WASH) 1 [2]
% facilities with basic health-care waste management in maternity care areas
Input (WASH) 1
% facilities with basic hygiene provisions in maternity care areas (functional handwashing station, access to bathing/shower area, basic sterile equipment)
Input (WASH) 1 [2]
% facilities with basic sanitation available for women during and after labour and childbirth (toilet, latrine)
Input (WASH) 1
% facilities with written protocol and awareness materials (posters) on WASH and waste management
Input (WASH) 1
% women reporting satisfactory access to water Outcome 1
8.2. Labour, childbirth and postnatal care appropriately organized
% facilities with adequate labour and childbirth areas/rooms for estimated number of births
Input (Infrastructure)
1
% facilities with dedicated area in labour/childbirth area for resuscitation of newborns, which is adequately equipped
Input (Infrastructure)
1
% facilities with policy and space for rooming-in of mothers and babies 24 hours a day
Input (Infrastructure)
1
% women reporting clean physical environment Outcome 1
8.3. Adequate stock of medicines, supplies and equipment
% facilities with regular source of electricity Input (Infrastructure)
1
% facilities with essential laboratory supplies and tests
(See Standards 1 & 3 for more indicators on medicines, supplies and equipment.)
**Common QED indicator. Admin: administrative data source; CEmONC: comprehensive emergency obstetric and newborn care; C-section: caesarean section; ICD: International Statistical Classification of Diseases and Related Health Problems; ICD-MM: WHO application of ICD-10 to deaths during pregnancy, childbirth, and puerperium; ICD-PM: WHO application of ICD-10 to deaths during the perinatal period; KMC: kangaroo mother care; MPDSR: Maternal and Perinatal Deaths Surveillance and Response; PE/E: pre-eclampsia/eclampsia; PPH, postpartum haemorrhage; QED: Quality, Equity, Dignity; QI: quality improvement; SI: staff interview; TWG: Thematic Working Group; WASH: water, sanitation and hygiene.

24
Routine Information Systems (see more details in section 4, page 4):
• Patient records/registers: This original data source is typically aggregated into a HMIS (e.g. DHIS2), or a records review process can be used to analyse this data source.
• Health management information systems (HMIS/DHIS2): Aggregation of health service delivery, which is typically drawn from patient records or other facility registers.
• Logistics management information systems (LMIS): Commodities, medicines, medical supplies and other supply chain management information.
• Human resources information systems: Information on human resources, staff placement and training received.
Client Interview: Asking clients about the provision or experience of care is a critical data source for understanding QoC.
Observation: Observing patient care or service readiness (e.g. commodity stock availability or presence of water and sanitation in facilities) is a critical data source. Observations can be conducted by an internal team (e.g. QI team) or by external reviewers (e.g. health facility assessment, such as SARA, SPA).
Other Data Sources:
• Administrative data source: Refers to administrative data sources, such as budget, equipment purchasing, or other relevant data sources.
• Maternal and Perinatal Death Surveillance and Response (MPDSR): MPDSR may have a separate data collection system.
• Staff interview: A qualitative interview with facility or district staff members (e.g. managers, providers, pharmacists, etc.) can be conducted by an internal team or external reviewer. In-person interviews are preferred, but under certain circumstances interviews could be conducted remotely (i.e. via telephone).
A frontline health worker gives a vaccine to a student during a Measles Rubella vaccination session at Kendriya Vidyalaya School in Pasighat, in India’s north-eastern state of Arunachal Pradesh in February 2018. ©UNICEF/Boro

25
Annex 4. Implementation Milestones The table below outlines the recommended implementation milestones that track progress against the Network’s strategic objectives (Leadership, Action, Learning and Accountability). Additional details can be found in the working document on the QoC Strategy7 and Country Implementation Guidance. Note that this list is preliminary and more detailed definitions and data sources are forthcoming.
Implementation Milestones (by Strategic Objective) Source
1. LEADERSHIP
1. National and district governance structures for QoC are strengthened (or established) and functioning.
1. National leadership structure for QoC in health services is strengthened (or established).
Desk Review
2. Ministerial, multi-stakeholder steering group for quality improvement in MNH services is strengthened (or established).
Desk Review
3. QoC committees in district health management teams are established (including representatives from the community and women’s associations) and functioning.
Desk Review
4. QoC committees in hospitals and QI teams in health facilities are established (including representatives from the community and women’s associations) and functioning.
Desk Review* (a,b)
5. Liaison mechanism between groups at the three levels (national, district and health facility) on quality issues is established and functioning.
Desk Review* (a,b)
2. National vision, strategy and operational plan for improving QoC in MNH services is developed, funded, monitored and regularly reviewed.
1. National vision, strategy and operational plan (with targets) for improving QoC in MNH services is developed.
Desk Review
2. Partners are aligned and resources mobilized for implementation of the national operational plan.
Desk Review
3. Implementation of the national operational plan is costed and funding allocated in the budget.
Desk Review
4. Human resources for implementation of the national plan are committed and roles and responsibilities of different stakeholders are agreed.
Desk Review
5. Regular reviews of progress against targets are conducted and the national plan is adjusted as required.
Desk Review
3. National advocacy and mobilization strategy for QoC is developed and implemented.
1. Professional associations, academia, civil society and the private sector are brought together and mobilized to champion the Network and support implementation.
Desk Review
2. National advocacy and mobilization strategy developed, implemented and monitored. Desk Review* (b)
2. ACTION
1. WHO evidence-based standards of care for mothers and newborns are adapted and disseminated.
1. National standards and protocols for maternal and newborn QoC are compiled and reviewed.
Desk Review
2. National standards and protocols are adapted and updated using WHO standards of MNH care.
Desk Review
3. National standards and protocols are incorporated into national practice tools. Desk Review
4. Updated national standards, protocols and practice tools are disseminated to all relevant stakeholders and used.
Desk Review* (a,b)

26
2. National package of improvement interventions is adapted (or developed) and disseminated.
1. QI interventions in the country are compiled and reviewed and best practices are identified.
Desk Review
2. QoC situation is assessed and quality gaps identified based on the national standards of care.
Desk Review
3. National package of QI interventions to address identified quality gaps is developed and disseminated, drawing on the WHO QI intervention.
Desk Review
3. Clinical and managerial capabilities to support QI are developed, strengthened and sustained.
1. A national resource centre, with tools to improve capabilities of health-care providers and managers, is established and functioning.
Desk Review* (b)
2. National and district pools of consultants and facilitators with expertise in quality improvement (including PLA) are identified and trained.
Desk Review
3. National QI and PLA manuals for national-, district-, facility- and community-level groups and committees are developed and used.
Desk Review* (a,b)
4. Monthly meetings for participatory learning on QI at district, facility and community levels are scheduled and implemented.
Desk Review* (a,b)
4. QI interventions for MNH are implemented.
1. Demonstration sites for QoC in MNH services are identified and established to implement national package of QI interventions.
Desk Review
2. Change package is adapted to district context. Desk Review
3. Resources and technical support to implement the change package in the districts are provided.
Desk Review
4. Success of demonstration sites is regularly reviewed and assessed. Desk Review* (a,b)
5. Refined package of effective and scalable QoC interventions is identified from demonstration sites.
Desk Review
6. Implementation of refined package of interventions is expanded into new districts and health facilities.
Desk Review* (a,b)
3. LEARNING
1. Data systems are developed/strengthened to integrate and use QoC data for improved care.
1. A national minimum set of MNH QoC indicators at the district and national levels, aligned with the common cross-country indicators, is agreed and validated.
Desk Review
2. Process to add a minimum set of MNH QoC indicators in the national health information system established and supported as appropriate. In addition, other local information sources (e.g. maternity registers) updated to monitor prioritized indicators for district and facility level, as needed.
Desk Review* (a,b)
3. Data collection, synthesis and reporting is standardized and data quality is monitored and assessed.
Desk Review* (a,b)
4. Capabilities in data collection, synthesis and use for improving care at health facility, district and national levels are strengthened.
Desk Review
5. System for collection and reporting of case histories, stories from the field, and testimonials developed and used.
Desk Review* (a,b)
6. Key data are shared with health facility staff, district health teams and community groups to inform user decision-making, prioritization and planning.
Desk Review* (a,b)

27
2. Mechanisms to facilitate learning and share knowledge through a learning network are developed and strengthened.
1. National and international resources on QoC are accessed through a dedicated QoC website.
Desk Review
2. Virtual and face-to-face learning networks and communities of practice are established and supported at the global, national and district levels.
Desk Review* (a,b)
3. Learning collaboratives between health facilities and districts are established and supported.
Desk Review* (a,b)
4. Government focal point and national institution to coordinate and sustain a national learning network are identified.
Desk Review
3. Data and practice are analysed and synthesized to generate an evidence base on QoC improvement.
1. Data are regularly analysed and synthesized to identify successful interventions. Desk Review* (a,b)
2. Best practices and variations are identified and disseminated within and between countries.
Desk Review
4. ACCOUNTABILITY
1. National framework and mechanisms for accountability for QoC are established and functioning.
1. Quality indicator dashboards to track progress at facility, district and national levels are developed and regularly updated and published.
Desk Review* (a,b)
2. Inputs and outputs in the national operational plan for QoC are tracked and regularly reported, and reports disseminated to stakeholders and discussed in national forums.
Desk Review* (b)
3. Regular multi-stakeholder dialogue is conducted to monitor progress and resolve issues.
Desk Review* (a,b)
4. Periodic independent assessments of progress to validate routinely reported results are conducted.
Independent Assessment
2. Progress of the Network on MNH QoC is regularly monitored.
1. Annual progress report on the Network is published. Desk Review
2. Network plan is reviewed, revised and shared. Desk Review
3. Annual review and planning meeting of the Network (members and affiliates) is held. Desk Review
4. Learnings of implementation are summarized and made available in the public domain (including peer-reviewed publications).
Desk Review
3. Impact of the global initiative on MNH QoC is evaluated.
1. Country-specific evaluation designs are developed and agreed. Desk Review
2. Pre-intervention qualitative and quantitative data collection are established and implemented.
Desk Review* (a,b)
3. Interim impact analysis is performed and used to inform programme implementation. Desk Review* (a,b)
4. Final impact analysis is performed and disseminated. Desk Review
* = Indicator has more detailed data source requirements. a = Indicator may require subnational (e.g. district, facility, community) data collection. b = Indicator may require regular or ongoing (e.g. quarterly, six-monthly, annual) update of information. MNH: maternal and newborn health; PLA: participatory learning and action; QI: quality improvement; QoC: quality of care; WHO: World Health Organization.

References1. Standards for improving quality of maternal and
newborn care in health facilities. Geneva: World Health Organization; 2016 (https://apps.who.int/iris/bitstream/handle/10665/249155/9789241511216-eng.pdf; accessed 18 February 2019).
2. Standards for improving quality of care for children and young adolescents in health facilities. Geneva: World Health Organization; 2018 (https://apps.who.int/iris/bitstream/handle/10665/272346/9789241565554-eng.pdf; accessed 18 February 2019).
3. Strategies toward ending preventable maternal mortality. Geneva: World Health Organization; 2015 (http://apps.who.int/iris/bitstream/10665/153540/1/WHO_RHR_15.03_eng.pdf; accessed 18 February 2019).
4. Moran AC, Jolivet RR, Chou D, Dalglish SL, Hill K, Ramsey K, et al. A common monitoring framework for ending preventable maternal mortality, 2015–2030: phase I of a multi-step process. BMC Pregnancy Childbirth. 2016;16(1):250. doi:10.1186/s12884–016–1035–4.
5. Every newborn: an action plan to end preventable deaths. Geneva: World Health Organization; 2014 (https://apps.who.int/iris/bitstream/handle/10665/127938/9789241507448_eng.pdf; accessed 18 February 2019).
6. Moxon SG, Ruysen H, Kerber KJ, Amouzou A, Fournier S, Grove J, et al. Count every newborn; a measurement improvement roadmap for coverage data. BMC Pregnancy Childbirth. 2015;15 (Suppl 2):S8. doi:10.1186/1471–2393–15-S2-S8.
7. Indicator and monitoring framework for the global strategy for women’s, children’s and adolescents’ health (2016–2030). New York: Every Woman Every Child; 2015 (http://www.who.int/life-course/publications/gs-Indicator-and-monitoring-framework.pdf; accessed 18 February 2019).
8. Quality, equity, dignity: a network to Improve quality of care for mothers, newborns and children. Geneva: World Health Organization; 2017 (https://www.who.int/maternal_child_adolescent/topics/quality-of-care/quality-of-care-brief-qed.pdf; accessed 18 February 2019).
9. Tunçalp Ӧ, Were W, MacLennan C, Oladapo OT, Gülmezoglu AM, Bahl R, et al. Quality of care for pregnant women and newborns-the WHO vision. BJOG. 2015:122(8):1045–9. doi:10.1111/1471–0528.13451.
10. Primary Health Care Performance Initiative (PHCPI) methodology note. Washington (DC): PHCPI; 2015 (https://improvingphc.org/sites/default/files/PHCPI%20Methodology%20Note_0.pdf; accessed 18 February 2019).
11. International Health Partnership (IHP+); World Health Organization. Monitoring, evaluation, and review of national health strategies: a country-led platform for information and accountability. Geneva: World Health Organization; 2011 (https://www.who.int/healthinfo/country_monitoring_evaluation/1085_IER_131011_web.pdf; accessed 18 February 2019).
12. Monitoring the building blocks of health systems: a handbook of indicators and their measurement strategies. Geneva: World Health Organization; 2010 (https://www.who.int/healthinfo/systems/WHO_MBHSS_2010_full_web.pdf; accessed 18 February 2019).
13. World Health Organization Regional Office for the Western Pacific. First biennial progress report: action plan for healthy newborn infants in the Western Pacific Region (2014–2020). Geneva: World Health Organization; 2016 (http://iris.wpro.who.int/bitstream/handle/10665.1/13424/9789290617822-eng.pdf; accessed 18 February 2019).
For more information contact:Department of Maternal, Newborn, Child and Adolescent Health (MCA), World Health Organization HQAvenue Appia 20, 1211 Genève, SwitzerlandEmail address: [email protected] us on Twitter @qualitycareNET
www.qualityofcarenetwork.org
Front cover photo: Nurses at the children’s ward at Tamale Central Hospital in Tamale in the Northern Region of Ghana, in November 2015. © UNICEF/Takyo
Design: Inis Communication – www.iniscomunication.com