quality improvement 101 barbara debaun, rn, msn, cic kathleen carrothers, mph, cphq cynosure health
TRANSCRIPT

Quality Improvement 101Quality Improvement 101
Barbara DeBaun, RN, MSN, CICKathleen Carrothers, MPH, CPHQ
Cynosure Health
Today’s Objectives
Describe the elements of process design
Explain how to flow chart a process
Describe the Model for Improvement
Demonstrate 2 Performance Improvement
tools
Describe the elements of process design
Explain how to flow chart a process
Describe the Model for Improvement
Demonstrate 2 Performance Improvement
tools
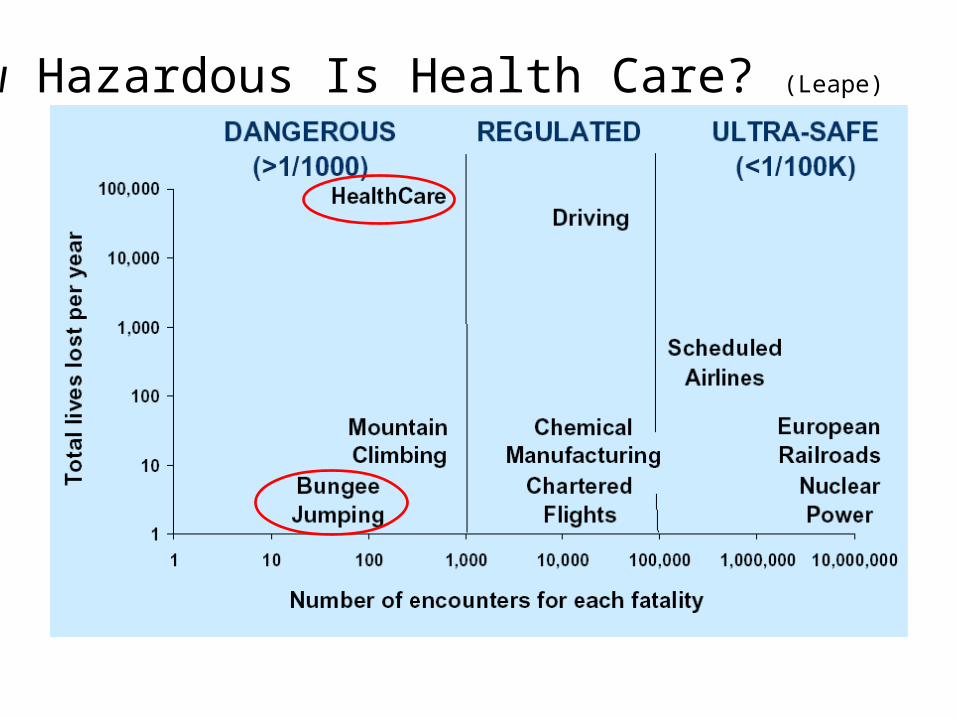
How Hazardous Is Health Care? (Leape)

4

2001

2003: Duke University Medical Center

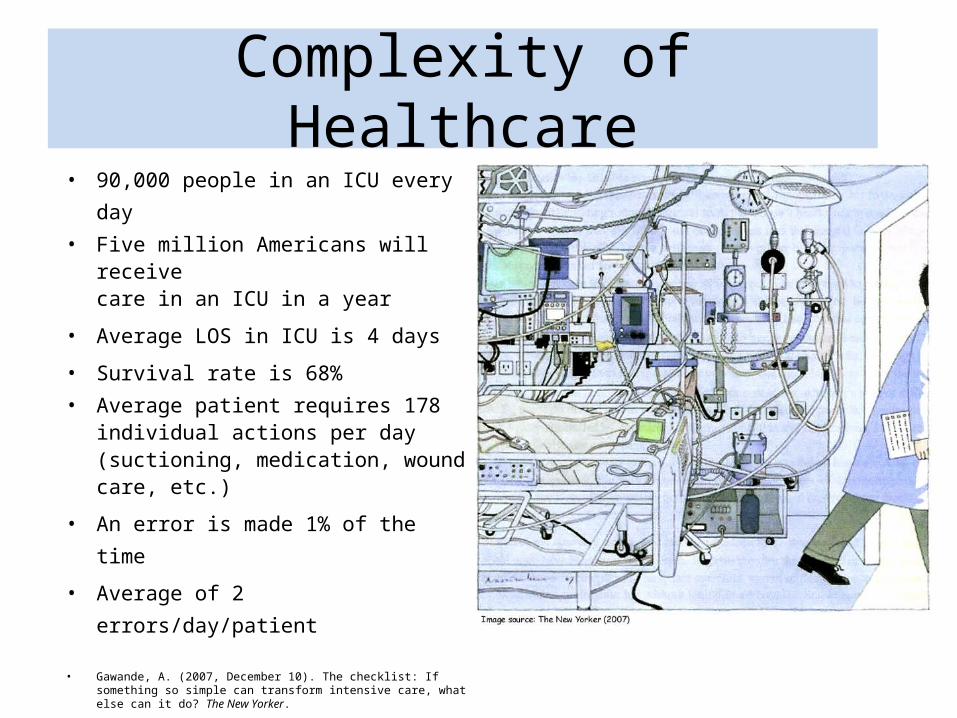
Complexity of Healthcare• 90,000 people in an ICU every day• Five million Americans will receive
care in an ICU in a year
• Average LOS in ICU is 4 days
• Survival rate is 68%• Average patient requires 178
individual actions per day (suctioning, medication, wound care, etc.)
• An error is made 1% of the time
• Average of 2 errors/day/patient
• Gawande, A. (2007, December 10). The checklist: If something so simple can transform intensive care, what else can it do? The New Yorker.
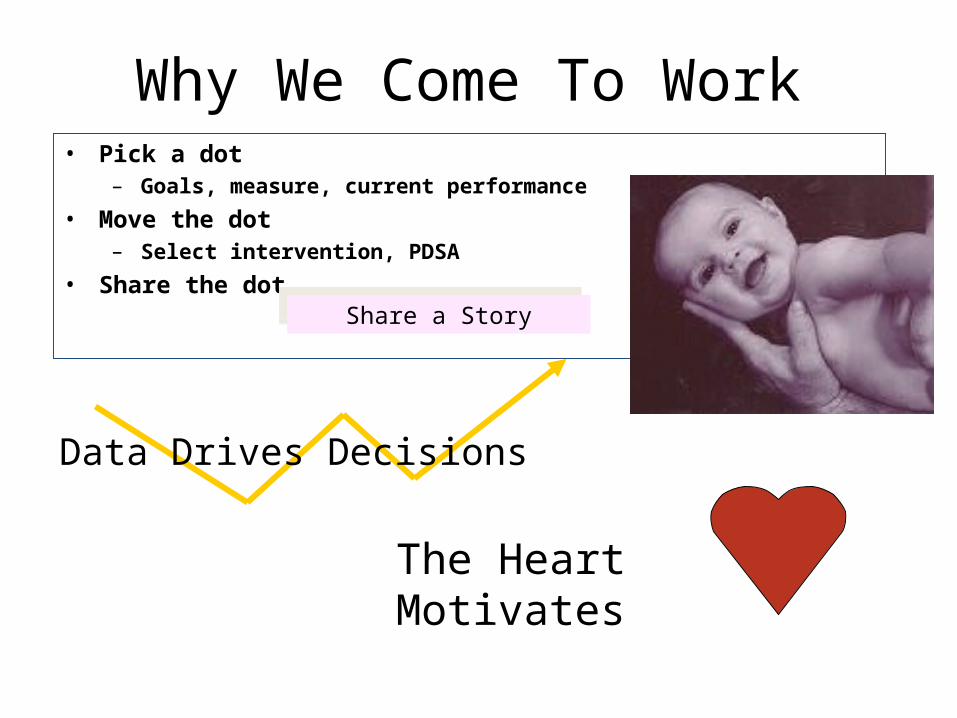
Why We Come To Work• Pick a dot
– Goals, measure, current performance
• Move the dot– Select intervention, PDSA
• Share the dot
The Heart Motivates
Share a StoryShare a Story
Data Drives Decisions
10 Years Ago
Central Line Blood Stream Infections were a part of doing business
Ventilator Associated Pneumonia was an unfortunate consequence of being sick
Sepsis was defined as shock from infection and carried a 50% mortality rate
2012: Zero Tolerance
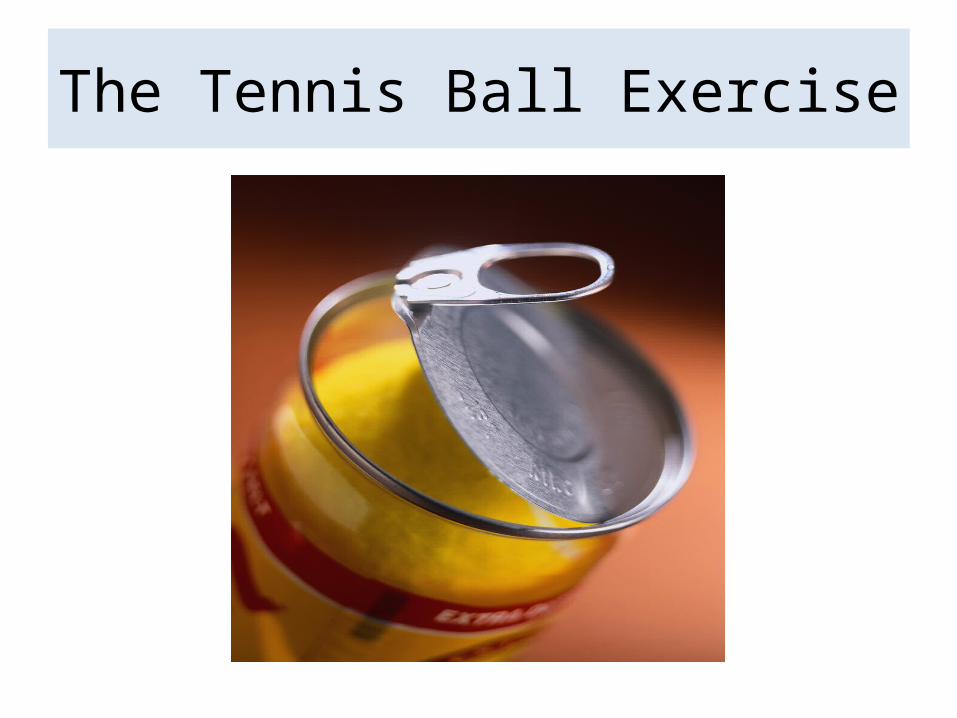
The Tennis Ball Exercise

How To Play• Break up into groups of 4-5 people• Select - Timer, Scribe, Leader• Using your tennis balls, spend 5 minutes designing a process that meets the
following specifications:
– Each ball must be touched by each person at least one time– The ball cannot be passed to the person directly next to you– The balls must be moved from person to person
• Time your process• The goal is to build a process that meets the design specifications in the
shortest amount of time• After 5 minutes we will get the best time from each team• You will then have another 5 minutes to improve your process
• Break up into groups of 4-5 people• Select - Timer, Scribe, Leader• Using your tennis balls, spend 5 minutes designing a process that meets the
following specifications:
– Each ball must be touched by each person at least one time– The ball cannot be passed to the person directly next to you– The balls must be moved from person to person
• Time your process• The goal is to build a process that meets the design specifications in the
shortest amount of time• After 5 minutes we will get the best time from each team• You will then have another 5 minutes to improve your process
What Did You Do?
– Formed a team– Designated roles– Brainstormed– Designed a process– Measured its performance– Benchmarked its performance– Analyzed the process design– Redesigned your process– Measured your new process, etc.
– Formed a team– Designated roles– Brainstormed– Designed a process– Measured its performance– Benchmarked its performance– Analyzed the process design– Redesigned your process– Measured your new process, etc.
Learning PI From Tennis Balls
• Before you can improve a process you need to know how it works
• Listen to all members of your team• Especially those who are closest to the process• Share improvement ideas• Try them
More Learning’s
• If at first you don’t succeed, try, try again
• Look at others who perform the process well both within and externally
• Borrow their ideas• Keep going• It’s the best process not the
best people
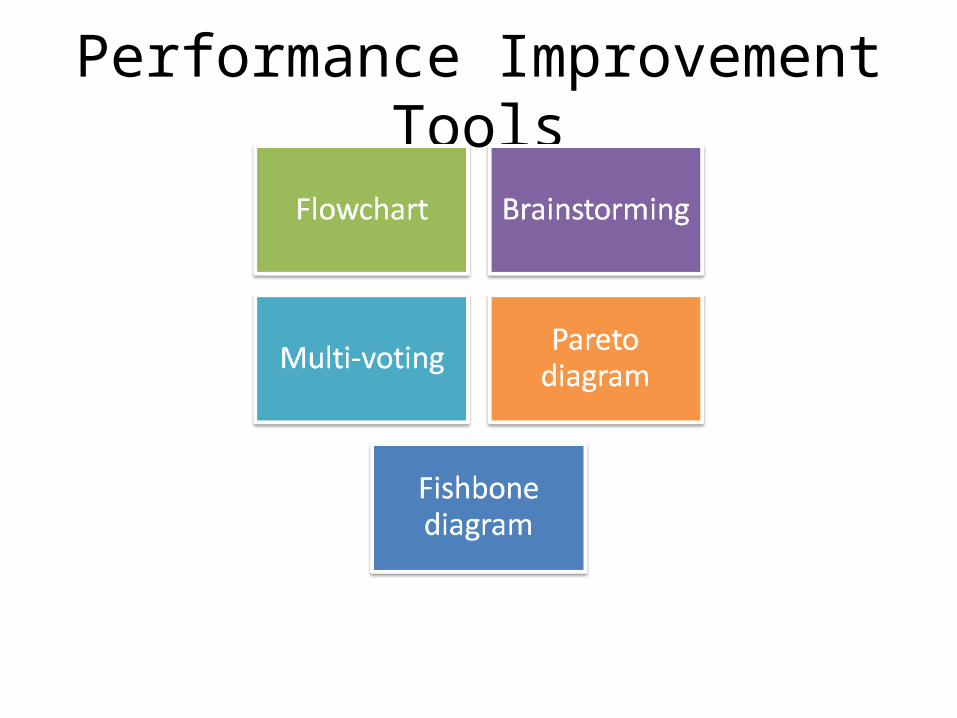
Performance Improvement Tools

Facts About Flowcharts
• Used to visually explain a process and the interrelationship between process steps
• Allows analysis and better understanding of a process
• Great way for a workgroup to better understand their environment
• Excellent training documents
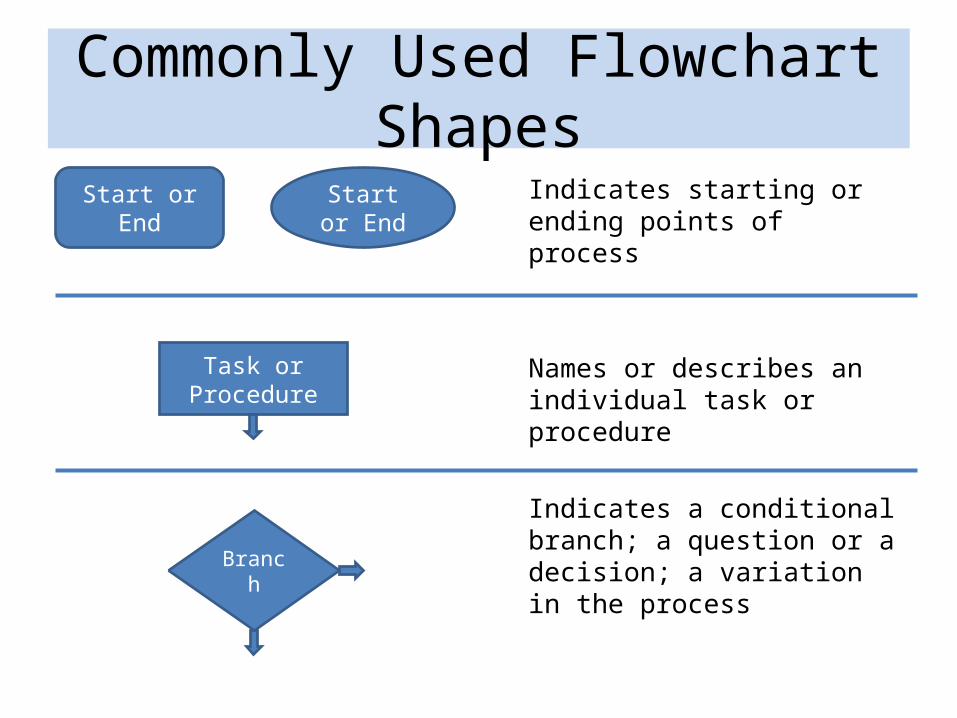
Commonly Used Flowchart Shapes
Indicates starting or ending points of process
Names or describes an individual task or procedure
Indicates a conditional branch; a question or a decision; a variation in the process
Start or End Start or End
Task or Procedure
Branch
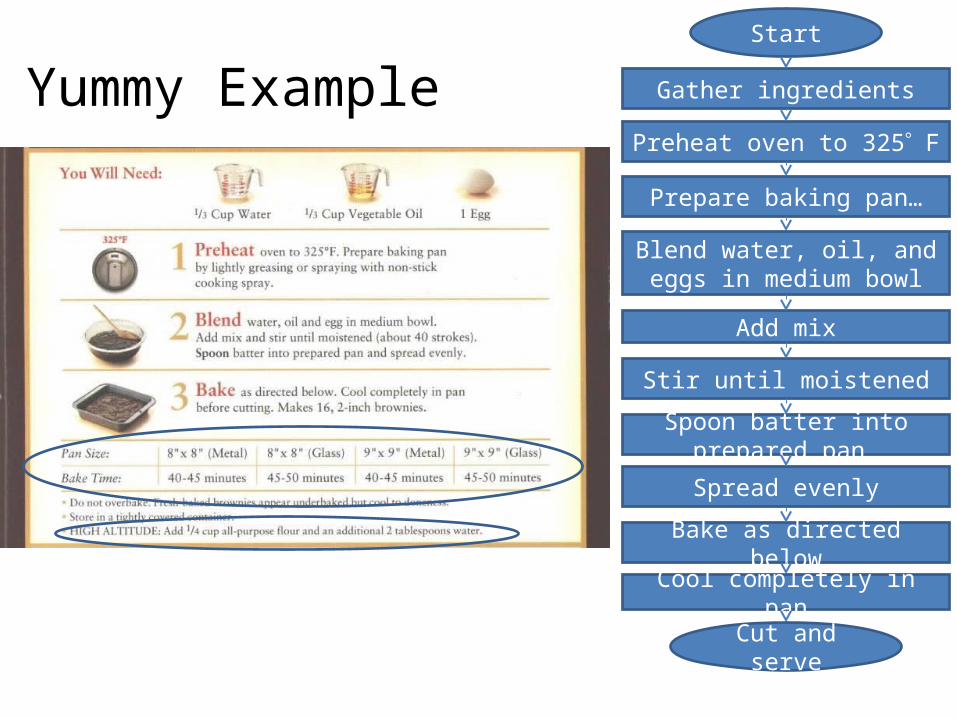
Start
Gather ingredients
Preheat oven to 325 F
Prepare baking pan…
Blend water, oil, and eggs in medium bowl
Add mix
Spread evenly
Bake as directed below
Cool completely in pan
Cut and serve
Spoon batter into prepared pan
Stir until moistened
Yummy Example

Start
Gather ingredients
Preheat oven to 325 F
Prepare baking pan…
Blend water, oil, and eggs in medium bowl
Add mix
Spread evenly
Cool completely in pan
Cut and serve
Spoon batter into prepared pan
Stir until moistened
Are you at high
altitude?
No
Add ¼ cup flour and
add’l 2 Tbsps. water
Yes
Pan type?
Bake 45-50
minutes
Glass
Metal
Bake 40-45
minutes
Flowcharts
• Identifies parts of the process where data can be collected
• Serves as a training tool to understand the complete process
• Identifies parts of the process where data can be collected
• Serves as a training tool to understand the complete process

Flowchart Analysis
• What does your process look like?• What does the desired process look like? • Compare both charts, looking for areas where
they are different• Focus improvement efforts on the differences
or areas of rework and delays
• What does your process look like?• What does the desired process look like? • Compare both charts, looking for areas where
they are different• Focus improvement efforts on the differences
or areas of rework and delays
24
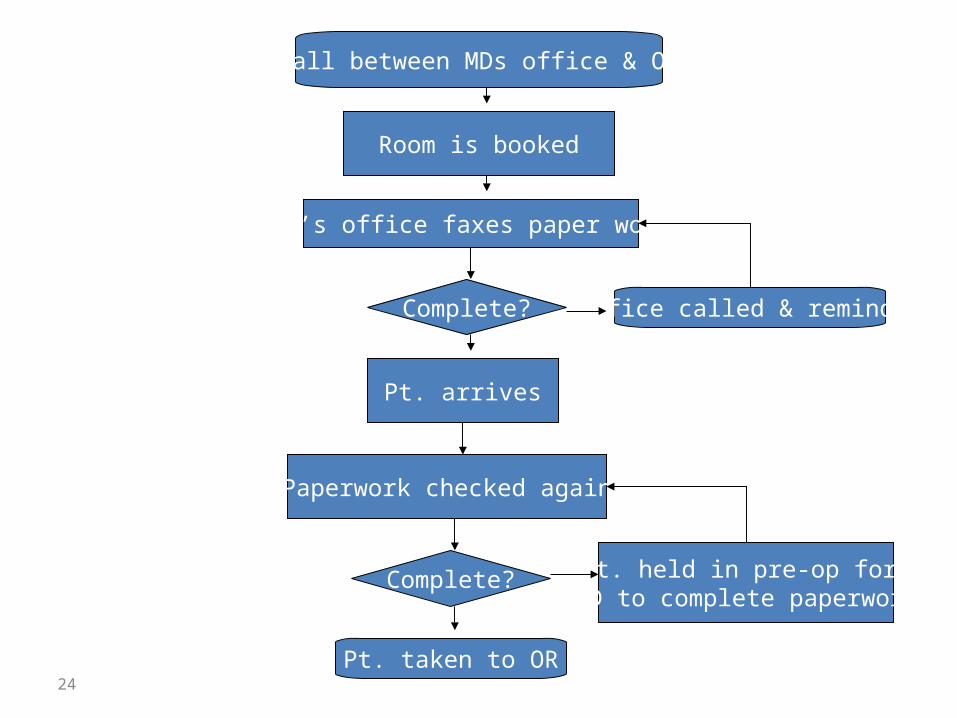
Call between MDs office & OR
Room is booked
MD’s office faxes paper work
Complete?
Pt. arrives
Paperwork checked again
Complete?
Office called & reminded
Pt. taken to OR
Pt. held in pre-op for MD to complete paperwork

Give It a Try
• At your table pick one of the following
processes to flowchart:
– Packing for the last trip you took
– Preparing the last meal you cooked
– Getting here today
• Determine the start and ending point of the
process
• At your table pick one of the following
processes to flowchart:
– Packing for the last trip you took
– Preparing the last meal you cooked
– Getting here today
• Determine the start and ending point of the
process

Decisions to Make
• Decide on the level of detail
– Simple macro-flowchart shows only the
general process flow
– Detailed flowchart shows all actions and
decision points
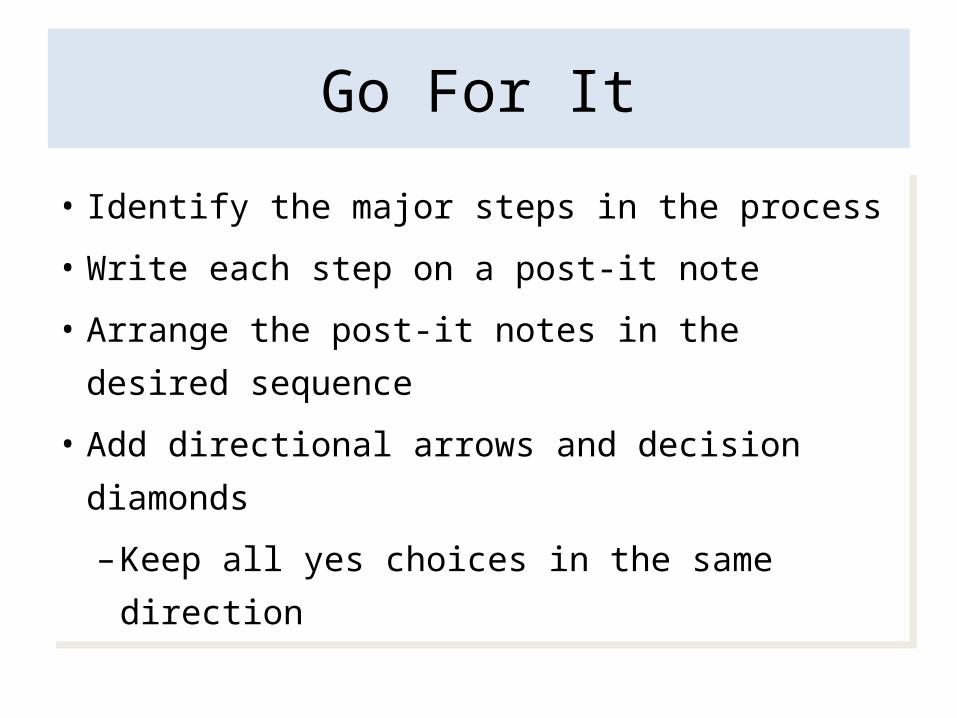
Go For It
• Identify the major steps in the process
• Write each step on a post-it note
• Arrange the post-it notes in the desired
sequence
• Add directional arrows and decision diamonds
– Keep all yes choices in the same direction
• Identify the major steps in the process
• Write each step on a post-it note
• Arrange the post-it notes in the desired
sequence
• Add directional arrows and decision diamonds
– Keep all yes choices in the same direction
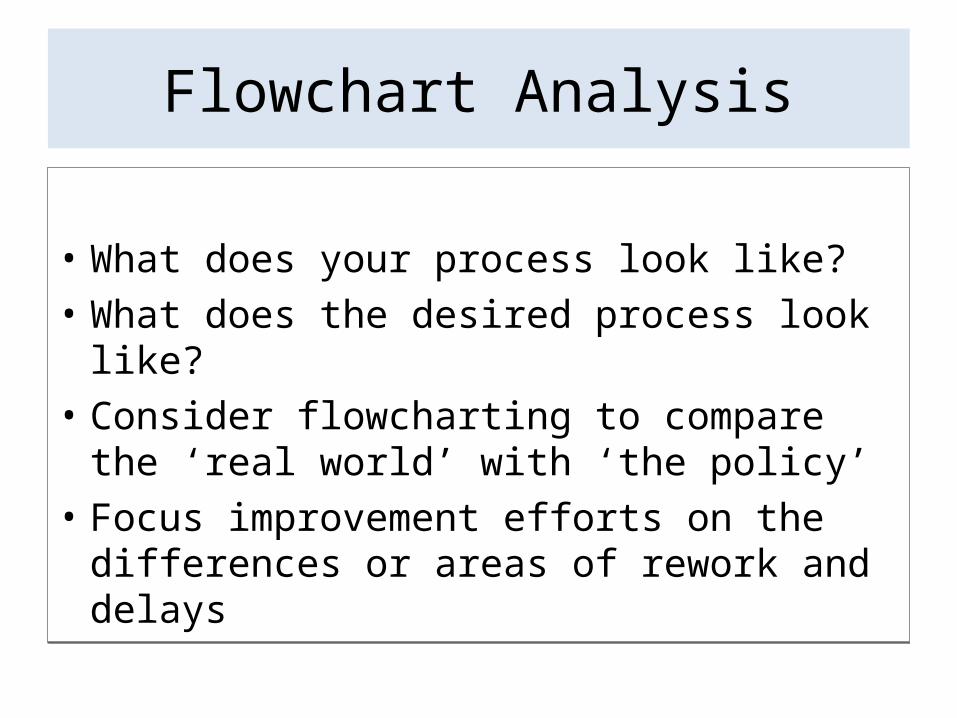
Flowchart Analysis
• What does your process look like?• What does the desired process look like?• Consider flowcharting to compare the ‘real
world’ with ‘the policy’ • Focus improvement efforts on the differences
or areas of rework and delays
• What does your process look like?• What does the desired process look like?• Consider flowcharting to compare the ‘real
world’ with ‘the policy’ • Focus improvement efforts on the differences
or areas of rework and delays
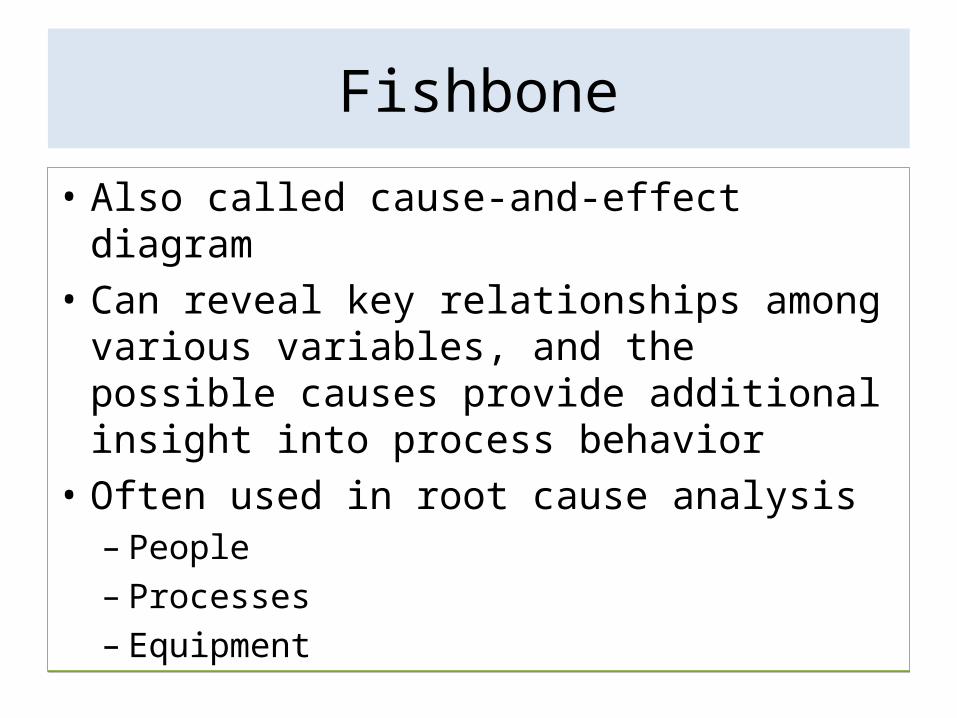
Fishbone
• Also called cause-and-effect diagram• Can reveal key relationships among various
variables, and the possible causes provide additional insight into process behavior
• Often used in root cause analysis– People– Processes– Equipment
• Also called cause-and-effect diagram• Can reveal key relationships among various
variables, and the possible causes provide additional insight into process behavior
• Often used in root cause analysis– People– Processes– Equipment

Catheter-Related Bloodstream
Infection
Poor/ImproperTechnique
Line Colonization/Contamination
Number ofCatheters and/or
Lumens
AntibioticUsage
ContaminatedSupplies
EducationStaffing
Acuity/TimeSite Selection
Lack of hand hygiene
Line inserted without
using sterile technique
Dressing not changed on time
Dressing not occlusive
Line accessed without clean technique including
alcohol swabbing of access site
Poor technique when obtaining blood cultures
More lumens on line than needed
Line not needed but not removed
More than one
central venous catheter
No gown, mask, gloves or hair
covering during insertion
Chloraprep not used for
skin prep prior to
line insertion
Line manipulation
Multiple attempts
Breaks in sterile technique
Inadequatedraping prior to insertion
Treatment basedOn false positive
/contaminatedblood cultures
Blood cultures drawn through
line and results
questionable
Antibiotic use outside hospital
guidelines
Blood leftIn line/end cap
Line from ED/field not changed
Blood at insertion site not
removed
Vascular end caps
not changed
Blood left in end caps
IV tubing hanging without covered end
IVF and components not changed
according to policy
Dressing changes done without appropriate
supplies
Inappropriate use of ultrasound devices
during line insertion
TPN infused via existing line
Inexperienced clinicians
Resident unfamiliar with policy
Nurses do not know dressing change
due; no dates on dressing
Policies not written or not current
Supplemental staff unaware of
policy/lack training
Policy unavailable to medical staff
Medical staff not supportive of policies
Internaljugular or femoral site used
Insertion site near
tracheostomy
Nurses too busy to change
dressing
MD inserts line alone-too
busy to get nurse assistance
Supplemental nursing staff
Inexperienced nursing staff
Other opportunity for dressing
Contamination
Line in place but no longer
needed
Line inserted via undesirable
site (i.e., femoral) not changed
Investigating Practices to Prevent CR-BSI
The Model for Improvement
So You Think You Can Change?

While all changes do not lead to improvement, all improvement requires change.
» Thomas Nolan, The Improvement Guide
While all changes do not lead to improvement, all improvement requires change.
» Thomas Nolan, The Improvement Guide

What are we trying toaccomplish?
How will we know that achange is an improvement?
What change can we make thatwill result in improvement?
Model For Improvement
Act Plan
Study Do
AIM
MEASURE
Selecting Change
Small Tests of Change
What Are We Trying to Accomplish?
• Developing the team’s Aim Statement
34
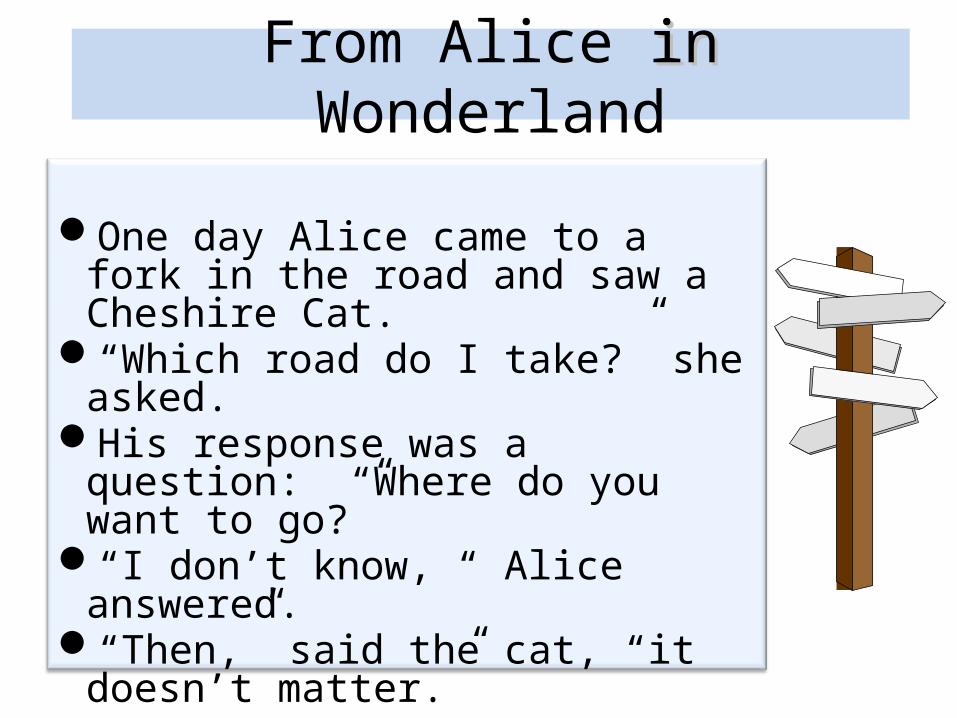
From Alice in in Wonderland
One day Alice came to a fork in the road and saw a Cheshire Cat.
“Which road do I take?” she asked.His response was a question: “Where
do you want to go?”“I don’t know, “ Alice answered.“Then,” said the cat, “it doesn’t matter.”
Lewis Carroll

BIG
BOLD

WHAT?
HOW MUCH?
WHERE?

By WHEN?
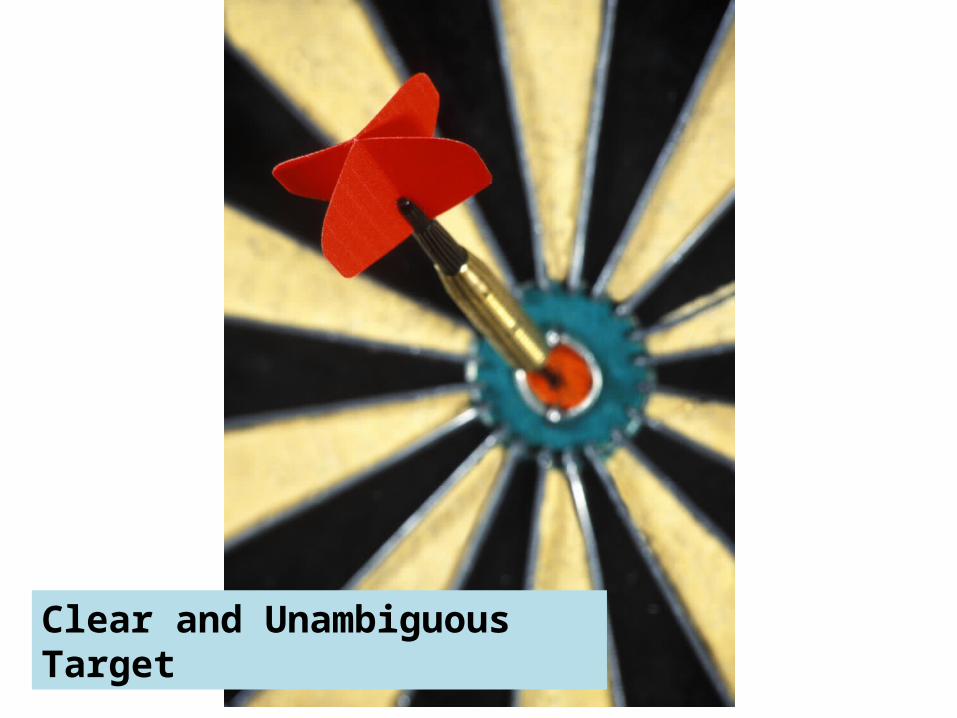
Clear and Unambiguous Target

AIM Statements
• Reduce heart failure mortality rate by 40% by September 1, 2012
• Reduce falls with injury on 4 West to zero by November 30, 2012
• Reduce heart failure mortality rate by 40% by September 1, 2012
• Reduce falls with injury on 4 West to zero by November 30, 2012
What Are You Trying to Accomplish?
• At your tables, for the next 5-10 minutes create an AIM Statement for a project you are working on or planning to start
• At your tables, for the next 5-10 minutes create an AIM Statement for a project you are working on or planning to start
Evaluation and Sharing• Did your AIM statement:
– Have a clear numerical goal?– Have a bold but realistic goal?– Clearly articulate what you want
to achieve and by when?
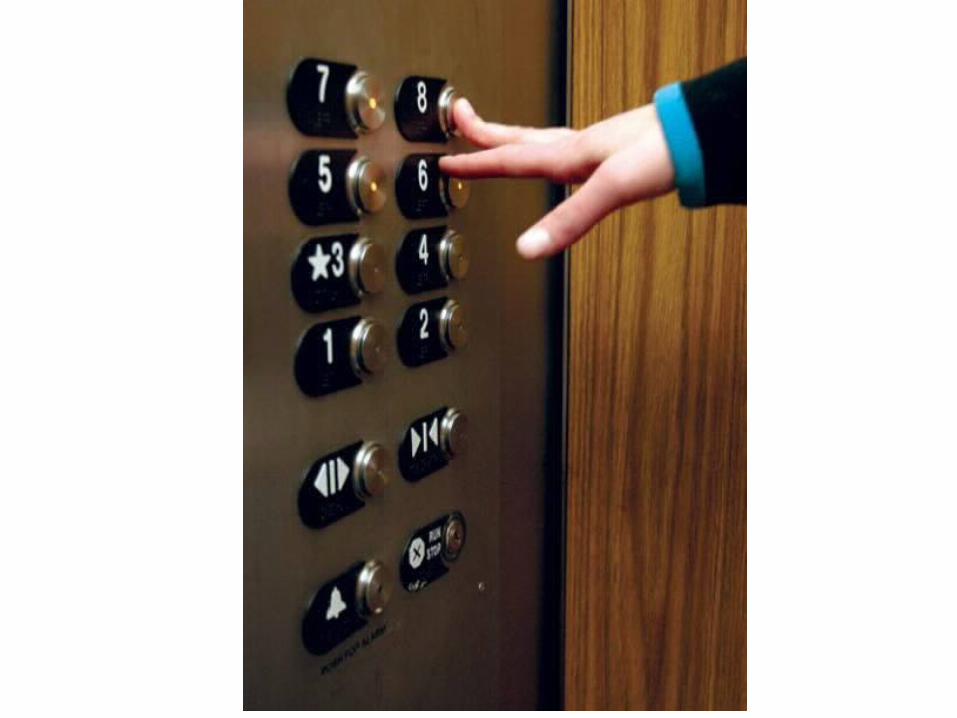
• Can your AIM statement be given in any elevator?
• Would you change your AIM statement?
• If so, what would you change and why?
How do you know if a change
is an improvement?
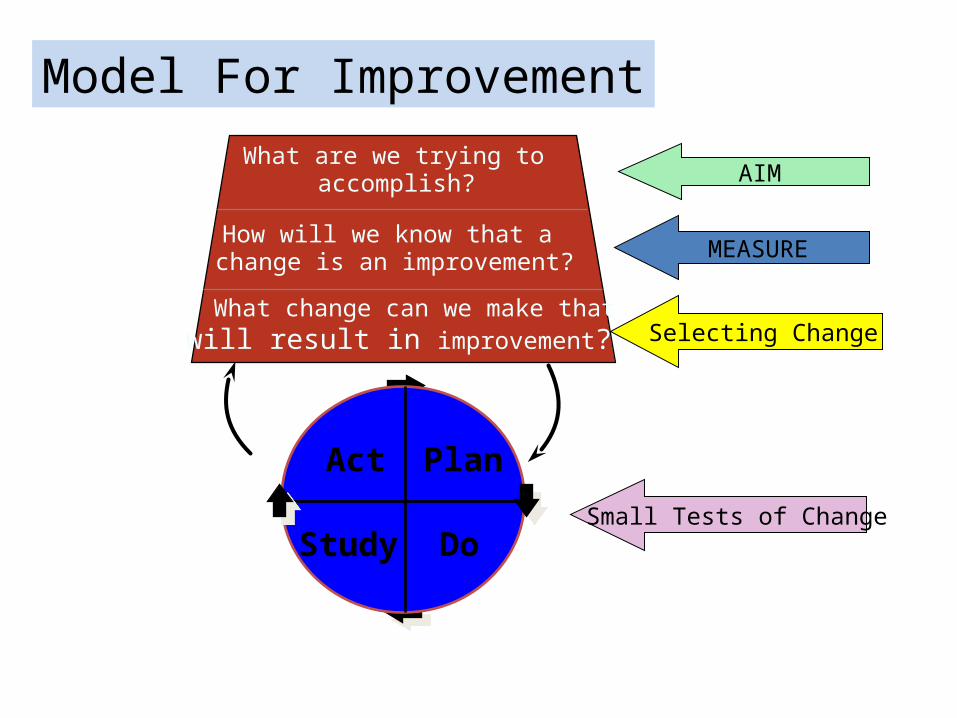
What are we trying toaccomplish?
How will we know that achange is an improvement?
What change can we make thatwill result in improvement?
Model For Improvement
Act Plan
Study Do
AIM
MEASURE
Selecting Change
Small Tests of Change

Why Measure?
• How else will you know that the change(s) you made resulted in improvement?

LimitationsOne Voice
Useful, not perfect
Sample

Select right measures
Rapid results
Adapt interventions
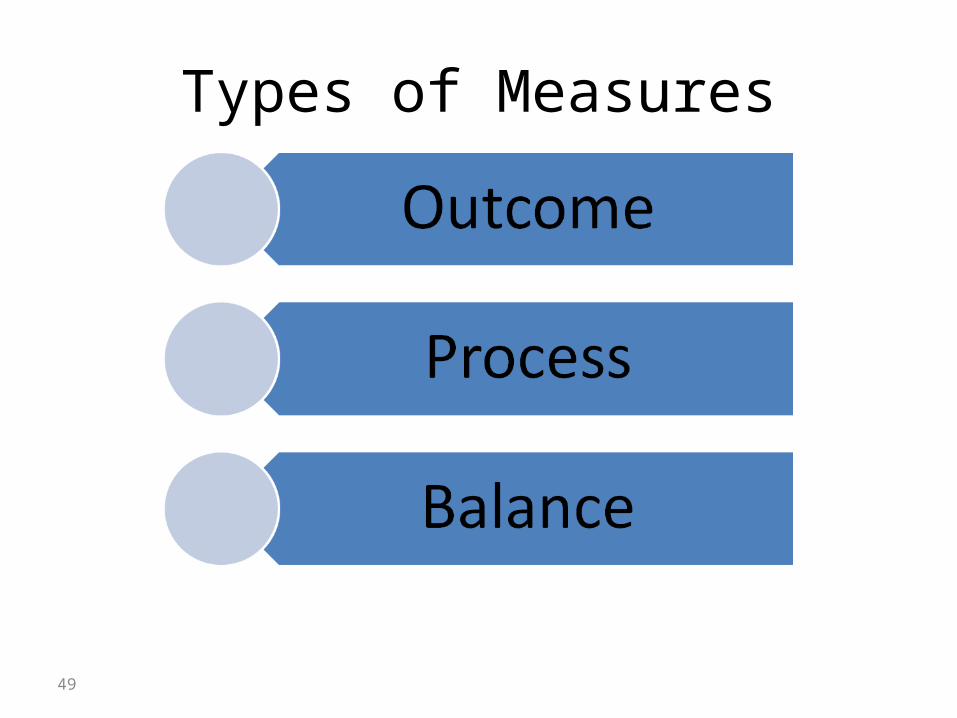
Types of Measures
49
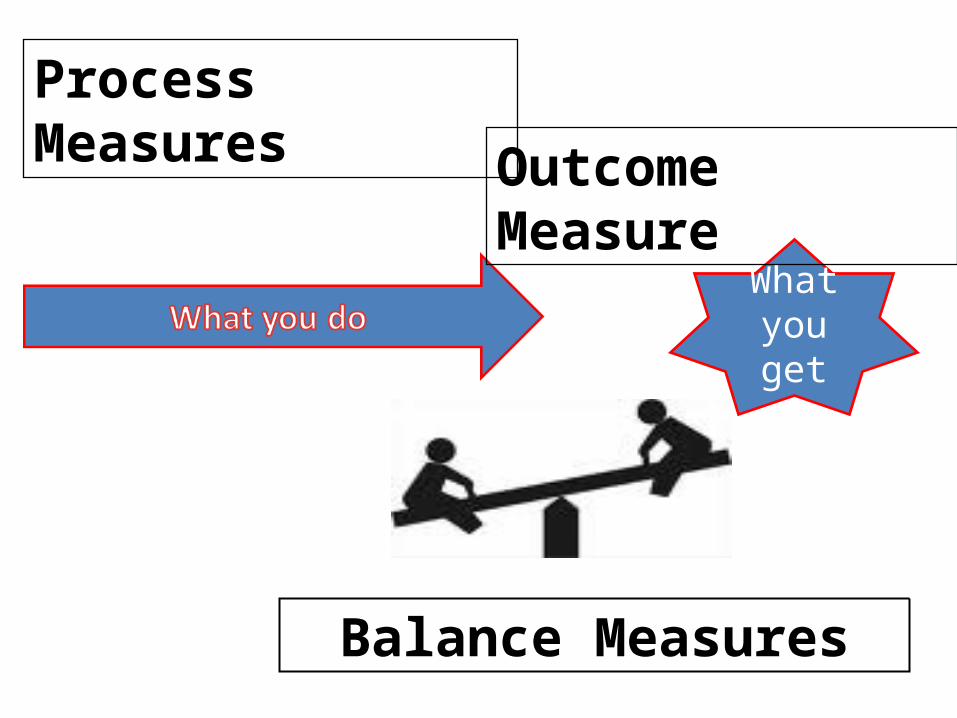
Process Measures
What you get
Outcome Measure
Balance Measures
Outcome
Process
Balance
MEASURES
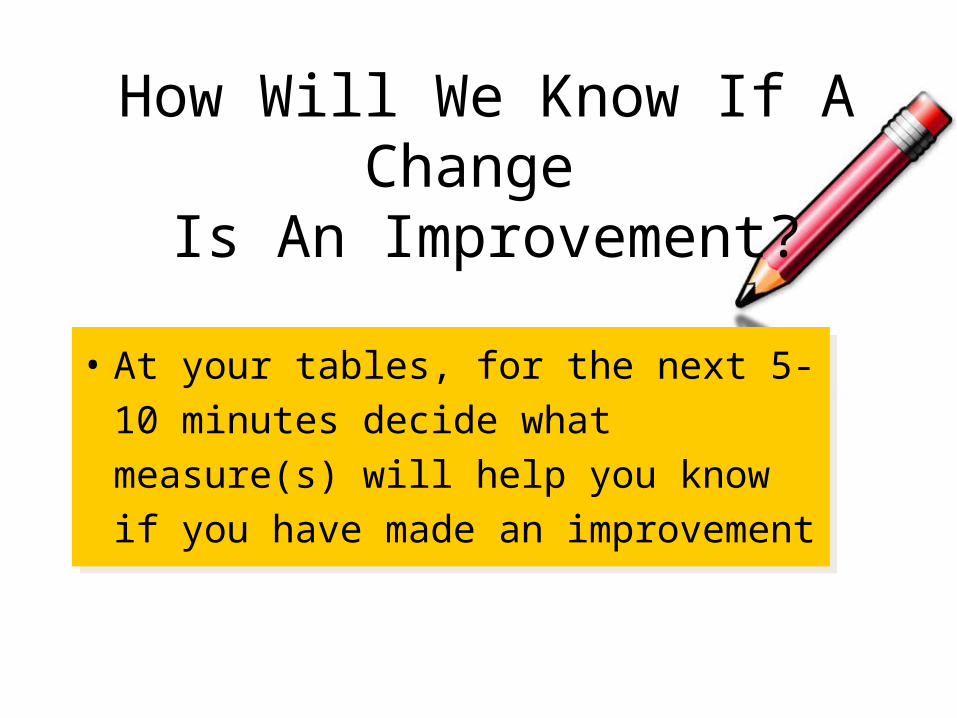
How Will We Know If A Change Is An Improvement?
• At your tables, for the next 5-10 minutes decide what measure(s) will help you know if you have made an improvement
• At your tables, for the next 5-10 minutes decide what measure(s) will help you know if you have made an improvement

Evaluation and Sharing• Does the measure(s) you
selected allow you to understand if you have made a change?
• Would you change your measurement plan?
• If so, what would you change and why?

What are we trying toaccomplish?
How will we know that achange is an improvement?
What change can we make thatwill result in improvement?
Model For Improvement
Act Plan
Study Do
AIM
MEASURE
Selecting Change
Small Tests of Change
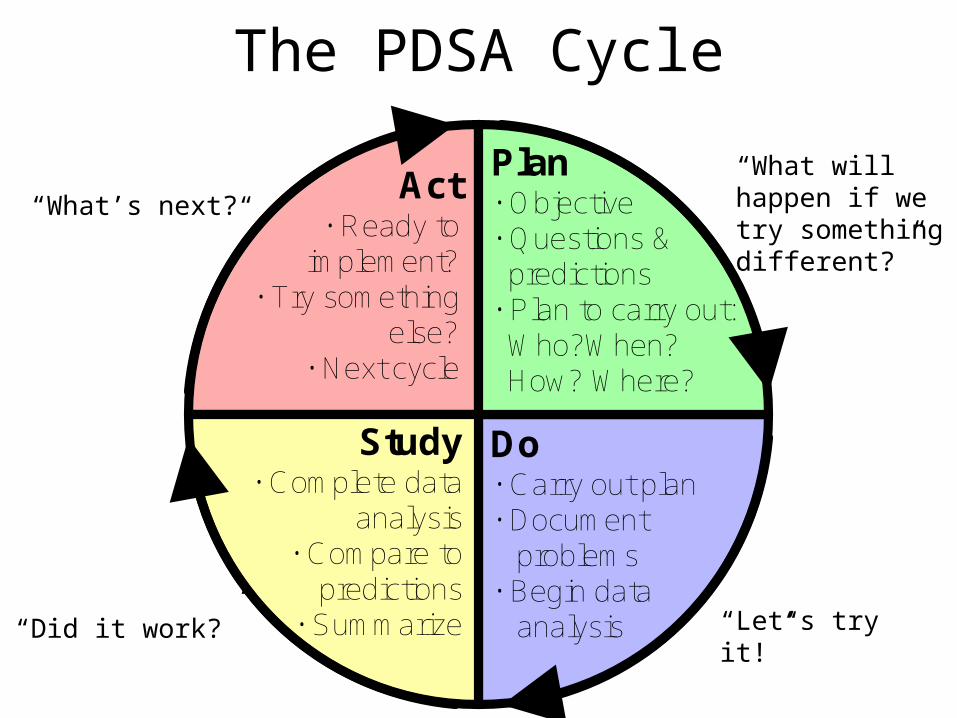
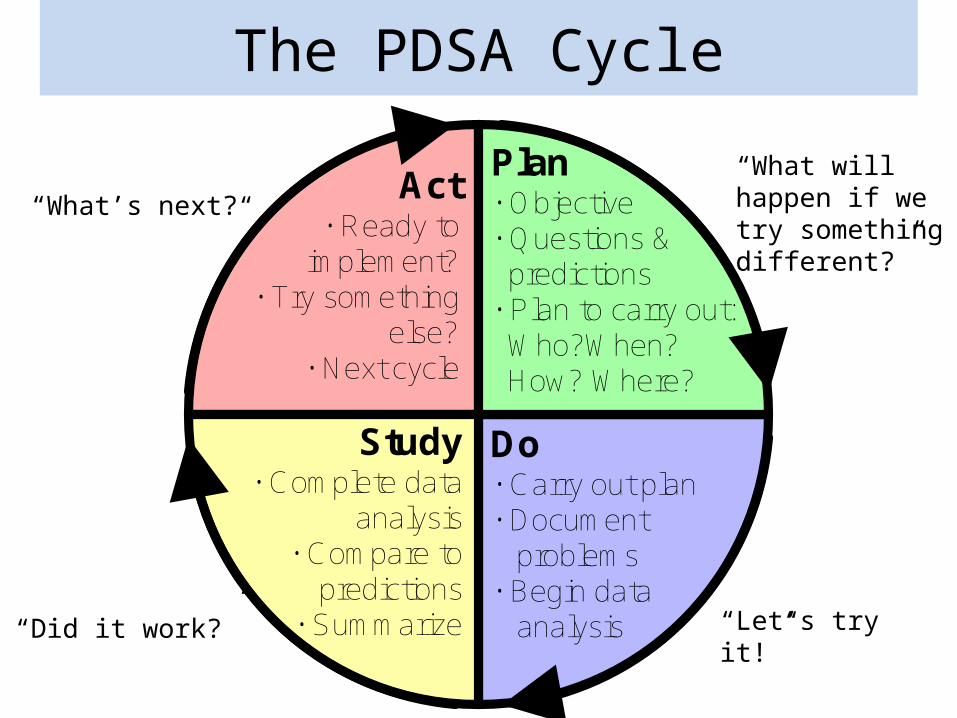
The PDSA Cycle
Plan• Objective• Questions &
predictions• Plan to carry out:
Who?When?How? Where?
Do• Carry out plan• Document
problems• Begin data
analysis
Act• Ready to
implement?• Try something
else?• Next cycle
Study• Complete data
analysis• Compare to
predictions• Summarize
“What will happen if we try something different?”
“Let’s try it!”“Did it work?”
“What’s next? ”

What changes can we make
that will result in an improvement?
Brainstorm
Rank
Construct Plan to Test
Time to Brainstorm…
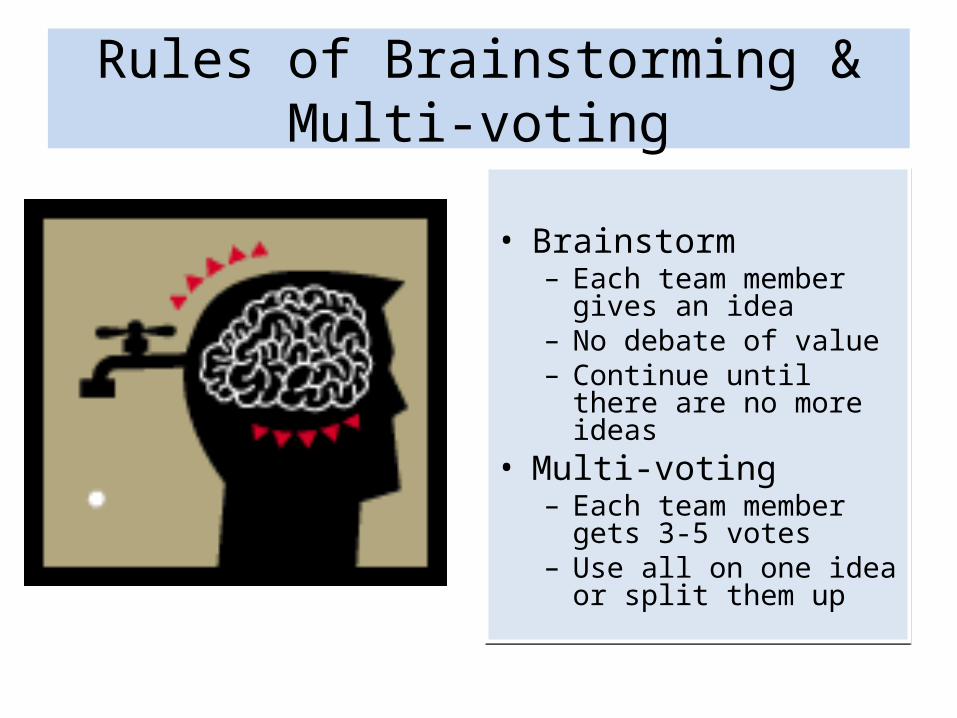
Rules of Brainstorming & Multi-voting
• Brainstorm– Each team member gives
an idea– No debate of value– Continue until there are no
more ideas• Multi-voting
– Each team member gets 3-5 votes
– Use all on one idea or split them up
• Brainstorm– Each team member gives
an idea– No debate of value– Continue until there are no
more ideas• Multi-voting
– Each team member gets 3-5 votes
– Use all on one idea or split them up
Guidelines for Testing Change

Fail Early, Fail Often

What can I do by next Tuesday/Thursday?

Work with the willing
Aim BIG
Test Small
Forget about consensus

Be Innovative
Collect Data
Wide range of conditions
Steal Shamelessly

Why Test?
The PDSA Cycle
Plan• Objective• Questions &
predictions• Plan to carry out:
Who?When?How? Where?
Do• Carry out plan• Document
problems• Begin data
analysis
Act• Ready to
implement?• Try something
else?• Next cycle
Study• Complete data
analysis• Compare to
predictions• Summarize
“What will happen if we try something different?”
“Let’s try it!”“Did it work?”
“What’s next? ”
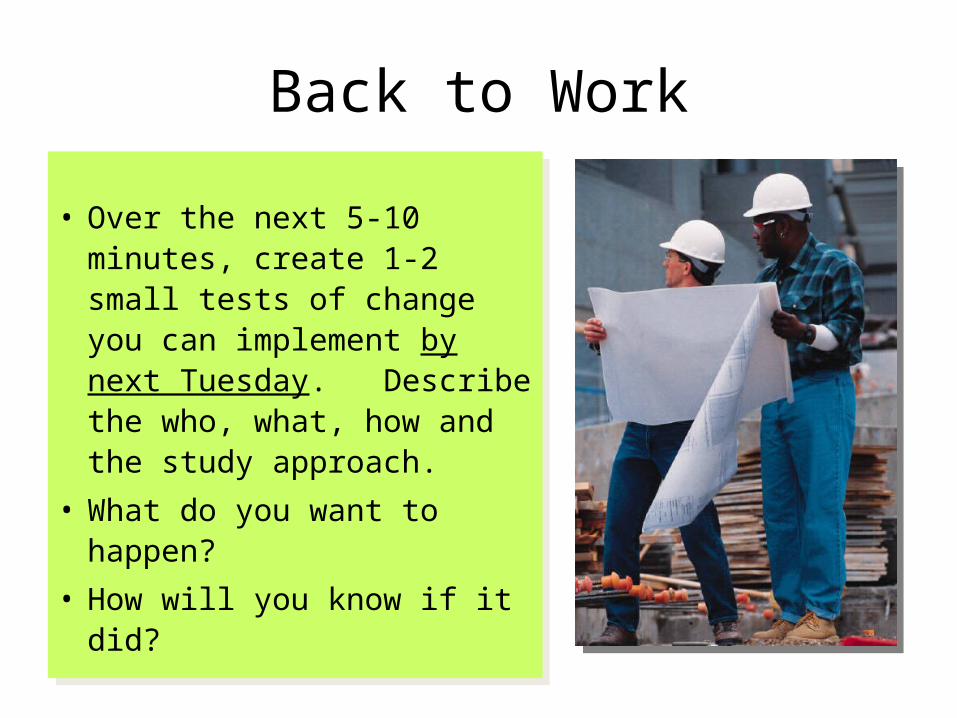
Back to Work
• Over the next 5-10 minutes, create 1-2 small tests of change you can implement by next Tuesday. Describe the who, what, how and the study approach.
• What do you want to happen?
• How will you know if it did?
• Over the next 5-10 minutes, create 1-2 small tests of change you can implement by next Tuesday. Describe the who, what, how and the study approach.
• What do you want to happen?
• How will you know if it did?
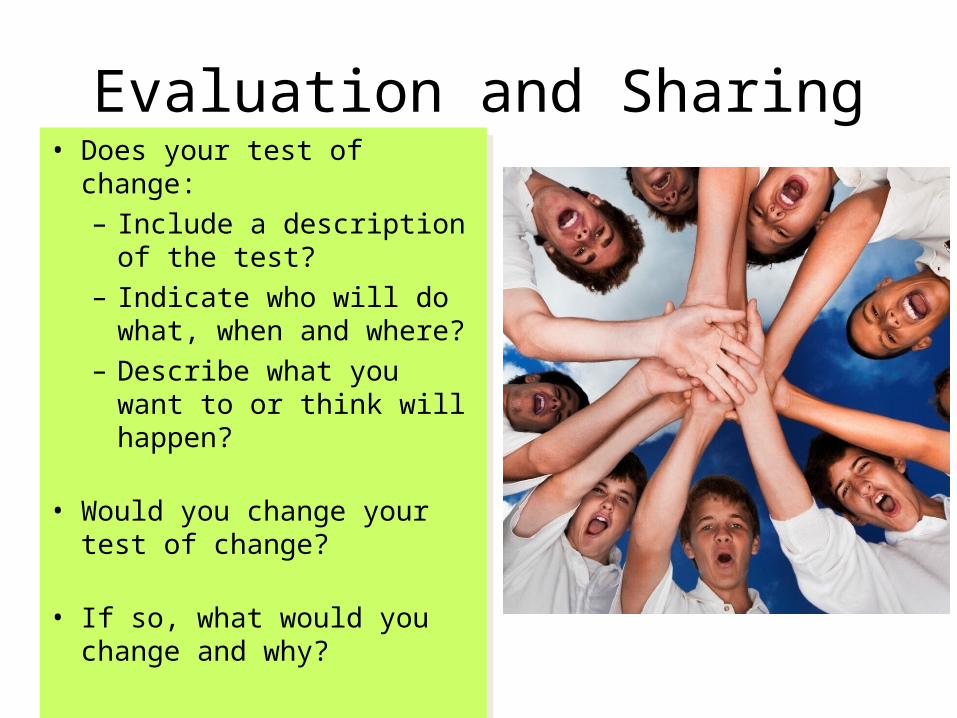
Evaluation and Sharing• Does your test of change:
– Include a description of the test?
– Indicate who will do what, when and where?
– Describe what you want to or think will happen?
• Would you change your test of change?
• If so, what would you change and why?
• Does your test of change:– Include a description of
the test?– Indicate who will do what,
when and where?– Describe what you want to
or think will happen?
• Would you change your test of change?
• If so, what would you change and why?

The Value of “Failed” Tests
“I did not fail one thousand
times; I found one thousand ways how
not tomake a light bulb.”
Thomas Edison
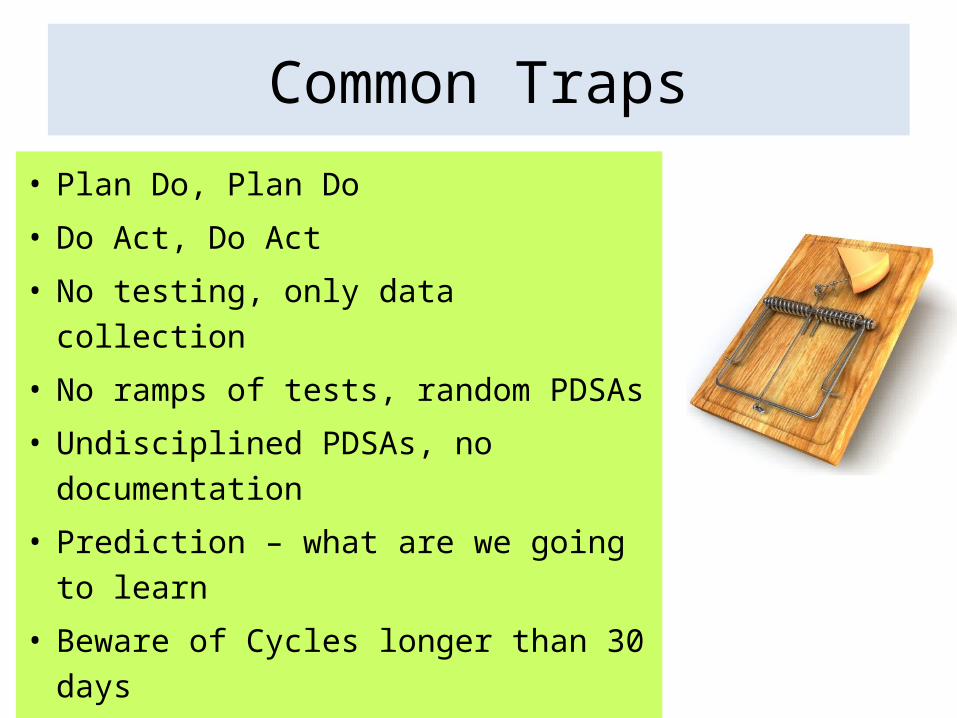
Common Traps
• Plan Do, Plan Do
• Do Act, Do Act
• No testing, only data collection
• No ramps of tests, random PDSAs
• Undisciplined PDSAs, no documentation
• Prediction – what are we going to learn
• Beware of Cycles longer than 30 days
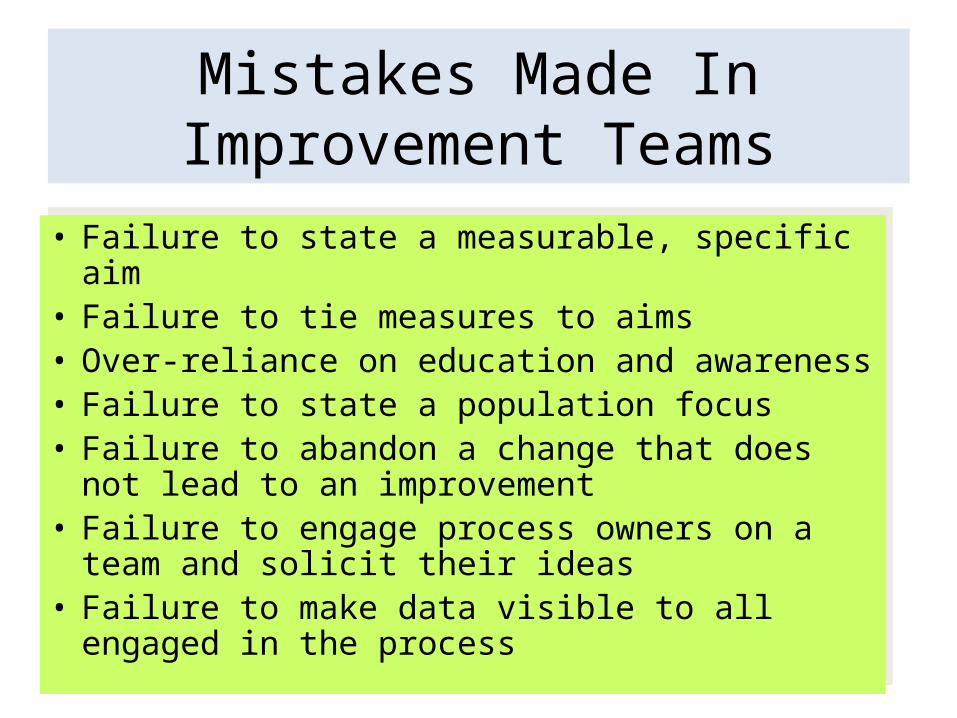
Mistakes Made In Improvement Teams
• Failure to state a measurable, specific aim• Failure to tie measures to aims• Over-reliance on education and awareness• Failure to state a population focus• Failure to abandon a change that does not lead to
an improvement• Failure to engage process owners on a team and
solicit their ideas• Failure to make data visible to all engaged in the
process
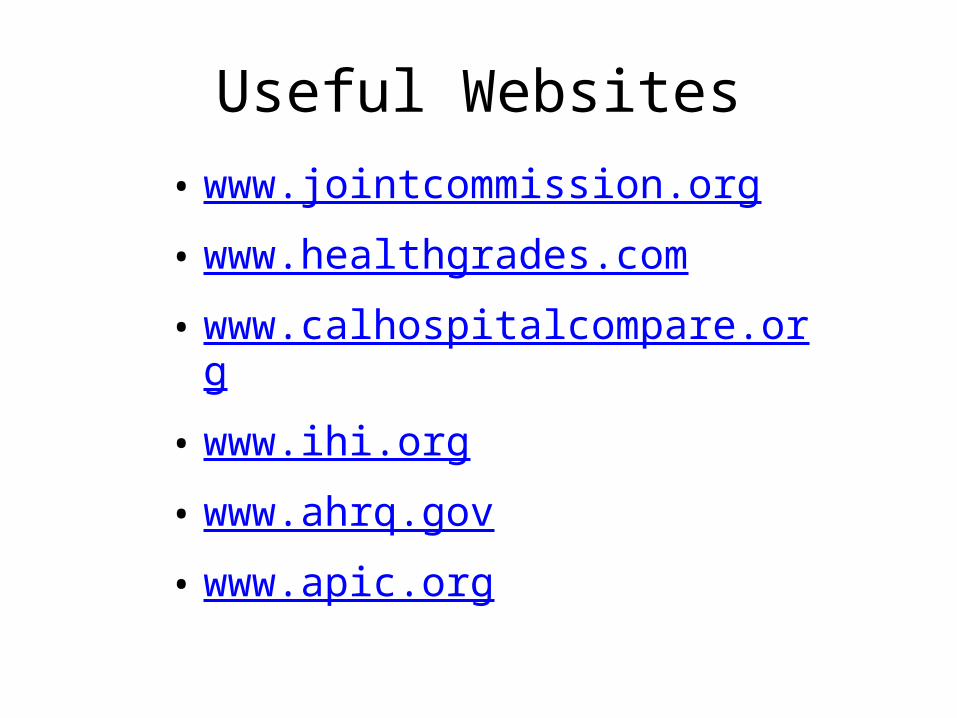
Useful Websites• www.jointcommission.org• www.healthgrades.com• www.calhospitalcompare.org• www.ihi.org• www.ahrq.gov• www.apic.org