quality improvement and public health in kansas - phf in public health in kansas.pdf · quality...
TRANSCRIPT
Quality Improvement and Public Health in Kansas
Storyboards
Quality Improvement and Public Health in Kansas
Storyboards
Tatiana Lin, M.A.Kansas Health Institute
February 13, 2008
Source: Michigan’s Approach to QI Story Boards(NNPHI Teleconference, September 19, 2008)

PART I WHAT IS A STORYBOARD

A VISUAL method for displaying a
quality improvement story!
A Quality Storyboard Is:
Storyboard History & UseStoryboard History & Use Surfaced at Walt Disney Studios during the
1920’s to “articulate a story in an embraceable way!”
Illustrated cartoons for short subjects then moved to larger scale efforts (Gone with the Wind in 1939!)
Having proved themselves in other fields & industries, storyboards are now being applied to system development, web development, instructional design, and quality improvement
Why QI Storyboards?Why QI Storyboards? Tell your QI story in an organized way
Depict your team’s progress Guide the work of the team Help to document and share… Steps that were taken to implement quality
improvement projects Lessons learned Potential impact
Give users real content that is easy to understand
Highlight your accomplishments!
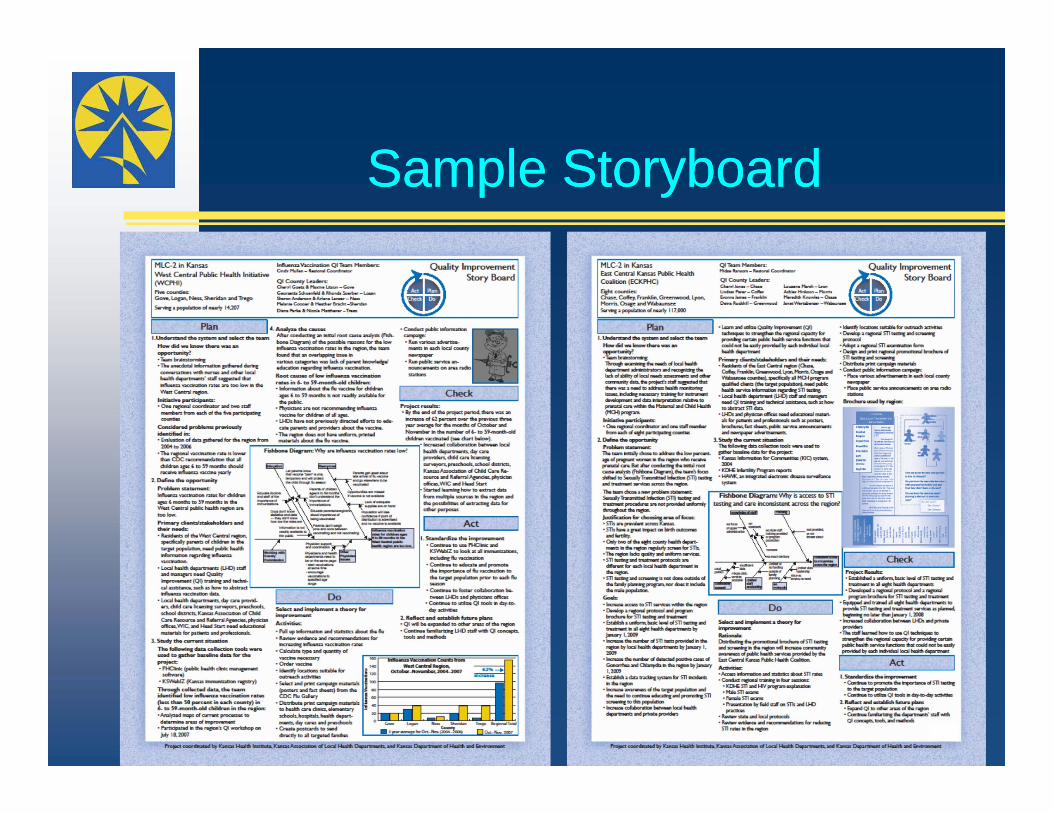
Sample StoryboardSample Storyboard

PART II ORGANIZATION & COMPOSITION
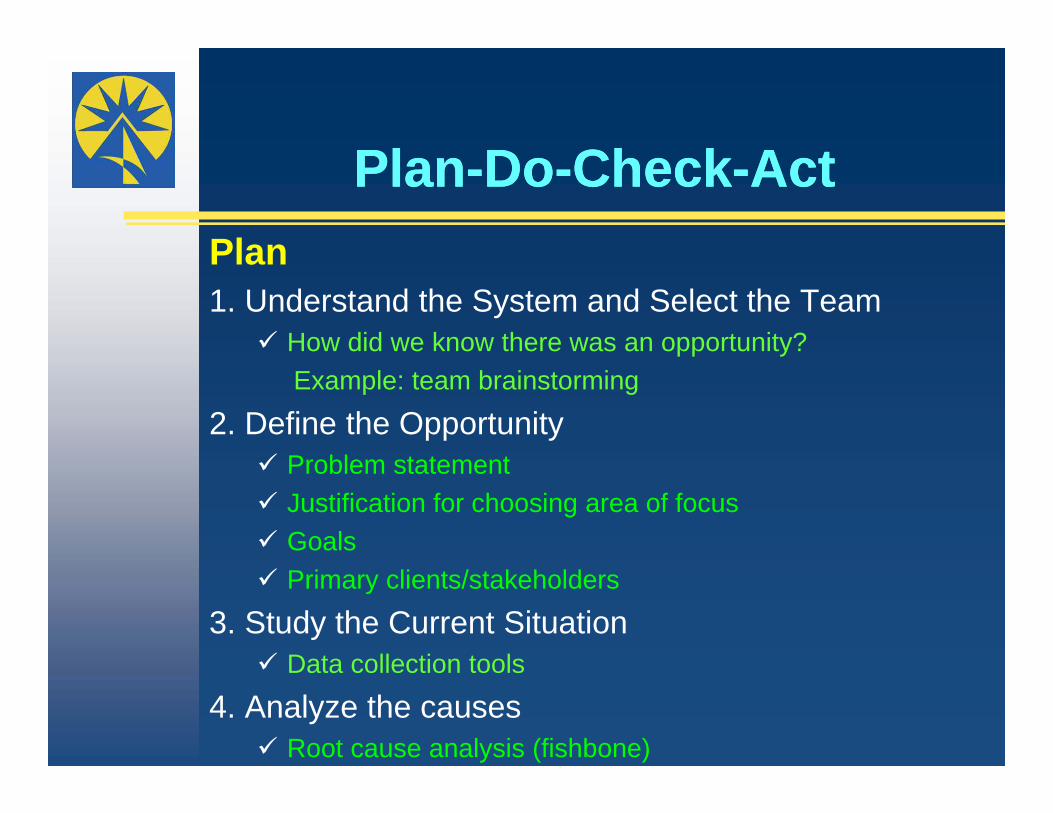
Plan-Do-Check-ActPlan-Do-Check-ActPlan1. Understand the System and Select the Team
How did we know there was an opportunity?Example: team brainstorming
2. Define the Opportunity Problem statement Justification for choosing area of focus Goals Primary clients/stakeholders
3. Study the Current Situation Data collection tools
4. Analyze the causes Root cause analysis (fishbone)
Plan-Do-Check-Act Cont’d….
Plan-Do-Check-Act Cont’d….
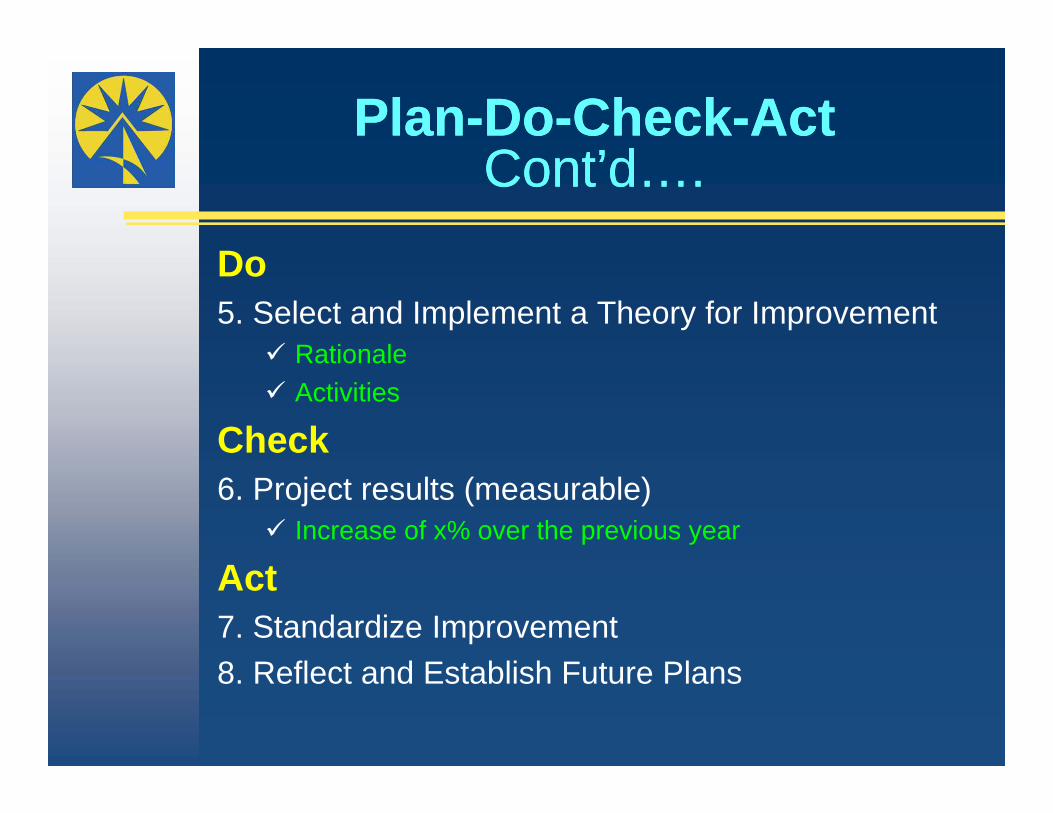
Do5. Select and Implement a Theory for Improvement
Rationale Activities
Check6. Project results (measurable)
Increase of x% over the previous year
Act7. Standardize Improvement8. Reflect and Establish Future Plans
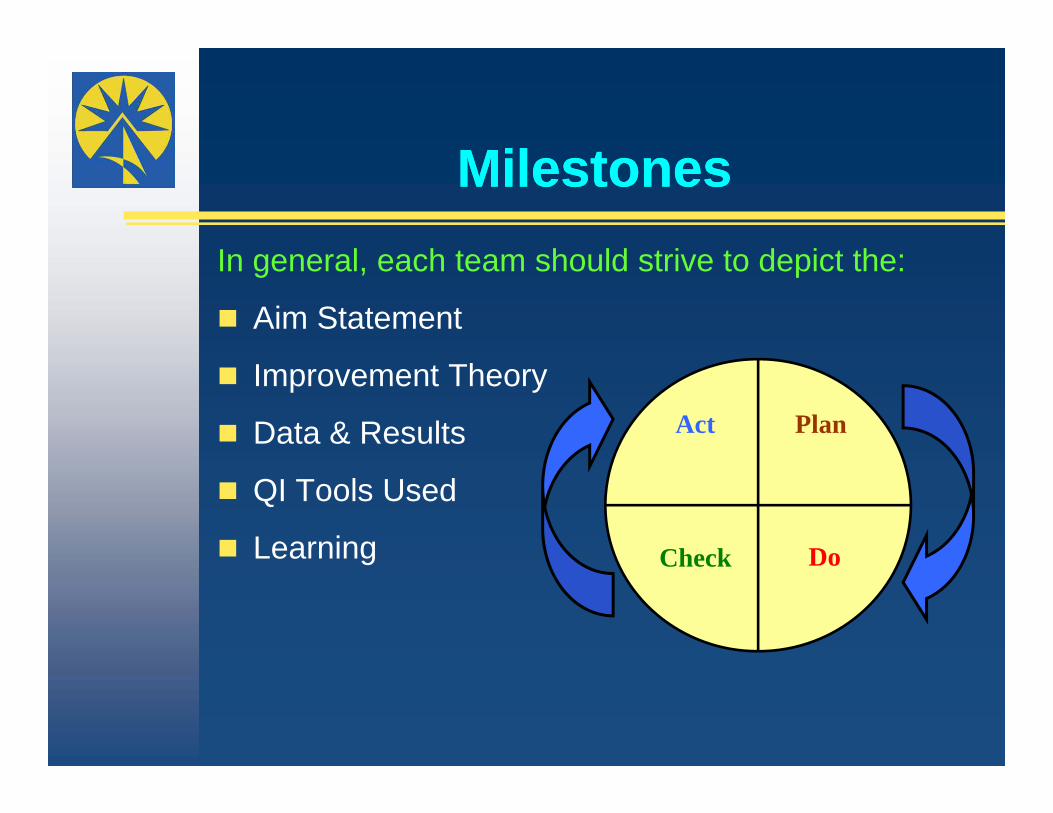
MilestonesMilestonesIn general, each team should strive to depict the:
Aim Statement
Improvement Theory
Data & Results
QI Tools Used
Learning
Plan
DoCheck
Act
PART III Telling the Story
WCPHI Influenza Vaccination Project
WCPHI Influenza Vaccination Project
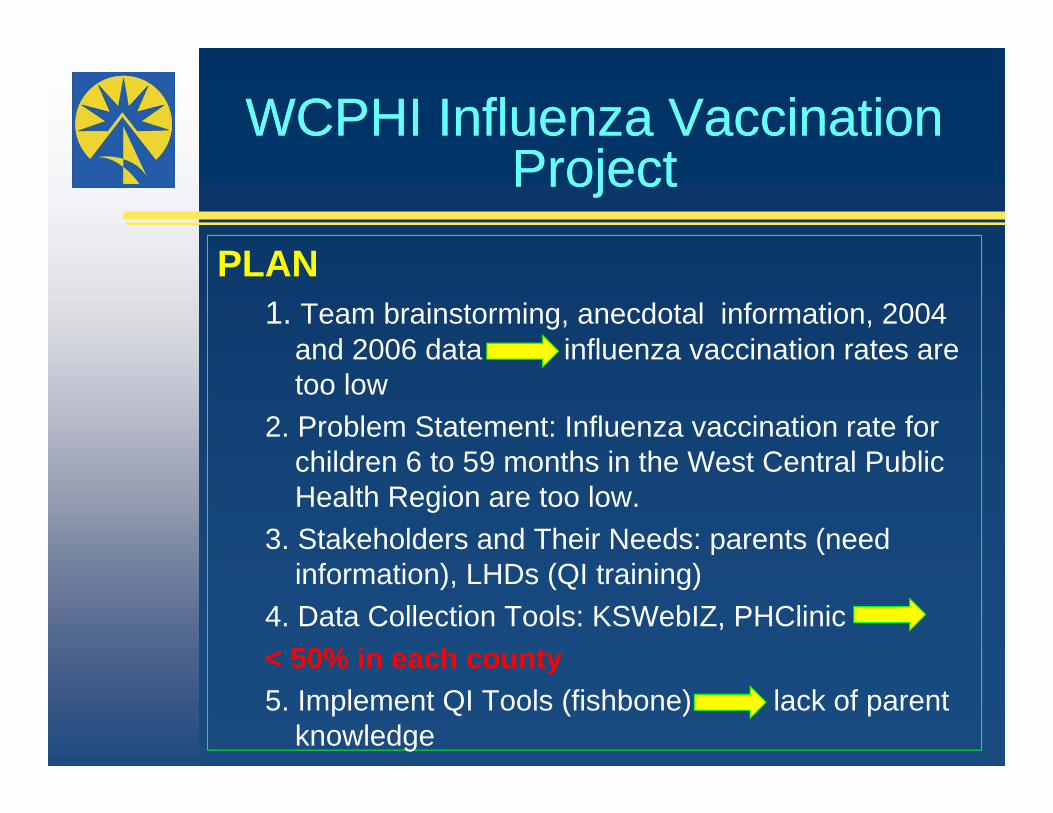
PLAN1. Team brainstorming, anecdotal information, 2004
and 2006 data influenza vaccination rates are too low
2. Problem Statement: Influenza vaccination rate for children 6 to 59 months in the West Central Public Health Region are too low.
3. Stakeholders and Their Needs: parents (need information), LHDs (QI training)
4. Data Collection Tools: KSWebIZ, PHClinic< 50% in each county5. Implement QI Tools (fishbone) lack of parent
knowledge
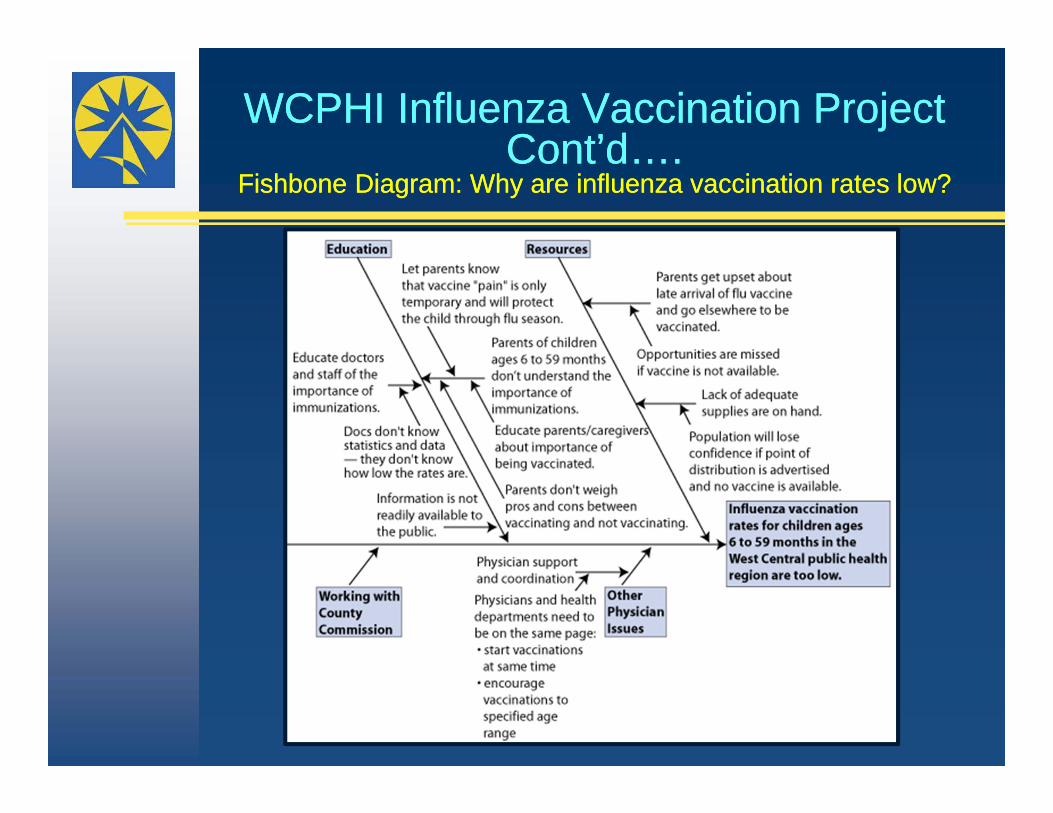
WCPHI Influenza Vaccination ProjectCont’d….
Fishbone Diagram: Why are influenza vaccination rates low?
WCPHI Influenza Vaccination ProjectCont’d….
Fishbone Diagram: Why are influenza vaccination rates low?

WCPHI Influenza Vaccination ProjectCont’d…
WCPHI Influenza Vaccination ProjectCont’d…
Do6. Activities:
Pull up information and statistics about the flu Review evidence and recommendations Calculate type and quality of vaccine necessary Oder vaccine Identify locations for outreach activities Select, print and distribute campaign materials Create and send postcards to target families
Check7. Results: activities 62% increase over the
previous 3 year average
WCPHI Influenza Vaccination ProjectCont’d…
WCPHI Influenza Vaccination ProjectCont’d…
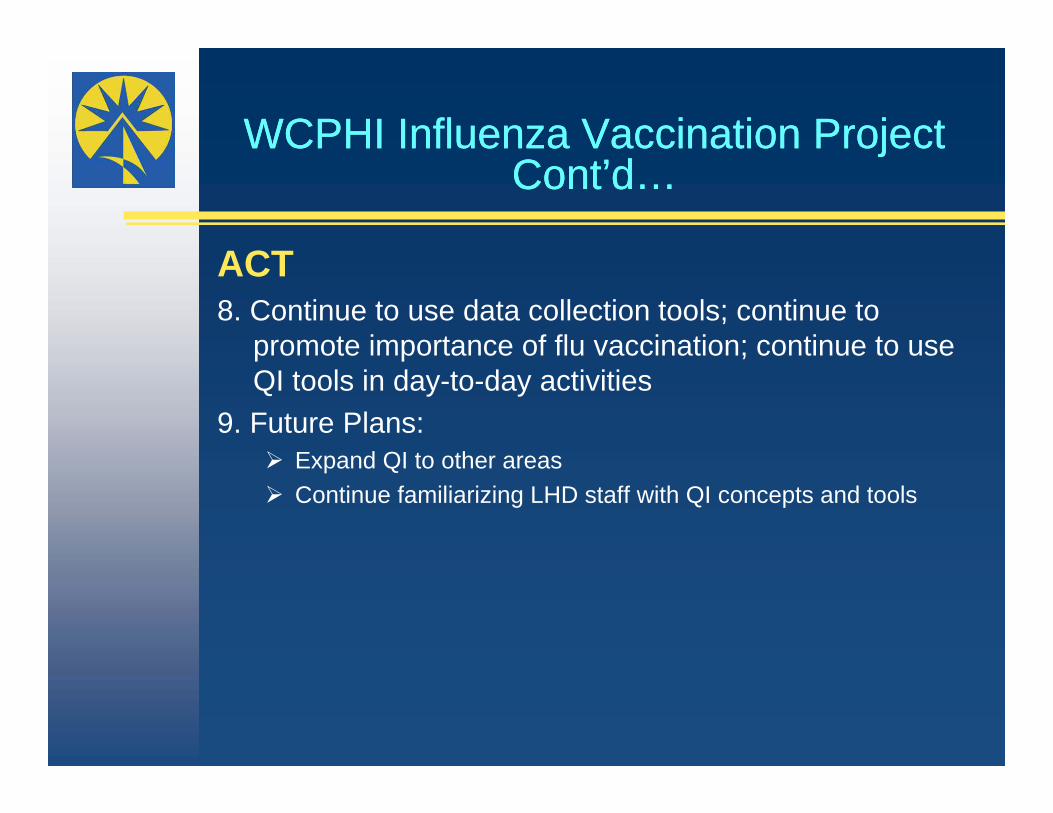
ACT8. Continue to use data collection tools; continue to
promote importance of flu vaccination; continue to use QI tools in day-to-day activities
9. Future Plans: Expand QI to other areas Continue familiarizing LHD staff with QI concepts and tools

PART IV RECOMMENDATIONS
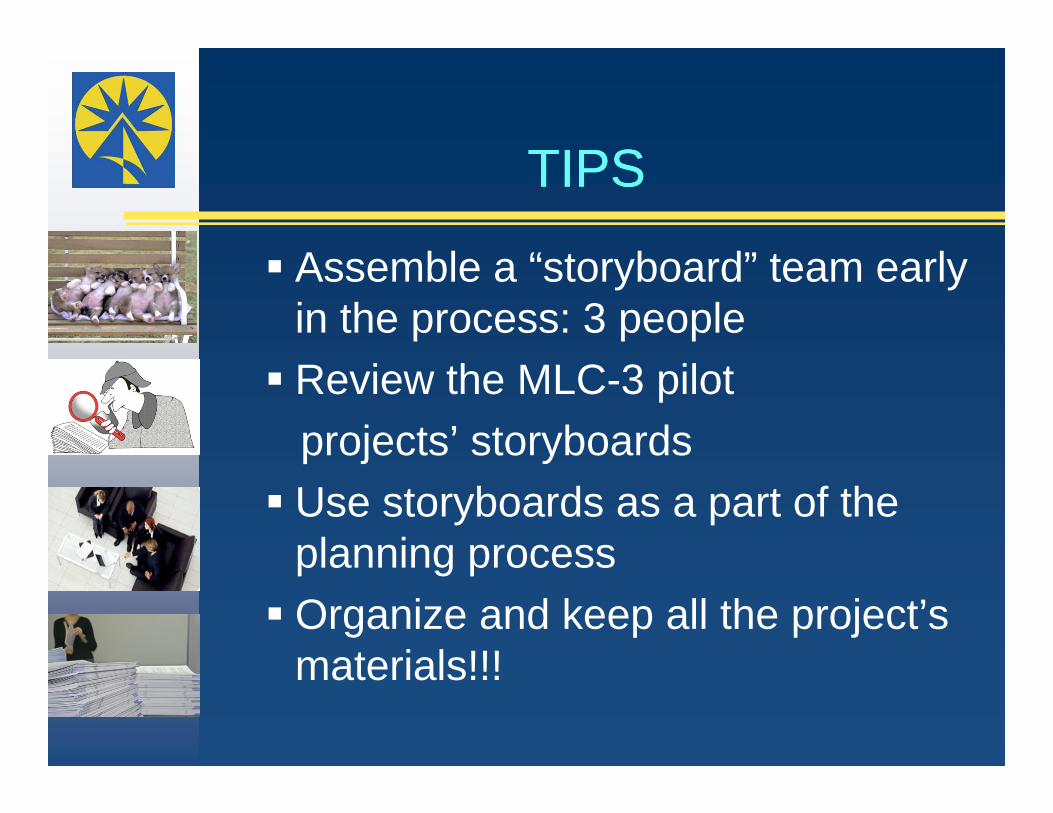
Assemble a “storyboard” team early in the process: 3 people Review the MLC-3 pilot
projects’ storyboards Use storyboards as a part of the
planning process Organize and keep all the project’s
materials!!!
TIPSTIPS

TIPS Cont’d……TIPS Cont’d…… Be as succinct as possible. Include only critical
information Design for ease of comprehension and readability Use visual images such as charts & graphs Avoid jargon when possible Make the steps that you took to conduct the
project readily apparent Display the data used throughout the process Outline conclusions based upon data Present plans for sustaining the improvement or
further investigation
PART V MLC-2 Storyboard experience

Storyboard packageStoryboard package
3 storyboards 1 “short” + 1 “long version” 3 information sheets: Quality Improvement and Public Health “Functional regionalization” and Public
Health Kansas Pilot Projects
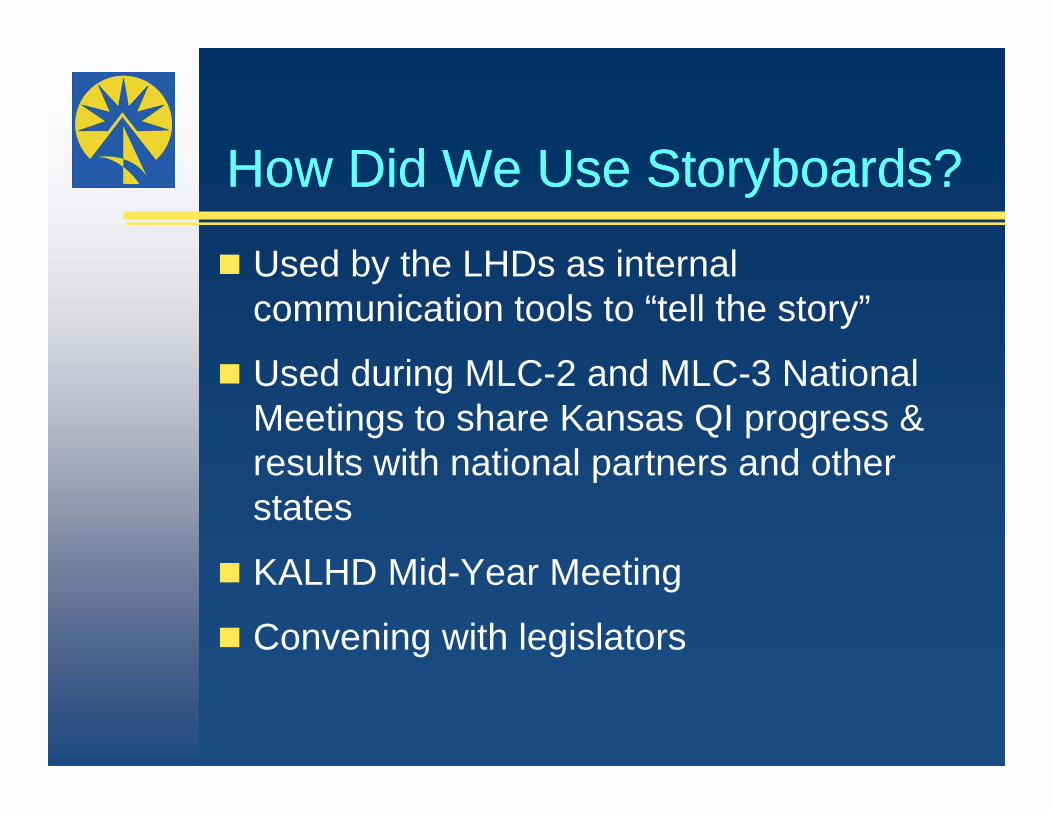
How Did We Use Storyboards?How Did We Use Storyboards?
Used by the LHDs as internal communication tools to “tell the story”
Used during MLC-2 and MLC-3 National Meetings to share Kansas QI progress & results with national partners and other states
KALHD Mid-Year Meeting
Convening with legislators

Regional “storyboard experience” rating…Regional “storyboard experience” rating…
Successes Pitfalls Served as powerful
tools for learning more about the region’s own MLC-2 projects
Helped communicate QI processes to LHD staff and other stakeholders
Adopted storyboards for their future planning purposes
Storyboards developed at the end of the project
Regions involved at the review stage of the process
Could have served as helpful planning tools for the regions
Spent more time than anticipated
Lack of a uniform project documentation