quality metrics a regulatory...
TRANSCRIPT
Quality Metrics –
A Regulatory Perspective
CDR Tara Gooen Bizjak Senior Science Policy Advisor
Div. of Regulations, Guidance, and Standards
Office of Policy for Pharmaceutical Quality
FDA/CDER
Personal Care Products Council – Quality Assurance Fall Workshop
October 21, 2015

Why Quality Metrics?
Industry
• Enables continual improvement of process
performance and product quality
• Supports continual improvement of the
pharmaceutical quality system
• Important element of oversight and controls over
the manufacture of drugs to ensure quality
(section 501 FD&C Act)
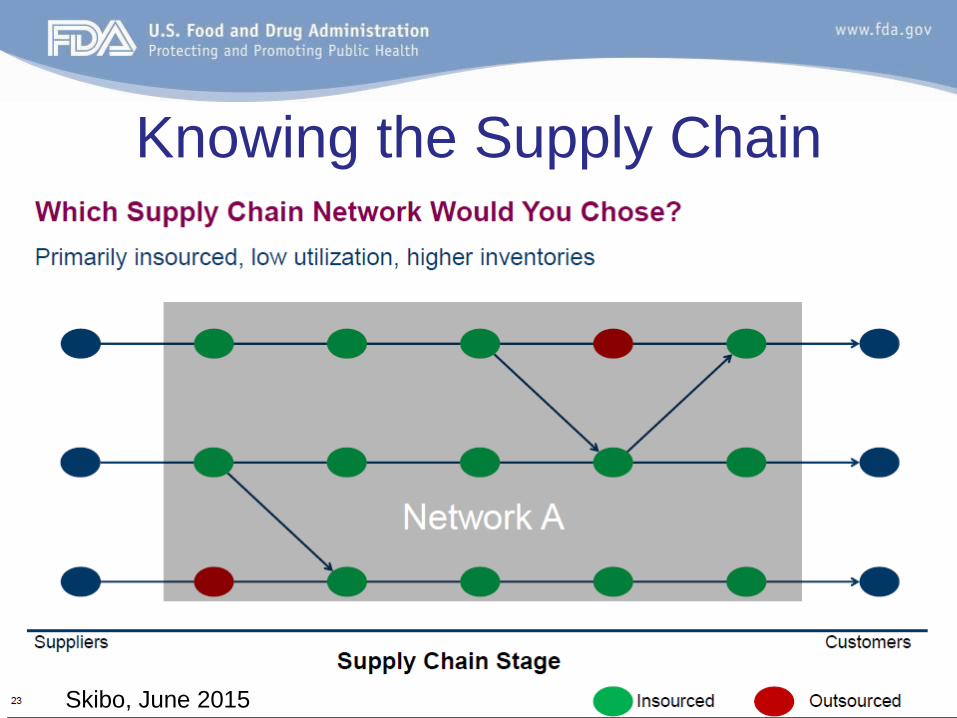
Knowing the Supply Chain
Skibo, June 2015

Knowing the Supply Chain
Skibo, June 2015
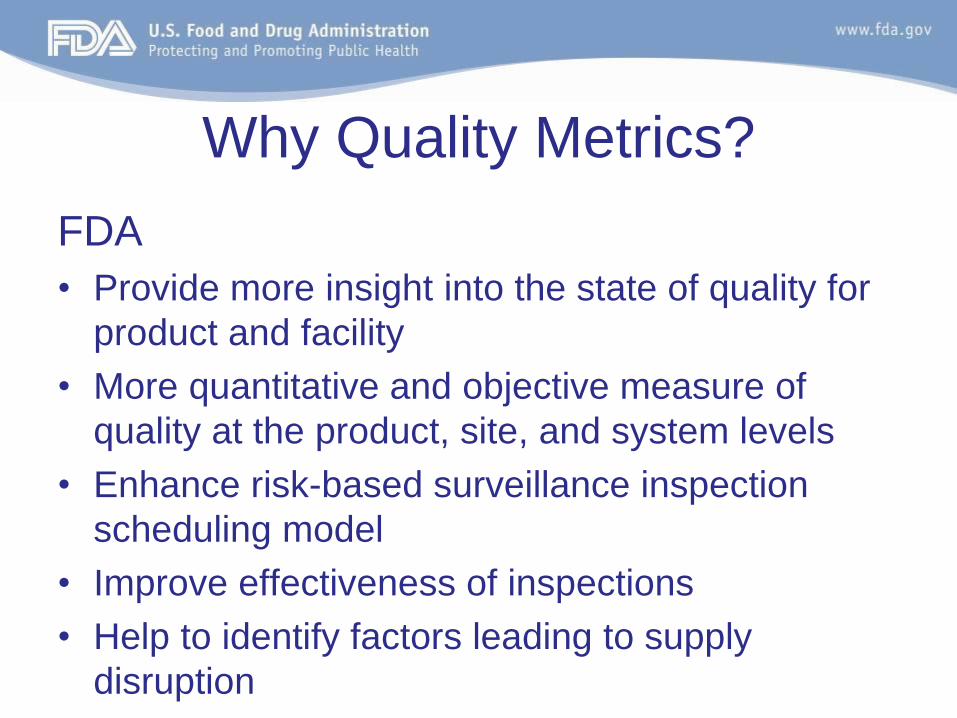
Why Quality Metrics?
FDA
• Provide more insight into the state of quality for
product and facility
• More quantitative and objective measure of
quality at the product, site, and system levels
• Enhance risk-based surveillance inspection
scheduling model
• Improve effectiveness of inspections
• Help to identify factors leading to supply
disruption
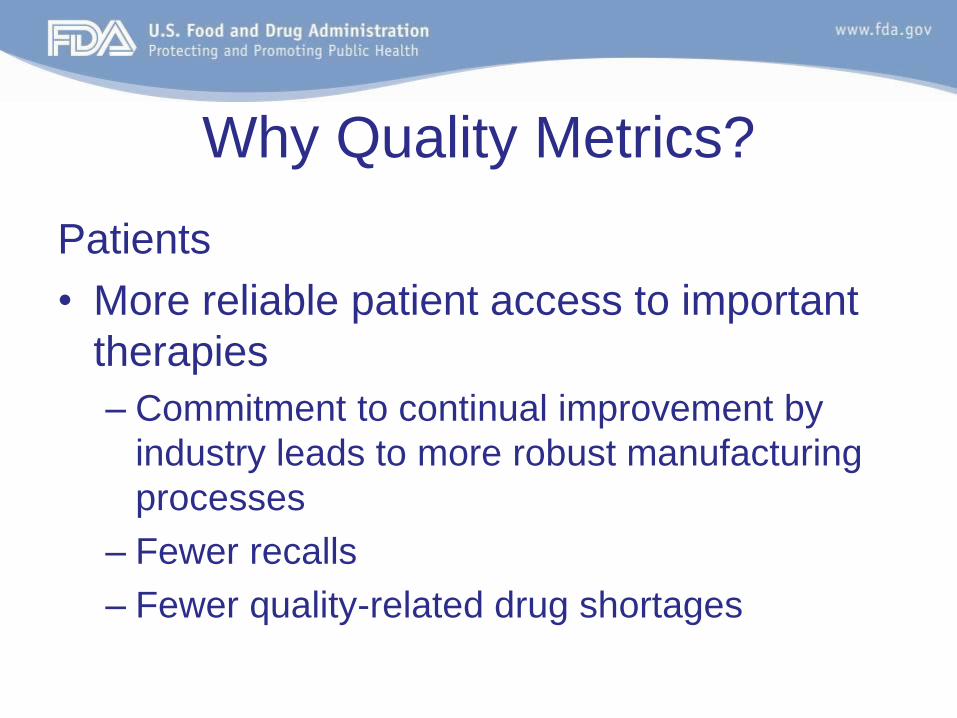
Why Quality Metrics?
Patients
• More reliable patient access to important
therapies
– Commitment to continual improvement by
industry leads to more robust manufacturing
processes
– Fewer recalls
– Fewer quality-related drug shortages

Discussion on Robust Quality Metrics
Programs

Foundation for Quality Metrics
• Industry quality measurement programs
are not new
– At least annual product quality reviews
– Internal audits
– Management reviews
– Supplier qualification and ongoing monitoring
8
Maturity of QM programs
• Leading vs. lagging indicators
• Develop useful product- and site-specific
metrics
• Senior management engagement
• Commitment to quality culture
• Evolution of quality metrics programs over time
9

Identified Challenges
• Existing metrics are defined differently at
different sites
– Even between sites operated by the same
manufacturer
• Complicated supply chains
• Context matters
– A single number does not reflect the state of
quality
10


Who would report?
• Owners or operators of establishments that are engaged
in the manufacture, preparation, propagation,
compounding, or processing of a drug, specifically:
– Finished dosage form (FDF) of a covered drug product, or
– API used in the manufacture of a covered drug product.
• “Covered drug product”
– subject to an approved application under section 505 of the
FD&C Act or under section 351 of the PHS Act.
– marketed pursuant to an OTC monograph.
– a marketed unapproved drug product.
– active pharmaceutical ingredients (API) used in the manufacture
of a covered FDF.

Who would report? • “Reporting Establishment”
– Provides one report for each API or for each FDF
– One establishment should already possess or have access to all
of the data needed to submit such reports
– Generally expect that the Quality Control Unit (Quality Unit) will
be best positioned to provide these data
Establishment 1
(mixing, granulation)
Establishment 2
(tablet compression)
Establishment 3
(packaging)
data data data
Reporting Establishment submits one report to FDA
Exa
mp
le
For Product A

What would be reported?
• Reporting establishments would report data; these data
should already be available per CGMPs
– Number of lots attempted
– Number of specification-related rejected lots
– Number of attempt lots pending disposition >30 days
– Number of OOS results
– Number of lot release and stability tests
– Number of OOS results invalidated due to lab error
– Number of product quality complaints for the product
– Number of lots attempted which are released for distribution or for
the next stage of manufacturing
– Whether the associated APRs or PQRs were completed within 30
days of annual due date for the product
– The number of APRs or PQRs required for the product

Data vs. Metrics
• FDA would use the data to calculate metrics:
– Lot Acceptance rate
– Product Quality Complaint rate
– Invalidated Out-of-Specification (OOS) rate
– Annual Product Review (APR) or Product Quality
Review (PQR) On Time rate
• Public comment requested on several optional
metrics
– Senior management engagement
– CAPA effectiveness
– Process capability/performance

How does FDA intend to use
quality metrics?
• Develop objective measures for:
– Quality of a drug product
– Quality of a site
– Effectiveness of systems associated with the manufacture of
pharmaceutical products
• Analysis of quality metrics – context matters
– Appropriate comparators may vary
• Compare same metric, same product, same establishment over time?
• Compare same metric, different products, same establishment?
• Compare same metric, establishments performing same unit operation?
• Compare same metric, products in the same class (e.g., large molecule
injectables)?
• Other? 17
How does FDA intend to use
quality metrics?
• Goals for use of quality metrics
– Identify risk-based factors that could impact inspection
frequency
– Improve detection of manufacturing conditions that may
lead to a shortage
• Use in conjunction with other sources of information
about product and site quality
– Inspection results
– Recalls
– Field Alert Reports/Biological Product Deviation Reports
Looking Toward the Future
Increasing Operational Flexibility
• Continue to encourage emerging technology
• Exploring ways to reward firms that exceed
minimum expectations
• Consider whether metrics may provided a basis
to assist in determining the appropriate reporting
category for post-approval manufacturing
changes
Summary
• Quality Metrics play an important role in the desired state
of pharmaceutical quality and regulation
– Induce the right behavior and responsibility for industry
– Enable better FDA surveillance of state of manufacturing and
product quality
– Help to identify situations in which there may be a risk for drug
supply disruption
– Consider whether metrics may provided a basis to assist in
determining the appropriate reporting category for post-approval
manufacturing changes
20

Final Thought
A robust quality metrics program requires
continual improvement
• Ideal metrics are specific to the product, site, and
supply chain
• Ideal metrics are not limited to the metrics in this draft
guidance
Acknowledgements
Ashley Boam, OPPQ
Russ Wesdyk, OS
Brian Hasselbalch, OPPQ
FDA internal Working Group on quality
metrics

More Information/Contacting OPQ
Reach us at: CDER‐OPQ‐[email protected]
For more information on this guidance, please see the
CDER SBIA webinar at
http://www.fda.gov/Drugs/DevelopmentApprovalProces
s/SmallBusinessAssistance/ucm456059.htm
Please provide your comments on the guidance to the
docket:
• www.regulations.gov docket #FDA-2015-D-2537
One Quality Voice