quality of trace element contaminated soils amended with...
TRANSCRIPT

Preprint submitted to Elsevier
Quality of trace element contaminated soils amended with compost under fast
growing tree Paulownia fortunei plantation
P. Madejón*, J. Xiong, F. Cabrera, E. Madejón
Instituto de Recursos Naturales y Agrobiología de Sevilla (IRNAS), CSIC, Avenida
Reina Mercedes 10, P.O. Box 1052, 41080 Sevilla, Spain
*Corresponding author: Paula Madejón
e-mail: [email protected]
Tel: +34 95 4624711; Fax: 0034 954624002

Abstract
The use of fast growing trees could be an alternative in trace element contaminated soils
to stabilize these elements in soils and improve soil quality. In this study we investigate
the effect of Paulownia fortunei growth on trace element contaminated soils amended
with two organic composts under semi-field conditions for a period of 18 months. The
experiment was carried out in containers filled with tree different soils, two
contaminated soils (neutral AZ and acid V) and a non contaminated soil, NC. Three
treatments per soil were established: two organic amendments (alperujo compost, AC,
and biosolid compost, BC) and a control without amendment addition. We study
parameters related with fertility and contamination in soils and plants. Paulownia
growth and amendments increased pH in acid soils whereas no effect of these factors
was observed in neutral soils. The plant and the amendments also increased organic
matter and consequently, soil fertility. Positive results were also found in soils that were
only affected by plant growth (without amendment). A general improvement of “soil
biochemical quality” was detected over time and treatments, confirming the positive
effect of amendments plus paulownia. Even in contaminated soils except for Cu, trace
element concentrations in leaves were in the normal range for plants. Results of this
mid-term study showed that Paulownia fortunei is a promising species for
phytoremediation of trace element polluted soils.
Keywords: soil fertility, trace elements, enzymatic activities, nutrients
1. Introduction
The use of fast growing trees is an encouraging tool for reducing atmospheric
CO2 and production of agroforestry plantations for biomass production (Calfapietra et

al., 2010). However negative effects on soil fertility have been attributed to this type of
plants (Alfaia et al., 2004), because their high nutrient demands are removed as
harvested products (Szott et al., 1991). The use of compost in this kind of plantations
could be an alternative to industrial fertilizers and could provide an interesting recycling
solution for wastes. Composts, in addition to nutrient release (Larchevêque et al., 2006),
may offer additional benefits to mineral fertilizers by reducing planting shock since it
can also improve soil structure and, consequently, create better conditions for root
development (porosity, aeration, and water-holding capacity; Pagliai et al., 1981).
Besides the increase in soil fertility, in heavy metal contaminated soils, the use
of wastes and byproducts as amendments enhances those processes (sorption,
precipitation and complexation reactions) that take place naturally in soils to reduce
mobility and bioavailability of trace elements. For that reason, organic amendments
could be considered as a complement of any phytoremediation strategy (Adriano et al.,
2004). Phytoremediation is a low cost and environmental friendly technique that has
been spread for remediation technologies (Ali et al., 2013). Among different strategies
of phytoremediation, phytostabilization involves the establishment of a plant cover on
the surface of the contaminated sites with the aim of reducing the mobility of
contaminants. The process includes transpiration and root growth that immobilizes
contaminants by reducing leaching, controlling erosion, creating an aerobic
environment in the root zone, and adding organic matter. Phytostabilization can be
enhanced by using soil amendments that immobilize metal(loid)s combined with plant
species that are tolerant of high levels of contaminants and low-fertility soils or tailings
(Bolan et al., 2011)
Trees can be successfully used in phytostabilization because of their ability to
grow on nutrient poor soil, deep root system, fast rate of growth, metal-resistance traits

and economically viable secondary use. Thanks to these features, trees are able to
stabilize, extract, degrade or volatilize soil contaminants (Azzarello et al., 2011). Most
of the studies of phytoremediation using trees focus on the use of varieties of willows or
poplars (Lepp and Madejón, 2007; Ciadamidaro et al., 2013; Vervaeke et al., 2003)
have been chosen because of an array of characteristics (e. g. fast-growing tree,
producing large yields and having a high energy potential, high capacity to stabilise
polluted substrates, recycle nutrients and accumulate pollutants in their tissues).
However, recently some studies have also focused on Paulownia spp (Doumett et al.,
2008; Macci et al., 2012, 2013).
Paulownia spp is an extremely fast-growing deciduous tree species with
vegetative propagation and tolerance to different soil and climate conditions (Wang and
Shogren, 1992). This tree is original of China and its natural distribution ranges from
tropical through to cool temperate climates. Paulownia could be considered as a low
demand water plant, in spite of not growing in arid zones (Lucas-Borja et al., 2011).
This species has an elevated biomass production during its growth phase (Chirko et al.,
1996) and it has been calculated that each Paulownia tree could produce a cubic meter
of wood at the age of 5–7 years, producing annually 150 t ha−1
of biomass in intensive
plantations with about 2000 trees by ha (Lucas-Borja et al., 2011).
This work aims to propose an integrated solution to increase the fertility of
contaminated soils for the production of Paulownia fortunei to obtain biomass that
could be used for energy purposes reusing at the same time organic wastes and the
potential use of this tree for phytoremediation. The use of these materials in soil
reclamation could fulfill three objectives: i) recycling of wastes and byproducts, ii)
immobilization of trace elements and iii) restoration of quality and increase productivity
of soil.

2. Materials and methods
2.1. Experimental design
The experiment was carried out under semi field conditions using two trace
element moderately contaminated soils, Aznalcázar (AZ) and Vicario (V), and a non-
contaminated control soil (NC) (Table 1). Trace-element contaminated soils, AZ and V,
were collected in the area affected by a mine spill, the Aznalcóllar mine accident (28th
April 1998) in South West of Spain (Grimalt et al., 1999). Non-contaminated soil (NC)
was collected in the experimental farm “La Hampa” (IRNAS-CSIC) in Coria del Río
(Southern Spain). The experiment was carried out in 27 containers (90 L of volume and
1 m height) that were placed outdoors. Containers filled with the soils were arranged
according to a complete randomized block design with three treatments (two organic
amendments and a control without amendment addition) and three replicates per
treatment. The organic amendments were: AC, “alperujo” compost (alperujo is a solid
by-product from the extraction of olive oil), and BC, biosolid compost.
TABLE 1
The amendments were added in November 2011 at a dose rate of 30000 kg ha-1
.
High acidity, low OM content and moderately high values of total trace elements of soil
V (Table 1), advised a second addition of 25000 kg ha-1
of each amendment in March
2012. In each container a P. fortunei sapling from the Huelva University nursery was
planted (saplings height around 10-15 cm). Amendments characteristics are shown in
Table 2.
TABLE 2
Containers were irrigated daily during the higher growth stage (May to October),
though a drip irrigation hose with two emitters of 3 L h-1
per container. The mean water
dose during this time was 333 ml per container and day. This value was calculated taken
into account the evapotranspiration demand to keep the soil moisture close to its water
holding capacity.
Soil pore water was sampled by ‘Rhizon’ samplers (Eijkelkamp Agrisearch
Equipment, The Netherlands) inserted laterally into the containers at 20 cm depth. Pore
water was sampled at regular intervals (after rainfall episodes; Figure S1) throughout
the experimental period using removable needles attached by a Luer–Lock connection
to the sampler and vacuum tubes to extract soil pore water from the sampler.
Soil samples at 0-15 cm depth were taken in November 2011 (first sampling) in
May 2012 (second sampling) and May 2013 (third sampling). The soil was sieved (2
mm) and stored at 4 °C for a few days to prevent moisture loss before assaying for
microbiological analysis. One sub-sample was air dried, crushed and sieved (<2 mm
and <60µm) for chemical analysis.
Leaves were sampled in 2013 previous the cut down of each Paulownia tree to
obtain total biomass (including shoots, leaves and trunk).
2.2 Soil chemical properties determination
Soil pH was measured in a 1M KCl extract (1:2.5, m/v) after shaking for one
hour (Hesse, 1971) using a pH meter (CRISON micro pH 2002). Electrical conductivity
(EC) of soil was measured in the extract 1:5 soil/ water. The available trace element
(As, Cd, Cu, Pb and Zn) concentrations in soils were determined in 0.01 M CaCl2 (1:10,
m/v) extracts after shaking for three hours (Houba et al., 2000). Pseudo-total trace
element concentrations in soil samples (< 60 μm) were determined by digestion with
aqua regia (1:3 v:v conc. HNO3:HCl) in a microwave oven (Microwave Laboratory
Station Mileston ETHOS 900, Milestone s.r.l., Sorisole, Italy). Trace elements in all the
extracts were determined by ICP-OES (inductively coupled plasma-optical emission

spectrometry) using an IRIS Advantage spectrometer (Thermo Jarrel Ash Corporation,
MA USA).
Total organic carbon (TOC) was determined by dichromate oxidation and
titration with ferrous ammonium sulphate according to Walkley and Black (1934) and
total Kjeldahl-N (TKN) by the method described by Hesse (1971). Available-P was
determined by extraction with sodium bicarbonate at pH 8.5 (Olsen et al., 1954), and
available-K was determined after extraction with ammonium acetate at pH 7.5 (Dewis
and Freitas, 1970).
2.3 Microbial analysis
Dehydrogenase activity was determined by the method of Trevors (1984). Aryl-
sulphatase activity was determined as proposed by Tabatabai and Bremmer (1970). β-
glucosidase activity was measured as indicated by Tabatabai (1982). Phosphatase
activity was measured by the method proposed by Tabatabai and Bremmer (1969).
Urease activity was determined according the method proposed by Kandeler and Geber
(1988) and modified by Kandeler et al. (1999).
All enzyme activities were expressed in g PNP g dry soil−1
h−1
(PNP, p-
nitrophenol), except dehydrogenase activity, which was expressed in µg INTF g dry
soil−1
h−1
(INTF, p-iodonitrotetrazolium formazan) and urease activity, which was
expressed in µg N-NH4+ g dry soil
−1 h
−1.
2.4 Soil Pore Water Analysis
Soil pore water (SPW) was extracted by mean of ‘Rhizon’ soil moisture
samplers that have been proposed as a valid tool for monitoring and assessing eco-
toxicity in soils (Beesley et al., 2010; Clemente et al., 2008). ‘Rhizon’ soil moisture
samplers allow repetitive sampling the aqueous phase of the soil in a determined

location over time and without significantly disturbing the structure, chemistry or
biology of the soil.
Volumes of 5-10 ml of interstitial soil water samples were only taken after
intensive rainfall period and were analysed for pH and trace elements by ICP-OES.
Detection limits for trace elements were: Cd 0.05 μg L-1
, Cu 0.3 μg L-1
, Mn 0.03 μg L-1
,
Zn 0.2 μg L-1
.
2.5 Plant material
Vegetal material (leaves) was washed with a 0.1N HCl solution for 15 s and with
distilled water then for 10 s. Washed samples were oven dried at 70 ºC. Dried plant
material was ground and passed through a 500-μm stainless-steel sieve prior to
preparation for analysis.
Dried plant samples were digested by wet oxidation with concentrated HNO3
(65%, trace analysis grade) under pressure in a microwave oven. Determination of trace
elements (As, Cd, Cu, Pb and Zn) in the extracts was performed by ICP-OES. The
accuracy of the analytical methods was assessed through BCR analysis (Community
Bureau of Reference) of a plant sample (INCT-TL-1, Tea leaves).
2.6 Statistical analyses
All statistical analyses were carried out with the program SPSS 20.0 for
Windows. Results of each soil were analysed by ANOVA, considering treatment as the
independent variable. Significant statistical differences of variables between treatments
were established by Tukey’test (p<0.05). Data normality was tested prior to analysis,
and when necessary, variables were transformed logarithmically, and normality was
then passed in all cases.
Sun ray plots were constructed to graphically compare the mean values of
different studied enzymatic activities in each soil and treatment. The star shape and the
integrated area for each treatment allow a comparison of visual and statistical
presentations of multivariate data. The integrated area of each star for each soil-
treatment pair was measured using the measuring tools of Adobe Acrobat 9® (Adobe
Systems Incorporated, CA, USA).
3. Results and discussion
3.1 pH, EC, TOC and nutrients in soils
Values of pH in neutral soils (NC and AZ) showed few changes due to
amendment addition, only in NC soil in the third sampling (May 2013), a significant
increase due to BC addition was observed. Values of pH in AZ soil increased over time
not only in the containers amended with both organic amendments (AZ+AC and
AZ+BC), but also in the control containers (AZ) (Figure 1a). In the acid soil (V) in the
second and third samplings (May 2012 and May 2013) both amendments increased
significantly pH values compared to soil without amendment addition. Time evolution
of soil pH showed also noticeable increases in the three treatments (V, V+AC and
V+BC). Soil pH is one of most important factors to maintain soil fertility (Brady and
Weil, 2002). The addition of amendments can increase soil alkalinity, especially in acid
contaminated soils (Madejón et al., 2010). Mean values of soil pH in NC and AZ soils
only showed slightly increases (Figure 1a) that can be attributed to the application of the
amendments as might be expected from the nature of both soils and composts (pH close
to neutrality, Tables 1 and 2). In this study the effects of amendments was more
noticeable in the acid soil V (Figure 1a) whose pH increased. This soil, pH growth was
especially evident in the third sampling due to the extra addition of amendments.
FIGURE 1
Different mechanisms have been proposed to explain the liming effect of organic
residues. These include proton consumption during decarboxylation of organic acid

anions which occurs as plant residues decompose, proton consumption by functional
groups associated with organic material, and specific adsorption of organic molecules
by ligand exchange with the release of OH− ions. Another important factor is the
formation of Al insoluble solid- and aqueous-phase complexes with organic matter,
inhibiting Al hydrolysis and decreasing production of protons (Mokolobate and Haynes,
2002; Naramabuye and Haynes, 2006). However, protons released by soil
microorganisms during mineralization of organic matter can slightly acidify the soil,
restricting the alkalinising potential of organic amendment.
In soils without amendment addition, Paulownia roots maintained soil pH
around neutrality in the neutral soils (NC and AZ) and increased pH values in the acid
soil V (Figure 1a). This may be the result of exudates and metabolites released by the
roots and microbial metabolites in the soil rhizosphere (Marschner and Romheld, 1983;
Leyval and Berthelin, 1993). Roots can alter local pH soil conditions by
assimilation/production of anions/cations, release of organic acids and CO2, O2
consumption and redox reactions (Nye, 1981; Jones et al., 2004). Pérez de Mora et al.
(2006) found similar soil pH increases the same acid soil V using Agrostis as vegetal
cover after 36-months of experimentation.
Values of EC and TOC are only shown at the beginning of the experiment (Nov
2011) and at the end (May 2013) (Figure 1 b and c). In neutral soils (NC and AZ) the
addition of amendments increased EC only in the first sampling (2011). In the case of V
soil we could not find any difference attributed to amendments, although a general
decrease was observed over time (Figure 1b).
In general, values of TOC of the three soils increased throughout the experiment,
although only in the sampling of May 2013 this behaviour was supported by statistic
(Figure 1c). These increases may be attributed both to amendment application and plant

growth. Differences of the values of TOC of unamended soils in the two samplings
allow estimating the influence of Paulownia growth in TOC values. In fact, in soils not
receiving amendments, values increased from 0.49 to 0.85 % in NC (Δ 0.45%) and from
0.63 to 1.06 % in V (Δ 0.43%). No increase was observed in AZ soil.
Organic matter is vital to soil quality and for the regulation of important soil
functions. Furthermore, the use of amendments can be used to enhance and speed
remediation of contaminated soils (Terry, 1998; Brown, 1997; Kumpiene, 2010). The
increase of organic matter of the original soils was one of the main objectives of
applying organic amendments to the contaminated and degraded soils studied in the
present paper. Values of TOC in unamended soils ranged from very low for NC to high
for AZ, with low value for V (Figure 1c) (Hazelton and Murphy, 2007). The increase of
organic matter (estimated by TOC) was especially important in soils NC and V, which
had the lower initial TOC (Table 1). Paulownia development also contributed to
increase the organic matter contents of the soils, as can be seen by the increase of TOC
in the unamended soils (Figure 1).
In general, both amendments increased TNK in all soils, although this increment
was not always significant (Figure 1d). It was observed that in NC and V soils, both
amended and unamended, TKN tend to increase over time, while in AZ soils TKN
remains practically constant throughout the experiment. These results reveal the effect
of plant growth on maintaining or even increasing N contents of soils, despite the high
demand of N of Paulownia (Zhu, 1991). The evolution over time showed remarkable
increments in the treatments NC+AC and V+AC.
The effect of amendments on soil available-P was evident, especially in BC
treatments (due to its higher P content, Table 2). Figure 1e shows significant increases
of available-P values in amended soils. In unamended soils and in NC and AZ soils

amended with AC, available-P decreased over time, probably due to the plant demand.
However in BC amended soils available-P remains practically constant during the first
and second sampling, increasing in the third one to very high levels (> 50 mg kg-1
). It
seems that the supply of available-P of this organic amendment went on until the end of
the experiment, when the P demand of the plant is lower.
Figure 1f shows that in the first sampling the available-K increased in the three
soils with the application of AC as a consequence of the greater K content of AC (Table
2). Addition of BC had no effect on the available-K of any of the soils. Soils amended
with AC amendment reached values higher than 400 mg kg-1
in NC and AZ, and of 250
mg kg-1
in V (Figure 1f). Afterwards the general trend of these values was the decrease
over time (Figure 1f).
Values of TKN in the unamended soils were very low in NC, normal in AZ and
low in V (Figure 1d) (Hazelton and Murphy, 2007). Pauwlonia plantations have high
requirements of N and other nutrients (Zhu, 1991), and consequently the addition of
amendments is crucial for its efficient cultivation. However, this study shows that
despite the values of TKN ranging from low (NC and V) to medium (AZ), N contents in
leaves had relatively high values – up to 2.5% in all the soils ant treatments (Figure 4).
The effect of amendment on N in leaves was only appreciable in the soil with lower
values of TKN (NC and V).
Therefore, these results show that this species did not impoverish the nutritional
level of the soil, except in case of K. This reinforces the fact that Paulownia species is
an excellent viable crop not only in semiarid arid soils, but also in contaminated soils.
The presence of Paulownia, increased soil TKN, but decreased the available-P and –K
(Figure 1), probably because of the demand of P and K by the plant.
3.2 Enzymatic activities
A diagram of the sun ray plot was used to summarise the efficiency of
amendments and plants on the biochemical status throughout the study of five
enzymatic activities (Dehydrogenase activity, Aryl-sulphatase activity, β-glucosidase
activity, Acid phosphatase activity and Urease activity) (Figure S2). The integrated area
(IA) of the five-pointed star (sun ray plot) was used to calculate the relative surface area
(RSA) of each soil comparing unamended and amended soils (RSA=
IAamendment/IAunamendment). This relative surface area can be considered both as an index
of soil quality and of soil recovery. The IA of sun ray plot constructed with the
enzymatic activities can be used to evaluate globally the effects of amendment addition
and Paulownia development on soil quality. In this study we also compare RSA over
time, (RSAtime= IAsampling3/IAsampling 1).
Figure S2 and Table 3 shows that the size of the start of the unamended soil AZ
is higher than those for NC and V, 4 and 4.4 times respectively. These values remain
throughout the experiments. It is interesting to highlight that AZ has the better values of
soil chemistry characteristics: neutral pH, low EC, normal values of TKN, and high
values of both available-P and available-K. At the same time AZ is the soil with the
greater value of TOC.
TABLE 3
In 2012 it was observed similar improvements of “soil biochemical quality” for
both amendments in soils NC and V. In both soils values of IA were similar for
amended soils and greater than in unamended soils. Values of RSA in amended soils
were greater than 1 (Table 3). In this second sampling, “soil biochemical quality” of AZ
improved only after the application of BC (values of RSA>1). Similar behaviour was
observed in the last sampling (May 2013). The positive effect was greater in NC and V

than in AZ, possibly because of the higher values of enzymatic activities of the original
AZ soil. It is worthy to point out that the only presence of Paulownia had a positive
effect of the enzymatic activities as values of IA of unamended soils increased
throughout the experimental period. In the third sampling (May 2013) IA of the
unamended soils increased 67% in NC, 12% in AZ and 32% in V relative to the values
in November 2011.
Amendments with BC increased IA values in the three soils, while amendments
with AC increased IA only in soil NC. Values of RSA highlight the fastest effect of BC
on soil enzymes activities. It is not clear which of the two amendments was more
effective to improve IA. In the first sampling soils with BC had the greater values of IA
and RSA, but in the other two samplings not always IA was greater in BC treated soils,
although values of RSA for these soils were always greater than 1. A similar study in
the rhizosphere and bulk soils of P. fortunei growing in contaminated soils showed that
all physico-chemical properties increased in time, indicating that the nutrient pools and
characteristics of soil ecosystem were gradually re-established. In the rhizosphere
microenvironment, pH, OM and EC were important factors affecting the distribution of
heavy metal fraction (Wang et al., 2009).
3.3 Available trace elements in soils
In this study we have evaluated soil trace element availability by two methods:
soil extraction with 0.01M CaCl2 and concentration in the soil pore water (SPW).Values
of bioavailable trace metal estimated by the two methods are presented in Figures 2 and
3. Concentrations of extractable As and Pb were always below the detection limits of
the method (0.01 mg L-1
in the extract, equivalent to 0.1 mg kg-1
in soil).
FIGURE 2
Available trace element extracted with CaCl2 (Cd, Cu and Zn) concentrations in
the three samplings were much higher in V soils (Figure 2). Despite of the differences
in pseudototal trace elements concentration in soils (Table 1) few differences were
found between NC and AZ soils in bioavailable concentration. In general the highest
values were observed in the first sampling (Nov 2011) and these concentrations
decreased with time in all treatments. The differences between treatments for each soil
were significant in some cases (Figure 2). It was remarkable the general decrease of Cd
in all soils and treatments in the last sampling (May 2013). In NC and AZ soils
amendment addition did not have any effect on the availability of these three trace
elements. The clearest effect due to amendment addition was observed in V soils, in
which the presence of BC, and particularly AC, reduced the availability of trace
elements during all the study period (Figure 2).
FIGURE 3
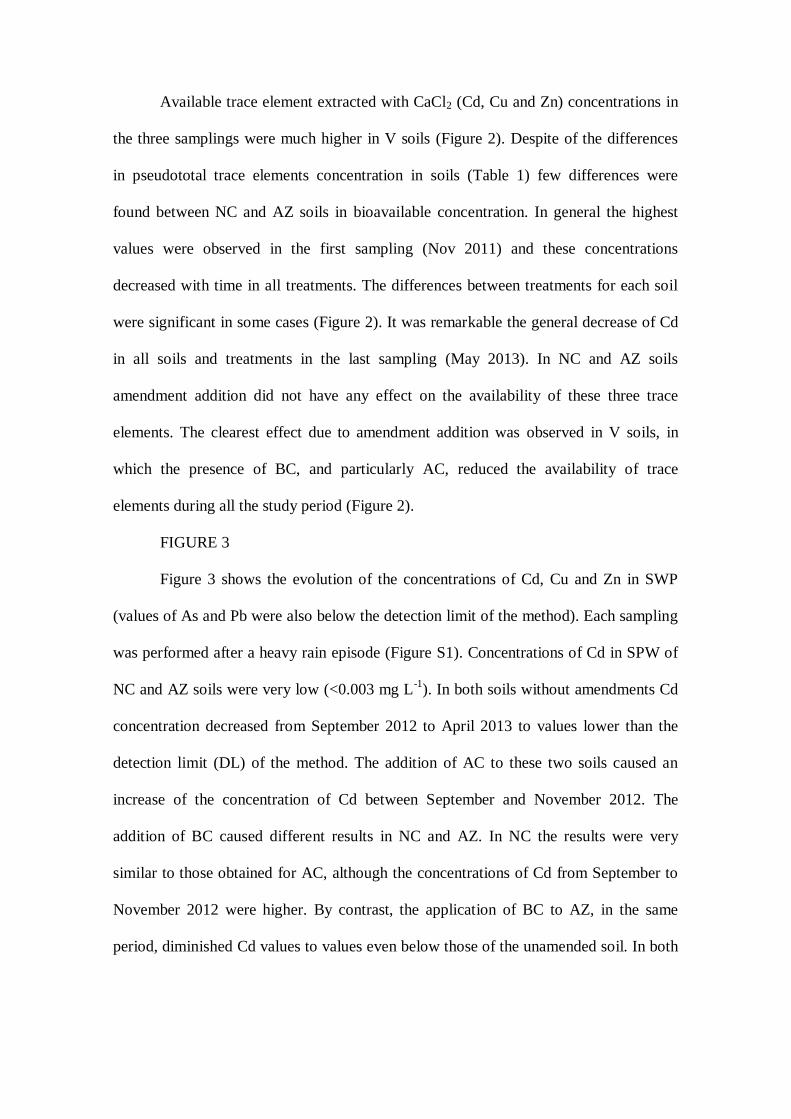
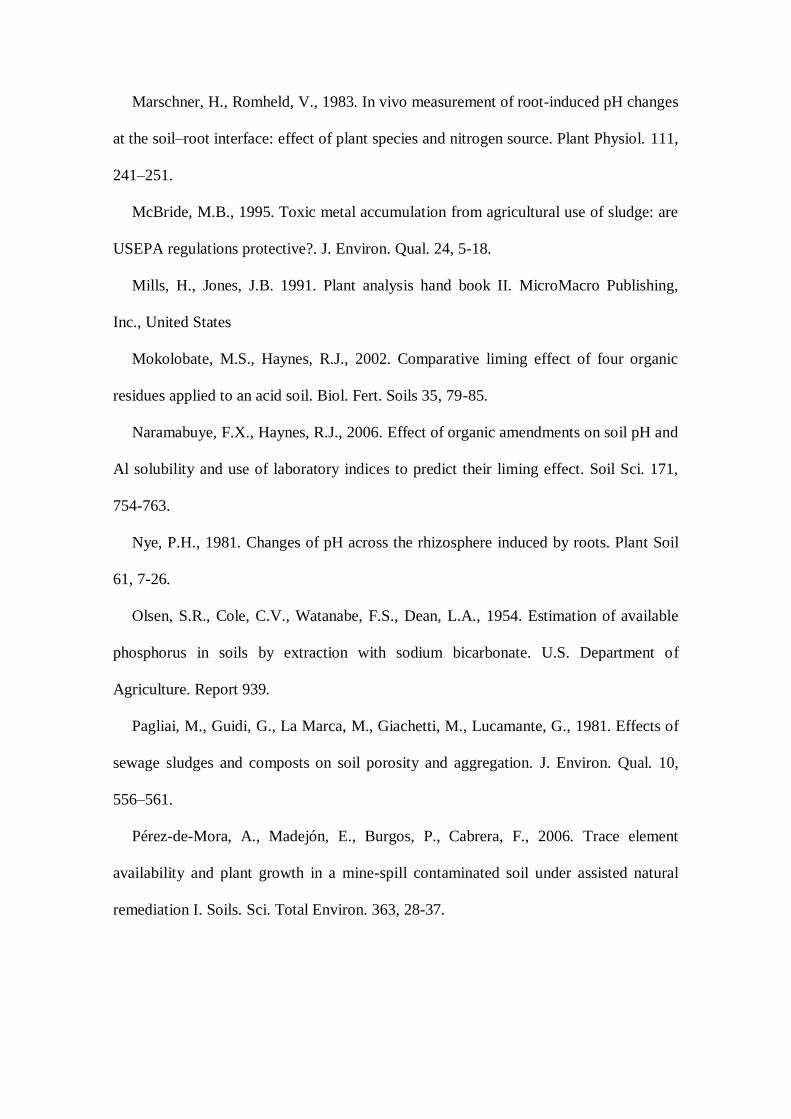
Figure 3 shows the evolution of the concentrations of Cd, Cu and Zn in SWP
(values of As and Pb were also below the detection limit of the method). Each sampling
was performed after a heavy rain episode (Figure S1). Concentrations of Cd in SPW of
NC and AZ soils were very low (<0.003 mg L-1
). In both soils without amendments Cd
concentration decreased from September 2012 to April 2013 to values lower than the
detection limit (DL) of the method. The addition of AC to these two soils caused an
increase of the concentration of Cd between September and November 2012. The
addition of BC caused different results in NC and AZ. In NC the results were very
similar to those obtained for AC, although the concentrations of Cd from September to
November 2012 were higher. By contrast, the application of BC to AZ, in the same
period, diminished Cd values to values even below those of the unamended soil. In both
soils from November 2012 to March 2013 the Cd concentration declines rapidly up to
values < DL.
In V soil concentrations of Cd were higher than in NC and AZ at the beginning
of the experiment (0.01-0.02 mg L-1
Sept-Dic 2012) decreasing afterwards to values
around 0.0025 mg L-1
. The acid soil (V) usually showed greater values of Cd in SPW
than in the other two soils. The application of both amendments decreased the
concentration of Cd at the beginning of the experiment to values below those of the
unamended soil.
The evolution of the concentration of Cu in SPW in NC and AZ soils was
similar. The addition of amendment caused little increases of the concentration of Cu in
NC, but no in AZ. Figure 3 shows some peaks between October 2012 and March 2013
in the concentration of Cu, attributed to period of drought-rain (Figure 1S), before to
diminish sharply to very low values at the end of the experimental period. In V soil Cu
evolution in SPW was different; it was initially observed an important reduction of the
concentration of Cu due to amendments. Afterwards the concentration of Cu decreased
in the three treatments with a peak in February – probably due to one of the above
commented period of drought-rain – to reach values of about 0.15 mg L-1
(Figure 3).
The evolution of Zn concentration in SPW was similar to that described for Cu,
except that it rose considerably from March to the end, especially in NA and AZ soils.
In V soil the fall of Zn concentration after the application of amendments was not as
patent as observed in other elements.
The use of inexpensive organic amendments is a successful measure to reduce
available trace elements in soil (Madejón et al., 2009; 2010). However the
decomposition of organic amendments could lead to an increase of trace element
availability (McBride, 1995). The decrease of availability of trace elements is related

with liming effect of organic matter and with diverse processes taken place in the
rhizosphere (Figure 2a). Both compost and plant development can ameliorate the acidity
of the soils and consequently the decrease of availability of cationic trace elements
(Brallier et al., 1996); Both processes are basic in phytostabilization of contaminated
soils (Bolan et al., 2011).
Root exudates released into the rhizosphere have also been implicated in several
mechanisms for altering the level of soluble ions and molecules within the rhizosphere
(Cataldo et al., 1988). In this study the reduction of the availability of trace elements in
soil could be attributed to Paulownia roots. Similar results were reported by
Ciadamidaro et al. (2013) using Populus alba.
In samples of SPW the effect of amendments on trace element availability were
not as clear as from CaCl2 extractions. Several causes could explain the results obtained
by SPW. First, SPW samples were collected only during rainy season (8 months). On
the other hand, amendments were applied on the surface and mixed with the first 10 cm
of soils, while SPW samples were collected around the rhizosphere ‒ more affected by
the roots than by amendments. Therefore, it seems that SPW results could be more
related with rhizosphere changes, while CaCl2 extraction could reflect global changes
(effects of both amendments and plants) since it was determined in soils samples taken
at 0-20 cm.
3.4. Paulownia nutrients and trace element in leaves and biomass production
Nutrient concentrations in Paulownia leaves (April 2013) are shown in Figure 4.
In general, values of macronutrients were similar in plants of NC and AZ soils and
slightly lower in plants of V soils. Few significant differences due to amendments
addition were observed. Only in the case of the acid soil (V) both amendments
increased the concentrations of Ca and P in plant leaves. No significant increments were

observed for Ca, P and K of soils NC and AZ, and for Mg, S and N of the three soils
due to amendments (Figure 4). Nutritional levels of Paulownia leaves growing in
neutral trace element contaminated soils (AZ) were similar to those trees growing in
non-contaminated soils (Figure 4) implying that these trace elements, due to their low
availability (Figure 2 and 3) were not affecting negatively the uptake of nutrients. These
results may be also related with the higher TOC in AZ soil (Figure 1 c).
Values of N, P, Mg and S in leaves of plants of all soils and treatments were
higher than normal values reported by Mills and Jones (1991) for Paulownia tomentosa
(2.46 % for N, 0.23 % for P, 0.28 for Mg and 0.19 for S). In NC and AZ soils K was
also higher than the normal value (1.65 %). By contrast, values of Ca were always
lower than the normal concentration 1.86 % (Mills and Jones, 1991),
Despite the increase of available–K and –P observed in the three amended soils,
differences on the K and P concentrations in leaves attributed to amendments were only
observed in the acid soil V. Concentrations of K in leaves that were below the normal
values in unamended V soil, only increased with AC – a K-rich amendment (Figure 4).
Concentrations of P in leaves increased with amendments in soil V, although
differences were only significant for AC treatment.
No other amendments incidences were observed in the concentrations of Mg, S
and N in leaves of any of the three soils. This could be related with a regulation of
macronutrient absorption by the plant: although high amounts of available nutrients
were present in soils, plants only absorbed the necessary amount. In the case of the acid
and trace element contaminated soil (V), the addition of amendments was necessary to
maintain nutritional levels, as it is well known that trace elements can modify nutrients
uptake by the plants (Kabata-Pendias and Pendias, 2001). This result remarks that in

acid trace element contaminated soils amendment additions could be essential for the
right development of the plant.
FIGURE 4
As for macronutrients, there were not significant differences in trace element
concentrations in leaves due to amendments addition. Concentrations of As, Cd, Mn and
Pb in leaves were within the range of mature leaf tissue generalized for various (As, 1-
1.7 mg kg-1
; Cd, 0.05-0.2 mg kg-1
; Mn, 30-300 mg kg-1
; Pb, 5-10 mg kg-1
, Kabata –
Pendias and Pendias, 2001). Higher values of Mn in plants of V soil compared to those
of soils AZ and NC were directly related with the acidic pH of V soil, since Mn
availability is highly dependent on pH and easily taken up by plants under acidic
conditions (Kabata –Pendias and Pendias, 2001).
Concentrations of Cu in leaves higher than the upper limit of the range of
sufficient or normal values (5-30 mg kg-1
, Kabata–Pendias and Pendias 2001 and Mills
and Jones (1991) reported values of 15 mg kg-1
) were found even in soil NC were Cu
contents in soils were much lower than in soils AZ and V (Table 1). This result suggests
the ability of this species to accumulate this element in its tissues and agree with that
reported by Jiang et al., (2012) who found that P. fortunei was a Cu tolerant plant,
having the ability to accumulate Cu in the aerial parts. These authors concluded that in
order to select the best way to remediate and restore Cu contaminated areas with P.
fortunei, more experiments should be conducted.
High levels for Zn in leaves were also found even in non-contaminated soil (NC)
(Figure 5), taken into account that the sufficient or normal range is 27-150 mg kg-1
(Kabata-Pendias and Pendias, 2001). The highest values were found in soil AZ (up to
250 mg kg-1
), although the Zn availability was higher in V soil (Figures 2 and 3). The
efficacy of Paulownia in the absorption and accumulation of Zn from contaminated

soils has been recently described (Azzarello et al., 2012; Wang et al., 2009). In fact,
Wang et al. (2009) found up to 3000 mg kg-1
of Zn in leaves of P. fortunei growing in
soils containing total levels of Zn of around 1000 mg kg-1
. This data reinforce the ability
of this species of accumulate this element.
No correlations were found between available trace elements in soils (CaCl2
extraction and SPW) and concentration in leaves, except for the concentrations of Cd in
SPW and in leaves (r= 0.75, p<0.001). Similar correlations were calculated by
Ciadamidaro et al. (2013) with Populus alba leaves. However, in this case the results
showed better correlation between available trace elements in soils and P. alba leaves.
Moreover in order to find out what proportion of the total soil metal concentration was
available and transferred to Paulownia tress, the transfer coefficient (TC) was
calculated. This is defined as the ratio of metal concentration in the plant, [M]shoots, to
the total metal concentration in the soil, [M]soil (Adriano, 2001). TC for As was <0.1,
Cd <0.05, Cu <0.5, Mn <0.3, Pb<0.01 and in case of Zn was around 1. It is important to
underline that higher TF were reached in NC soils.
FIGURE 5
TABLE 4
We have found that P. fortunei is able to growth in trace element contaminated
soils. In neutral soils (NA and AZ) biomass production of Paulownia was similar and
was not affected by amendments in these conditions after 18 months of cultivation. The
effects of trace elements in soil could be a drawback for the biomass production of trees.
This aspect is very important when trees are used for energetic purposes, as the case of
Paulownia trees (Doumett et al., 2008). Negative effect of soil acidity and trace element
concentrations on biomass was only observed in soil V that showed the lowest biomass
production. However, it was the only soil with a positive response to the addition of

both amendments (Table 4). According to these results Paulownia is a suitable plant for
phytostabilization of contaminated soils due to its large amount of biomass while
keeping the translocation of metal(loid)s from roots to shoots as low as possible in soils
with high metal(loid) concentrations (Rizzi et al., 2004).
Conclusion
Paulownia fortunei is a promising species for phytostabilization of trace element
polluted soils thanks to its very high biomass productivity, rather than its metal
accumulation potential. The faster, more vigorous growth and deep root system will be
highly advantageous when using P. fortunei to stabilize trace elements contaminated
soils.
This study also shows that P. fortunei is a species that do not impoverish soil
quality although the high demanding of nutrients that can be supply by addition of low
cost amendments. Further, it can be a species that can be used to improve soil quality
not only in contaminated soils; it could be very useful in degraded soils
Acknowledgments
This study was financed by the Autonomous Community of Andalusia RNM-6398,
which were co-financed with FEDER funds (European fund for regional development).
References
Adriano, D.C., 2001. Trace Elements in Terrestrial Environments. Biogeochemistry,
Bioavailability, and Risks of Metals, second ed. Springer, New York.
Adriano, D.C., Wenzel, W.W., Vangrosveld, J., Bolan N.S., 2004. Role of assisted
natural remediation in environmental cleanup. Geoderma 122, 121-142.
Alfaia, S.S., Ribeiro, G.A., Nobre, A.D., Luizão, R.C., Luizão, F.J., 2004. Evaluation
of soil fertility in smallholder agroforestry systems and pastures in western Amazonia.
Agric. Ecosyst. Environ. 102, 409–414.
Ali, H., Khan, E., Sajad, M. A., 2013. Phytoremediation of heavy metals—Concepts
and applications. Chemosphere 91, 869–881.
Azzarello, E., Pandolfi, C., Pollastri, S., Masi, E., Mugnai S., Mancuso S., 2011. The
use of trees in phytoremediation. Perspec. Agr. Vet. Sci. Nut. Nat. Resour. 6, No. 037
Azzarello, E., Pandolfi, C., Giordano, C., Rossi, M., Mugnai, S., Mancuso, S., 2012.
Ultramorphological and physiological modifications induced by high zinc levels in
Paulownia tomentosa. Environ. Exp. Bot. 81, 11– 17.
Beesley, L., Moreno-Jimenez, E., Clemente, R., Lepp, N., Dickinson, N., 2010.
Mobility of arsenic, cadmium and zinc in a multi-element contaminated soil profile
assessed by in-situ soil pore water sampling, column leaching and sequential extraction.
Environ. Pollut. 15, 155–60.
Bolan, N.S., Park, J.H., Robinson, B., Naidu, R., Hug, K.Y., 2011.
Phytostabilization: a green approach to contaminant containment. Adv. Agron. 112,
145-204.
Brady, N.C., Weil, R.R., 2002. The nature and properties of soils, thirteenth edition.
Prentice-Hall, Upper Saddle River, New Jersey.
Brallier, S., Harrison, R.B., Henry, C.L., Dongsen, X., 1996. Liming effects on
availability of Cd, Cu, Ni and Zn in a soil amended with sewage sludge 16 years
previously. Water Air Soil Pollut. 86, 195–206.
Brown, K.W., 1997. Decontamination of polluted soils, in: Iskandar, I.K., Adriano,
D.C. (Eds.), Remediation of soils contaminated with metals. Advances in
Environmental Science. Science Review, pp.47-66.
Calfapietra, C., Gielen, B., Karnosky, D., Ceulemans, R., Scarascia Mugnozza, G.,
2010. Response and potential of agroforestry crops under global change. Environ.
Pollut. 158, 1095–1104.
Cataldo, D.A., McFadden, K.M., Garland, T.R., Wildung, R.E., 1988. Organic
constituents and complexation of nickel (II), iron (III), cadmium (II) and plutonium (IV)
in soybean xylem exudates. Plant Physiol. 50, 208–213
Chirko, C.P., Gold, M.A., Nguyen, P.V., Jiang, J.P., 1996. Influence of direction and
distance from trees on wheat yield and photosynthetic photon flux density (Q(p)) in a
Paulownia and wheat intercropping system. Forest Ecol. Manag. 83, 171–180.
Ciadamidaro, L., Madejón, E., Puschenreiter, M., Madejón, P., 2013. Growth of
Populus alba and its influence on soil trace element availability. Sci. Total Environ.
454-455, 337–347.
Ciadamidaro, L., Madejón, P., Madejón, E., 2014. Soil chemical and biochemical
properties under Populus alba growing: Three years study in trace element contaminated
soils. Appl. Soil Ecol. 73, 26-33.
Clemente, R., Dickinson, N.M., Lepp N.W., 2008. Mobility of metals and metalloids
in a multielement contaminated soil 20 years after cessation of the pollution source
activity. Environ. Pollut. 155, 254–61.
Dewis, J., Freitas, F., 1970. Método físicos y químicos de suelos y aguas. Food and
Agricultura Organization, Boletín de Suelo N° 10.
Doumett, S., Lamperi, L., Checchini, L., Azzarello, E., Mugnai, S., Mancuso, S.,
Petruzzelli, G., Del Bubba, M., 2008. Heavy metal distribution between contaminated

soil and Paulownia tomentosa, in a pilot-scale assisted phytoremediation study:
Influence of different complexing agents. Chemosphere 72, 1481-1490.
Grimalt, J.O., Ferrer, M., Macpherson, E., 1999. The mine tailing accident in
Aznalcollar. Sci. Total Environ. 217, 3-11.
Hazelton, P., Murphy, B., 2007. Interpreting soil test results: what do all the numbers
mean?. CSIRO Publishing, Collinwood, Victoria.
Hesse, P.R., 1971. A textbook of soil chemical analysis. John Murray, London
Houba, V.J.G., Temminghoff, E.J.M., Gaikhorst, G.A., Van Vark, W., 2000. Soil
analysis procedures using 0.01 M calcium chloride as extraction reagent. Commun. Soil
Sci. Plant Anal. 31, 1299–396.
Jiang, Z-F., Huang, S-Z., Han, Y-L., Zhao, J- Z., Fu, J-J., 2012. Physiological
response of Cu and Cu mine tailing remediation of Paulownia fortunei (Seem) Hemsl.
Ecotoxicology 21, 759–767.
Jones, D.L., Hodge, A., Kuzyakov, Y., 2004. Plant and mycorrhizal regulation of
rhizodeposition. New Phytol. 163, 459–80.
Kabata-Pendias, A., Pendias, H., 2001. Trace elements in soils and plants,·third ed.
CRC Press, Boca Raton.
Kandeler, E., Gerber, H., 1988. Short-Term assay of soil urease activity using
colorimetric determination ammonium. Biol. Fertil. Soil 6, 68-72.
Kandeler, E., Stemmer, M., Klimanek, E.M., 1999. Response of soil microbial
biomass, urease, and xylanase within particle size fraction to long-term soil
management. Soil Biol. Biochem. 31, 261–273.
Kumpiene, J., 2010. Trace element immobilization in soil using amendments, in:
Hooda, P.S. (Ed.), Trace Elements in Soils. Wiley-Blackwell, Chichester, UK, pp.353-
380.

Larchevêque, M., Ballini, C., Korboulewsky, N., Montès, N. 2006.The use of
compost in afforestation of Mediterranean areas: Effects on soil properties and young
tree seedlings. Sci. Total Environ. 369, 220-230.
Lepp, N.W., Madejón, P., 2007. Cadmium and zinc in vegetation and litter of a
voluntary Woodland that has developed on contaminated sediment-derived soil. J.
Environ. Qual. 36, 1123–31.
Leyval, C., Berthelin, J., 1993. Rhizodeposition and net release of soluble organic
compounds by pine and beech seedlings inoculated with rhizobacteria and
ectomycorrhizal fungi. Biol. Fertil. Soils 15, 259–267.
Lucas-Borja, M.E., Wic-Baena, C., Moreno J.L., Tarek, D., García, C., Andrés-
Abellán, M., 2011. Microbial activity in soils under fast-growing Paulownia (Paulownia
elongata x fortunei) plantations in Mediterranean areas. Appl. Soil Ecol. 51, 42-51.
Macci, C., Doni, S., Peruzzi, E., Ceccanti, B., Masciandaro, G., 2012.Bioremediation
of polluted soil through the combined application of plants, earthworms and organic
matter. J. Environ. Monitor. 14, 2710-2717.
Macci, C., Doni, S., Peruzzi, E., Bardella, S., Filippis, G., Ceccanti, B., Masciandaro,
G., 2013. A real-scale soil phytoremediation. Biodegradation 24, 521-538.
Madejón, E., Madejón, P., Burgos, P., Pérez de Mora, A., Cabrera, F., 2009. Trace
elements, pH and organic matter evolution in contaminated soils under assisted natural
remediation: a 4-year field study. J. Hazard. Mater. 162, 931–938.
Madejón, P., Pérez-de-Mora, A., Burgos, P., Cabrera, F., Lepp, N.W., Madejón, E.,
2010. Do amended, polluted soils require re-treatment for sustainable risk reduction? -
evidence from field experiments. Geoderma 159, 174-181.
Marschner, H., Romheld, V., 1983. In vivo measurement of root-induced pH changes
at the soil–root interface: effect of plant species and nitrogen source. Plant Physiol. 111,
241–251.
McBride, M.B., 1995. Toxic metal accumulation from agricultural use of sludge: are
USEPA regulations protective?. J. Environ. Qual. 24, 5-18.
Mills, H., Jones, J.B. 1991. Plant analysis hand book II. MicroMacro Publishing,
Inc., United States
Mokolobate, M.S., Haynes, R.J., 2002. Comparative liming effect of four organic
residues applied to an acid soil. Biol. Fert. Soils 35, 79-85.
Naramabuye, F.X., Haynes, R.J., 2006. Effect of organic amendments on soil pH and
Al solubility and use of laboratory indices to predict their liming effect. Soil Sci. 171,
754-763.
Nye, P.H., 1981. Changes of pH across the rhizosphere induced by roots. Plant Soil
61, 7-26.
Olsen, S.R., Cole, C.V., Watanabe, F.S., Dean, L.A., 1954. Estimation of available
phosphorus in soils by extraction with sodium bicarbonate. U.S. Department of
Agriculture. Report 939.
Pagliai, M., Guidi, G., La Marca, M., Giachetti, M., Lucamante, G., 1981. Effects of
sewage sludges and composts on soil porosity and aggregation. J. Environ. Qual. 10,
556–561.
Pérez-de-Mora, A., Madejón, E., Burgos, P., Cabrera, F., 2006. Trace element
availability and plant growth in a mine-spill contaminated soil under assisted natural
remediation I. Soils. Sci. Total Environ. 363, 28-37.

Rizzi, L., Petruzzelli, G., Poggio, G., Guidi, G. V., 2004. Soil physical changes and
plant availability of Zn and Pb in a treatability test of phytostabilization. Chemosphere
57, 1039–1046.
Szott, L.T., Palm, C.A., Sanchez, P.A., 1991. Agroforestry on acid soils of the humid
tropics. Adv. Agronomy 45, 275–300.
Tabatabai, M.A., Bremner J.M., 1969. Use of p-nitrophenyl phosphate for assay of
soil phosphatase activity. Soil Biol. Biochem. 1, 301–307.
Tabatabai, M.A., Bremmer, J.M., 1970. Arylsulphatase activity of soils. Soil Sci.
Soc. Am. Proc. 34, 225–229.
Tabatabai, M.A., 1982. Soil enzymes, in: Page, A.L., Miller, E.M., Keeney, D.R.,
(Eds.), Methods of Soil Analyses. Part 2. Chemical and Microbiological Properties,
American Society of Agronomy, Madison, WI, pp. 903–947.
Terry, R.E. 1998. Use of soil conditioners to enhance and speed bioremediation of
contaminated soils, in: Wallace, A., Terry, R.E. (Eds.), Handbook of Soil Conditioners.
Substances that Enhance the Physical Properties of Soils. Marcel Dekker, Inc., New
York, pp. 551-573.
Trevors, J.T., 1984. Dehydrogenase activity in soil: a comparison between the INT
and the TTC assay. Soil Biol. Biochem.16, 673–674.
Vervaeke, P., Luyssaert, S., Mertens, J., Meers, E., Tack, F.M.G., Lust, N., 2003.
Phytoremediation prospects of willow stands on contaminated sediment: A field trial.
Environ. Pollut. 126, 275-282.
Walkley, A., Black, I.A., 1934. An examination of the Degtjareff method for
determining soil organic matter and a proposed determination of the chromic acid
titration method. Soil Sci 37, 29-38.

Wang, Q., Shogren, J.F., 1992. Characteristics of the crop-paulownia system in
China. Agric. Ecosyst. Environ. 39, 145–152.
Wang, J., Zhang, C.B., Jin Z.X., 2009. The distribution and phytoavailability of
heavy metal fractions in rhizosphere soils of Paulowniu fortunei (seem) Hems near a
Pb/Zn smelter in Guangdong, PR China. Geoderma 148, 299–306.
Zhu, Z., 1991. Evaluation and model optimisation of Paulownia intercropping system
- A project summary report, in: Zhu, Z., Cai, M., Wang, S., Jiang Y. (Eds.),
Agroforestry Systems in China Chinese Academy of Forestry, People's Republic of
China and International Development Research Centre, Canada, pp. 30-43.
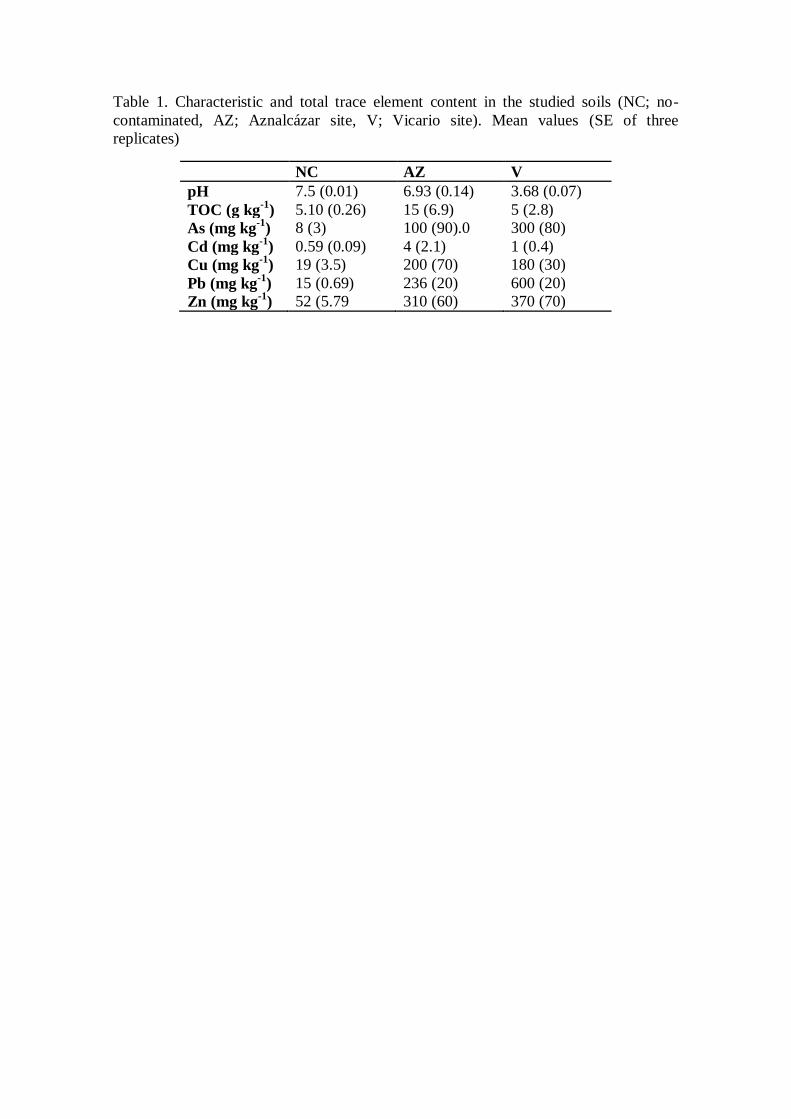
Table 1. Characteristic and total trace element content in the studied soils (NC; no-
contaminated, AZ; Aznalcázar site, V; Vicario site). Mean values (SE of three
replicates)
NC AZ V
pH 7.5 (0.01) 6.93 (0.14) 3.68 (0.07)
TOC (g kg-1
) 5.10 (0.26) 15 (6.9) 5 (2.8)
As (mg kg-1
) 8 (3) 100 (90).0 300 (80)
Cd (mg kg-1
) 0.59 (0.09) 4 (2.1) 1 (0.4)
Cu (mg kg-1
) 19 (3.5) 200 (70) 180 (30)
Pb (mg kg-1
) 15 (0.69) 236 (20) 600 (20)
Zn (mg kg-1
) 52 (5.79 310 (60) 370 (70)

Table 2: Main Characteristics of the two compost used as amendments. Mean values
(the standard deviation of three replicates)
Parameters AC BC
Moisture (%) 14.9 (0.79) 15.6 (0.81)
pH 8.10 (0.21) 7.09 (0.28)
Organic matter (%) 29.1 (1.63) 22.6 (0.39=
P (%P2O5) 2.54 (0.10) 3.43 (0.11)
K (% K2O) 2.30 (0.05) 0.82 (0.04)
Ca (% CaO) 13.8 (0.15) 12.5 (0.37)
Mg (% MgO) 1.48 (0.02) 1.23 (0.04)
S (% SO3) 0.90 (0.01) 2.24 (0.06
Na (mg kg-1
) 0.17 (0.001) 0.10 (0.01)
Ni (mg kg-1
) 15.0 (1.15) 29.3 (0.49)
Fe (mg kg-1
) 11550 (100) 20800 (700)
Cu (mg kg-1
) 94.2 (1.12) 188 (10.9)
As (mg kg-1
) 2.45 (0.22) 13.5 (0.60)
Co (mg kg-1
) 4.11 (0.07) 7.09 (0.10)
Cd (mg kg-1
) 0.25 (0.00 1.94 (0.09
Pb (mg kg-1) 9.77 (0.06) 61.4 (4)
Mn (mg kg-1) 360 (5.34) 570 (36)
Zn (mg kg-1) 185 (11.1) 600 (32.0)
DHA (µg INTF g-1
dry soil h-1
) 1.0 (0.1) 4.8 (0.31)
BGA (µg PNF g-1
dry soil h-1
) 90 (23) 29.3 (1.70)
UA (µg N-NH4 g-1
dry soil h-1
) 20 (9) 20 (20)
DHA= dehydrogenase activity; BGA= β-glucosidase activity; UA=urease activity; PNP=p-nitrophenol;
INTF=iodonitrotetrazolium formazane; CA=compost of “Alperujo”; CB=compost of biosolids.

Table 3. Integrated area (IA) mm2, relative surface area (RSA)
Sampling Treatment IA RSA RSA in time
Nov 2011 NC 40.8 1
NC+AC 45.8 1.12
NC+BC 67.5 1.65
AZ 165 1
AZ+ AC 155 0.94
AZ+ BC 195 1.18
V 37.4 1
V+AC 32.1 0.85
V+BC 44.9 1.20
May 2012 NC 59.7 1
NC+AC 75.1 1.26
NC+BC 73.4 1.23
AZ 144 1
AZ+ AC 145 1.01
AZ+ BC 182 1.26
V 42.7 1
V+AC 65.0 1.52
V+BC 63.4 1.48
May 2013 NC 68.1 1 1.67
NC+AC 78.8 1.16 1.72
NC+BC 79.2 1.15 1.17
AZ 184 1 1.11
AZ+ AC 150 0.81 0.96
AZ+ BC 227 1.24 1.16
V 49.3 1 1.32
V+AC 86.7 1.76 2.70
V+BC 70.5 1.43 1.57

Table 4. Biomass (g) per tree at each soil and treatment at the end of the experiment (May 2013). For
each column values with same letter do not differ significantly (P<0.05)
Treatment Soil NA Soil AZ Soil V
NC 136 a 144 a 39 a
AC 148 a 146 a 92 b
BC 137 a 152 a 102 b
Figure captions
Figure 1. Evolution of pH (a), electrical conductivity (EC) (b), total organic carbon (TOC) (c), N-
Kjeldahl (TKN) (d), available-P (e) and available-K (f) in the studied soils with and without
amendments at the different samplings. Significant differences due to amendments for each soil and
sampling are marked with different letters (p<0.05)
Figure 2. Evolution of available trace elements (CaCl2 0.01M extracted) in the studied soils with and
without amendments at the different samplings (Values for Cd in May 2013 were < 0.001)
Significant differences due to amendments for each soil and sampling are marked with different
letters (p<0.05)
Figure 3. Trace elements concentration in soil pore water (SPW) during the rainy season (September
2012-April 2013) in the studied soils with and without amendments.
Figure 4. Macronutrient concentrations in leaves of Paulownia (May 2013 sampling) growing at the
three studied soils with and without amendments. Significant differences due to amendments for are
marked with different letters (p<0.05). Lines are normal values (Mill and Jones, 1991)
Figure 5. Trace element concentrations in leaves of Paulownia (May 2013 sampling) growing at the
three studied soils with and without amendments. Significant differences due to amendments for are
marked with different letters (p<0.05). Lines are normal ranges (Kabata-Pendias and Pendias, 2001).

Figure 1
NC
NC+A
C
NC+
BC A
Z
AZ+A
C
AZ+B
C V
V+A
C
V+B
C
pH
1
2
3
4
5
6
7a ab b
b b
a
a
b
b
a
b b
SE
a)
NC
NC+A
C
NC+
BC A
Z
AZ+A
C
AZ+B
C V
V+A
C
V+B
C
EC
, d
S m
-1
200
400
600
800
1000
1200
1400
Nov 11
May 13
a abb
aa
b
SE
b)
NC
NC+A
C
NC+
BC A
Z
AZ+A
C
AZ+B
C V
V+A
C
V+B
C
TO
C,
%
0.5
1.0
1.5
2.0
2.5
3.0
Nov 11
May 13
aab
b
a
a
ab
b
ab
bSE
c)
NC
NC+A
C
NC+
BC A
Z
AZ+A
C
AZ+B
C V
V+A
C
V+B
C
TN
K,
%
0.05
0.10
0.15
0.20
0.25
0.30
Nov 11
May 12
May 13
a
b b
a
b ab
a
ab
b
a
ab
b
a
b
ab
SE
d)
Treatment
NC
NC+A
C
NC+
BC A
Z
AZ+A
C
AZ+B
C V
V+A
C
V+B
C
avail
ab
le-
P,
m k
g-1
10
20
30
40
50
60
Nov 11
May 12
May 13
a
b
b
a
ab
b
a
a
b
a
bb
a
b
c
a
b
c
a
b ab
a
b
ab
a
b
b
e )
SE
Treatment
NC
NC+A
C
NC+
BC A
Z
AZ+A
C
AZ+B
C V
V+A
C
V+B
C
availa
ble
-K,
m k
g-1
50
100
150
200
250
300
350
400
450
500
550
Nov 11
May 12
May 13
a
b
a
a
b
a
a
b
a
a
b
a
a
a
a aaa
b b
b
B A B
f )
SE

figure 2
NC
NC+A
C
NC+ B
C AZ
AZ+A
C
AZ+B
C V
V+A
C
V+B
C
Ava
ilab
le-C
d,
mg
kg-1
0.05
0.10
0.15
0.20
0.25
0.30
0.35
Nov 2011
May 2012
May 2013SE
NC
NC+A
C
NC+ B
C AZ
AZ+A
C
AZ+B
C V
V+A
C
V+B
C
Ava
ilab
le C
u,
mg
kg-1
0.2
0.4
0.6
0.8
1.0
1.2
2.5
3.0
3.5
4.0
May 2011
May 2012
Nov 2013
SE
NC
NC+A
C
NC+ B
C AZ
AZ+A
C
AZ+B
C V
V+A
C
V+B
C
Ava
ilab
le Z
n,
mg
kg-1
0.0
0.2
0.4
0.6
0.8
1.0
10.0
20.0
30.0
40.0
Nov 2011
May 2012
May 2013
SE

figura3
NC
sep 1
sep 2 oct
novdic fe
b
mar
1
mar
2
mar
3
april1
april 2
Cd
mg
L-1
0.000
0.001
0.002
0.003 B
B+AC
B+BC
AZ
sep 1
sep 2 oct
novdic fe
b
mar
1
mar
2
mar
3
april1
april 2
0.000
0.001
0.002
0.003 AZ
AZ+AC
AZ+BC
V
sep 1
sep 2 oct
novdic fe
b
mar
1
mar
2
mar
3
april1
april 2
0.000
0.005
0.010
0.015
0.020
0.025
V
V+AC
V+BC
NC
sep 1
sep 2 oct
novdic fe
b
mar
1
mar
2
mar
3
april1
april 2
Cu
mg
L-1
0.00
0.02
0.04
0.06
0.08
0.10
0.12
AZ
sep 1
sep 2 oct
novdic fe
b
mar
1
mar
2
mar
3
april1
april 2
0.00
0.02
0.04
0.06
0.08
0.10
0.12
0.14
V
sep 1
sep 2 oct
novdic fe
b
mar
1
mar
2
mar
3
april1
april 2
0.0
0.2
0.4
0.6
0.8
1.0
NC
sep 1
sep 2 oct
novdic fe
b
mar
1
mar
2
mar
3
april1
april 2
Zn
mg
L-1
0.0
0.2
0.4
0.6
0.8
1.0
1.2
1.4
1.6
1.8 AZ
sep 1
sep 2 oct
novdic fe
b
mar
1
mar
2
mar
3
april1
april 2
0.0
0.2
0.4
0.6
0.8
1.0
1.2
1.4
1.6
1.8
2.0
V
sep 1
sep 2 oct
novdic fe
b
mar
1
mar
2
mar
3
april1
april 2
0
1
2
3
4
5
6

Figure 4
Ca
NC
NC+A
NC+C
B AA+A
A+C
B VV+A
V+C
B
g 1
00 g
-1
0.5
1.0
1.5
2.0
K
NC
NC+A
NC+C
B AA+A
A+C
B VV+A
V+C
B
0.5
1.0
1.5
2.0
2.5Mg
NC
NC+A
NC+C
B AA+A
A+C
B VV+A
V+C
B
0.1
0.2
0.3
0.4
P
NC
NC+A
NC+C
B AA+A
A+C
B VV+A
V+C
B
0.2
0.4
0.6
0.8 S
NC
NC+A
NC+C
B AA+A
A+C
B VV+A
V+C
B
g 1
00g
-1
0.2
0.4
0.6
0.8 N
NC
NC+A
NC+C
B AA+A
A+C
B VV+A
V+C
B
1
2
3
4
AAB
B
A A
B
A
B
AB

38
Figure 5
As
NC
NC+A
C
NC+C
B AZ
AZ+A
C
AZ+C
B V
V+A
C
V+C
B
mg
kg
-1
0.2
0.4
0.6
0.8
1.0
Cd
NC
NC+A
C
NC+C
B AZ
AZ+A
C
AZ+C
B V
V+A
C
V+C
B
0.03
0.06
0.09
0.12
0.15
0.18
0.21Cu
NC
NC+A
C
NC+C
B AZ
AZ+A
C
AZ+C
B V
V+A
C
V+C
B
10
20
30
40
50
60
Mn
NC
NC+A
C
NC+C
B AZ
AZ+A
C
AZ+C
B V
V+A
C
V+C
B
mg
kg
-1
25
50
75
300
Pb
NC
NC+A
C
NC+C
B AZ
AZ+A
C
AZ+C
B V
V+A
C
V+C
B
0.5
1.0
1.5
5.0 Zn
NC
NC+A
C
NC+C
B AZ
AZ+A
C
AZ+C
B V
V+A
C
V+C
B
50
100
150
200
250
300
A AB
B
SElower limit upper limit

39