quality products. service excellence. 2011 annual report
TRANSCRIPT
2011 Annual Report Quality Products. Service Excellence.

OUR VALUES:We are dedicated to our customers:To provide quality products and service that create value to our customers.
We are responsible to our shareholders:To provide an adequate return on their investment over the long term.
We are committed to our employees:To provide competitive pay, open and frank communication and a safe work environment.
We recognize the importance of our suppliers:To assist us in our ability to serve our customers.
Visit us online at www.hammondmfg.com
QUALITY PRODUCTS. SERVICE EXCELLENCE.We have a broad product offering:To serve our customers in multiple markets and industries.
Our warehouse holds in excess of ten million dollars in inventory:To provide our customers with product availability and rapid order delivery.
Ten day back order recovery on standard product:We work hard to provide you with your required product in a prompt time line.
Value Added Services (Modifications, Assembly and Drop Shipment):To go above and beyond our competition and provide our customers with the exact solution required.

Annual Report 2011 3
Hammond Manufacturing Company Limited
2011 Annual Report
4 Report to Shareholders 5 Management Discussion and Analysis 20 Management’s Responsibility for Financial Reporting 21 Independent Auditors’ Report 22 Consolidated Statements of Financial Position 23 Consolidated Statements of Comprehensive Income 24 Consolidated Statements of Changes in Equity 25 Consolidated Statements of Cash Flows 26 Notes to Consolidated Financial Statements 64 Five Year Financial Summary 67 Corporate Directory

4 Hammond Manufacturing Company Limited www.hammondmfg.com
REPORT TO SHAREHOLDERS Dear fellow shareholders: The following pages provide the comparative numbers and explanations for 2011. What cannot be expressed in columns and tables is the continuous improvements that have been made throughout the Company. This ongoing focus of continuous improvement will drive our success for years to come. Our sales teams launched numerous new products and marketing plans into current and new markets. Our Hammond brand continues to grow around the world. Our operations teams continue the journey of lean manufacturing and employee involvement. I am especially proud of the growth in our „Hammond Culture‟. We continue to define our Company as a career destination and not just a job. Our investment in safety, management training, and skills development is our commitment to all for a safe and rewarding career. The following numbers reflect the past 12 months. Our continuing job is to harness the strengths of all our stakeholders that include suppliers, customers, employees and shareholders. Our goal is to build for the long term success and security of Hammond. My appreciation to all, Sincerely,
Robert F. Hammond Chairman & CEO
ANNUAL MEETING The meeting of the Shareholders will be held on
May 3, 2012 at the Holiday Inn, 601 Scottsdale Drive, Guelph, Ontario
Commencing at 10:00 a.m.
Annual Report 2011 5
MANAGEMENT DISCUSSION AND ANALYSIS
This management discussion and analysis (“MD&A”) comments on the consolidated financial condition and results of operations of Hammond Manufacturing Company Limited (the “Company”) for the year ended December 31, 2011. This discussion should be read in conjunction with the Company‟s consolidated financial statements for the year ended December 31, 2011 and related notes. Additional information about the Company can be found on its website, www.hammfg.com, or through the SEDAR website at www.sedar.com which includes the Company‟s Annual Information Form. The information contained herein is dated as of March 30, 2012.
The annual consolidated financial statements have been prepared in accordance with International Financial Reporting Standards (IFRS). On January 1, 2011, the Company adopted IFRS, which have become the generally accepted accounting principles required to be used by most Canadian publicly accountable enterprises. The Company's financial statements for the year ended December 31, 2011, which comprise the statement of financial position as at December 31, 2011, December 31, 2010 and January 1, 2010, the statements of income, comprehensive income, changes in equity and cash flows for the years ended December 31, 2011 and December 31, 2010, and notes thereto, have been prepared using IFRS. Amounts as at December 31, 2010 and January 1, 2010 and related to the year ended December 31, 2010 within this MD&A have also been revised to reflect the adoption of IFRS. Amounts for periods prior to January 1, 2010 are presented in this MD&A in accordance with Canadian Generally Accepted Accounting Principles in effect prior to January 1, 2011.
Presentation and terminology used in the Company's financial statements and this MD&A differ from that used in previous years. Details of the most significant accounting differences are disclosed in note 27 to our financial statements.
All amounts in this report are in Canadian dollars unless otherwise stated.
Advisory–Certain information in this MD&A is forward-looking and is subject to important risks and uncertainties. The results or events predicted in this information may differ from actual results or events. Forward-looking statements are often, but not always, identified by the use of words such as “anticipate”, “plan”, “estimate”, “expect”, “may”, “project”, “predict”, “potential”, “could”, “might”, “should” and other similar expressions. The Company believes the expectations reflected in forward-looking statements are reasonable but no assurance can be given that these expectations will prove to be correct. These forward-looking statements speak only to the date of this MD&A. The Company disclaims any intention or obligation to update or revise any forward-looking statements, whether as a result of new information, future events or otherwise, except as required pursuant to applicable securities laws.

6 Hammond Manufacturing Company Limited www.hammondmfg.com
MANAGEMENT DISCUSSION AND ANALYSIS
COMPANY PROFILE
Hammond Manufacturing Company Limited manufactures electronic and electrical enclosures, outlet strips and electronic transformers that are used by manufacturers of a wide range of electronic and electrical products. Products are sold both OEM-direct and through a global network of distributors and agents.
Facilities are situated in Canada, the USA, the UK, Taiwan and Australia, with agents and distributors located worldwide. The Company also maintains a 40% ownership share of RITEC Enclosures Inc. (RITEC) located in Taiwan. RITEC produces plastic and die cast enclosures for sale through the Company sales network and its own existing market channels.
OPERATIONS
FOURTH QUARTER RESULTS SALES
Net sales, for the three months ended December 31, 2011 were $22,010,000, an increase of 4.8% from net sales of $21,011,000 in the third quarter of 2011. The growth was all from the US market (up 7.1% in USD and with the translation impact to CDN it was up 11.8%). The Canadian markets remained flat while we saw a slight decline in the UK. Net sales for the current quarter were up 14.2% compared to net sales of $19,270,000 for the three months ended December 31, 2010. In this case all our major markets were up. Canada was up 8.5% while the US was up 19.6% in USD and with translation impact to CDN it was up 20.7%. GROSS PROFIT
Gross profit for the fourth quarter of 2011 was 27.3% of net sales compared to 25.6% in the third quarter of 2011. The Company holds its factory physical inventory count in November of each year and this causes production levels to drop in the quarter. This impact was offset with a favorable movement of the USD from a third quarter average of 1 USD = $0.98 CDN to a fourth quarter average of 1 USD = $1.02 CDN. We have also seen improvement in employee productivity as new hires complete their training. Gross profits of 27.3% are down 1.1% from the fourth quarter 2010 level of 28.4%. The production growth we have seen in 2011 has been met with an approximate 16% increase in production associates at our Guelph facility. We have experienced lower productivity as the new associates are trained and production lines are expanded to accommodate the growth. SELLING, DISTRIBUTION, GENERAL AND ADMINISTRATIVE, RESEARCH AND DEVELOPMENT (“R&D”) EXPENSES AND NET GAIN ON SALE OF PROPERTY, PLANT AND EQUIPMENT
Fourth quarter selling and distribution, general and administration and R&D expenses of $5,297,000 were 24.1% of net sales for the three months ended December 31, 2011, compared with an expense of $4,947,000 in the previous quarter that was 23.5% of net sales and $4,564,000 which was 23.7% of net sales in the fourth quarter of 2010. The growth in sales has increased our commissions and logistic expenses. In 2011, additional inventory storage space was leased increasing quarterly expenses by approximately $35,000.
Annual Report 2011 7
MANAGEMENT DISCUSSION AND ANALYSIS
Overall results from operating activities of $708,000 (3.2% of net sales) is up from the prior quarter of $430,000 (2.0% of net sales) and down from the 2010 fourth quarter amount of $899,000 (4.7% of net sales). INTEREST
Fourth quarter interest expense of $115,000 was down 3.4% from the third quarter expense of $119,000 and up 2.7% from the comparable prior year fourth quarter of $112,000. FOREIGN EXCHANGE TRANSACTIONAL IMPACT
This quarter, the Company recognized a gain on transactional foreign exchange of $67,000 compared to a gain of $15,000 in the three months ended December 31, 2010. INCOME TAX EXPENSE
Fourth quarter year end adjustments to true up to the effective 2011 tax rate netted a tax pickup of $27,000 compared with tax expense of $218,000 (29.3% of income before tax) in the fourth quarter of 2010. INCOME FOR THE PERIOD
Income for the fourth quarter ended December 31, 2011 was $600,000 (2.7% of net sales) this is the same level of return on net sales as that of the fourth quarter ended December 31, 2010 ($525,000). FOREIGN EXCHANGE TRANSLATION OF FOREIGN OPERATIONS
The translation adjustment for the fourth quarter was a loss of $496,000 compared to a translation loss of $188,000 in the fourth quarter of 2010. The fourth quarter loss was primarily caused by the US dollar and British Pound dropping from a third quarter close of $1.04 CDN = $1.00 US to a year end close of $1.017 CDN = $1.00 US and the British pound third quarter close of $1.63 CDN = $1.00 GBP to a year end close of $1.58 CDN = $1.00 GBP. TOTAL COMPREHENSIVE INCOME
Comprehensive income for the fourth quarter ended December 31, 2011 was $104,000 (0.5% of net sales) down from the 3 months ended December 31, 2010 of $337,000 (1.7% of net sales).
8 Hammond Manufacturing Company Limited www.hammondmfg.com
MANAGEMENT DISCUSSION AND ANALYSIS
QUARTERLY INFORMATION
Income Statement Data
Year-to-date
Q1 Q2 Q3 Q4 Total
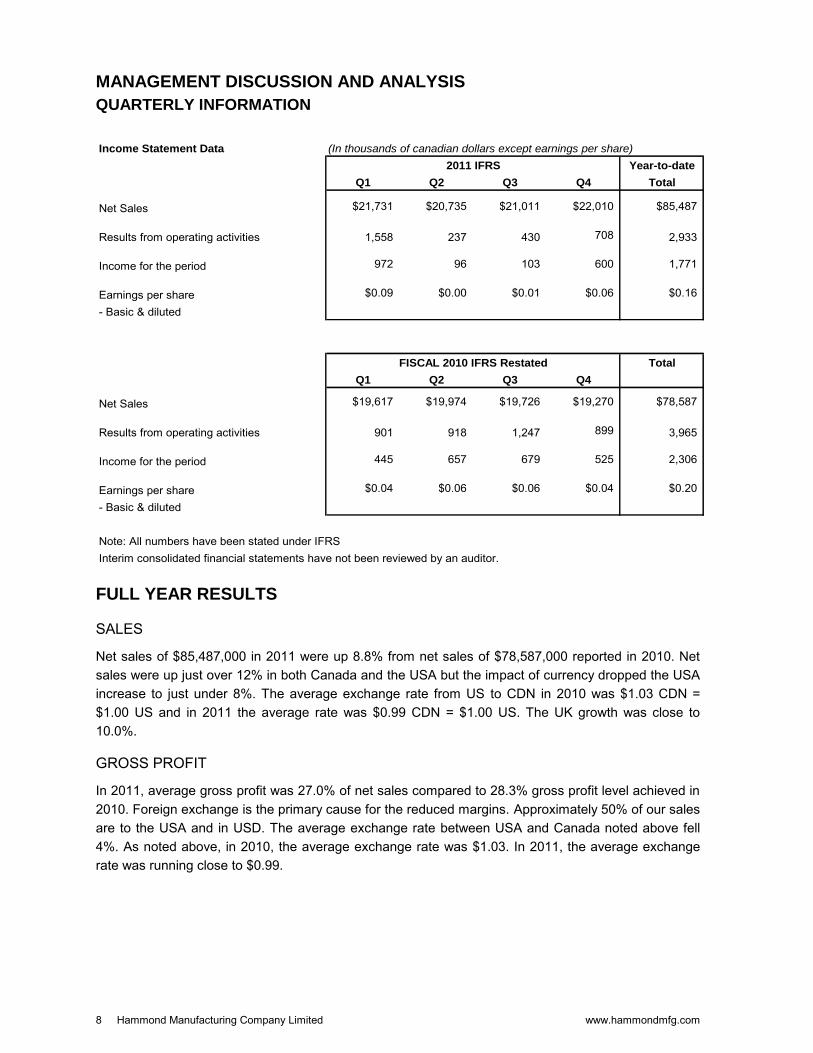
Net Sales $21,731 $20,735 $21,011 $22,010 $85,487
Results from operating activities 1,558 237 430 708 2,933
Income for the period 972 96 103 600 1,771
Earnings per share $0.09 $0.00 $0.01 $0.06 $0.16
- Basic & diluted
Total
Q1 Q2 Q3 Q4
Net Sales $19,617 $19,974 $19,726 $19,270 $78,587
Results from operating activities 901 918 1,247 899 3,965
Income for the period 445 657 679 525 2,306
Earnings per share $0.04 $0.06 $0.06 $0.04 $0.20
- Basic & diluted
Note: All numbers have been stated under IFRS
2011 IFRS
(In thousands of canadian dollars except earnings per share)
FISCAL 2010 IFRS Restated
Interim consolidated financial statements have not been reviewed by an auditor.
FULL YEAR RESULTS SALES
Net sales of $85,487,000 in 2011 were up 8.8% from net sales of $78,587,000 reported in 2010. Net sales were up just over 12% in both Canada and the USA but the impact of currency dropped the USA increase to just under 8%. The average exchange rate from US to CDN in 2010 was $1.03 CDN = $1.00 US and in 2011 the average rate was $0.99 CDN = $1.00 US. The UK growth was close to 10.0%. GROSS PROFIT
In 2011, average gross profit was 27.0% of net sales compared to 28.3% gross profit level achieved in 2010. Foreign exchange is the primary cause for the reduced margins. Approximately 50% of our sales are to the USA and in USD. The average exchange rate between USA and Canada noted above fell 4%. As noted above, in 2010, the average exchange rate was $1.03. In 2011, the average exchange rate was running close to $0.99.
Annual Report 2011 9
MANAGEMENT DISCUSSION AND ANALYSIS SELLING, DISTRIBUTION, GENERAL AND ADMINISTRATIVE, RESEARCH AND DEVELOPMENT (“R&D”) EXPENSES AND NET GAIN ON SALE OF PROPERTY, PLANT AND EQUIPMENT
Selling, distribution, general and administration, R&D expenses including a net gain on sale of property, plant and equipment increased $1,920,000, 10.5% from 2010 although the expense was 23.6% of net sales in 2011, compared with 23.1% in 2010. The primary driver of the increase was from commission and logistic expenses. In 2011, additional inventory storage space was leased starting in the second quarter creating additional cost of $105,000 expense in 2011.
RESULTS FROM OPERATING ACTIVITIES
Overall, 2011 earnings from operating activities $2,933,000 (3.4% of net sales) is down compared to the 2010 earnings of $3,965,000 (5.0% of net sales). INTEREST
Interest expense increased $41,000 (10.0%) from the 2010 expense level to $450,000 in 2011. Increased inventory levels were the primary driver of the increased demand on our bank lines. FOREIGN EXCHANGE TRANSACTIONAL IMPACT
A $101,000 foreign exchange transactional gain was reported in 2011, compared to a transactional gain of $75,000 in 2010. INCOME TAX EXPENSE
2011 tax expenses of $684,000 were 27.9% of income before income tax. This compares to 2010 tax expense of $1,195,000 which was 34.1% of income before income tax. INCOME FOR THE YEAR
Income for the year ended December 31, 2011 was $1,771,000 (2.1% of net sales) down 23.2% from $2,306,000 (2.9% of net sales). FOREIGN EXCHANGE TRANSLATION OF FOREIGN OPERATIONS
2011 saw a gain of $181,000 on translational foreign exchange compared to a loss of $401,000 in 2010. TOTAL COMPREHENSIVE INCOME
Comprehensive income for 2011 was $1,952,000 (2.3% of net sales) up from 2010 of $1,905,000 (2.4% of net sales).
10 Hammond Manufacturing Company Limited www.hammondmfg.com
MANAGEMENT DISCUSSION AND ANALYSIS SELECTED ANNUAL INFORMATION
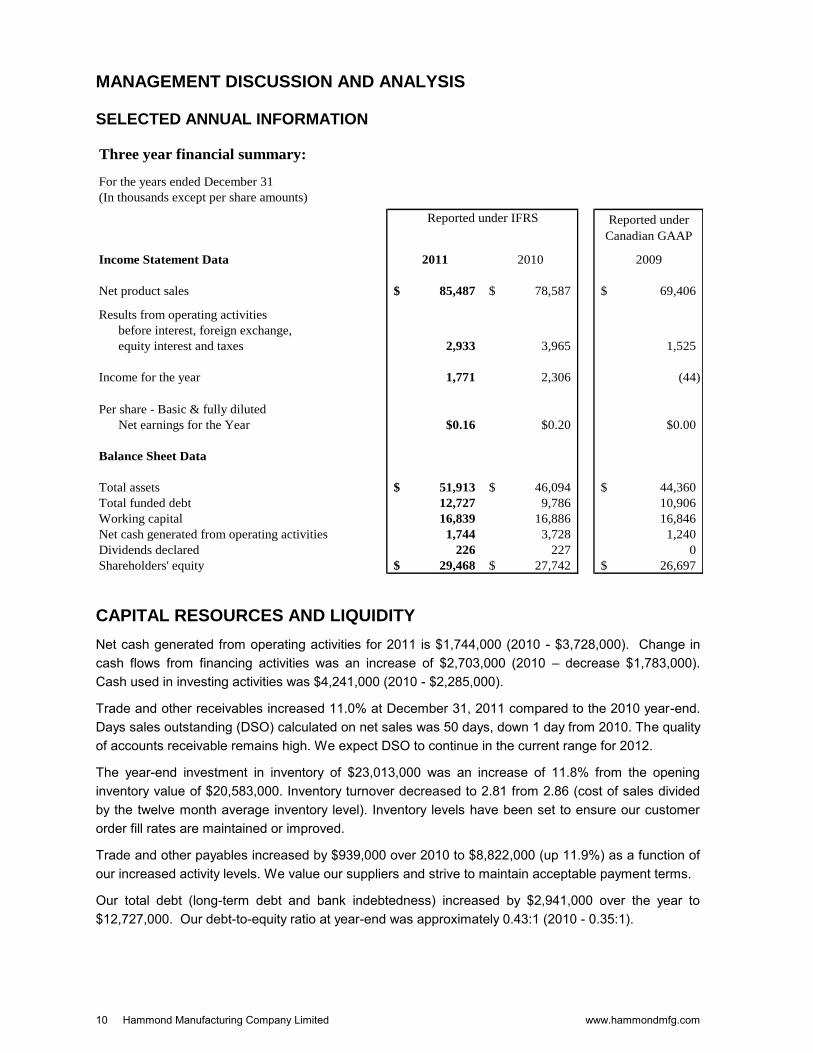
Three year financial summary:
For the years ended December 31
(In thousands except per share amounts)
Reported under
Canadian GAAP
Income Statement Data 2011 2010 2009
Net product sales 85,487$ 78,587$ 69,406$
Results from operating activities
before interest, foreign exchange,
equity interest and taxes 2,933 3,965 1,525
Income for the year 1,771 2,306 (44)
Per share - Basic & fully diluted
Net earnings for the Year $0.16 $0.20 $0.00
Balance Sheet Data
Total assets 51,913$ 46,094$ 44,360$
Total funded debt 12,727 9,786 10,906
Working capital 16,839 16,886 16,846
Net cash generated from operating activities 1,744 3,728 1,240
Dividends declared 226 227 0
Shareholders' equity 29,468$ 27,742$ 26,697$
Reported under IFRS
CAPITAL RESOURCES AND LIQUIDITY
Net cash generated from operating activities for 2011 is $1,744,000 (2010 - $3,728,000). Change in cash flows from financing activities was an increase of $2,703,000 (2010 – decrease $1,783,000). Cash used in investing activities was $4,241,000 (2010 - $2,285,000).
Trade and other receivables increased 11.0% at December 31, 2011 compared to the 2010 year-end. Days sales outstanding (DSO) calculated on net sales was 50 days, down 1 day from 2010. The quality of accounts receivable remains high. We expect DSO to continue in the current range for 2012.
The year-end investment in inventory of $23,013,000 was an increase of 11.8% from the opening inventory value of $20,583,000. Inventory turnover decreased to 2.81 from 2.86 (cost of sales divided by the twelve month average inventory level). Inventory levels have been set to ensure our customer order fill rates are maintained or improved.
Trade and other payables increased by $939,000 over 2010 to $8,822,000 (up 11.9%) as a function of our increased activity levels. We value our suppliers and strive to maintain acceptable payment terms.
Our total debt (long-term debt and bank indebtedness) increased by $2,941,000 over the year to $12,727,000. Our debt-to-equity ratio at year-end was approximately 0.43:1 (2010 - 0.35:1).
Annual Report 2011 11
MANAGEMENT DISCUSSION AND ANALYSIS
The Company paid a dividend of $226,000 in September of 2011 (2010 - $227,000).
Property, plant, equipment and intangible asset additions in 2011 were $4,933,000 up from $2,709,000 in 2010. 2011 expenditures included a $1,300,000 (2010 - $0) expenditure for the purchase of approximately 6.5 acres of land to allow for future expansion of our operations in Guelph, Ontario. The Company spent $403,000 (2010 - $290,000) on building and leasehold improvements. $1,260,000 (2010 - $922,000) was invested toward upgrading and replacing machinery and equipment, $1,182,000 (2010 - $377,000) was invested toward machinery and equipment for capacity growth, $651,000 (2010 - $682,000) was invested in tooling, $137,000 (2010 - 394,000) was invested in office equipment and computer programs and $0 (2010 - $44,000) was put into development costs.
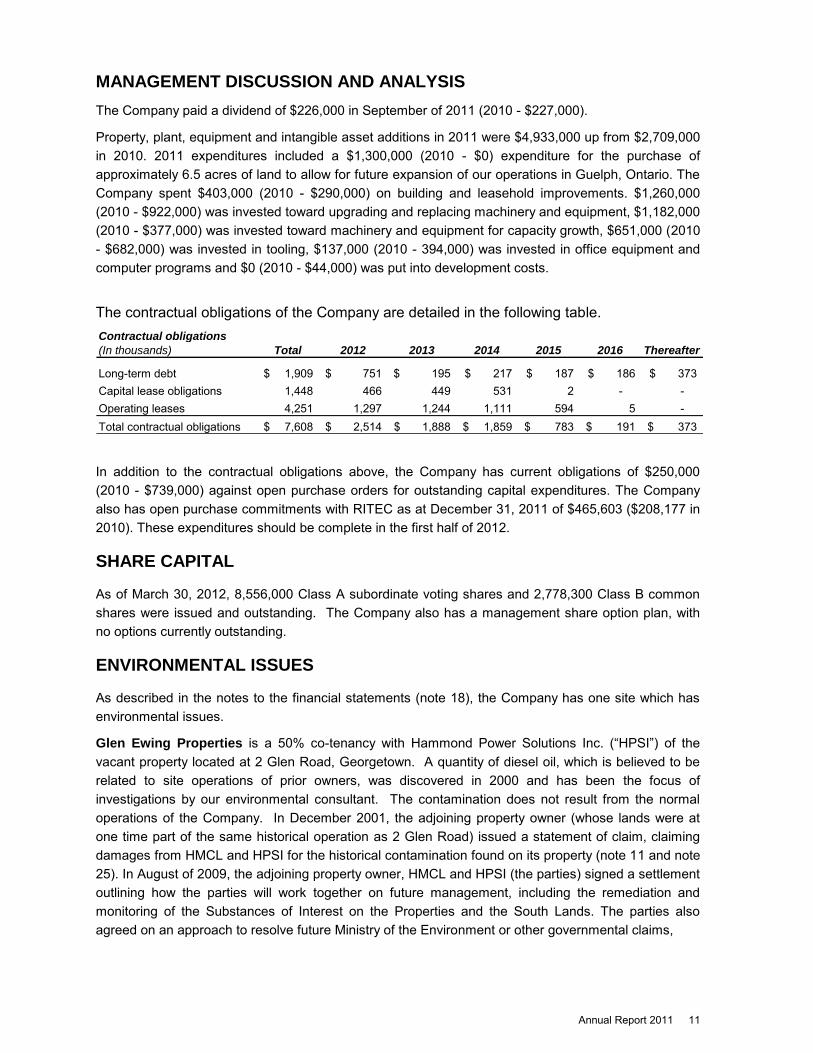
The contractual obligations of the Company are detailed in the following table. Contractual obligations
(In thousands) Total 2012 2013 2014 2015 2016 Thereafter
Long-term debt 1,909$ 751$ 195$ 217$ 187$ 186$ 373$ Capital lease obligations 1,448 466 449 531 2 - - Operating leases 4,251 1,297 1,244 1,111 594 5 - Total contractual obligations 7,608$ 2,514$ 1,888$ 1,859$ 783$ 191$ 373$
In addition to the contractual obligations above, the Company has current obligations of $250,000 (2010 - $739,000) against open purchase orders for outstanding capital expenditures. The Company also has open purchase commitments with RITEC as at December 31, 2011 of $465,603 ($208,177 in 2010). These expenditures should be complete in the first half of 2012.
SHARE CAPITAL
As of March 30, 2012, 8,556,000 Class A subordinate voting shares and 2,778,300 Class B common shares were issued and outstanding. The Company also has a management share option plan, with no options currently outstanding.
ENVIRONMENTAL ISSUES
As described in the notes to the financial statements (note 18), the Company has one site which has environmental issues.
Glen Ewing Properties is a 50% co-tenancy with Hammond Power Solutions Inc. (“HPSI”) of the vacant property located at 2 Glen Road, Georgetown. A quantity of diesel oil, which is believed to be related to site operations of prior owners, was discovered in 2000 and has been the focus of investigations by our environmental consultant. The contamination does not result from the normal operations of the Company. In December 2001, the adjoining property owner (whose lands were at one time part of the same historical operation as 2 Glen Road) issued a statement of claim, claiming damages from HMCL and HPSI for the historical contamination found on its property (note 11 and note 25). In August of 2009, the adjoining property owner, HMCL and HPSI (the parties) signed a settlement outlining how the parties will work together on future management, including the remediation and monitoring of the Substances of Interest on the Properties and the South Lands. The parties also agreed on an approach to resolve future Ministry of the Environment or other governmental claims,
12 Hammond Manufacturing Company Limited www.hammondmfg.com
MANAGEMENT DISCUSSION AND ANALYSIS
orders, directions, prosecutions, tickets, and environmental penalties. As part of this settlement all of the parties dropped their civil actions against each other.
HMCL and HPSI, as co-tenants, have been working co-operatively with the adjacent property owner and its environmental consultant, under the direction of the MOE, in order to evaluate the extent of the contamination and develop an appropriate joint remediation plan for both sites. Ongoing investigations have also indicated that both the co-tenancy‟s and the adjacent owner‟s sites have been impacted by historical solvent usage. These impacts have been incorporated into the joint remediation plan. HMCL‟s share of the costs for legal and consulting work for the year 2011 related to this property was $117,000 (2010 - $75,000). The parties started remediation in October 2009. The Company is satisfied that the best estimate available for the Company‟s remaining portion of the environmental remediation costs for this site is $250,000 (December 31, 2010 - $260,000) with $85,000 (2010 - $140,000) presented as a current liability in the year-end financial statements.
Other than the above site, Management is not aware of any unusual or significant issues.
CRITICAL ACCOUNTING ESTIMATES
In the preparation of the consolidated financial statements, it is necessary for management to make some estimates and judgments that affect reported amounts in the financial statements and related disclosure of contingencies. Management determines these estimates using historical experience, assumptions and rationale that are believed to be reasonable in the circumstances. The Company evaluates these on an ongoing basis in order to form the judgment for the carrying value of certain assets and liabilities.
Specifically, the Company has assessed the property valuations related to the sites noted under “Environmental Issues” in this MD&A and in the notes to the financial statements (notes 25). Based on this analysis, it is management‟s judgment that the reported carrying values of these properties are reasonable.
The value of goodwill related to the Company‟s U.K. operations was reviewed by management and tested for impairment in accordance with the guidelines set out in International Accounting Standard 36. Based on this analysis, it is management‟s judgment that the reported carrying value for goodwill is not impaired.
The environmental liability (note 25) has been established based on an analysis of cost estimates related to expected activities required for active remediation for Glen Ewing Properties. It is management‟s judgment that the reported carrying value for this liability, based on discounted cash flows over five years, is a reasonable estimate of the Company‟s share of these costs given information available at this time, but acknowledges that this estimate is subject to future uncertainties.
Although these estimates, which form the basis for carrying values of reported assets, liabilities, revenues and expenses, are based on reasonable assumptions, it should be noted that actual results may differ from these estimates under different assumptions or conditions.
Annual Report 2011 13
MANAGEMENT DISCUSSION AND ANALYSIS TRANSITION TO INTERNATIONAL FINANCIAL REPORTING STANDARDS (IFRS)
In February 2008, the Accounting Standards Board of the CICA affirmed its intention to replace Canadian GAAP with IFRS. Although IFRS uses a conceptual framework similar to Canadian GAAP, differences in accounting policies and additional required disclosures will need to be addressed. The Company adopted IFRS commencing the first quarter reporting of 2011 with comparative data from 2010. This is the first annual set of financial statements being issued under IFRS.
The Company‟s IFRS transition project is completed. The project was completed in 3 phases. Phase One - Scoping and Diagnostics, Phase Two - Analysis and Development and Phase Three - Implementation and Review. Phase One - Scoping and Diagnostics: This phase consisted of a high-level assessment to identify key areas of Canadian GAAP and IFRS differences that were most likely to impact the Company. This assessment was completed by management and external advisors in the fourth quarter of 2008 and was integral in prioritizing subsequent steps. The highest impact areas identified at this time was property, plant, and equipment; provisions and contingencies; impairment; taxes; consolidation and lease accounting. Accounting policies have been selected. Phase Two – Analysis and Diagnostics: This phase involved the detailed assessment, from an accounting, reporting and business perspective, of the changes that will be caused by the conversion to IFRS. During this phase, any applicable accounting policy choices permissible under IFRS were assessed for the most appropriate application. Areas identified in Phase One were analyzed in detail to assess if any changes to policy were required and what, if any, impact this will have. During this phase, our key finance and operational staff were trained on IFRS. Management and Audit Committee members were educated regarding IFRS implications. This phase was substantially completed in the fourth quarter of 2009. IFRS education is now an ongoing activity. Phase Three – Implementation and Review: This phase involved executing the work completed in phase two by making changes to business and accounting processes and supporting information systems. It also included the review of all internal controls that may have been impacted by any of the changes. 2010 comparative data was collected for comparative disclosure which started in the first quarter of 2011.
Results of the Detailed Gap Assessment
Recognition and Measurement
The Company identified the following major areas, as outlined below, with differences between Canadian GAAP accounting policies and those applied in preparing IFRS financial statements. Accounting policy choices and IFRS 1 options selected were reviewed by the Steering Committee and Audit Committee. Impacts and accounting policy choice impacts are reflected in the annual consolidated financial statements and are documented in note 27.
14 Hammond Manufacturing Company Limited www.hammondmfg.com
MANAGEMENT DISCUSSION AND ANALYSIS Property, Plant and Equipment (“PP&E”)
Canadian GAAP requires the separation of components with different useful lives when separable and practicable, whereas IFRS, which is more explicit, requires separation based on its cost relative to the total cost of the asset. The detailed assessment showed changes required under IFRS did not have a significant impact on the consolidated financial statements. Impairments
Impairment testing of PP&E is based on a two-step approach under current Canadian GAAP when circumstances indicate that the carrying value may not be recoverable. The first step requires a comparison of the carrying amount of the asset(s) to the expected undiscounted cash flows for the asset(s). If the carrying amount is not recoverable then the second step compares the fair value of the asset(s) to the carrying value of the asset(s) to determine if there is an impairment loss. IFRS uses a one-step approach, if any indication of impairment exists, which compares the recoverable amount of the asset with the carrying value of the asset. The recoverable amount is the higher of the fair value and value-in-use which is calculated using discounted cash flows. In addition, IAS 36 Impairment of Assets requires, under certain circumstances, the reversal of previous impairments, which is not allowed under current Canadian GAAP. Goodwill impairment testing is conducted at a more granular level known as the “cash generating unit” under IFRS as compared to the testing at a “reporting unit” level for Canadian GAAP. This difference did not have a material impact for the Company. The Company did not see any material changes to the results of its impairment tests for PP&E previously performed under Canadian GAAP when it transitioned to IFRS. Foreign Currency Translation
Under Canadian GAAP, the Company separates self-sustaining operations from integrated operations. The non-monetary assets of self-sustaining operations are translated at the current rate whereas the non-monetary assets of integrated operations are translated at historic rates. Unlike Canadian GAAP, IFRS does not distinguish between the types of foreign operations (i.e. integrated vs. self-sustaining) and requires that non-monetary assets for all entities are translated at the current rate at the balance sheet date where a difference in functional currencies exists. The Company determined that the difference decreased property, plant and equipment and decreased retained earnings at transition by $287,254. During 2010 and 2011, this also created an impact to property, plant and equipment, depreciation expense, foreign exchange expense and cumulative translation adjustments.
Annual Report 2011 15
MANAGEMENT DISCUSSION AND ANALYSIS
Presentation Reclassifications
Cumulative Translation Adjustment
As elected under IFRS 1, the Company reset all cumulative translation gains and losses to zero with the offset to be recorded in opening retained earnings at the date of transition. If, subsequent to adoption, a foreign operation is disposed of, the translation differences that arose before the date of transition to IFRS shall be excluded from the gain or loss on disposal. Non-Controlling Interests
The Company has elected to early adopt, as of January 1, 2010, the CICA Handbook Section 1582, Business Combinations (“Section 1582”), Section 1601, Consolidated Financial Statements (“Section 1601”) and Section 1602, Non-Controlling Interest (“Section 1602”). These Handbook Sections are converged with IFRS and, as a result of the early adoption, there are no presentation differences at transition. Deferred Income Tax
Under Canadian GAAP, income tax assets and liabilities are classified as current and non-current, depending on the classifications of the assets or liabilities to which they relate. Under IFRS, deferred tax is not classified into current and non-current. On transition, the Company reclassified current future income tax assets/liabilities as non-current deferred tax assets/liabilities. The impact on the opening January 1, 2010 balance sheet resulted in $224,000 of current future income tax assets being reclassified to non-current liabilities deferred tax liabilities. Provisions
Unlike Canadian GAAP, IFRS requires provisions to be separated from liabilities. IAS 37 defines a provision as a liability of uncertain timing and amount. Provisions are recognized on the basis of a legal or constructive obligation arising from a past event, if there is a probable outflow of resources and the amount can be estimated reliably. Under IFRS, there can also be a lower threshold for recognition and different measurement basis. On transition, the Company must separate provisions from accounts payable and accrued liabilities either on the face of the balance sheet or in the notes. IFRS 1 Considerations
On the transition date January 1, 2010, the Company was required to convert its opening financial position to IFRS in accordance with IFRS 1. The Company was also required to restate its comparative financial statements for annual and interim periods to reflect IFRS requirements. IFRS 1 grants optional exemptions from the requirements of other IFRS where the cost of complying with them would be likely to exceed the benefits to users of financial statements. This IFRS also requires mandatory exceptions, which prohibit retrospective application of IFRS in some areas. The optional exemptions listed below are elections made by the Company. Other optional exemptions not being considered to be elected are not listed. Mandatory Exceptions:
1. Estimates – Hindsight is not used to create or revise estimates. The estimates previously made by the Company under Canadian GAAP will not be revised for application of IFRS, except where necessary, to reflect any difference in accounting policies.

16 Hammond Manufacturing Company Limited www.hammondmfg.com
MANAGEMENT DISCUSSION AND ANALYSIS 2. IAS 27 – Consolidated and Separate Financial Statements (“IAS 27”) - In accordance with IFRS 1, if a Company elects to apply IFRS 3 Business Combinations (“IFRS 3”) retrospectively, IAS 27 Consolidated and Separate Financial Statements must also be applied retrospectively. The Company elected to apply IFRS 3 and IAS 27 prospectively. Optional Exemptions Applied:
1. Business combinations – IFRS 1 provided the option to apply IFRS 3 (Revised) Business
Combinations, retrospectively or prospectively from the transition date. The retrospective basis would require restatement of all business combinations that occurred prior to the transition date. The Company elected not to retrospectively apply IFRS 3 to business combinations that occurred prior to its transition date; therefore, such business combinations were not restated. Goodwill arising on such business combinations before the transition date were not adjusted from the carrying value previously determined under Canadian GAAP as a result of applying this exemption. 2. Leases – IFRIC 4 Determining whether an Arrangement contains a Lease (“IFRIC 4”) requires the assessment of whether an arrangement contains a lease to be performed at the inception of the arrangement. A first-time adopter may, instead, choose to apply IFRIC 4 on the basis of facts and circumstances existing at the date of transition (i.e. prospective application). The Company elected to apply the optional exemption under IFRS 1.
3. Currency translation differences – Retrospective application of IFRS would require the Company to determine cumulative currency translation differences in accordance with IAS 21 The Effects of
Changes in Foreign Exchange Rates (“IAS 21”), from the date a subsidiary or equity method investee was formed or acquired. IFRS 1 permits cumulative translation gains and losses to be reset to zero at the transition date. In accordance with IFRS 1, the Company elected to reset all cumulative translation gains and losses to zero in opening retained earnings at the date of transition. Accordingly, retrospective restatement of foreign currency translation adjustments was not performed. 4. Borrowing costs – IAS 23, Borrowing Costs (“IAS 23”), requires an entity to capitalize the borrowing costs related to all qualifying assets. IFRS 1 allows an entity to choose an effective date for which the commencement date for capitalization is on or after the date of transition to IFRS or an earlier date chosen by the first –time adopter. The Company elected to choose an effective date of January 1, 2010. CONTROLS AND PROCEDURES
Disclosure controls and procedures are designed to provide reasonable assurance that all relevant information is gathered and reported to senior management on a timely basis so that appropriate decisions can be made regarding public disclosure. The purpose of internal controls over financial reporting as defined by the Canadian Securities Administrators is to provide reasonable assurance that:

Annual Report 2011 17
MANAGEMENT DISCUSSION AND ANALYSIS (i) financial statements prepared for external purposes are in accordance with the Company's
Generally Accepted Accounting Principles, (ii) transactions are recorded as necessary to permit the preparation of financial statements, and
records are maintained in reasonable detail, (iii) receipts and expenditures of the Company are made only in accordance with authorizations of
the Company's management and directors, and (iv) unauthorized acquisitions, uses or dispositions of the Company's assets that could have a
material effect on the financial statements will be prevented or detected in order to prevent material error in financial statements.
The Chief Executive Officer and the Chief Financial Officer have caused management and other employees to design, document and evaluate our disclosure controls and procedures and our internal controls over financial reporting. An evaluation of the design and operating effectiveness of the disclosure controls and internal controls over financial reporting was conducted as at December 31, 2011. The design and evaluation of internal controls was completed using the framework and criteria established in "Internal Control – Integrated Framework" issued by the Committee of Sponsoring Organizations of the Treadway Commission. Based on the evaluation, we have concluded that the Company‟s disclosure controls, procedures and our internal controls over financial reporting provide reasonable assurance that material information relating to the Company are made known to the Company by others, particularly during the period in which the annual filings are being prepared, that information required to be disclosed by the Company in its annual filings, interim filings or other reports filed or submitted by it under securities legislation is recorded, processed, summarized and reported within the time periods specified in securities legislation, and reasonable assurance regarding the reliability of financial reporting and the preparation of financial statements for external purposes in accordance with Canadian generally accepted accounting principles. RISKS AND UNCERTAINTIES
As with most businesses, the Company is subject to a number of market place, industry and economic related business risks, which could have some material impact on our operating results. These risks include: • The cyclical effects, unpredictability and volatility of market driven commodity costs, raw materials
such as copper and steel pricing and supply and demand; • A significant, unexpected change in the global demand for resources; • The variability of the Canadian dollar versus the US dollar; • Economic slowdown in the US and Canada; • Rising interest rates; • Trade restrictions; • Labour costs and labour relations; • Competition; and • Global political unrest. The Company continuously works to minimize the negative impact of these risks and strengthen its position through diversification of its core business, market channel expansion, geographic diversity of its operations and business hedging strategies. There are, however, several risks that deserve particular attention.

18 Hammond Manufacturing Company Limited www.hammondmfg.com
MANAGEMENT DISCUSSION AND ANALYSIS
Key Personnel The Company is dependent on the experience and industry knowledge of its executive officers and other key employees to execute its business plan. If the Company were to experience a substantial turnover in its leadership or other key employees, business results from operations and financial condition could be materially adversely affected. Commodity Prices An area that has had a definite effect on the Company‟s costs and earnings is the cyclical effects and unprecedented market cost pressures of copper commodity and steel pricing in the global market. Due to this unpredictability and volatility, particularly with copper pricing, the Company does not currently utilize future contracts. Strategic supply line agreements and alliances are in place with our major steel suppliers to ensure adequate supply and competitive market pricing. Foreign Exchange The Company‟s operating results are reported in Canadian dollars. A significant portion of our sales is denominated in US dollars. A change in the value of the Canadian dollar against the US dollar will impact earnings. We have created a natural hedge as this is partially offset by a corresponding change in the cost of materials purchased from the US and commodities tied to US dollar pricing. In general, a lower value for the Canadian dollar compared to the US dollar will have a beneficial impact on the Company‟s results; or, inversely, a higher value for the Canadian dollar compared to the US dollar will have a negative impact on the Company‟s profitability. The Company also has a US operating subsidiary and US dollar assets. The exchange rate between the Canadian and US dollar can vary significantly from year to year. There is a corresponding positive or negative impact to the Company‟s Statement of Earnings solely related to the foreign exchange translation of its Balance Sheet. We have partially reduced the impact of foreign exchange fluctuations through increasing our US dollar driven manufacturing output. Finally, the Company periodically institutes price increases / reductions to help offset the negative / positive impact of changes in foreign exchange and product cost increases / decreases. Interest Rates The Company has structured its debt financing to take advantage of the current lower interest rates, but is cognizant that a rise in interest rates will negatively impact the financial results of the Company. The Company continuously reviews this strategy of hedging this risk by fixing interest rates on part of its total debt. North American Economy We believe the North American economy has stabilized and we will see marginal growth in 2012. Our efforts over the next 12 months will be on projects that will reduce our costs and improve our manufacturing flexibility. We believe that being nimble as an organization will become even more important in order to respond quickly to both unexpected opportunities as well as challenges. We also believe that our growing access to a variety of markets both global and domestic through our OEM and distributor channels will help the Company expand market share during an economic recovery.
Annual Report 2011 19
MANAGEMENT DISCUSSION AND ANALYSIS
OUTLOOK FACTORS FOR 2012
We saw substantial growth in 2011, although some of this was at the expense of lower margins. The Company continues with the objective of growth and increased market share but will weigh this against achieving acceptable margins.
Our plan for the 2012 core business foresees local currency growth in the single digits. We will continue to expand our market share with new product introduction and marketing initiatives as well as continued expansion of our market share in the international market place.
Capital spending will continue to be focused on high impact projects as accommodated by cash flows.
Our primary focus continues to be on productivity and margin improvement.

20 Hammond Manufacturing Company Limited www.hammondmfg.com
MANAGEMENT’S RESPONSIBILITY FOR FINANCIAL REPORTING
The consolidated financial statements are the responsibility of the management of Hammond Manufacturing Company Limited. These statements have been prepared in accordance with International Financial Reporting Standards, using management‟s best estimates and judgments, where appropriate.
Management is responsible for the reliability and integrity of the consolidated financial statements, the notes to the consolidated financial statements and other financial information contained in the report. In the preparation of these statements, estimates are sometimes necessary because a precise determination of certain assets and liabilities is dependent on future events. Management believes such estimates have been based on careful judgment and have been properly reflected in the accompanying consolidated financial statements.
Management is responsible for the maintenance of a system of internal controls designed to provide reasonable assurance that the assets are safeguarded and that accounting systems provide timely, accurate and reliable financial information.
The Board of Directors is responsible for ensuring that management fulfills its responsibilities for financial reporting and internal control. The Board of Directors is assisted in exercising its responsibilities through the Audit Committee of the Board, which is composed of three non-management directors. The Audit Committee meets periodically with management and the auditors to satisfy itself that management‟s responsibilities are properly discharged, to review the consolidated financial statements and to recommend approval of the consolidated financial statements to the Board of Directors.
KPMG LLP, the independent auditors appointed by the shareholders, has audited the Company‟s consolidated financial statements in accordance with Canadian generally accepted auditing standards and their report follows. The independent auditors have full and unrestricted access to the Audit Committee to discuss their audit and related findings as to the integrity of the financial reporting process.
R.F. Hammond A. Stirling Chairman & CEO Secretary & CFO
Guelph, Ontario
March 30, 2012
Annual Report 2011 21
INDEPENDENT AUDITORS' REPORT
To the Shareholders of Hammond Manufacturing Company Limited We have audited the accompanying consolidated financial statements of Hammond Manufacturing Company Limited, which comprise the consolidated statements of financial position as at December 31, 2011, December 31, 2010, and January 1, 2010, the consolidated statements of comprehensive income, changes in equity and cash flows for the years ended December 31, 2011 and December 31, 2010, and notes, comprising a summary of significant accounting policies and other explanatory information. Management’s Responsibility for the Consolidated Financial Statements Management is responsible for the preparation and fair presentation of these consolidated financial statements in accordance with International Financial Reporting Standards, and for such internal control as management determines is necessary to enable the preparation of consolidated financial statements that are free from material misstatement, whether due to fraud or error. Auditors’ Responsibility Our responsibility is to express an opinion on these consolidated financial statements based on our audits. We conducted our audits in accordance with Canadian generally accepted auditing standards. Those standards require that we comply with ethical requirements and plan and perform the audit to obtain reasonable assurance about whether the consolidated financial statements are free from material misstatement. An audit involves performing procedures to obtain audit evidence about the amounts and disclosures in the consolidated financial statements. The procedures selected depend on our judgment, including the assessment of the risks of material misstatement of the consolidated financial statements, whether due to fraud or error. In making those risk assessments, we consider internal control relevant to the entity‟s preparation and fair presentation of the consolidated financial statements in order to design audit procedures that are appropriate in the circumstances, but not for the purpose of expressing an opinion on the effectiveness of the entity‟s internal control. An audit also includes evaluating the appropriateness of accounting policies used and the reasonableness of accounting estimates made by management, as well as evaluating the overall presentation of the consolidated financial statements. We believe that the audit evidence we have obtained in our audits is sufficient and appropriate to provide a basis for our audit opinion. Opinion In our opinion, the consolidated financial statements present fairly, in all material respects, the consolidated financial position of Hammond Manufacturing Company Limited as at December 31, 2011, December 31, 2010, and January 1, 2010, and its consolidated financial performance and its consolidated cash flows for the years ended December 31, 2011 and December 31, 2010 in accordance with International Financial Reporting Standards. KPMG LLP, Chartered Accountants, Licensed Public Accountants
March 8, 2012 Waterloo, Canada

22 Hammond Manufacturing Company Limited www.hammondmfg.com
HAMMOND MANUFACTURING LIMITEDConsolidated Statements of Financial Position
(in thousands of Canadian dollars)Note December 31, 2011 December 31, 2010 January 1, 2010
AssetsCurrent assets:
Cash 633$ 422$ 869$ Trade and other receivables 7 11,807 10,634 8,455 Income taxes receivable 280 234 - Inventories 8 23,013 20,583 20,386 Prepaid expenses 660 874 774
Total current assets 36,393 32,747 30,484
Non-current assets
Property, plant and equipment 9 13,953 11,164 10,682 Intangible assets 10 346 311 290 Investments in properties 11 1,044 1,044 1,044 Equity investment 12 177 828 799 Deferred tax assets 13 - - 450
Total non-current assets 15,520 13,347 13,265
Total assets 51,913$ 46,094$ 43,749$
LiabilitiesCurrent liabilities:
Bank indebtedness 17 9,370$ 5,898$ 5,953$ Trade and other payables 19 8,822 7,883 5,868 Income taxes payable - 16 350 Provisions 18 145 200 219 Current portion of long-term debt 17 1,217 1,864 1,417
Total current liabilities 19,554 15,861 13,807
Non-current liabilities
Other long-term liabilities 166 175 152 Long-term debt 17 2,140 2,024 3,536 Provisions 18 165 120 141 Deferred tax liabilities 13 420 172 49
Total non-current liabilities 2,891 2,491 3,878 Total liabilities 22,445 18,352 17,685
Equity:
Share capital 14 10,249 10,249 10,249 Contributed surplus 290 290 290 Accumulated other comprehensive loss (220) (401) - Retained earnings 19,149 17,604 15,525
Total equity 29,468 27,742 26,064
Total liabilities and equity 51,913$ 46,094$ 43,749$
(Commitments – notes 20 and 21) (Contingencies – note 25) The notes on pages 26 to 64 are an integral part of these consolidated financial statements.

Annual Report 2011 23
HAMMOND MANUFACTURING LIMITEDConsolidated Statements of Comprehensive Income(in thousands of Canadian dollars, except earnings per share)For the years ended December 31, Note 2011 2010
Net product sales $ 85,487 $ 78,587Cost of sales 62,392 56,380
Gross profit 23,095 22,207
Selling and distribution 15,711 13,746 General and administrative 4,210 4,280 Research and development 282 239 Net gain on sale of property, plant and equipment (41) (23)
Results from operating activities 2,933 3,965
Interest expense 17 (450) (409) Foreign exchange gain 101 75
Net finance costs (349) (334)
Share of loss of equity accounted investees (net of income taxes) 4,12 (129) (130)
Income before income tax 2,455 3,501
Income tax expense 6 684 1,195
Income for the year 1,771 2,306
Other comprehensive income (loss):Foreign currency translation differences for foreign operations 181 (401)
Other comprehensive income for the period, net of income tax 181 (401) Total comprehensive income for the year $ 1,952 $ 1,905
Earnings per share
Basic earnings per share 15 $ 0.16 $ 0.20Diluted earnings per share 15 $ 0.16 $ 0.20 The notes on pages 26 to 64 are an integral part of these consolidated financial statements.
24 Hammond Manufacturing Company Limited www.hammondmfg.com
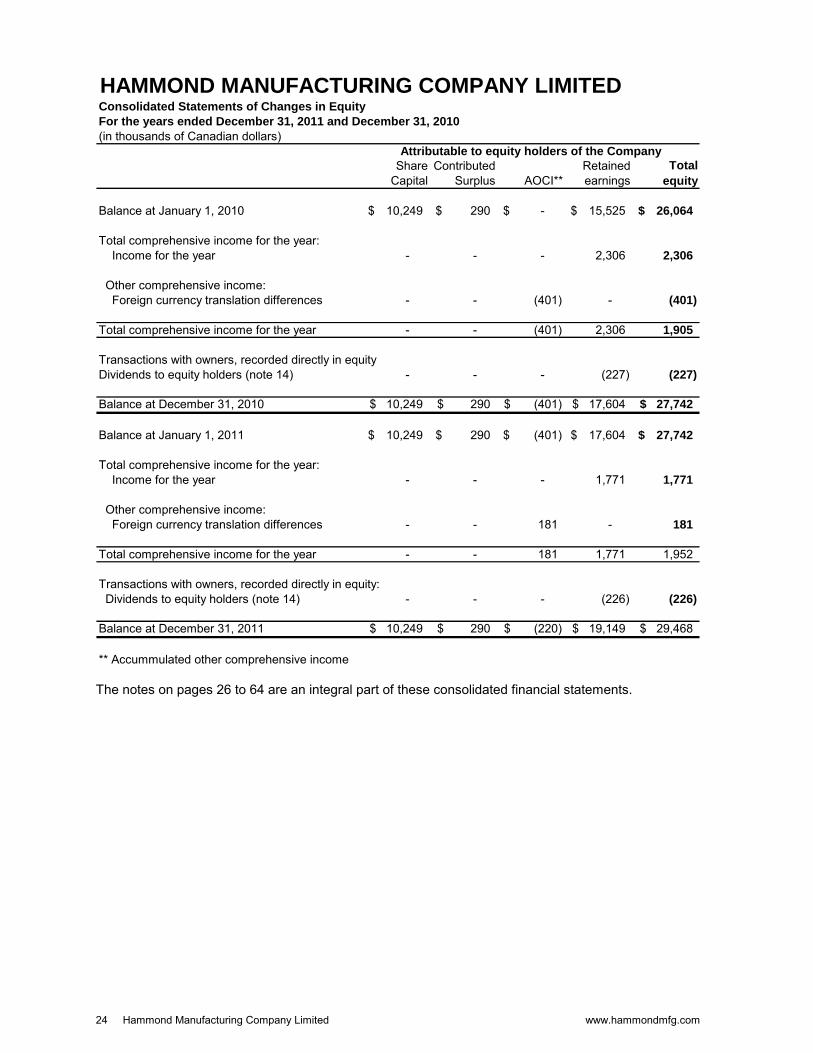
HAMMOND MANUFACTURING COMPANY LIMITEDConsolidated Statements of Changes in Equity
For the years ended December 31, 2011 and December 31, 2010
(in thousands of Canadian dollars)
Share Capital
Contributed Surplus AOCI**
Retained earnings
Total
equity
Balance at January 1, 2010 10,249$ 290$ -$ 15,525$ 26,064$
Total comprehensive income for the year: Income for the year - - - 2,306 2,306
Other comprehensive income: Foreign currency translation differences - - (401) - (401)
Total comprehensive income for the year - - (401) 2,306 1,905
Transactions with owners, recorded directly in equityDividends to equity holders (note 14) - - - (227) (227)
Balance at December 31, 2010 10,249$ 290$ (401)$ 17,604$ 27,742$
Balance at January 1, 2011 10,249$ 290$ (401)$ 17,604$ 27,742$
Total comprehensive income for the year: Income for the year - - - 1,771 1,771
Other comprehensive income: Foreign currency translation differences - - 181 - 181
Total comprehensive income for the year - - 181 1,771 1,952
Transactions with owners, recorded directly in equity: Dividends to equity holders (note 14) - - - (226) (226)
Balance at December 31, 2011 10,249$ 290$ (220)$ 19,149$ 29,468$
** Accummulated other comprehensive income
Attributable to equity holders of the Company
The notes on pages 26 to 64 are an integral part of these consolidated financial statements.

Annual Report 2011 25
HAMMOND MANUFACTURING COMPANY LIMITEDConsolidated Statements of Cash Flows
(in thousands of Canadian dollars)For the years ended December 31, 2011 2010
Cash flows from operating activities
Income for the year 1,771$ 2,306$
Adjustments for: Amortization of property, plant and equipment 2,082 2,389 Amortization of intangible assets 48 52 Interest expense 450 409 Income tax expense 684 1,195 Gain on sale of property plant and equipment (41) (23)
4,994 6,328
Change in inventories (2,339) (671) Change in trade and other receivables (1,087) (2,343) Change in prepayments 217 (110) Change in trade and other payables 923 2,136 Change in provisions and other long-term liabilities (19) (17)
Cash generated (used) from operating activities 2,689 5,323
Interest paid (450) (409) Income tax paid (495) (1,186)
Net cash generated (used) in operating activities 1,744 3,728
Cash flows from financing activities
Increase (decrease) in bank indebtedness 3,472 (41) Payment of long-term debt (1,846) (1,515) Increase of long-term debt 1,303 - Payment of dividends (226) (227)
Net cash from (used in) financing activities 2,703 (1,783)
Cash flows from investing activities
Proceeds from sales of property, plant and equipment 41 17 Intangible asset additions (77) (84) Investment in entity 651 (29) Acquisition of of property, plant and equipment (4,856) (2,189)
Net cash from (used in) investing activities (4,241) (2,285)
Net increase in cash 206 (340)
Cash at beginning of year 422 869
Foreign exchange gain (loss) on cash and cash
equivalents in a foreign currency 5 (107)
Cash at end of year 633$ 422$ The notes on pages 26 to 64 are an integral part of these consolidated financial statements.

26 Hammond Manufacturing Company Limited www.hammondmfg.com
HAMMOND MANUFACTURING COMPANY LIMITED Notes to Consolidated Financial Statements Years ended December 31, 2011 and 2010 (tabular amounts in thousands of Canadian dollars)
1. Reporting entity:
Hammond Manufacturing Company Limited (“HMCL”or the“Company”) is a public company traded on the Toronto Stock Exchange under the symbol “HMM.A” and is incorporated under the Ontario Business Corporations Act. The address of the Company‟s registered office is 394 Edinburgh Road North, Guelph, Ontario. The consolidated financial statements of the Company as at and for the year ended December 31, 2011 include the Company and its subsidiaries (together referred to as the “Group” and individually as “Group entities”) and the Group‟s interest in associates and jointly controlled entities. The Group primarily is involved in the design, manufacture and sale of electrical and electronic components. Facilities are located in Canada, the USA, the UK, Taiwan and Australia, with agents and distributors located worldwide. The Company also maintains a 40% ownership share of RITEC Enclosures Inc. (RITEC) located in Taiwan. RITEC produces plastic and die cast enclosures for sale through the Company‟s sales network and its own existing market channels.
2. Basis of preparation:
(a) Statement of compliance:
These consolidated financial statements have been prepared in accordance with International Financial Reporting Standards (IFRS). These are the Company‟s first annual IFRS consolidated financial statements in which IFRS 1 First-time Adoption of International Financial Reporting Standards has been applied. Prior to adoption of IFRS, the Company prepared its Financial statements in accordance with Canadian generally accepted accounting principles (Canadian GAAP).
An explanation of how the transition to IFRS has affected the reported financial position, financial performance and cash flows of the Company is provided in note 27. This note includes reconciliations of equity and total comprehensive income for comparative periods and of equity at the date of transition reported under previous Canadian GAAP to those reported for those periods and at the date of transition under IFRS. These consolidated financial statements should be read in conjunction with the Group‟s 2010 annual audited financial statements and in consideration of the IFRS transition disclosures and reconciliations included in note 27 to these financial statements and the additional annual disclosures included herein.
The Board of Directors approved these consolidated financial statements on March 8, 2012.
(b) Basis of measurement:
The consolidated financial statements have been prepared on the historical cost basis.
(c) Functional and presentation currency:
The consolidated financial statements are presented in Canadian dollars. The functional currency of the Group‟s entities is the currency of their primary economic environment. In individual companies, transactions in foreign currencies are recorded at the rate of exchange at the date of the transaction. Monetary assets and liabilities in foreign currencies at the reporting date are re-measured to the functional currency at the exchange rate at that date. Any resulting
Annual Report 2011 27
HAMMOND MANUFACTURING COMPANY LIMITED Notes to Consolidated Financial Statements Years ended December 31, 2011 and 2010 (tabular amounts in thousands of Canadian dollars)
2. Basis of preparation – continued: (c) Functional and presentation currency – continued:
exchange differences are taken to the income statement. Non-monetary items that are measured in terms of historical cost in a foreign currency are translated using the exchange rate at the date of the transaction. On consolidation, assets and liabilities of Group entities reported in their functional currencies are translated into the Canadian dollar, being the presentation currency, at the exchange rate on the reporting date. The income and expenses of foreign operations are translated to Canadian dollars using average exchange rates for the months during which the transactions occurred. Foreign currency translation differences are recognized in other comprehensive income which is included in the accumulated other comprehensive income account. The functional currency of the Company‟s subsidiary operations located in the USA, UK, Taiwan and Australia are the US dollar, the British Pound, Taiwan Dollar and the Australian Dollar respectively. The functional currency of the Company‟s Canadian operations is the Canadian Dollar.
(d) Use of estimates and judgments
The preparation of the consolidated financial statements in conformity with IFRS, requires management to make judgments, estimates and assumptions that affect the application of accounting policies and the reported amounts of assets, liabilities, income and expenses. Actual results may differ from these estimates. Estimates and underlying assumptions are reviewed on an ongoing basis. Revisions to accounting estimates are recognized in the period in which the estimates are revised and in any future periods affected. Critical judgments in applying accounting policies that have the most significant effect on the amounts recognized in the consolidated financial statements is included in the following notes:
Notes 9 and 10 include assumptions in the determination of the estimated useful lives of intangible assets and property, plant and equipment.
Note 11 includes the estimate of property value
Note 18 include assumptions on the required provisions for sales returns and environmental remediation.
3. Summary of significant accounting policies:
The accounting policies set out below have been applied consistently to all periods presented in these consolidated financial statements and in the preparation of the opening IFRS statement of financial position at January 1, 2010 for the purposes of the transition to IFRS, unless otherwise indicated.
28 Hammond Manufacturing Company Limited www.hammondmfg.com
HAMMOND MANUFACTURING COMPANY LIMITED Notes to Consolidated Financial Statements Years ended December 31, 2011 and 2010 (tabular amounts in thousands of Canadian dollars)
3. Summary of significant accounting policies – continued:
The accounting policies have been applied consistently by Group entities.
(a) Basis of consolidation:
The consolidated financial statements include the accounts of Hammond Manufacturing Company Limited, its wholly owned subsidiaries, Hammond Manufacturing Company Inc., Hammond Electronics Limited, Hammond Electronics PTY Ltd., Les Fabrications Hammond (Quebec) Inc., Hammond Electronics Asia Inc, and its proportionate share of Glen Ewing Properties, an unincorporated co-tenancy (50%). All significant intercompany balances and transactions have been eliminated on consolidation. The consolidated financial statements include the Group‟s investment in 1159714 Ontario Inc. (which was dissolved December 30, 2011) and RITEC, which are accounted for using the equity method (note 3(g)). The Company has elected not to retrospectively apply IFRS 3 to business combinations that occurred prior to January 1, 2010; therefore, such business combinations have not been restated.
(b) Revenue recognition:
The Company recognizes revenue on product sales and services at the time the products are shipped or services rendered to customers, when the customer takes ownership and assumes risk of loss, collection of the relevant receivable is probable, persuasive evidence of an arrangement exists and the sales price is fixed or determinable. A provision for sales returns is recognized when the underlying products or services are sold. The provision is based on historical returns data and a weighting of all possible outcomes against their associated probabilities.
(c) Inventories:
Inventories are valued at the lower of cost, determined on a first-in, first-out basis and net realizable value, and includes expenditures incurred in acquiring the inventories, production or conversion costs and other costs incurred in bringing them to their existing location and condition. In the case of manufactured inventories and work in progress, costs include an appropriate share of production overheads based on normal operating capacity. Net realizable value is the estimated selling price in the ordinary course of business, less the estimated costs of completion and selling expenses. When circumstances that previously gave rise to an inventory write down no longer exist, the previous impairment is reversed.
(d) Investment in properties:
Investment property is property held either to earn rental income or for capital appreciation or for both, but not for sale in the ordinary course of business, use in the production or supply of goods or services or for administrative purposes. The Group measures its investment property, being the land held by Glen Ewing Properties, at historical cost.
Annual Report 2011 29
HAMMOND MANUFACTURING COMPANY LIMITED Notes to Consolidated Financial Statements Years ended December 31, 2011 and 2010 (tabular amounts in thousands of Canadian dollars)
3. Summary of significant accounting policies – continued:
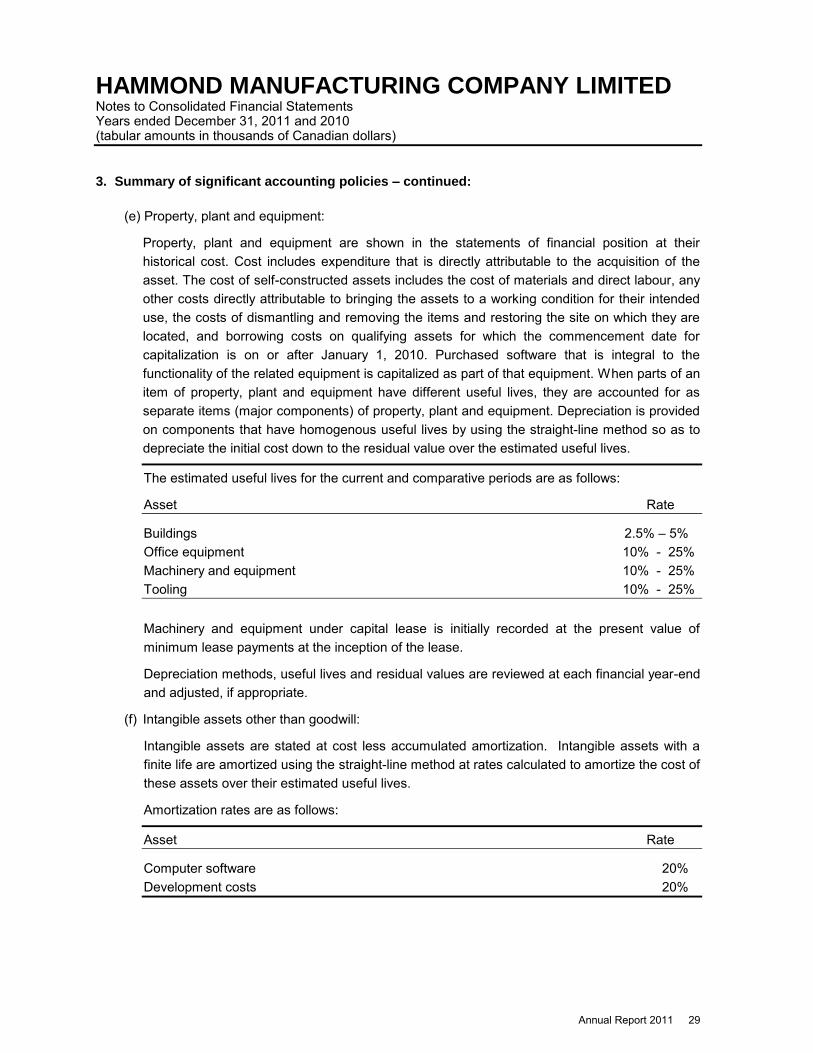
(e) Property, plant and equipment:
Property, plant and equipment are shown in the statements of financial position at their historical cost. Cost includes expenditure that is directly attributable to the acquisition of the asset. The cost of self-constructed assets includes the cost of materials and direct labour, any other costs directly attributable to bringing the assets to a working condition for their intended use, the costs of dismantling and removing the items and restoring the site on which they are located, and borrowing costs on qualifying assets for which the commencement date for capitalization is on or after January 1, 2010. Purchased software that is integral to the functionality of the related equipment is capitalized as part of that equipment. When parts of an item of property, plant and equipment have different useful lives, they are accounted for as separate items (major components) of property, plant and equipment. Depreciation is provided on components that have homogenous useful lives by using the straight-line method so as to depreciate the initial cost down to the residual value over the estimated useful lives.
The estimated useful lives for the current and comparative periods are as follows:
Asset Rate
Buildings 2.5% – 5% Office equipment 10% - 25% Machinery and equipment 10% - 25% Tooling 10% - 25% Machinery and equipment under capital lease is initially recorded at the present value of minimum lease payments at the inception of the lease.
Depreciation methods, useful lives and residual values are reviewed at each financial year-end and adjusted, if appropriate.
(f) Intangible assets other than goodwill:
Intangible assets are stated at cost less accumulated amortization. Intangible assets with a finite life are amortized using the straight-line method at rates calculated to amortize the cost of these assets over their estimated useful lives.
Amortization rates are as follows:
Asset Rate
Computer software 20% Development costs 20%

30 Hammond Manufacturing Company Limited www.hammondmfg.com
HAMMOND MANUFACTURING COMPANY LIMITED Notes to Consolidated Financial Statements Years ended December 31, 2011 and 2010 (tabular amounts in thousands of Canadian dollars)
3. Summary of significant accounting policies – continued:
(g) Investments measured using equity method:
The Company uses the equity method as a basis of accounting for investments in companies over which it exercises significant influence or joint control. Under the equity method, the Company records these investments initially at cost and the carrying values are adjusted thereafter to include the Company's pro rata share of post-acquisition earnings of the investees, computed by the consolidation method. The adjustments are included in the determination of net income by the Company, and the investment accounts of the Company are also increased or decreased to reflect the Company's share of capital transactions (including amounts recognized in other comprehensive income). Profit distributions received or receivable from investees reduce the carrying values of the investments. Unrealized intercompany gains or losses are eliminated.
The Company‟s determination of significant influence is based on consideration of voting interest in the investees along with other indicators such as representation on the board of directors, participation in policy-making processes, material intercompany transactions, interchange of managerial personnel or provision of technical information. The Company uses the equity method to account for its interest in RITEC (40% share) and 1159714 Ontario Inc. (50% share).
(h) Income taxes:
The Company uses the asset and liability method of accounting for income taxes. Under the asset and liability method, deferred income tax assets and liabilities are recognized for the future tax consequences attributable to differences between the financial statement carrying amounts of existing assets and liabilities and their respective tax bases. Deferred tax assets and liabilities are measured using enacted or substantively enacted tax rates expected to apply to taxable income in the years in which those temporary differences are expected to be recovered or settled. The effect on deferred tax assets and liabilities of a change in tax rates is recognized in income in the period that includes the date of enactment or substantive enactment. A deferred tax asset is recognized for unused tax losses, tax credits and deductible temporary differences, to the extent that it is probable that future taxable profits will be available against which they can be utilized. Deferred tax assets are reviewed at each reporting date and are reduced to the extent that it is no longer probable that the related tax benefit will be realized.
(i) Goodwill:
Acquisitions on or after January 1, 2010, are accounted for using the acquisition method required by IFRS 3. Goodwill is the residual amount that results when the purchase price of an acquired business exceeds the sum of the amount allocated to the identifiable assets acquired, less liabilities assumed based on their fair values. Goodwill is allocated as of the date of the
Annual Report 2011 31
HAMMOND MANUFACTURING COMPANY LIMITED Notes to Consolidated Financial Statements Years ended December 31, 2011 and 2010 (tabular amounts in thousands of Canadian dollars)
3. Summary of significant accounting policies – continued: (i) Goodwill - continued:
business combination to the Company‟s cash generating units that are expected to benefit from the synergies of the business combination. As part of its transition to IFRS, the Company elected to restate only those business combinations that occurred on or after January 1, 2010. In respect of acquisitions prior to January 1, 2010, goodwill represents the amounts recognized under previous Canadian GAAP.
Goodwill is tested for impairment at least annually and upon the occurrence of an indication of impairment. The impairment tests are performed at the cash generating unit (CGU) level. The Group defines it CGUs based on the way it monitors and derives economic benefits from the acquired goodwill and intangibles. The impairment tests are performed by comparing the carrying value of the assets of these CGUs with the greater of its value in use and its fair value less costs to sell. The value in use is based on their future projected cash flows discounted to the present value at an appropriate pre-tax discount rate. Usually, the cash flows correspond to estimates made by Group Management in financial and strategic business plans covering a period of five years. They are then projected beyond 5 years using a steady or declining growth rate given that the Group businesses are of a long-term nature. The discount rate used approximated the Company‟s weighted average cost of capital. The business risk is included in the determination of the cash flows. Both the cash flows and the discount rates exclude inflation. An impairment loss in respect of goodwill is never subsequently reversed. The group completed its annual impairment test at December 31, 2011 and December 31, 2010 as well as an impairment test on transition to IFRS, and concluded there was no impairment.
(j) Provisions:
Provisions may include liabilities of uncertain timing or amounts that arise from environmental, litigation, commercial or other risks. Provisions are recognized when a legal or constructive obligation exists stemming from a past event and when the future cash outflows can be reliably estimated. Environmental provisions consider the present value of the anticipated clean up costs. A discounted rate of 6.0% was utilized.
(k) Earnings per share:
Basic earnings per share are computed by dividing net earnings by the weighted average shares outstanding during the reporting period. Diluted earnings per share are computed similar to basic earnings per share except that the weighted average shares outstanding are increased to include additional shares from the assumed exercise of stock options, if dilutive. The number of additional shares is calculated by assuming that outstanding stock options were exercised and that the proceeds from such exercises were used to acquire shares of common stock at the average market price during the reporting period.

32 Hammond Manufacturing Company Limited www.hammondmfg.com
HAMMOND MANUFACTURING COMPANY LIMITED Notes to Consolidated Financial Statements Years ended December 31, 2011 and 2010 (tabular amounts in thousands of Canadian dollars)
3. Summary of significant accounting policies – continued:
(l) Impairment:
(i) Financial assets (including receivables):
A financial asset not carried at fair value through profit or loss is assessed at each reporting date to determine whether there is objective evidence that it is impaired. A financial asset is impaired if objective evidence indicates that a loss event has occurred after the initial recognition of the asset, and that the loss event had a negative effect on the estimated future cash flows of that asset that can be estimated reliably.
Objective evidence that financial assets (including equity securities) are impaired can include default or delinquency by a debtor, restructuring of an amount due to the Group on terms that the Group would not consider otherwise, indications that a debtor or issuer will enter bankruptcy, or the disappearance of an active market for a security. In addition, for an investment in an equity security, a significant or prolonged decline in its fair value below its cost is objective evidence of impairment.
The Group considers evidence of impairment for receivables at both a specific asset and collective level. All individually significant receivables are assessed for specific impairment. All individually significant receivables found not to be specifically impaired are then collectively assessed for any impairment that has been incurred but not yet identified. Receivables that are not individually significant are collectively assessed for impairment by grouping together receivables with similar risk characteristics.
In assessing collective impairment the Group uses historical trends of the probability of default, timing of recoveries and the amount of loss incurred, adjusted for management‟s judgment as to whether current economic and credit conditions are such that the actual losses are likely to be greater or less than suggested by historical trends.
An impairment loss in respect of a financial asset measured at amortized cost is calculated as the difference between its carrying amount and the present value of the estimated future cash flows discounted at the asset‟s original effective interest rate. Losses are recognized in profit or loss and reflected in an allowance account against receivables. Interest on the impaired asset continues to be recognized through the unwinding of the discount. When a subsequent event causes the amount of impairment loss to decrease, the decrease in impairment loss is reversed through profit or loss.
(ii) Non-financial assets:
The carrying amounts of the Group‟s non-financial assets are reviewed at each reporting date to determine whether there is any indication of impairment. If any such indication exists, then the asset‟s recoverable amount is estimated. For goodwill, and intangible assets that have indefinite useful lives or that are not yet available for use, the recoverable amount is estimated each year at the same time.
Annual Report 2011 33
HAMMOND MANUFACTURING COMPANY LIMITED Notes to Consolidated Financial Statements Years ended December 31, 2011 and 2010 (tabular amounts in thousands of Canadian dollars)
3. Summary of significant accounting policies – continued: (l) Impairment - continued:
The recoverable amount of an asset or CGU is the greater of its value in use and its fair value less costs to sell. In assessing value in use, the estimated future cash flows are discounted to their present value using a pre-tax discount rate that reflects current market assessments of the time value of money and the risks specific to the asset. For the purpose of impairment testing, assets that cannot be tested individually are grouped together into the smallest group of assets that generates cash inflows from continuing use that are largely independent of the cash inflows of other assets or groups of assets. For the purposes of goodwill impairment testing, goodwill acquired in a business combination is allocated to the CGU, or the group of CGUs, that is expected to benefit from the synergies of the combination. This allocation is subject to an operating segment ceiling test and reflects the lowest level at which that goodwill is monitored for internal reporting purposes.
The Group‟s corporate assets do not generate separate cash inflows. If there is an indication that a corporate asset may be impaired, then the recoverable amount is determined for the CGU to which the corporate asset belongs.
An impairment loss is recognized if the carrying amount of an asset or its CGU exceeds its estimated recoverable amount. Impairment losses are recognized in profit or loss. Impairment losses recognized in respect of CGUs are allocated first to reduce the carrying amount of any goodwill allocated to the units, and then to reduce the carrying amounts of the other assets in the unit (group of units) on a pro rata basis.
An impairment loss in respect of goodwill is not reversed. In respect of other assets, impairment losses recognized in prior periods are assessed at each reporting date for any indications that the loss has decreased or no longer exists. An impairment loss is reversed if there has been a change in the estimates used to determine the recoverable amount. An impairment loss is reversed only to the extent that the asset‟s carrying amount does not exceed the carrying amount that would have been determined, net of depreciation or amortization, if no impairment loss had been recognized.
Goodwill that forms part of the carrying amount of an investment in an associate is not recognized separately, and therefore is not tested for impairment separately. Instead, the entire amount of the investment in an associate is tested for impairment as a single asset when there is objective evidence that the investment in an associate may be impaired.
(m) Financial instruments:
The Company aggregates its financial instruments into classes based on their nature and characteristics. The Group has classified its financial instruments as follows:
Cash and cash equivalents are classified as loans and receivables
Trade and other receivables are classified as loans and receivables
34 Hammond Manufacturing Company Limited www.hammondmfg.com
HAMMOND MANUFACTURING COMPANY LIMITED Notes to Consolidated Financial Statements Years ended December 31, 2011 and 2010 (tabular amounts in thousands of Canadian dollars)
3. Summary of significant accounting policies – continued: (m) Financial instruments - continued:
Bank indebtedness, trade and other payables and long-term debt are classified as other liabilities.
(n) Financial assets and financial liabilities:
All financial assets and financial liabilities are initially recognized at fair value plus directly attributable transaction costs, unless the transaction costs relate to financial instruments classified as fair value through profit and loss, in which case they are expensed immediately. Subsequent measurement is determined based on initial classification.
The Group uses trade date accounting for regular-way purchases and sales of financial assets.
(i) Loans and receivables:
Loans and receivables are non-derivative financial assets with fixed or determinable payments that are not quoted in an active market. This category includes cash and cash equivalents, trade and other receivables. Subsequent to initial measurement, loans and receivables are carried at amortized cost using the effective interest rate method less appropriate allowances for doubtful receivables. Allowance for doubtful receivables represent the Group‟s estimates of losses that could arise from the failure or inability of customers to make payments when due. Loans and receivables are further classified as current and non-current depending whether these will be realized within twelve months after the balance sheet date or beyond.
(ii) Other liabilities:
This category includes bank indebtedness, accounts payable and accrued liabilities and long-term debt. Subsequent to initial measurement, other liabilities are carried at amortized cost using the effective interest rate method.
(o) Employee Benefits:
(i) Defined contribution plans:
A defined contribution plan is a post-employment benefit plan under which an entity pays fixed contributions into a separate entity and will have no legal or constructive obligation to pay further amounts. Obligations for contributions to defined contribution pension plans are recognized as an employee benefit expense in the periods during which services are rendered by the employees. Prepaid contributions are recognized as an asset to the extent that a cash refund or a reduction in future payments is available. Contributions to a defined contribution plan which are due more than 12 months after the end of the period in which the employees render the service, are discounted to their present value.
(ii) Other long-term employee benefits:
The Group‟s net obligation in respect of long-term employee benefits, other than pension plans, is the amount of future benefit that employees have earned in return for their service in

Annual Report 2011 35
HAMMOND MANUFACTURING COMPANY LIMITED Notes to Consolidated Financial Statements Years ended December 31, 2011 and 2010 (tabular amounts in thousands of Canadian dollars)
3. Summary of significant accounting policies – continued: (ii) Other long-term employee benefits - continued:
the current and prior periods; that benefit is discounted to determine its present value and the fair value of any related assets is deducted. Any actuarial gains and losses are recognized in profit or loss in the period in which they arise.
(iii) Termination benefits:
Termination benefits are recognized as an expense when the Group is committed demonstrably, without realistic possibility of withdrawal, to a formal detailed plan to either terminate employment before the normal retirement date, or to provide termination benefits as a result of an offer made to encourage voluntary redundancy. Termination benefits for voluntary redundancies are recognized as an expense if the Group has made an offer of voluntary redundancy, it is probable that the offer will be accepted, and the number of acceptances can be estimated reliably. If benefits are payable more than 12 months after the reporting period, then they are discounted to their present value.
(iv) Short-term employee benefits:
Short-term employee benefit obligations are measured on an undiscounted basis and are expensed as the related service is provided. A liability is recognized for the amount expected to be paid under short-term cash bonus or profit-sharing plans if the Group has a present legal or constructive obligation to pay this amount as a result of past service provided by the employee, and the obligation can be estimated reliably.
(v) Share-based payment transactions:
The grant date fair value of share-based payment awards granted to employees is recognized as an employee expense, with a corresponding increase in contributed surplus in equity, over the period that the employees unconditionally become entitled to the awards. The amount recognized as an expense is adjusted to reflect the number of awards for which the related service and non-market vesting conditions are expected to be met, such that the amount ultimately recognized as an expense is based on the number of awards that do meet the related service and non-market performance conditions at the vesting date. For share-based payment awards with non-vesting conditions, the grant date fair value of the share-based payment is measured to reflect such conditions and there is no true up for differences between expected and actual outcomes. Share-based payment arrangements in which the Group receives goods or services as consideration for its own equity instruments are accounted for as equity-settled share-based payment transactions, regardless of how the equity instruments are obtained by the Group.
(p) Segment reporting:
The continuing operations of the Company are in one operating segment, electrical and electronic components.

36 Hammond Manufacturing Company Limited www.hammondmfg.com
HAMMOND MANUFACTURING COMPANY LIMITED Notes to Consolidated Financial Statements Years ended December 31, 2011 and 2010 (tabular amounts in thousands of Canadian dollars)
3. Summary of significant accounting policies – continued:
(q) New standards and interpretations not yet adopted:
A number of new standards, and amendments to standards and interpretations, are not yet effective for the year ended December 31, 2011, and have not been applied in preparing these consolidated financial statements. None of these is expected to have a significant effect on the consolidated financial statements of the Group, except for IFRS 9 Financial Instruments and IFRS 12 Disclosure of Interests in Other Entities which become mandatory for the Group‟s 2013 consolidated financial statements and are expected to impact the classification and measurement of financial assets and the amount of disclosure relating to associates. The extent of the impact has not been determined.
4. Share of loss of equity accounted investees (net of income taxes):
For the years ended December 31, 2011 2010 Equity investments:
RITEC profit held in inventory adjustment $ (12) $ (84) Earnings from 40% investment in RITEC - 32 (12) (52) Share of net income (loss) from 50% investment in 1159714 Ontario Inc. - (3) Share of expenses from 50% co-tenancy in Glen Ewing Properties (117) (75)
Share of loss of equity accounted investees (net of income taxes) $ (129) $ (130)
5. Personnel expenses:
For years ended December 31, 2011 2010Wages and Salaries $ 27,034 $ 23,917 Health benefit plans 669 662Canadian Pension Plan (CPP) and EI remittances 757 649Contributions to defined contribution plans 3,525 3,217Employee share ownership plan - 60
$ 31,985 $ 28,505
For years ended December 31, 2011 2010Cost of sales $ 23,210 $ 20,178 Selling and distribution 6,019 5,537General and administrative 2,555 2,616Research and development expenses 201 174
$ 31,985 $ 28,505

Annual Report 2011 37
HAMMOND MANUFACTURING COMPANY LIMITED Notes to Consolidated Financial Statements Years ended December 31, 2011 and 2010 (tabular amounts in thousands of Canadian dollars)
6. Income Tax expense:
Income tax expense
2011 2010
Current tax expense:Current period $ 334 $ 631 Adjustment for prior periods 102 (10)
436 621
Deferred tax expense:
Origination and reversal of temporary differences 242 621 Reduction in tax rate 6 (47)
248 574
Total income tax expense $ 684 $ 1,195
2011 2011 2010 2010
Income for the year $ 1,771 $ 2,306 Total income tax expense 684 1,195 Profit excluding income tax $ 2,455 $ 3,501
Income tax using the Company‟s domestic tax rate 39.75% 976 41.00% 1,435 Reduced rate for active business and manufacturing and processing (6.68%) (164) (6.34%) (222)Effect of tax rates in foreign jurisdictions (5.86%) (144) (0.63%) (22)Reduction in tax rate 0.24% 6 (1.35%) (47)Non-deductible expenses 0.77% 19 0.48% 17 Other (0.36%) (9) 0.97% 34
27.86% $ 684 34.13% $ 1,195
7. Trade and other receivables:
December 31, 2011 December 31, 2010 January 1, 2010
Trade receivables $ 11,355 $ 10,205 $ 8,405Employee receivables 15 18 15 Other receivables 559 628 199
11,929 10,851 8,619
Allowance for doubtful accounts (122) (217) (164) Accounts receivable $ 11,807 $ 10,634 $ 8,455
The Group‟s exposure to credit and currency risks, and impairment losses related to trade and other receivables is disclosed in note 23.
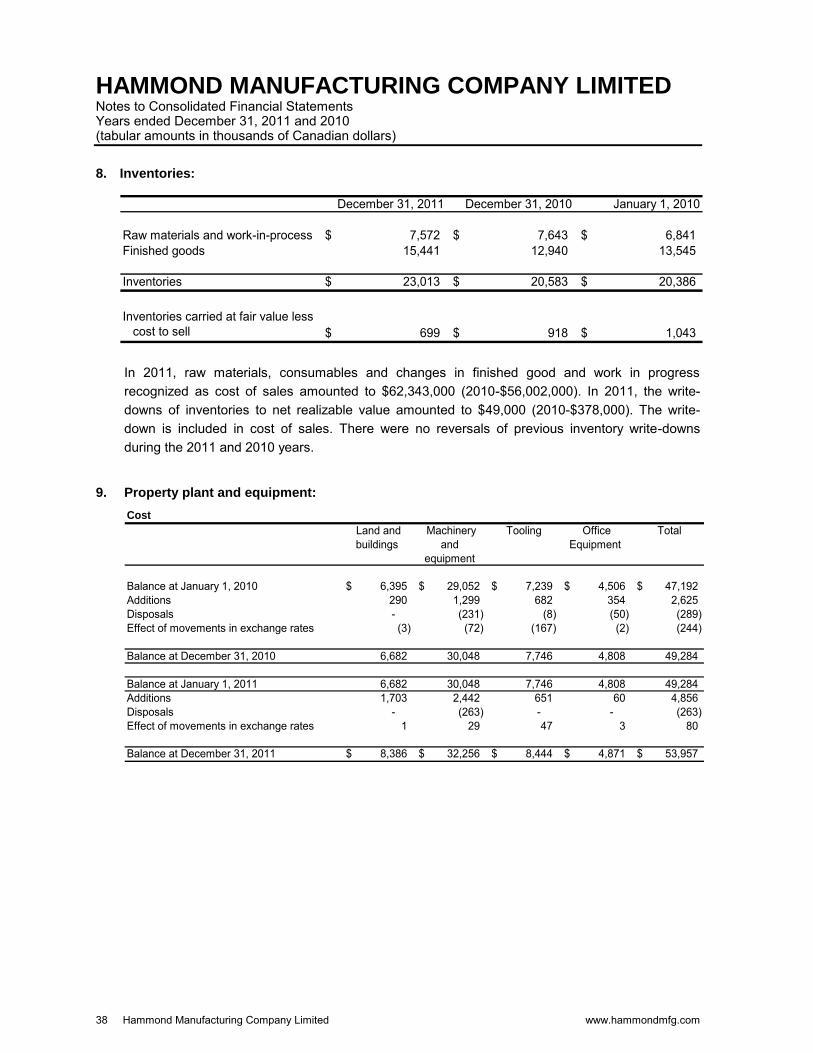
38 Hammond Manufacturing Company Limited www.hammondmfg.com
HAMMOND MANUFACTURING COMPANY LIMITED Notes to Consolidated Financial Statements Years ended December 31, 2011 and 2010 (tabular amounts in thousands of Canadian dollars)
8. Inventories:
December 31, 2011 December 31, 2010 January 1, 2010
Raw materials and work-in-process 7,572$ 7,643$ 6,841$ Finished goods 15,441 12,940 13,545
Inventories 23,013$ 20,583$ 20,386$
Inventories carried at fair value less cost to sell 699$ 918$ 1,043$
In 2011, raw materials, consumables and changes in finished good and work in progress recognized as cost of sales amounted to $62,343,000 (2010-$56,002,000). In 2011, the write-downs of inventories to net realizable value amounted to $49,000 (2010-$378,000). The write-down is included in cost of sales. There were no reversals of previous inventory write-downs during the 2011 and 2010 years.
9. Property plant and equipment:
Cost
Land and buildings
Machinery and
equipment
Tooling Office Equipment
Total
Balance at January 1, 2010 6,395$ 29,052$ 7,239$ 4,506$ 47,192$ Additions 290 1,299 682 354 2,625 Disposals - (231) (8) (50) (289) Effect of movements in exchange rates (3) (72) (167) (2) (244)
Balance at December 31, 2010 6,682 30,048 7,746 4,808 49,284
Balance at January 1, 2011 6,682 30,048 7,746 4,808 49,284 Additions 1,703 2,442 651 60 4,856 Disposals - (263) - - (263) Effect of movements in exchange rates 1 29 47 3 80
Balance at December 31, 2011 8,386$ 32,256$ 8,444$ 4,871$ 53,957$
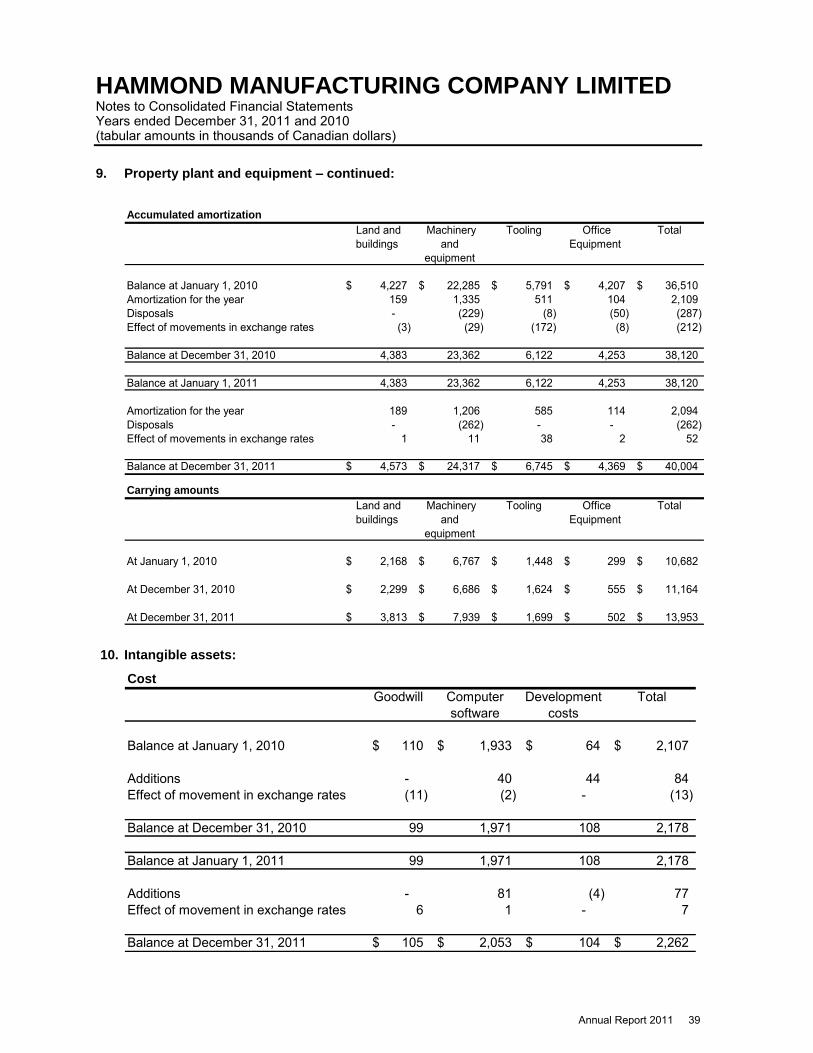
Annual Report 2011 39
HAMMOND MANUFACTURING COMPANY LIMITED Notes to Consolidated Financial Statements Years ended December 31, 2011 and 2010 (tabular amounts in thousands of Canadian dollars)
9. Property plant and equipment – continued:
Accumulated amortization
Land and buildings
Machinery and
equipment
Tooling Office Equipment
Total
Balance at January 1, 2010 4,227$ 22,285$ 5,791$ 4,207$ 36,510$ Amortization for the year 159 1,335 511 104 2,109 Disposals - (229) (8) (50) (287) Effect of movements in exchange rates (3) (29) (172) (8) (212)
Balance at December 31, 2010 4,383 23,362 6,122 4,253 38,120
Balance at January 1, 2011 4,383 23,362 6,122 4,253 38,120
Amortization for the year 189 1,206 585 114 2,094 Disposals - (262) - - (262) Effect of movements in exchange rates 1 11 38 2 52
Balance at December 31, 2011 4,573$ 24,317$ 6,745$ 4,369$ 40,004$
Carrying amounts
Land and buildings
Machinery and
equipment
Tooling Office Equipment
Total
At January 1, 2010 2,168$ 6,767$ 1,448$ 299$ 10,682$
At December 31, 2010 2,299$ 6,686$ 1,624$ 555$ 11,164$
At December 31, 2011 3,813$ 7,939$ 1,699$ 502$ 13,953$
10. Intangible assets:
Cost
Goodwill Computer software
Development costs
Total
Balance at January 1, 2010 110$ 1,933$ 64$ 2,107$
Additions - 40 44 84 Effect of movement in exchange rates (11) (2) - (13)
Balance at December 31, 2010 99 1,971 108 2,178
Balance at January 1, 2011 99 1,971 108 2,178
Additions - 81 (4) 77 Effect of movement in exchange rates 6 1 - 7
Balance at December 31, 2011 105$ 2,053$ 104$ 2,262$

40 Hammond Manufacturing Company Limited www.hammondmfg.com
HAMMOND MANUFACTURING COMPANY LIMITED Notes to Consolidated Financial Statements Years ended December 31, 2011 and 2010 (tabular amounts in thousands of Canadian dollars)
10. Intangible assets – continued:
Amortization and impairment losses
Goodwill Computer software
Development costs
Total
Balance at January 1, 2010 -$ 1,812$ 5$ 1,817$
Amortization for the year - 38 14 52 Effect of movement in exchange rates - (2) - (2)
Balance at December 31, 2010 - 1,848 19 1,867
Balance at January 1, 2011 - 1,848 19 1,867
Amortization for the year - 27 21 48 Effect of movement in exchange rates - 1 - 1
Balance at December 31/11 -$ 1,876$ 40$ 1,916$
Carrying amounts
Goodwill Computer software
Development costs
Total
At January 1, 2010 110$ 121$ 59$ 290$
At December 31, 2010 99$ 123$ 89$ 311$
At December 31, 2011 105$ 177$ 64$ 346$
All the intangible assets have been externally acquired.
Impairment testing for cash-generating units:
The Company has defined its cash generating units as each individual legal entity, due to the fact that each location is largely independent of the other entities and are ultimately responsible for sales generated in their markets. The Company monitors the performance of each legal entity through the use of profitability analysis based on the most recent business plan in place as of December 31, 2011.
Impairment testing for cash-generating units containing goodwill.
The Company performed an impairment test on the goodwill of our UK entity using the value in use method, under which a 5-year present value cash flow projection was completed using the Company‟s weighted average pre-tax cost of capital of 6.5%. The cash flow model also incorporated growth rates in the range of 3% – 5% depending on location and the facility‟s

Annual Report 2011 41
HAMMOND MANUFACTURING COMPANY LIMITED Notes to Consolidated Financial Statements Years ended December 31, 2011 and 2010 (tabular amounts in thousands of Canadian dollars)
10. Intangible assets – continued: Impairment testing for cash-generating units containing goodwill – continued:
operating history. This was then compared to the carrying value of the facility‟s assets to determine if there was impairment.
IFRS 1 requires entities to test goodwill for impairment upon transition to IFRS. Accordingly, effective January 1, 2010, December 31, 2010 and December 31, 2011, the assets, including goodwill of $105,000, of the company‟s wholly owned subsidiary, Hammond Electronics Limited, were tested and no impairment was found.
11. Investment property:
The group has a 50% ownership of a property in Georgetown, Ontario (referred to as the Glen Ewing property). It is a vacant plot of land and currently under environmental remediation. The property value represents the actual historical cost of the property from the mid 1990‟s. Management has reviewed the property and local market conditions as well as weighted the environmental condition of the property in estimating the property‟s fair value. Management estimates its interest in the property‟s fair market value to be approximately $1,250,000. This estimate is unchanged from December 31, 2010 and January 1, 2010. No independent valuation has been performed. The property is currently vacant and no income is being derived from it. The Company‟s direct operating expenses in 2011 related to the property were $117,000.
12. Equity investment:
1159714 Ontario Inc. RITEC Enclosures Inc. Total
Ownership 50% 40%
January 1, 2010 $ 654 $ 145 $ 799
Equity in earnings (3) 32 29
December 31, 2010 651 177 828
Return of capital (651) - (651)
December 31, 2011 $ - $ 177 $ 177
The group had a 50% ownership of 1159714 Ontario Inc. Its opening balance in 2010 represents the equity left from this entity which was a loan receivable. The entity was dissolved on December 30, 2011 and proceeds dispersed to the shareholders.

42 Hammond Manufacturing Company Limited www.hammondmfg.com
HAMMOND MANUFACTURING COMPANY LIMITED Notes to Consolidated Financial Statements Years ended December 31, 2011 and 2010 (tabular amounts in thousands of Canadian dollars)
12. Equity investment:
Summarized financial information December 31, 20101159714 Ontario Inc. RITEC Enclosures Inc.
Assets $ 1,308 $ 877
Liabilities - 615
Revenues - 2,497
Profit (loss) $ (6) $ 82
Summarized financial information December 31, 20111159714 Ontario Inc. RITEC Enclosures Inc.
Assets $ - $ 999
Liabilities - 654
Revenues - 1,937
Profit (loss) $ - $ -
13. Deferred tax assets and liabilities:
Unrecognized deferred tax liabilities:
At December 31, 2011, temporary differences of $7,001,823 (2010-$5,973,898) related to investments in subsidiaries were not recognized because the Company controls whether the liability will be incurred and it is satisfied that it will not be incurred in the foreseeable future.
Recognized deferred tax liabilities:
Deferred tax assets and liabilities are attributable to the following:
2011 2010 2011 2010
Property, plant and equipment $ - $ - $ 1,025 $ 824 Intangible assets (40) (43) - Investment property (8) (8) - Inventories (235) (222) - Loans and borrowings (145) (197) - Employee benefits - (26) Provisions (100) (109) - - Scientific research & experimental development (20) - - 21 Tax loss carry-forwards (57) (68) - - Tax (assets) liabilities (605) (673) 1,025 845 Set off of tax 605 673 (605) (673)Net tax (assets) liabilities $ - $ - $ 420 $ 172
Assets Liabilities
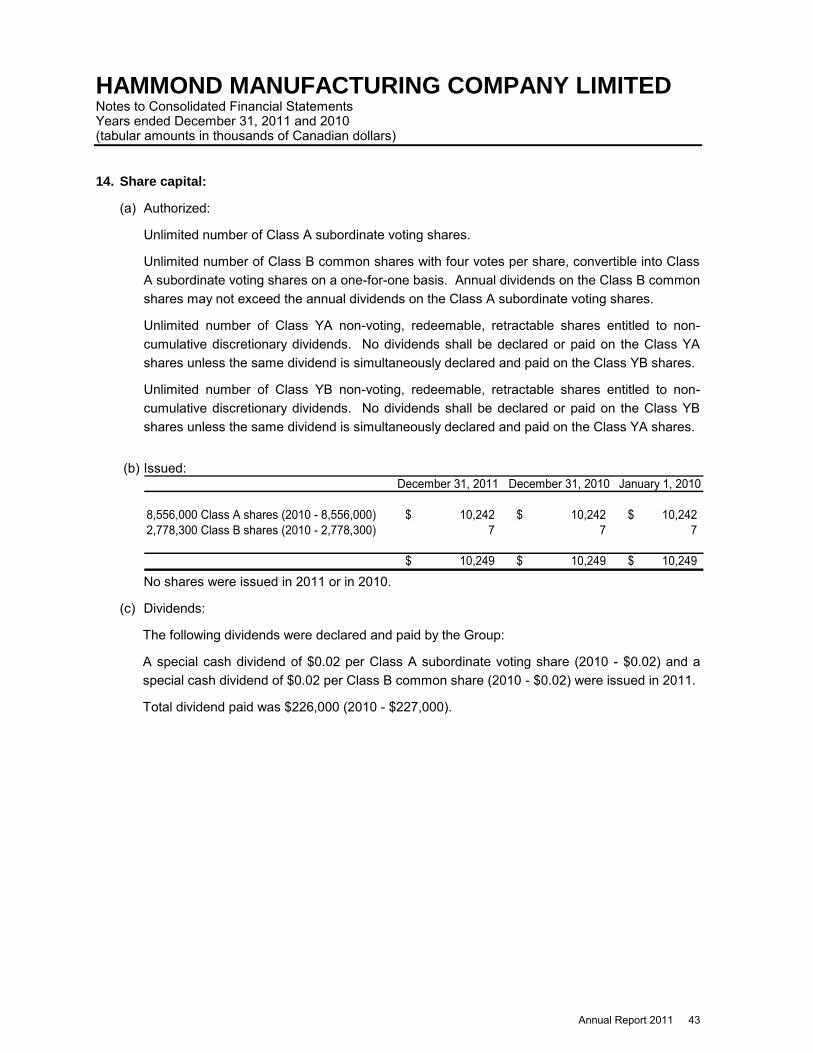
Annual Report 2011 43
HAMMOND MANUFACTURING COMPANY LIMITED Notes to Consolidated Financial Statements Years ended December 31, 2011 and 2010 (tabular amounts in thousands of Canadian dollars)
14. Share capital:
(a) Authorized:
Unlimited number of Class A subordinate voting shares.
Unlimited number of Class B common shares with four votes per share, convertible into Class A subordinate voting shares on a one-for-one basis. Annual dividends on the Class B common shares may not exceed the annual dividends on the Class A subordinate voting shares.
Unlimited number of Class YA non-voting, redeemable, retractable shares entitled to non-cumulative discretionary dividends. No dividends shall be declared or paid on the Class YA shares unless the same dividend is simultaneously declared and paid on the Class YB shares.
Unlimited number of Class YB non-voting, redeemable, retractable shares entitled to non-cumulative discretionary dividends. No dividends shall be declared or paid on the Class YB shares unless the same dividend is simultaneously declared and paid on the Class YA shares.
(b) Issued: December 31, 2011 December 31, 2010 January 1, 2010
8,556,000 Class A shares (2010 - 8,556,000) 10,242$ 10,242$ 10,242$ 2,778,300 Class B shares (2010 - 2,778,300) 7 7 7
10,249$ 10,249$ 10,249$
No shares were issued in 2011 or in 2010.
(c) Dividends:
The following dividends were declared and paid by the Group:
A special cash dividend of $0.02 per Class A subordinate voting share (2010 - $0.02) and a special cash dividend of $0.02 per Class B common share (2010 - $0.02) were issued in 2011.
Total dividend paid was $226,000 (2010 - $227,000).

44 Hammond Manufacturing Company Limited www.hammondmfg.com
HAMMOND MANUFACTURING COMPANY LIMITED Notes to Consolidated Financial Statements Years ended December 31, 2011 and 2010 (tabular amounts in thousands of Canadian dollars)
15. Earnings per share:
The computations for basic and diluted earnings per share are as follows: Years ended:
(in thousands except per share data) December 31, 2011 December 31, 2010 Income for the year $ 1,771 $ 2,306 Average number of common shares outstanding:
Basic and Diluted 11,334 11,334
Earnings per share: Basic $ 0.16 $ 0.20 Diluted 0.16 0.20
No share options to purchase common shares were outstanding as at December 31, 2011 or December 31, 2010.
16. Management share option plan:
As at December 31, 2011, the Company has a stock-based compensation plan, which is described below. No options were granted through December 31, 2011 or in 2010 and no stock options were outstanding as of January 1 2010, and, accordingly, no stock-based compensation expense has been incurred in either year.
In 1986, the Company established the management share option plan providing for the granting to directors, officers and key employees of the Company options to purchase the Class A subordinate voting shares of the Company. A maximum number of 540,000 Class A subordinate voting shares are issuable under the plan. The exercise price for purchasing Class A subordinate voting shares may not be less than 100% of the market price of the Class A subordinate voting shares at the date the option is granted.
17. Loans and borrowings:
Bank indebtedness:
Bank indebtedness is due on demand and secured by inventories, a general assignment of book debts and a charge on specific assets of the Company. The Company has established operating lines for the entities in Canada, USA and the UK. The Canadian entities were using $9,198,000 of its $10,000,000 CDN operating line of credit as at December 31, 2011 (2010 - $5,779,000 and $5,953,000 on January 1, 2010). The US entity was using $0 USD of its $2,000,000 USD operating line as at December 31, 2010 (2010 - $120,000 and $0 on January 1, 2010). The UK entity was using £109,000 GBP of its £250,000 GBP line of credit as at December 31, 2011 (2010 - £0 and £0 on January 1, 2010).

Annual Report 2011 45
HAMMOND MANUFACTURING COMPANY LIMITED Notes to Consolidated Financial Statements Years ended December 31, 2011 and 2010 (tabular amounts in thousands of Canadian dollars) 17. Loans and borrowings - continued:
Long-term debt:
December 31, 2011 December 31, 2010 January 1, 2010
Portion drawn in Canadian funds at variable interest rates based on thebank‟s prime lending rate, maturing in 2010 through 2013 $ 603 $ 1,302 $ 2,049
Portion drawn in US funds at variable interest rates based on the bank‟sprime lending rate, maturing in 2012 3 37 79
606 1,339 2,128
1,303 - -
- 166 350
- - 6
- 443 4431,909 1,948 2,927
Secured by equipment in Canadian funds at an interest rate of 6.175% 879 1,096 1,300Secured by equipment, drawn in GBP Sterling at interest rates between 7.53% to 8.8% 75 125 160Secured by equipment, drawn in U.S. funds at interest rates from 6.251% to 6.75% 494 719 566
1,448 1,940 2,026
Total long-term debt 3,357 3,888 4,953
Less current portion of long-term debt 1,217 1,864 1,417
Non-current long-term debt $ 2,140 $ 2,024 $ 3,536
Subtotal
Finance lease obligations:
Term loans, secured by a debenture on the Company's land and buildings together with a floating charge over all other assets of the Company:
Term loan drawn in US funds at a fixed rate of 5.36% through November 2009, and 7.36% thereafter until maturity in 2011, secured by the assets of Hammond Manufacturing Company Inc.
Demand term loan drawn in GPB Sterling at variable intersest rates based on the bank's base rate, secured by a debenture including fixed equitable charge over present and future freehold and leaehold property together with a floating charge over other assets of Hammond Electronics Limited (UK) and an Unlimited Composite Company Guarantee
Canadian fund note payable to 1159714 Ontario Inc., unsecured demand loan at 0% interest rate 366-day demand loan.
Term loan drawn in US funds at a fixed rate of 6.05% through December 2018, secured by the assets of Hammond Manufacturing Company Limited.
The aggregate amount of principal payments required to meet the existing long-term debt obligations in each of the next five years is as follows: 2012 $ 1,217 2013 644 2014 748 2015 189 2016 186 Later than 2016 373 $ 3,357

46 Hammond Manufacturing Company Limited www.hammondmfg.com
HAMMOND MANUFACTURING COMPANY LIMITED Notes to Consolidated Financial Statements Years ended December 31, 2011 and 2010 (tabular amounts in thousands of Canadian dollars) 17. Loans and borrowings - continued:
Interest expense is comprised as follows: For the years ended December 31, 2011 2010 Long-term debt, including capital leases $ 136 $ 210
Bank indebtedness 314 199
Interest expense $ 450 $ 409
18. Provisions:
Environmental Remediation
Sales Returns Total
Balance at January 1, 2010 $ 300 $ 60 $ 360
Provisions made during the year - 60 60
Provisions used during the year (40) (60) (100)
Balance at December 31, 2010 260 60 320
Provisions made during the year - 60 60
Provisions used during the year (10) (60) (70)
Balance at December 31, 2011 $ 250 $ 60 $ 310
Non-current 165 - 165
Current 85 60 145
Balance at December 31, 2011 $ 250 $ 60 $ 310
The provision for environmental remediation is based on the estimated costs to setup and extract contamination from our Glen Ewing Road property. The anticipated costs are based on our external consultant‟s remediation plan, discounted for timing. There are four years remaining in the clean-up plan.
The provision for sales returns is based on estimates from historical returns of product. The provision reflects the estimated profit margin of the anticipated returns.
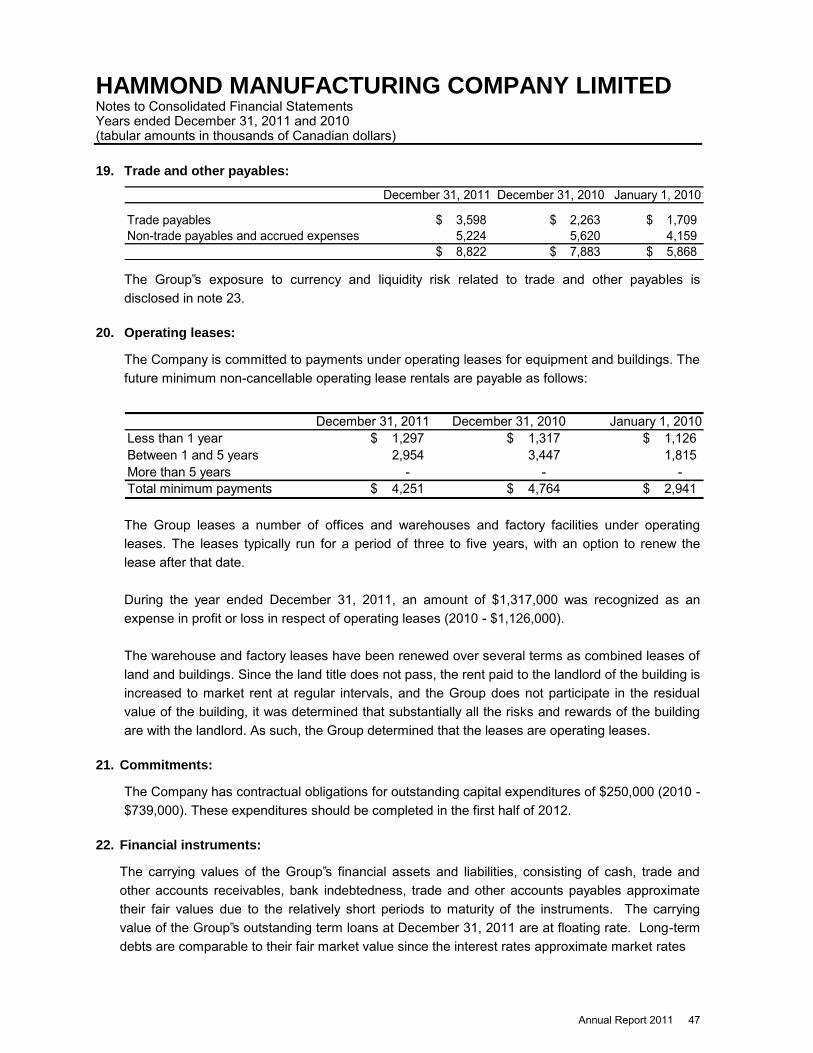
Annual Report 2011 47
HAMMOND MANUFACTURING COMPANY LIMITED Notes to Consolidated Financial Statements Years ended December 31, 2011 and 2010 (tabular amounts in thousands of Canadian dollars)
19. Trade and other payables:
December 31, 2011 December 31, 2010 January 1, 2010
Trade payables $ 3,598 $ 2,263 $ 1,709Non-trade payables and accrued expenses 5,224 5,620 4,159
$ 8,822 $ 7,883 $ 5,868
The Group‟s exposure to currency and liquidity risk related to trade and other payables is disclosed in note 23.
20. Operating leases:
The Company is committed to payments under operating leases for equipment and buildings. The future minimum non-cancellable operating lease rentals are payable as follows:
December 31, 2011 December 31, 2010 January 1, 2010
Less than 1 year $ 1,297 $ 1,317 $ 1,126Between 1 and 5 years 2,954 3,447 1,815 More than 5 years - - - Total minimum payments $ 4,251 $ 4,764 $ 2,941
The Group leases a number of offices and warehouses and factory facilities under operating leases. The leases typically run for a period of three to five years, with an option to renew the lease after that date. During the year ended December 31, 2011, an amount of $1,317,000 was recognized as an expense in profit or loss in respect of operating leases (2010 - $1,126,000).
The warehouse and factory leases have been renewed over several terms as combined leases of land and buildings. Since the land title does not pass, the rent paid to the landlord of the building is increased to market rent at regular intervals, and the Group does not participate in the residual value of the building, it was determined that substantially all the risks and rewards of the building are with the landlord. As such, the Group determined that the leases are operating leases.
21. Commitments:
The Company has contractual obligations for outstanding capital expenditures of $250,000 (2010 - $739,000). These expenditures should be completed in the first half of 2012.
22. Financial instruments:
The carrying values of the Group‟s financial assets and liabilities, consisting of cash, trade and other accounts receivables, bank indebtedness, trade and other accounts payables approximate their fair values due to the relatively short periods to maturity of the instruments. The carrying value of the Group‟s outstanding term loans at December 31, 2011 are at floating rate. Long-term debts are comparable to their fair market value since the interest rates approximate market rates

48 Hammond Manufacturing Company Limited www.hammondmfg.com
HAMMOND MANUFACTURING COMPANY LIMITED Notes to Consolidated Financial Statements Years ended December 31, 2011 and 2010 (tabular amounts in thousands of Canadian dollars) 22. Financial instruments - continued:
with the exception of the note payable to 1159714 Ontario Inc. This note had a fair value of $0 on December 31, 2011 ($416,000 on December 31, 2010 and $416,000 on January 1, 2010) Fair value has been calculated using the estimated future cash flows of the actual outstanding instruments, discounted at current market rates available to the Company for the same or similar instruments.
23. Financial risk management:
Overview The Group has exposure to the following risks from its use of financial instruments:
credit risk liquidity risk market risk operational risk.
This note presents information about the Group‟s exposure to each of the above risks, the Group‟s objectives, policies and processes for measuring and managing risk, and the Group‟s management of capital. Further quantitative disclosures are included throughout these consolidated financial statements.
Risk management framework:
The Board of Directors has overall responsibility for the establishment and oversight of the Group‟s risk management framework. The Board is responsible for developing and monitoring the Group‟s risk management policies.
The Group‟s risk management policies are established to identify and analyze the risks faced
by the Group, to set appropriate risk limits and controls, and to monitor risks and adherence to limits. Risk management policies and systems are reviewed regularly to reflect changes in market conditions and the Group‟s activities. The Group, through its training and management standards and procedures, aims to develop a disciplined and constructive control environment in which all employees understand their roles and obligations.
The Group‟s Audit Committee oversees how management monitors compliance with the
Group‟s risk management policies and procedures, and reviews the adequacy of the risk management framework in relation to the risks faced by the Group. The Group‟s Audit Committee is assisted in its oversight role by the corporate finance group. The corporate finance group undertakes both regular and ad hoc reviews of risk management controls and procedures, the results of which are reported to the Audit Committee.
Credit risk:
Credit risk is the risk of financial loss to the Group if a customer or counterparty to a financial instrument fails to meet its contractual obligations, and arises principally from the Group‟s receivables from customers. The carrying amount of financial assets represents the maximum credit risk exposure.

Annual Report 2011 49
HAMMOND MANUFACTURING COMPANY LIMITED Notes to Consolidated Financial Statements Years ended December 31, 2011 and 2010 (tabular amounts in thousands of Canadian dollars) 23. Financial risk management - continued:
Credit risk - continued: Trade and other receivables The Group‟s exposure to credit risk is influenced mainly by the individual characteristics of
each customer. However, management also considers the demographics of the Group‟s customer base, including the default risk of the industry and country in which customers operate, as these factors may have an influence on credit risk, particularly in the currently deteriorating economic circumstances.
The Group has established a credit policy under which each new customer is analyzed individually for creditworthiness before the Group‟s standard payment and delivery terms and conditions are offered. The Group‟s review includes external ratings, when available, and in some cases bank references. Purchase limits are established for each customer, which represents the maximum open amount without requiring approval from management. Customers that fail to meet the Group‟s benchmark creditworthiness may transact with the Group only on a prepayment basis.
In monitoring customer credit risk, customers are grouped according to their credit characteristics, including whether they are an individual or legal entity, whether they are a wholesale, retail or end-user customer, geographic location, industry, aging profile, maturity and existence of previous financial difficulties. Trade and other receivables relate mainly to the Group‟s wholesale customers. Customers that are graded as “high risk” are placed on a restricted customer list and monitored by the accounts receivable department, and future sales are made on a prepayment basis.
The Group does not require collateral in respect of trade and other receivables. The Group establishes an allowance for impairment that represents its estimate of incurred
losses in respect of trade and other receivables. The main components of this allowance are a specific loss component that relates to individually significant exposures, and a collective loss component established for groups of similar assets in respect of losses that have been incurred but not yet identified. The collective loss allowance is determined based on historical data of payment statistics for similar financial assets.
Credit risk arises from the possibility that the entities to which the Company sells products may experience difficulty and be unable to fulfill their obligations. The Company is exposed to financial risk that arises from the credit quality of the entities to which it sells products and services. The Company sells to a variety of companies in a number of different industries and geographic areas. As a result, the requirement for an industry specific or geographic reserve is minimal.
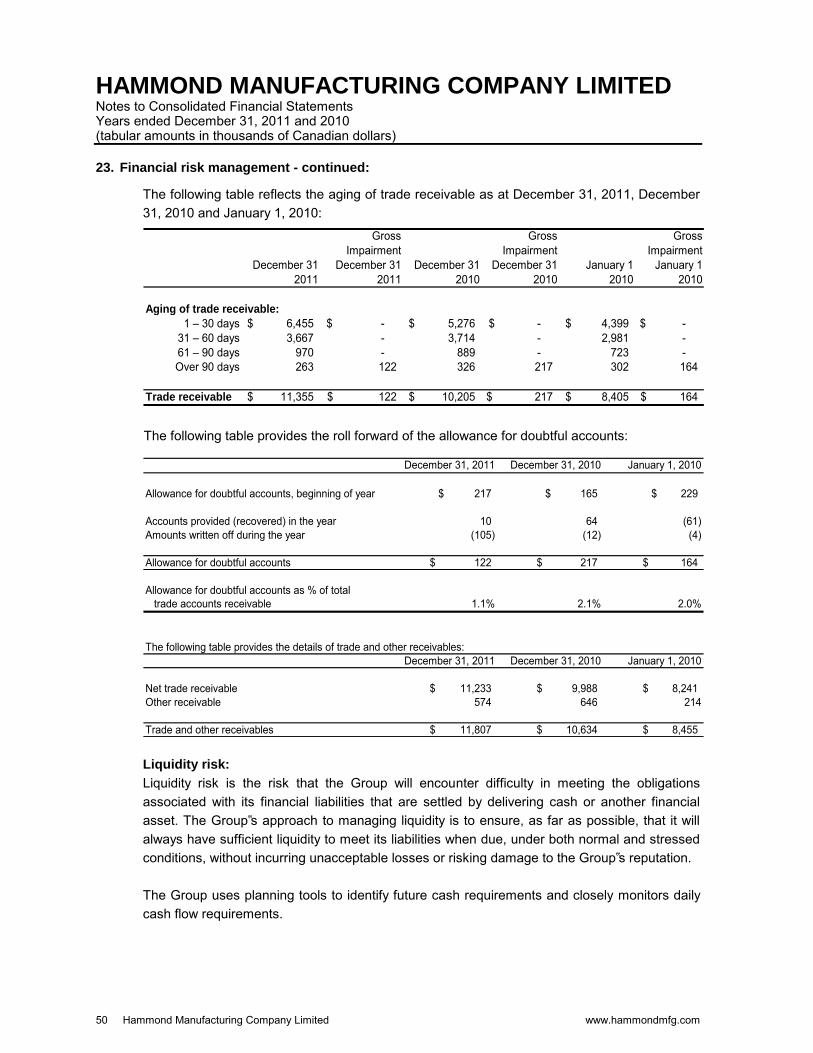
50 Hammond Manufacturing Company Limited www.hammondmfg.com
HAMMOND MANUFACTURING COMPANY LIMITED Notes to Consolidated Financial Statements Years ended December 31, 2011 and 2010 (tabular amounts in thousands of Canadian dollars) 23. Financial risk management - continued:
The following table reflects the aging of trade receivable as at December 31, 2011, December 31, 2010 and January 1, 2010:
Gross Impairment
Gross Impairment
Gross Impairment
December 31 2011
December 31 2011
December 31 2010
December 31 2010
January 1 2010
January 1 2010
Aging of trade receivable:
1 – 30 days 6,455$ -$ 5,276$ -$ 4,399$ -$ 31 – 60 days 3,667 - 3,714 - 2,981 - 61 – 90 days 970 - 889 - 723 - Over 90 days 263 122 326 217 302 164
Trade receivable 11,355$ 122$ 10,205$ 217$ 8,405$ 164$
The following table provides the roll forward of the allowance for doubtful accounts:
December 31, 2011 December 31, 2010 January 1, 2010
Allowance for doubtful accounts, beginning of year 217$ 165$ 229$
Accounts provided (recovered) in the year 10 64 (61) Amounts written off during the year (105) (12) (4)
Allowance for doubtful accounts 122$ 217$ 164$
Allowance for doubtful accounts as % of totaltrade accounts receivable 1.1% 2.1% 2.0%
The following table provides the details of trade and other receivables:December 31, 2011 December 31, 2010 January 1, 2010
Net trade receivable 11,233$ 9,988$ 8,241$ Other receivable 574 646 214
Trade and other receivables 11,807$ 10,634$ 8,455$
Liquidity risk: Liquidity risk is the risk that the Group will encounter difficulty in meeting the obligations
associated with its financial liabilities that are settled by delivering cash or another financial asset. The Group‟s approach to managing liquidity is to ensure, as far as possible, that it will always have sufficient liquidity to meet its liabilities when due, under both normal and stressed conditions, without incurring unacceptable losses or risking damage to the Group‟s reputation.
The Group uses planning tools to identify future cash requirements and closely monitors daily
cash flow requirements.
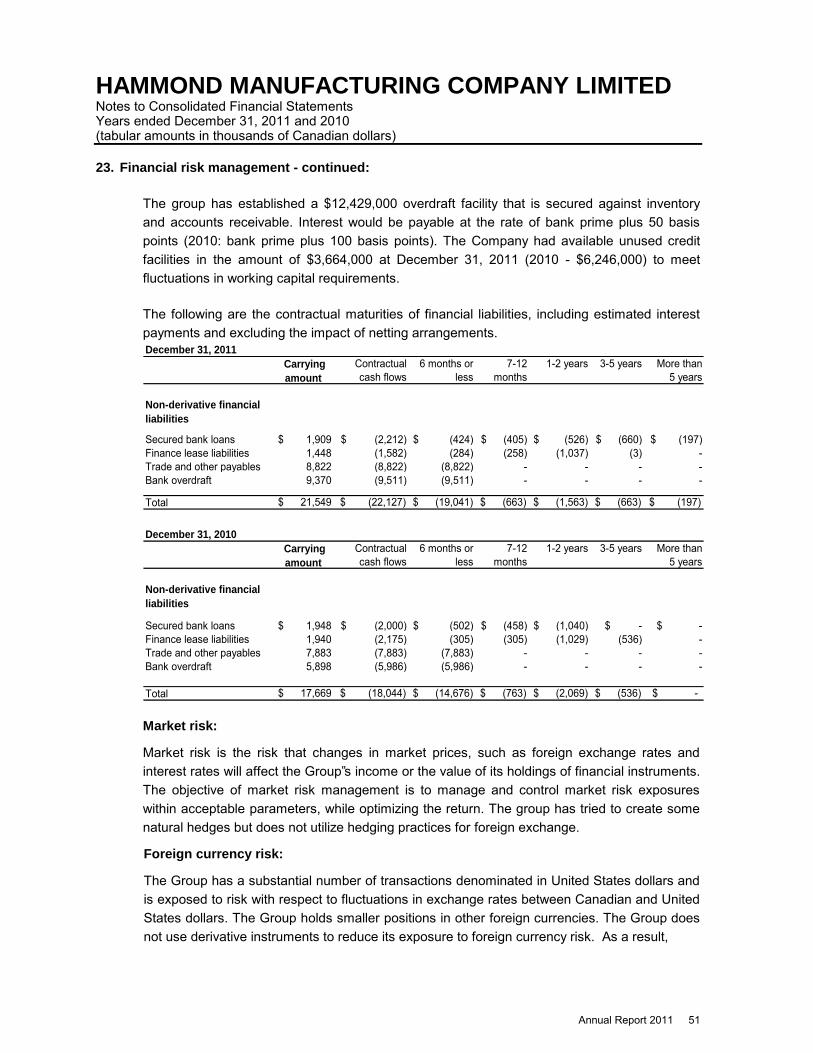
Annual Report 2011 51
HAMMOND MANUFACTURING COMPANY LIMITED Notes to Consolidated Financial Statements Years ended December 31, 2011 and 2010 (tabular amounts in thousands of Canadian dollars) 23. Financial risk management - continued:
The group has established a $12,429,000 overdraft facility that is secured against inventory and accounts receivable. Interest would be payable at the rate of bank prime plus 50 basis points (2010: bank prime plus 100 basis points). The Company had available unused credit facilities in the amount of $3,664,000 at December 31, 2011 (2010 - $6,246,000) to meet fluctuations in working capital requirements.
The following are the contractual maturities of financial liabilities, including estimated interest
payments and excluding the impact of netting arrangements. December 31, 2011
Carrying
amount
Contractual cash flows
6 months or less
7-12 months
1-2 years 3-5 years More than 5 years
Non-derivative financial
liabilities
Secured bank loans $ 1,909 $ (2,212) $ (424) $ (405) $ (526) $ (660) $ (197)Finance lease liabilities 1,448 (1,582) (284) (258) (1,037) (3) - Trade and other payables 8,822 (8,822) (8,822) - - - - Bank overdraft 9,370 (9,511) (9,511) - - - -
Total $ 21,549 $ (22,127) $ (19,041) $ (663) $ (1,563) $ (663) $ (197)
December 31, 2010
Carrying
amount
Contractual cash flows
6 months or less
7-12 months
1-2 years 3-5 years More than 5 years
Non-derivative financial
liabilities
Secured bank loans $ 1,948 $ (2,000) $ (502) $ (458) $ (1,040) $ - $ - Finance lease liabilities 1,940 (2,175) (305) (305) (1,029) (536) - Trade and other payables 7,883 (7,883) (7,883) - - - - Bank overdraft 5,898 (5,986) (5,986) - - - -
Total $ 17,669 $ (18,044) $ (14,676) $ (763) $ (2,069) $ (536) $ -
Market risk:
Market risk is the risk that changes in market prices, such as foreign exchange rates and interest rates will affect the Group‟s income or the value of its holdings of financial instruments. The objective of market risk management is to manage and control market risk exposures within acceptable parameters, while optimizing the return. The group has tried to create some natural hedges but does not utilize hedging practices for foreign exchange.
Foreign currency risk:
The Group has a substantial number of transactions denominated in United States dollars and is exposed to risk with respect to fluctuations in exchange rates between Canadian and United States dollars. The Group holds smaller positions in other foreign currencies. The Group does not use derivative instruments to reduce its exposure to foreign currency risk. As a result,
52 Hammond Manufacturing Company Limited www.hammondmfg.com
HAMMOND MANUFACTURING COMPANY LIMITED Notes to Consolidated Financial Statements Years ended December 31, 2011 and 2010 (tabular amounts in thousands of Canadian dollars) 23. Financial risk management - continued:
variations in foreign exchange rates could cause unanticipated fluctuations in the Group‟s operating result. Accounts receivable include Australian currency of $67,000, US $3,425,000, New Zealand $22,000, New Taiwanese $487,000 and GBP Sterling £412,000 (2010 – AUD $44,000, US $2,848,000, NZD $39,000, TWD $1,429,000 and £362,000). Accounts payable include Australian currency of $7,000, U.S. $1,184,000, Euro 148,000 and £229,000 (2010 – AUD $23,000, US $1,116,000, Euro 32,000 and £286,000). Long-term debt includes loans and capital leases denominated in US funds totaling U.S. $1,773,000 (2010 - US $926,000) and denominated in GBP Sterling funds totaling £48,000 (2010 - £81,000), which may affect the amount of principal and interest payments ultimately recorded.
Sensitivity Analysis:
A one-cent strengthening (weakening) of the Canadian dollar against the US dollar as at December 31, 2011 would have decreased (increased) equity by $458,000, which is derived from a decrease (increase) in net earnings for the year of $376,000 and a decrease (increase) in balance sheet valuation of $82,000. This analysis assumes that all other variables remain constant. As noted, the company does deal in other currencies but the level of impact of these currencies would not be significant.
Interest rate risk:
Interest rate risk arises from the possibility that the cash flows related to a financial instrument would fluctuate as a result of changes in market interest rates. The Group is exposed to financial risk that arises from the interest rate differentials between the market interest rate and the rates on its cash, bank indebtedness, and its float rate term loans. Changes in variable interest rates could cause unanticipated fluctuations in the Group‟s operating results.
Sensitivity Analysis:
A one percent increase in the variable rates charged on our ending 2011 debt held would increase interest expense by $99,000. This analysis assumes that all other variables remain constant. Inversely, a one percent decrease in the variable rates charged on our ending 2011 debt held would have had the equal but opposite effect.
Operational risk:
Operational risk is the risk of direct or indirect loss arising from a wide variety of causes associated with the Group‟s processes, personnel, technology and infrastructure, and from external factors other than credit, liquidity and market risks such as those arising from legal and regulatory requirements and generally accepted standards of corporate behaviour. Operational risks arise from all of the Group‟s operations.
The Group‟s objective is to manage operational risk so as to balance the avoidance of financial
losses and damage to the Group‟s reputation with overall cost effectiveness and to avoid control procedures that restrict initiative and creativity.
Annual Report 2011 53
HAMMOND MANUFACTURING COMPANY LIMITED Notes to Consolidated Financial Statements Years ended December 31, 2011 and 2010 (tabular amounts in thousands of Canadian dollars)
23. Financial risk management - continued:
The primary responsibility for the development and implementation of controls to address operational risk is assigned to senior management within each business unit. This responsibility is supported by the development of overall Group standards for the management of operational risk in the following areas:
requirements for appropriate segregation of duties, including the independent authorization of transactions
requirements for the reconciliation and monitoring of transactions compliance with regulatory and other legal requirements documentation of controls and procedures requirements for the periodic assessment of operational risks faced, and the
adequacy of controls and procedures to address the risks identified requirements for the reporting of operational losses and proposed remedial action development of contingency plans training and professional development ethical and business standards risk mitigation, including insurance when this is effective.
Compliance with Group standards is supported by a program of periodic reviews undertaken by the corporate finance group. The results of the reviews are discussed with the management of the business unit to which they relate, with summaries submitted to the Audit Committee and senior management of the Group.
Capital management:
In order to manage capital, the Group regularly identifies and assesses risks that threaten the ability to meet the Company‟s capital management objectives, and determines the appropriate strategy to mitigate these risks.
The Group‟s objectives when managing capital are to: a) maintain financial flexibility in order to preserve its ability to meet financial obligations b) deploy capital to provide an appropriate investment return to its shareholders c) maintain capital structure that allows multiple financing options to the Group should a
financing need arise.
The Group defines its capital as follows: a) shareholders‟ equity b) long-term debt, including the current portion c) cash and cash equivalents; and short-term investments
short-term borrowings d) The Group is subject to externally imposed capital requirements through the covenants
of its facility arrangements with the bank. The covenants measure Debt to Total Net Worth and Current Ratio. The Group has been in compliance with its covenants through 2010 and 2011
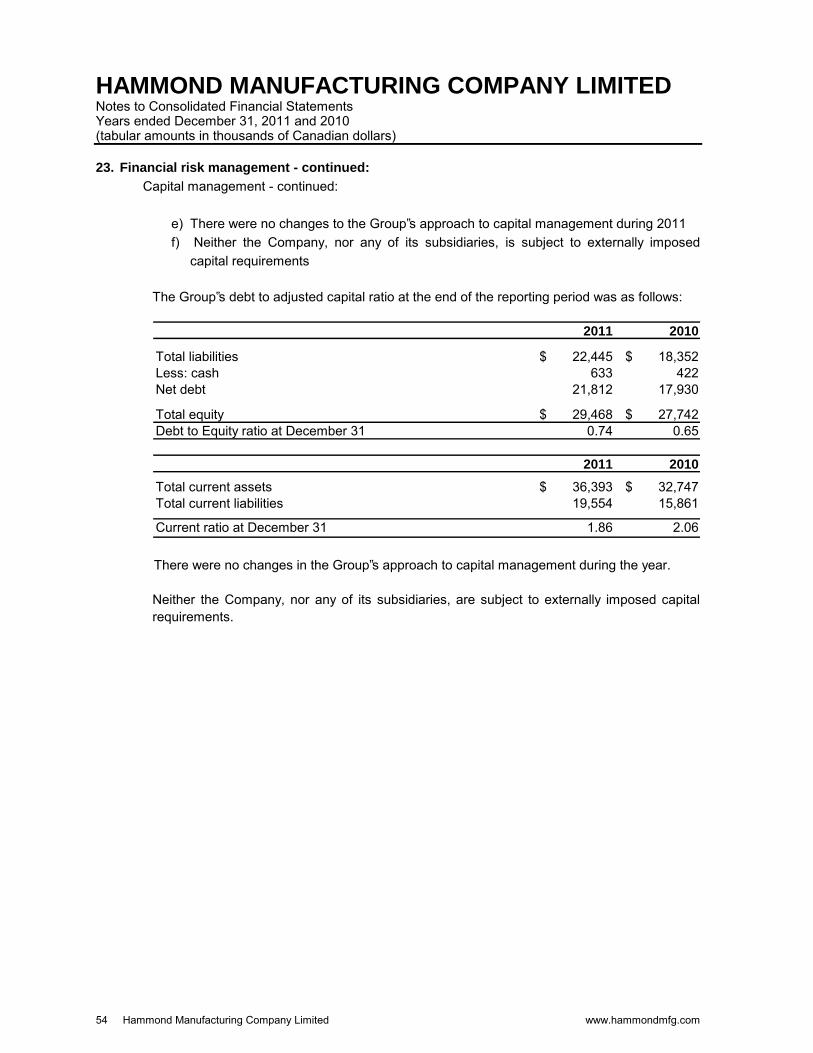
54 Hammond Manufacturing Company Limited www.hammondmfg.com
HAMMOND MANUFACTURING COMPANY LIMITED Notes to Consolidated Financial Statements Years ended December 31, 2011 and 2010 (tabular amounts in thousands of Canadian dollars) 23. Financial risk management - continued:
Capital management - continued:
e) There were no changes to the Group‟s approach to capital management during 2011 f) Neither the Company, nor any of its subsidiaries, is subject to externally imposed
capital requirements
The Group‟s debt to adjusted capital ratio at the end of the reporting period was as follows:
2011 2010
Total liabilities $ 22,445 $ 18,352 Less: cash 633 422Net debt 21,812 17,930
Total equity $ 29,468 $ 27,742 Debt to Equity ratio at December 31 0.74 0.65
2011 2010
Total current assets $ 36,393 $ 32,747 Total current liabilities 19,554 15,861
Current ratio at December 31 1.86 2.06
There were no changes in the Group‟s approach to capital management during the year.
Neither the Company, nor any of its subsidiaries, are subject to externally imposed capital requirements.
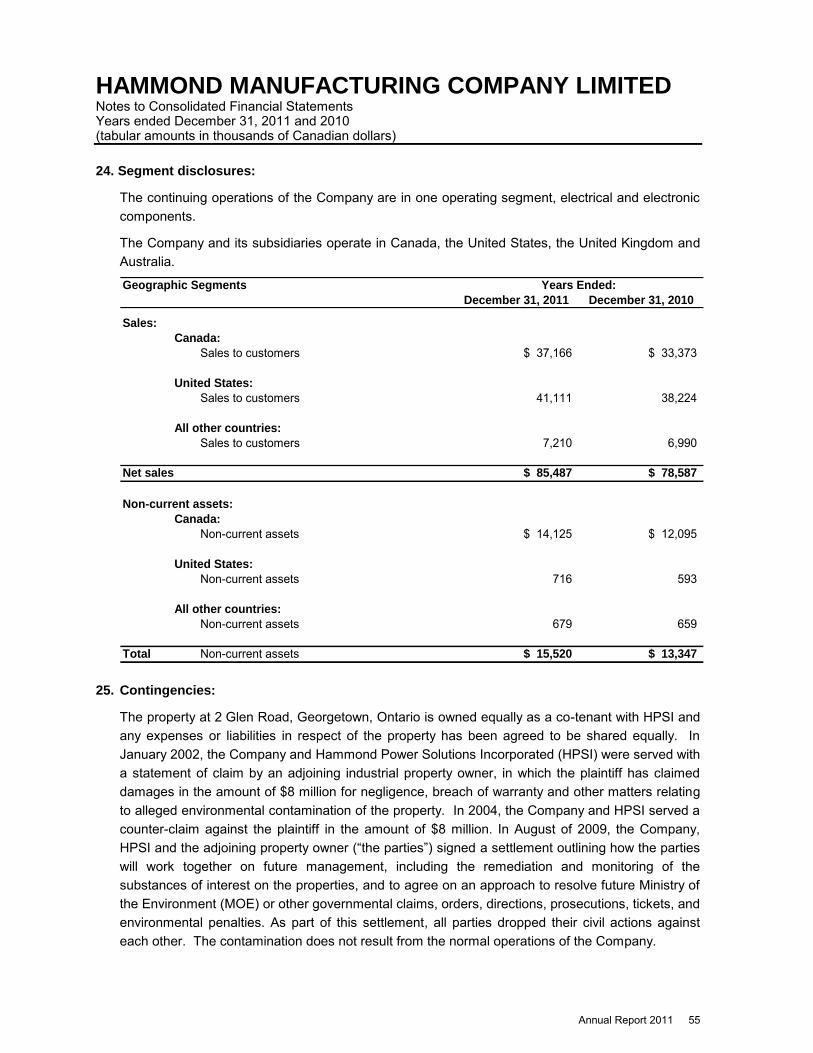
Annual Report 2011 55
HAMMOND MANUFACTURING COMPANY LIMITED Notes to Consolidated Financial Statements Years ended December 31, 2011 and 2010 (tabular amounts in thousands of Canadian dollars)
24. Segment disclosures:
The continuing operations of the Company are in one operating segment, electrical and electronic components.
The Company and its subsidiaries operate in Canada, the United States, the United Kingdom and Australia.
Geographic Segments
December 31, 2011 December 31, 2010
Sales:
Canada:
Sales to customers $ 37,166 $ 33,373
United States:
Sales to customers 41,111 38,224
All other countries:
Sales to customers 7,210 6,990
Net sales $ 85,487 $ 78,587
Non-current assets:
Canada:
Non-current assets $ 14,125 $ 12,095
United States:
Non-current assets 716 593
All other countries:
Non-current assets 679 659
Total Non-current assets $ 15,520 $ 13,347
Years Ended:
25. Contingencies:
The property at 2 Glen Road, Georgetown, Ontario is owned equally as a co-tenant with HPSI and any expenses or liabilities in respect of the property has been agreed to be shared equally. In January 2002, the Company and Hammond Power Solutions Incorporated (HPSI) were served with a statement of claim by an adjoining industrial property owner, in which the plaintiff has claimed damages in the amount of $8 million for negligence, breach of warranty and other matters relating to alleged environmental contamination of the property. In 2004, the Company and HPSI served a counter-claim against the plaintiff in the amount of $8 million. In August of 2009, the Company, HPSI and the adjoining property owner (“the parties”) signed a settlement outlining how the parties will work together on future management, including the remediation and monitoring of the substances of interest on the properties, and to agree on an approach to resolve future Ministry of the Environment (MOE) or other governmental claims, orders, directions, prosecutions, tickets, and environmental penalties. As part of this settlement, all parties dropped their civil actions against each other. The contamination does not result from the normal operations of the Company.
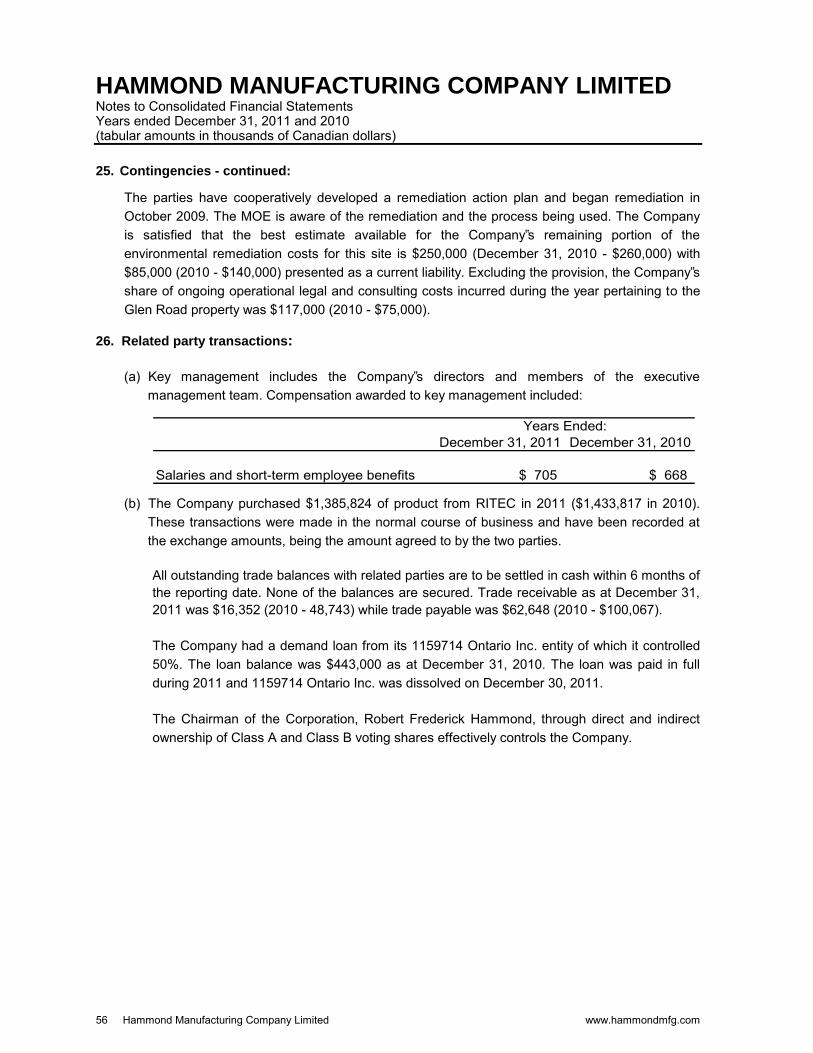
56 Hammond Manufacturing Company Limited www.hammondmfg.com
HAMMOND MANUFACTURING COMPANY LIMITED Notes to Consolidated Financial Statements Years ended December 31, 2011 and 2010 (tabular amounts in thousands of Canadian dollars)
25. Contingencies - continued:
The parties have cooperatively developed a remediation action plan and began remediation in October 2009. The MOE is aware of the remediation and the process being used. The Company is satisfied that the best estimate available for the Company‟s remaining portion of the environmental remediation costs for this site is $250,000 (December 31, 2010 - $260,000) with $85,000 (2010 - $140,000) presented as a current liability. Excluding the provision, the Company‟s share of ongoing operational legal and consulting costs incurred during the year pertaining to the Glen Road property was $117,000 (2010 - $75,000).
26. Related party transactions:
(a) Key management includes the Company‟s directors and members of the executive management team. Compensation awarded to key management included:
December 31, 2011 December 31, 2010
Salaries and short-term employee benefits $ 705 $ 668
Years Ended:
(b) The Company purchased $1,385,824 of product from RITEC in 2011 ($1,433,817 in 2010).
These transactions were made in the normal course of business and have been recorded at the exchange amounts, being the amount agreed to by the two parties.
All outstanding trade balances with related parties are to be settled in cash within 6 months of the reporting date. None of the balances are secured. Trade receivable as at December 31, 2011 was $16,352 (2010 - 48,743) while trade payable was $62,648 (2010 - $100,067).
The Company had a demand loan from its 1159714 Ontario Inc. entity of which it controlled 50%. The loan balance was $443,000 as at December 31, 2010. The loan was paid in full during 2011 and 1159714 Ontario Inc. was dissolved on December 30, 2011.
The Chairman of the Corporation, Robert Frederick Hammond, through direct and indirect ownership of Class A and Class B voting shares effectively controls the Company.

Annual Report 2011 57
HAMMOND MANUFACTURING COMPANY LIMITED Notes to Consolidated Financial Statements Years ended December 31, 2011 and 2010 (tabular amounts in thousands of Canadian dollars)
26. Related party transactions – continued:
(c) Consolidated entities
Country ofIncorporation December 31 December 31 January 1,
2011 2010 2010Les Fabrications Hammond (Quebec) Inc. / Hammond Manufacturing (Quebec) Inc. Canada 100 100 100
Hammond Electronics Pty Limited Australia 100 100 100
Hammond Electronics Limited UK 100 100 100 Subsidiary of above: Hammond Electronics Asia Limited Republic of China 100 - -
Hammond Manufacturing Company Inc. USA 100 100 100 Subsidiaries of above: Hammond Holdings Inc. USA 100 100 100 Paulding Electrical Products, Inc USA 100 100 100
1159714 Ontario Inc. Canada - 50 50
% Ownership InterestHAMMOND MANUFACTURING COMPANY LIMITED
1159714 Ontario Inc. was dissolved on December 30, 2011.
27. Explanation of transition to IFRS:
As stated in note 2(a), these are the Group‟s first annual consolidated financial statements prepared in accordance with IFRS. The significant accounting policies set out in note 3 have been applied in preparing the annual financial statements for the year ended December 31, 2011, the comparative information presented in these financial statements for the year-ended December 31, 2010 and in the preparation of an opening IFRS statement of financial position at January 1, 2010 (the Group‟s date of transition). In preparing its opening IFRS statement of financial position, the Group has adjusted amounts reported previously in financial statements prepared in accordance with previous Canadian GAAP. An explanation of how the transition from previous Canadian GAAP to IFRS has affected the Group‟s financial position, financial performance and cash flows is set out in the following tables and the notes that accompany the tables.
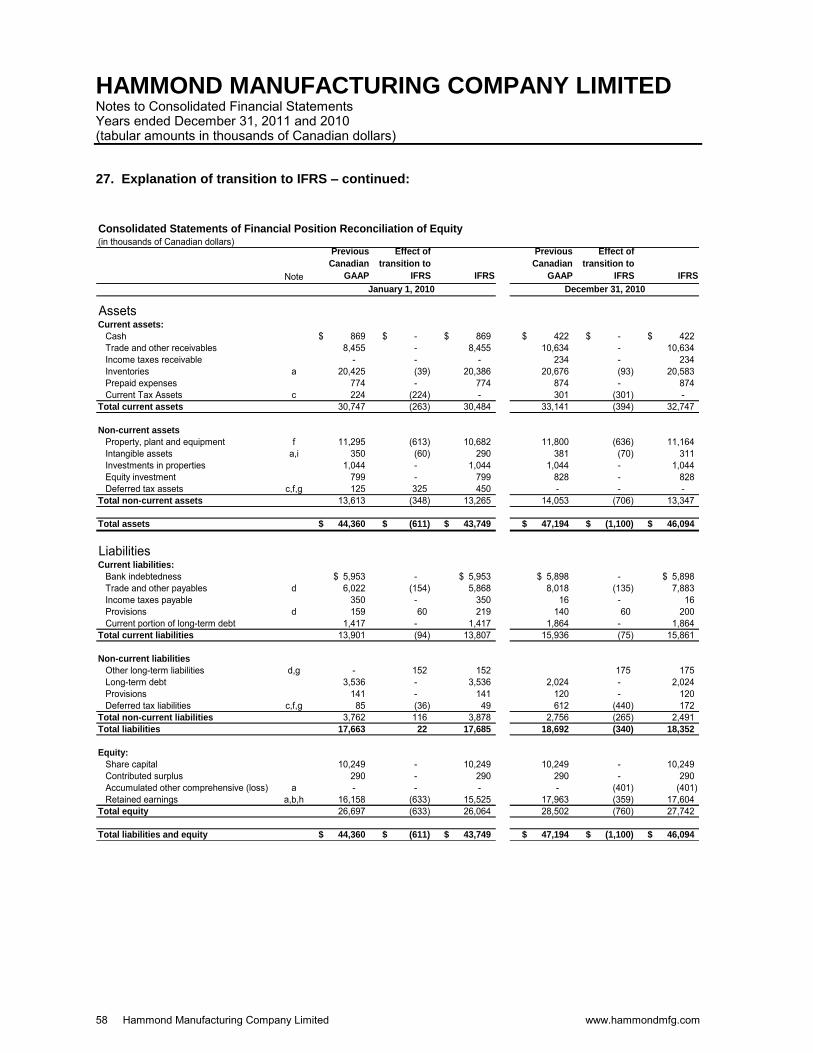
58 Hammond Manufacturing Company Limited www.hammondmfg.com
HAMMOND MANUFACTURING COMPANY LIMITED Notes to Consolidated Financial Statements Years ended December 31, 2011 and 2010 (tabular amounts in thousands of Canadian dollars)
27. Explanation of transition to IFRS – continued:
Consolidated Statements of Financial Position Reconciliation of Equity(in thousands of Canadian dollars)
Note
Previous
Canadian
GAAP
Effect of
transition to
IFRS IFRS
Previous
Canadian
GAAP
Effect of
transition to
IFRS IFRS
AssetsCurrent assets:
Cash 869$ -$ 869$ 422$ -$ 422$ Trade and other receivables 8,455 - 8,455 10,634 - 10,634 Income taxes receivable - - - 234 - 234 Inventories a 20,425 (39) 20,386 20,676 (93) 20,583 Prepaid expenses 774 - 774 874 - 874 Current Tax Assets c 224 (224) - 301 (301) -
Total current assets 30,747 (263) 30,484 33,141 (394) 32,747
Non-current assets
Property, plant and equipment f 11,295 (613) 10,682 11,800 (636) 11,164 Intangible assets a,i 350 (60) 290 381 (70) 311 Investments in properties 1,044 - 1,044 1,044 - 1,044 Equity investment 799 - 799 828 - 828 Deferred tax assets c,f,g 125 325 450 - - -
Total non-current assets 13,613 (348) 13,265 14,053 (706) 13,347
Total assets 44,360$ (611)$ 43,749$ 47,194$ (1,100)$ 46,094$
LiabilitiesCurrent liabilities:
Bank indebtedness 5,953$ - 5,953$ 5,898$ - 5,898$ Trade and other payables d 6,022 (154) 5,868 8,018 (135) 7,883 Income taxes payable 350 - 350 16 - 16 Provisions d 159 60 219 140 60 200 Current portion of long-term debt 1,417 - 1,417 1,864 - 1,864
Total current liabilities 13,901 (94) 13,807 15,936 (75) 15,861
Non-current liabilities
Other long-term liabilities d,g - 152 152 175 175 Long-term debt 3,536 - 3,536 2,024 - 2,024 Provisions 141 - 141 120 - 120 Deferred tax liabilities c,f,g 85 (36) 49 612 (440) 172
Total non-current liabilities 3,762 116 3,878 2,756 (265) 2,491 Total liabilities 17,663 22 17,685 18,692 (340) 18,352
Equity:
Share capital 10,249 - 10,249 10,249 - 10,249 Contributed surplus 290 - 290 290 - 290 Accumulated other comprehensive (loss) a - - - - (401) (401) Retained earnings a,b,h 16,158 (633) 15,525 17,963 (359) 17,604
Total equity 26,697 (633) 26,064 28,502 (760) 27,742
Total liabilities and equity 44,360$ (611)$ 43,749$ 47,194$ (1,100)$ 46,094$
January 1, 2010 December 31, 2010
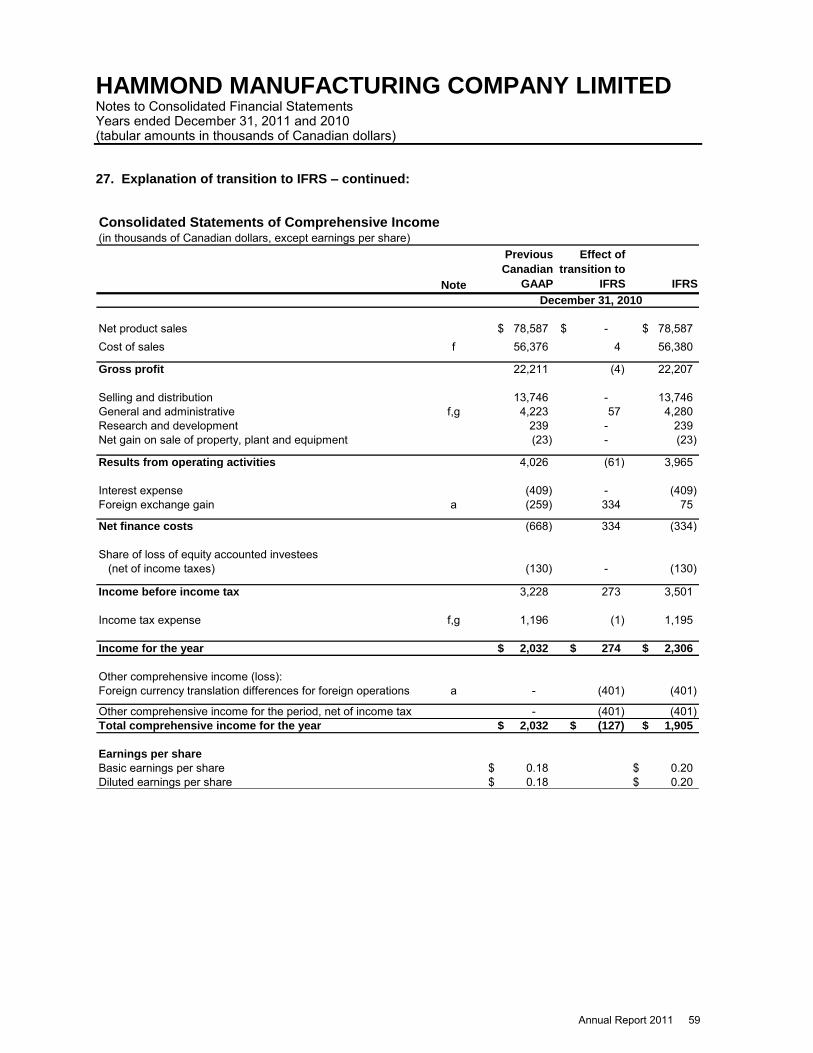
Annual Report 2011 59
HAMMOND MANUFACTURING COMPANY LIMITED Notes to Consolidated Financial Statements Years ended December 31, 2011 and 2010 (tabular amounts in thousands of Canadian dollars)
27. Explanation of transition to IFRS – continued:
Consolidated Statements of Comprehensive Income(in thousands of Canadian dollars, except earnings per share)
Note
Previous
Canadian
GAAP
Effect of
transition to
IFRS IFRS
Net product sales 78,587$ -$ 78,587$ Cost of sales f 56,376 4 56,380
Gross profit 22,211 (4) 22,207
Selling and distribution 13,746 - 13,746 General and administrative f,g 4,223 57 4,280 Research and development 239 - 239 Net gain on sale of property, plant and equipment (23) - (23)
Results from operating activities 4,026 (61) 3,965
Interest expense (409) - (409) Foreign exchange gain a (259) 334 75
Net finance costs (668) 334 (334)
Share of loss of equity accounted investees (net of income taxes) (130) - (130)
Income before income tax 3,228 273 3,501
Income tax expense f,g 1,196 (1) 1,195
Income for the year 2,032$ 274$ 2,306$
Other comprehensive income (loss):Foreign currency translation differences for foreign operations a - (401) (401)
Other comprehensive income for the period, net of income tax - (401) (401) Total comprehensive income for the year 2,032$ (127)$ 1,905$
Earnings per share
Basic earnings per share 0.18$ 0.20$ Diluted earnings per share 0.18$ 0.20$
December 31, 2010
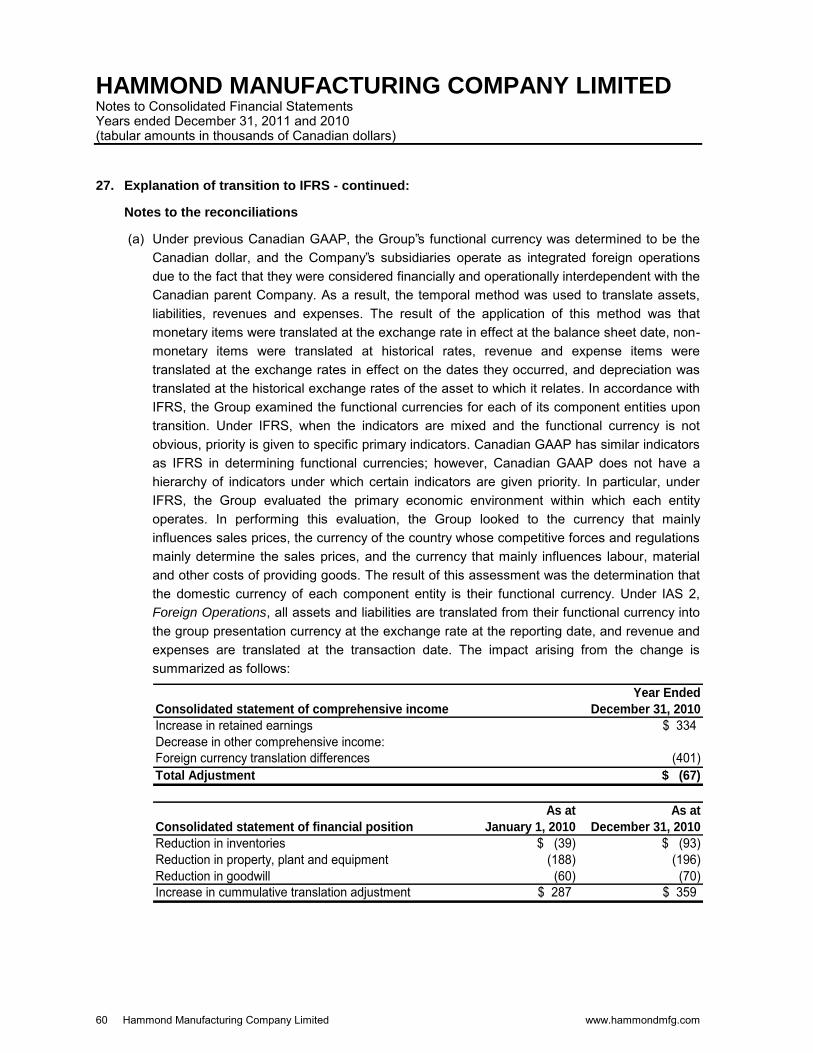
60 Hammond Manufacturing Company Limited www.hammondmfg.com
HAMMOND MANUFACTURING COMPANY LIMITED Notes to Consolidated Financial Statements Years ended December 31, 2011 and 2010 (tabular amounts in thousands of Canadian dollars) 27. Explanation of transition to IFRS - continued:
Notes to the reconciliations
(a) Under previous Canadian GAAP, the Group‟s functional currency was determined to be the Canadian dollar, and the Company‟s subsidiaries operate as integrated foreign operations due to the fact that they were considered financially and operationally interdependent with the Canadian parent Company. As a result, the temporal method was used to translate assets, liabilities, revenues and expenses. The result of the application of this method was that monetary items were translated at the exchange rate in effect at the balance sheet date, non-monetary items were translated at historical rates, revenue and expense items were translated at the exchange rates in effect on the dates they occurred, and depreciation was translated at the historical exchange rates of the asset to which it relates. In accordance with IFRS, the Group examined the functional currencies for each of its component entities upon transition. Under IFRS, when the indicators are mixed and the functional currency is not obvious, priority is given to specific primary indicators. Canadian GAAP has similar indicators as IFRS in determining functional currencies; however, Canadian GAAP does not have a hierarchy of indicators under which certain indicators are given priority. In particular, under IFRS, the Group evaluated the primary economic environment within which each entity operates. In performing this evaluation, the Group looked to the currency that mainly influences sales prices, the currency of the country whose competitive forces and regulations mainly determine the sales prices, and the currency that mainly influences labour, material and other costs of providing goods. The result of this assessment was the determination that the domestic currency of each component entity is their functional currency. Under IAS 2, Foreign Operations, all assets and liabilities are translated from their functional currency into the group presentation currency at the exchange rate at the reporting date, and revenue and expenses are translated at the transaction date. The impact arising from the change is summarized as follows:
Year Ended
Consolidated statement of comprehensive income December 31, 2010
Increase in retained earnings $ 334Decrease in other comprehensive income:Foreign currency translation differences (401) Total Adjustment $ (67)
As at As at
Consolidated statement of financial position January 1, 2010 December 31, 2010
Reduction in inventories $ (39) $ (93)Reduction in property, plant and equipment (188) (196) Reduction in goodwill (60) (70) Increase in cummulative translation adjustment $ 287 $ 359

Annual Report 2011 61
HAMMOND MANUFACTURING COMPANY LIMITED Notes to Consolidated Financial Statements Years ended December 31, 2011 and 2010 (tabular amounts in thousands of Canadian dollars)
27. Explanation of transition to IFRS - continued:
(b) In accordance with IFRS 1, the Group has elected to deem all foreign currency translation differences that arose prior to the date of transition in respect of all foreign operations to be nil at the date of transition.
The impact arising from the change is summarized as follows:
As at
Consolidated statement of financial position January 1, 2010
Decrease in cumulative translation reserve $ (287)Decrease in retained earnings $ 287
(c) Upon adoption of IFRS, the Group classified deferred tax assets previously presented as current assets as non-current assets, in accordance with IAS 12, Income Taxes. Similarly, the Group classified deferred tax liabilities previously presented as current liabilities as non-current liabilities.
As at As at
Deferred tax assets January 1, 2010 December 31, 2010
Current deferred tax assets $ (224) $ (301)Non-current deferred tax assets increase 188 - Non-current deferred tax liabilities decrease 36 301
(d) Upon adoption of IFRS, the Group presented provisions previously classified as accrued liabilities separately on the statement of financial position.
As at As at
Consolidated statement of financial position January 1, 2010 December 31, 2010
Decrease accounts payable and accrued liabilities $ (154) $ (135)Increase provisions 60 60 Increase other long-term liabilities 94 75
(e) As part of its transition to IFRS, the Group elected not to restate prior business combinations. In respect of acquisitions prior to January 1, 2009 goodwill, represents the amount recognized under previous Canadian GAAP.
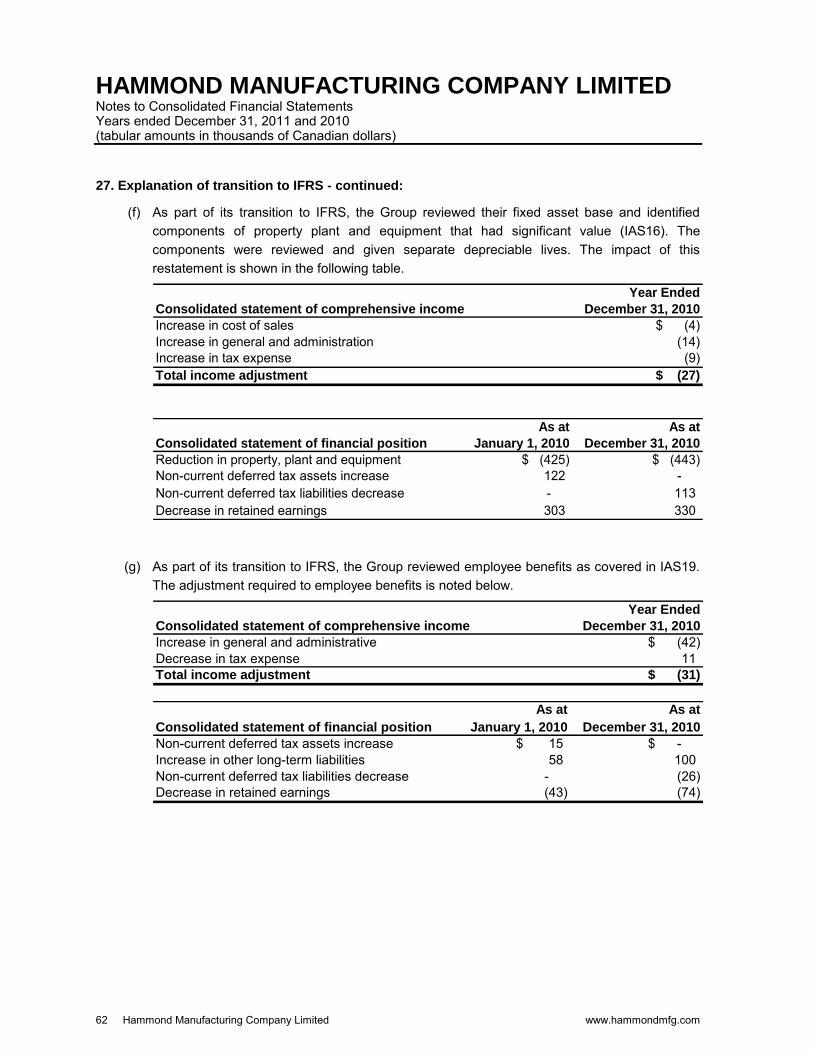
62 Hammond Manufacturing Company Limited www.hammondmfg.com
HAMMOND MANUFACTURING COMPANY LIMITED Notes to Consolidated Financial Statements Years ended December 31, 2011 and 2010 (tabular amounts in thousands of Canadian dollars) 27. Explanation of transition to IFRS - continued:
(f) As part of its transition to IFRS, the Group reviewed their fixed asset base and identified components of property plant and equipment that had significant value (IAS16). The components were reviewed and given separate depreciable lives. The impact of this restatement is shown in the following table.
Year Ended
Consolidated statement of comprehensive income December 31, 2010
Increase in cost of sales $ (4)Increase in general and administration (14) Increase in tax expense (9) Total income adjustment $ (27)
As at As at
Consolidated statement of financial position January 1, 2010 December 31, 2010
Reduction in property, plant and equipment $ (425) $ (443)Non-current deferred tax assets increase 122 - Non-current deferred tax liabilities decrease - 113 Decrease in retained earnings 303 330
(g) As part of its transition to IFRS, the Group reviewed employee benefits as covered in IAS19. The adjustment required to employee benefits is noted below.
Year Ended
Consolidated statement of comprehensive income December 31, 2010
Increase in general and administrative $ (42)Decrease in tax expense 11 Total income adjustment $ (31)
As at As at
Consolidated statement of financial position January 1, 2010 December 31, 2010
Non-current deferred tax assets increase $ 15 $ -Increase in other long-term liabilities 58 100 Non-current deferred tax liabilities decrease - (26) Decrease in retained earnings (43) (74)
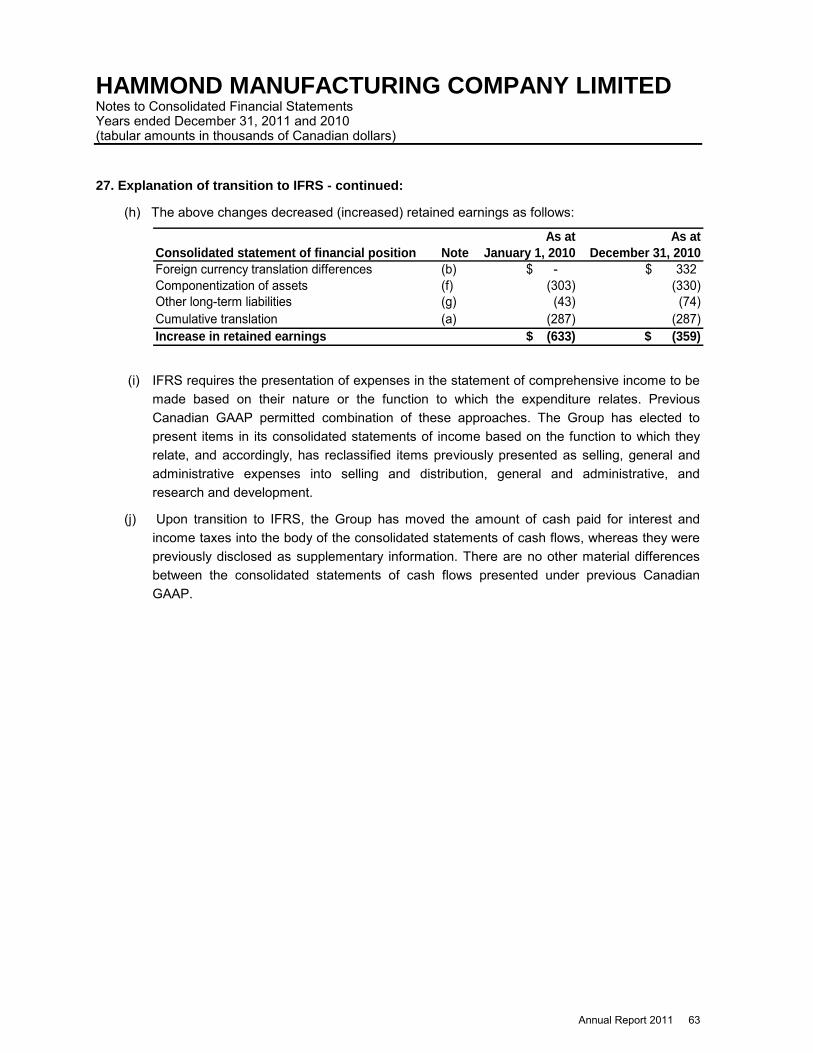
Annual Report 2011 63
HAMMOND MANUFACTURING COMPANY LIMITED Notes to Consolidated Financial Statements Years ended December 31, 2011 and 2010 (tabular amounts in thousands of Canadian dollars) 27. Explanation of transition to IFRS - continued:
(h) The above changes decreased (increased) retained earnings as follows:
As at As at
Consolidated statement of financial position Note January 1, 2010 December 31, 2010
Foreign currency translation differences (b) $ - $ 332Componentization of assets (f) (303) (330) Other long-term liabilities (g) (43) (74) Cumulative translation (a) (287) (287) Increase in retained earnings $ (633) $ (359)
(i) IFRS requires the presentation of expenses in the statement of comprehensive income to be made based on their nature or the function to which the expenditure relates. Previous Canadian GAAP permitted combination of these approaches. The Group has elected to present items in its consolidated statements of income based on the function to which they relate, and accordingly, has reclassified items previously presented as selling, general and administrative expenses into selling and distribution, general and administrative, and research and development.
(j) Upon transition to IFRS, the Group has moved the amount of cash paid for interest and income taxes into the body of the consolidated statements of cash flows, whereas they were previously disclosed as supplementary information. There are no other material differences between the consolidated statements of cash flows presented under previous Canadian GAAP.
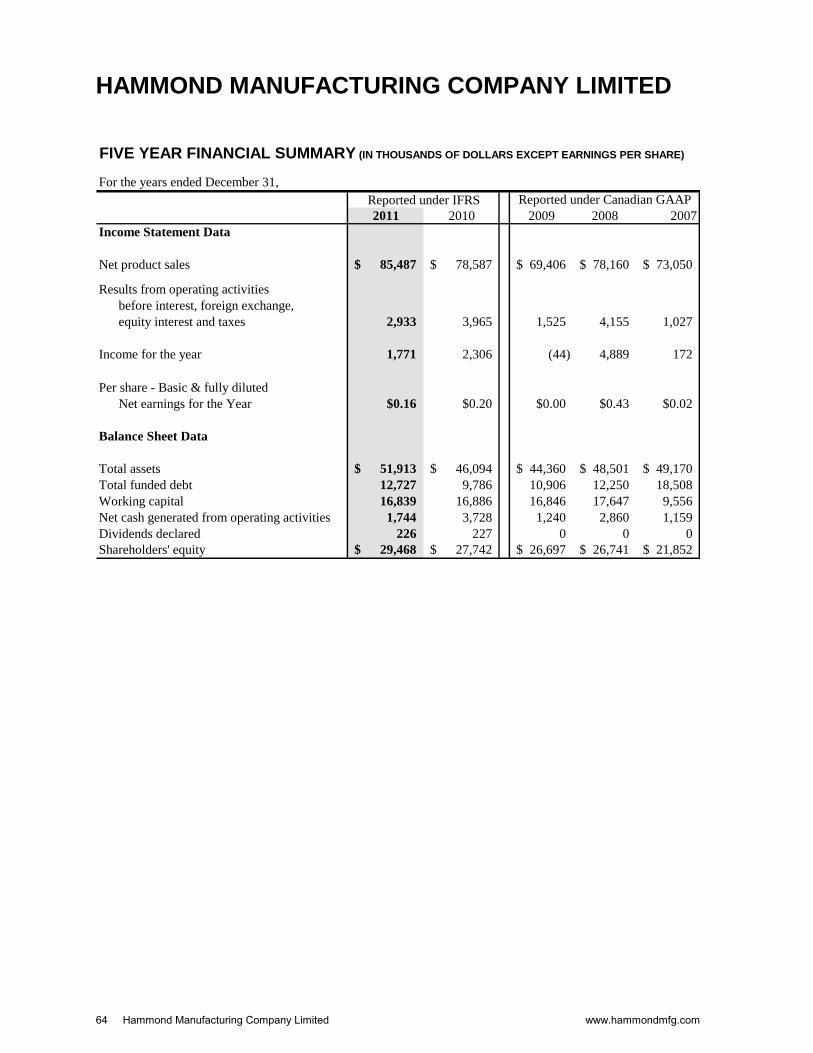
64 Hammond Manufacturing Company Limited www.hammondmfg.com
HAMMOND MANUFACTURING COMPANY LIMITED FIVE YEAR FINANCIAL SUMMARY (IN THOUSANDS OF DOLLARS EXCEPT EARNINGS PER SHARE)
For the years ended December 31,
2011 2010 2009 2008 2007
Income Statement Data
Net product sales 85,487$ 78,587$ 69,406$ 78,160$ 73,050$
Results from operating activities
before interest, foreign exchange,
equity interest and taxes 2,933 3,965 1,525 4,155 1,027
Income for the year 1,771 2,306 (44) 4,889 172
Per share - Basic & fully diluted
Net earnings for the Year $0.16 $0.20 $0.00 $0.43 $0.02
Balance Sheet Data
Total assets 51,913$ 46,094$ 44,360$ 48,501$ 49,170$
Total funded debt 12,727 9,786 10,906 12,250 18,508
Working capital 16,839 16,886 16,846 17,647 9,556
Net cash generated from operating activities 1,744 3,728 1,240 2,860 1,159
Dividends declared 226 227 0 0 0
Shareholders' equity 29,468$ 27,742$ 26,697$ 26,741$ 21,852$
Reported under IFRS Reported under Canadian GAAP


CORPORATE DIRECTORY
Directors Officers/Senior ManagementRobert F. HammondChairman and CEO
Robert F. HammondChairman and CEO
Marc A. Dubé *Chairman of the BoardRanger Metal Products Limited(Manufacturer of Wire Products)
Cy A. MahyVice-President, Human Resources
Alexander StirlingSecretary & CFO
Edward Sehl *Principal - Sehl ConsultingDirector - Fox Seeds
Ray ShatzelVice-President, Electronic Sales
Sheldon ButtsCanadian Sales & Marketing Manager
Paul Quigley *PresidentQuigley Group Inc.
Ross N. HammondAssistant Secretary
All Directors are members of the Compensation Committee* Members of the Audit Committee
AuditorsKPMG LLPTenon, UKGrant Thornton, Australia
Legal CounselBorden Ladner Gervais
Stock ListingToronto Stock ExchangeSymbol: HMM.A
BankersHSBC
Transfer Agent and RegistrarComputershare Investor Services Inc.

© Copyright. Hammond Manufacturing Co. Ltd.
OFFICES AND LOCATIONSCorporate Head Offi ce394 Edinburgh Road NorthGuelph, Ontario N1H 1E5Canada
Email: [email protected]
Les Fabrications Hammond (Québec) Inc.4240 SeréSt-Laurent, Quebec H4T 1A6Canada
Hammond Manufacturing Co. Inc.475 Cayuga Rd.Cheektowaga, NY 14225USA
Hammond Electronics Ltd.1 Onslow CloseKingsland Business ParkBasingstoke, Hampshire RG248QLEngland
Hammond Electronics Pty. Ltd.11-13 Port RoadQueenstown, SA 5024Australia
Tel: (519) 822-2960Fax: (519) 822-7289
Tel: (514) 343-9010Fax: (514) 343-9941
Tel: (716) 630-7030Fax: (716) 630-7042
Tel: 01256 812812Fax: 01256 332249
Tel: 61-8-8235-0744Fax: 61-8-8356-3652