quant briefing: earnings surprise monitor - yardeni … · quant briefing: earnings surprise...
TRANSCRIPT

Quant Briefing:Earnings Surprise Monitor
Yardeni Research, Inc.
May 29, 2018
Dr. Ed Yardeni516-972-7683
Joe Abbott732-497-5306
Please visit our sites atwww.yardeni.comblog.yardeni.com
thinking outside the box
Table Of Contents Table Of ContentsTable Of Contents
May 29, 2018 / Earnings Surprise Monitor www.yardeni.com
Yardeni Research, Inc.
S&P 500 Earnings & Revenue Surprise Summary 1S&P 500/400/600 Earnings Surprise for Current Quarter 2S&P 500/400/600 Revenue Surprise for Current Quarter 3S&P 500/400/600 Change in Shares Outstanding 4S&P 500 Revenue & Earnings % Surprise 5S&P 500 Revenue & Earnings % of Companies +/- 6S&P 500 Revenue & Earnings Surprise ex-Energy 7S&P 500 Revenue & Earnings Surprise ex-Financials 8S&P 500 Revenue & Earnings Growth ex-Energy 9S&P 500 Revenue & Earnings Growth ex-Financials 10S&P 500 Sectors Quarterly Earnings Surprises 11-12S&P 500 Sectors Quarterly Revenue Surprises 13-14S&P 500 Sectors Quarterly Earnings Growth 15S&P 500 Sectors Quarterly Revenue Growth 16
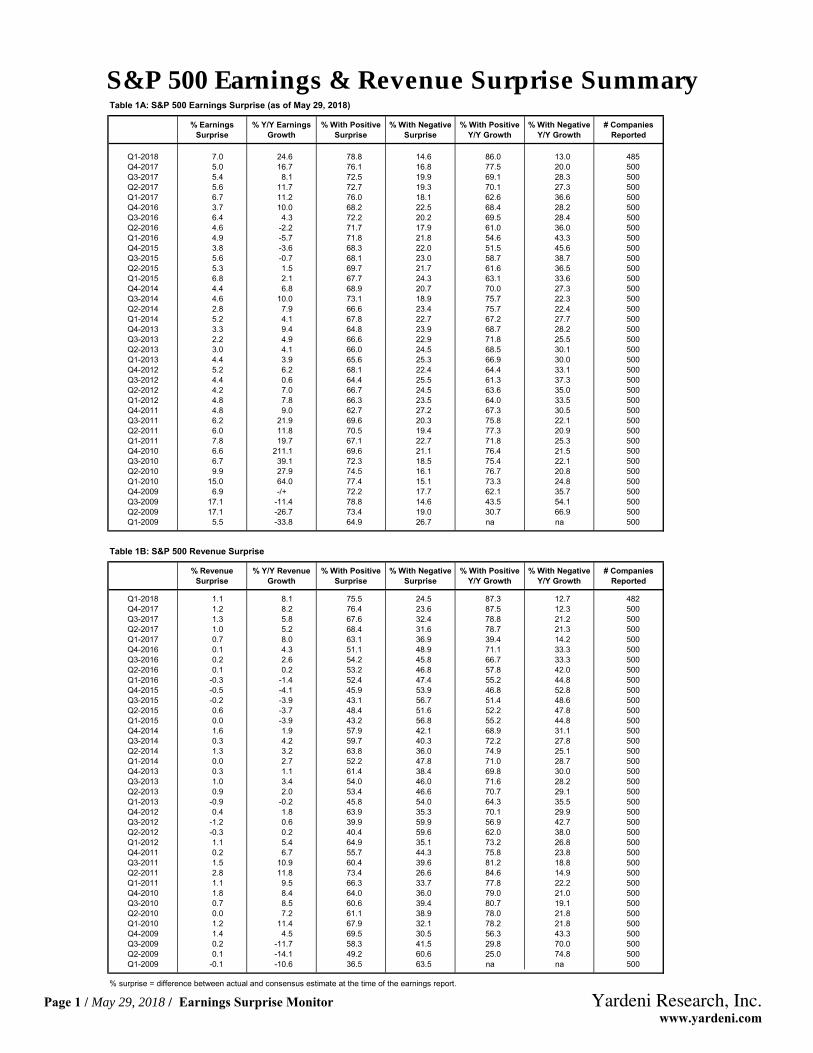
S&P 500 Earnings & Revenue Surprise Summary
Page 1 / May 29, 2018 / Earnings Surprise Monitor www.yardeni.com
Yardeni Research, Inc.
S&P 500 Earnings & Revenue Surprise Summary
Page 1 / May 29, 2018 / Earnings Surprise Monitor www.yardeni.com
Yardeni Research, Inc.
% Earnings Surprise
% Y/Y Earnings Growth
% With Positive Surprise
% With Negative Surprise
% With Positive Y/Y Growth
% With Negative Y/Y Growth
# Companies Reported
Q1-2018 7.0 24.6 78.8 14.6 86.0 13.0 485Q4-2017 5.0 16.7 76.1 16.8 77.5 20.0 500Q3-2017 5.4 8.1 72.5 19.9 69.1 28.3 500Q2-2017 5.6 11.7 72.7 19.3 70.1 27.3 500Q1-2017 6.7 11.2 76.0 18.1 62.6 36.6 500Q4-2016 3.7 10.0 68.2 22.5 68.4 28.2 500Q3-2016 6.4 4.3 72.2 20.2 69.5 28.4 500Q2-2016 4.6 -2.2 71.7 17.9 61.0 36.0 500Q1-2016 4.9 -5.7 71.8 21.8 54.6 43.3 500Q4-2015 3.8 -3.6 68.3 22.0 51.5 45.6 500Q3-2015 5.6 -0.7 68.1 23.0 58.7 38.7 500Q2-2015 5.3 1.5 69.7 21.7 61.6 36.5 500Q1-2015 6.8 2.1 67.7 24.3 63.1 33.6 500Q4-2014 4.4 6.8 68.9 20.7 70.0 27.3 500Q3-2014 4.6 10.0 73.1 18.9 75.7 22.3 500Q2-2014 2.8 7.9 66.6 23.4 75.7 22.4 500Q1-2014 5.2 4.1 67.8 22.7 67.2 27.7 500Q4-2013 3.3 9.4 64.8 23.9 68.7 28.2 500Q3-2013 2.2 4.9 66.6 22.9 71.8 25.5 500Q2-2013 3.0 4.1 66.0 24.5 68.5 30.1 500Q1-2013 4.4 3.9 65.6 25.3 66.9 30.0 500Q4-2012 5.2 6.2 68.1 22.4 64.4 33.1 500Q3-2012 4.4 0.6 64.4 25.5 61.3 37.3 500Q2-2012 4.2 7.0 66.7 24.5 63.6 35.0 500Q1-2012 4.8 7.8 66.3 23.5 64.0 33.5 500Q4-2011 4.8 9.0 62.7 27.2 67.3 30.5 500Q3-2011 6.2 21.9 69.6 20.3 75.8 22.1 500Q2-2011 6.0 11.8 70.5 19.4 77.3 20.9 500Q1-2011 7.8 19.7 67.1 22.7 71.8 25.3 500Q4-2010 6.6 211.1 69.6 21.1 76.4 21.5 500Q3-2010 6.7 39.1 72.3 18.5 75.4 22.1 500Q2-2010 9.9 27.9 74.5 16.1 76.7 20.8 500Q1-2010 15.0 64.0 77.4 15.1 73.3 24.8 500Q4-2009 6.9 -/+ 72.2 17.7 62.1 35.7 500Q3-2009 17.1 -11.4 78.8 14.6 43.5 54.1 500Q2-2009 17.1 -26.7 73.4 19.0 30.7 66.9 500Q1-2009 5.5 -33.8 64.9 26.7 na na 500
% Revenue Surprise
% Y/Y Revenue Growth
% With Positive Surprise
% With Negative Surprise
% With Positive Y/Y Growth
% With Negative Y/Y Growth
# Companies Reported
Q1-2018 1.1 8.1 75.5 24.5 87.3 12.7 482Q4-2017 1.2 8.2 76.4 23.6 87.5 12.3 500Q3-2017 1.3 5.8 67.6 32.4 78.8 21.2 500Q2-2017 1.0 5.2 68.4 31.6 78.7 21.3 500Q1-2017 0.7 8.0 63.1 36.9 39.4 14.2 500Q4-2016 0.1 4.3 51.1 48.9 71.1 33.3 500Q3-2016 0.2 2.6 54.2 45.8 66.7 33.3 500Q2-2016 0.1 0.2 53.2 46.8 57.8 42.0 500Q1-2016 -0.3 -1.4 52.4 47.4 55.2 44.8 500Q4-2015 -0.5 -4.1 45.9 53.9 46.8 52.8 500Q3-2015 -0.2 -3.9 43.1 56.7 51.4 48.6 500Q2-2015 0.6 -3.7 48.4 51.6 52.2 47.8 500Q1-2015 0.0 -3.9 43.2 56.8 55.2 44.8 500Q4-2014 1.6 1.9 57.9 42.1 68.9 31.1 500Q3-2014 0.3 4.2 59.7 40.3 72.2 27.8 500Q2-2014 1.3 3.2 63.8 36.0 74.9 25.1 500Q1-2014 0.0 2.7 52.2 47.8 71.0 28.7 500Q4-2013 0.3 1.1 61.4 38.4 69.8 30.0 500Q3-2013 1.0 3.4 54.0 46.0 71.6 28.2 500Q2-2013 0.9 2.0 53.4 46.6 70.7 29.1 500Q1-2013 -0.9 -0.2 45.8 54.0 64.3 35.5 500Q4-2012 0.4 1.8 63.9 35.3 70.1 29.9 500Q3-2012 -1.2 0.6 39.9 59.9 56.9 42.7 500Q2-2012 -0.3 0.2 40.4 59.6 62.0 38.0 500Q1-2012 1.1 5.4 64.9 35.1 73.2 26.8 500Q4-2011 0.2 6.7 55.7 44.3 75.8 23.8 500Q3-2011 1.5 10.9 60.4 39.6 81.2 18.8 500Q2-2011 2.8 11.8 73.4 26.6 84.6 14.9 500Q1-2011 1.1 9.5 66.3 33.7 77.8 22.2 500Q4-2010 1.8 8.4 64.0 36.0 79.0 21.0 500Q3-2010 0.7 8.5 60.6 39.4 80.7 19.1 500Q2-2010 0.0 7.2 61.1 38.9 78.0 21.8 500Q1-2010 1.2 11.4 67.9 32.1 78.2 21.8 500Q4-2009 1.4 4.5 69.5 30.5 56.3 43.3 500Q3-2009 0.2 -11.7 58.3 41.5 29.8 70.0 500Q2-2009 0.1 -14.1 49.2 60.6 25.0 74.8 500Q1-2009 -0.1 -10.6 36.5 63.5 na na 500
% surprise = difference between actual and consensus estimate at the time of the earnings report. Source: Thomson Reuters I/B/E/S and Yardeni Research, Inc.
Table 1A: S&P 500 Earnings Surprise (as of May 29, 2018)
Table 1B: S&P 500 Revenue Surprise
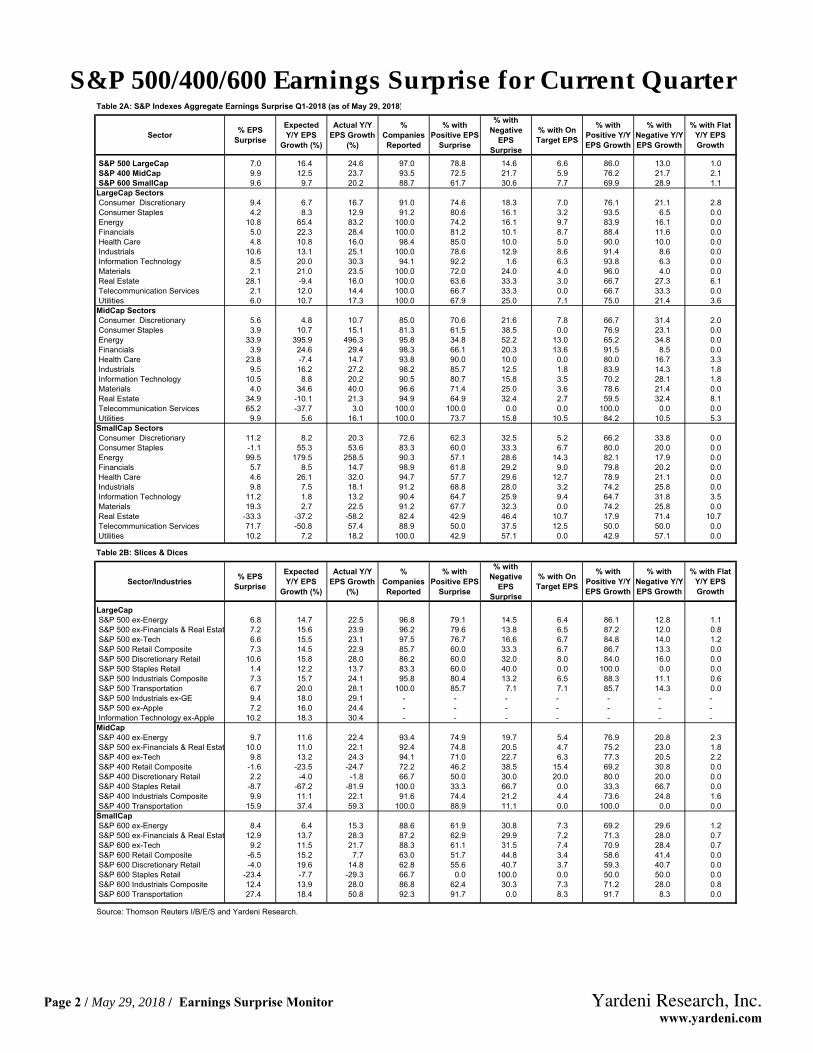
S&P 500/400/600 Earnings Surprise for Current Quarter
Page 2 / May 29, 2018 / Earnings Surprise Monitor www.yardeni.com
Yardeni Research, Inc.
S&P 500/400/600 Earnings Surprise for Current Quarter
Page 2 / May 29, 2018 / Earnings Surprise Monitor www.yardeni.com
Yardeni Research, Inc.
Table 2A: S&P Indexes Aggregate Earnings Surprise Q1-2018 (as of May 29, 2018)
Sector % EPS Surprise
ExpectedY/Y EPS
Growth (%)
Actual Y/Y EPS Growth
(%)
%CompaniesReported
% with Positive EPS
Surprise
% with Negative
EPSSurprise
% with On Target EPS
% with Positive Y/Y EPS Growth
% with Negative Y/Y EPS Growth
% with Flat Y/Y EPS Growth
S&P 500 LargeCap 7.0 16.4 24.6 97.0 78.8 14.6 6.6 86.0 13.0 1.0 S&P 400 MidCap 9.9 12.5 23.7 93.5 72.5 21.7 5.9 76.2 21.7 2.1 S&P 600 SmallCap 9.6 9.7 20.2 88.7 61.7 30.6 7.7 69.9 28.9 1.1LargeCap Sectors Consumer Discretionary 9.4 6.7 16.7 91.0 74.6 18.3 7.0 76.1 21.1 2.8 Consumer Staples 4.2 8.3 12.9 91.2 80.6 16.1 3.2 93.5 6.5 0.0 Energy 10.8 65.4 83.2 100.0 74.2 16.1 9.7 83.9 16.1 0.0 Financials 5.0 22.3 28.4 100.0 81.2 10.1 8.7 88.4 11.6 0.0 Health Care 4.8 10.8 16.0 98.4 85.0 10.0 5.0 90.0 10.0 0.0 Industrials 10.6 13.1 25.1 100.0 78.6 12.9 8.6 91.4 8.6 0.0 Information Technology 8.5 20.0 30.3 94.1 92.2 1.6 6.3 93.8 6.3 0.0 Materials 2.1 21.0 23.5 100.0 72.0 24.0 4.0 96.0 4.0 0.0 Real Estate 28.1 -9.4 16.0 100.0 63.6 33.3 3.0 66.7 27.3 6.1 Telecommunication Services 2.1 12.0 14.4 100.0 66.7 33.3 0.0 66.7 33.3 0.0 Utilities 6.0 10.7 17.3 100.0 67.9 25.0 7.1 75.0 21.4 3.6MidCap Sectors Consumer Discretionary 5.6 4.8 10.7 85.0 70.6 21.6 7.8 66.7 31.4 2.0 Consumer Staples 3.9 10.7 15.1 81.3 61.5 38.5 0.0 76.9 23.1 0.0 Energy 33.9 395.9 496.3 95.8 34.8 52.2 13.0 65.2 34.8 0.0 Financials 3.9 24.6 29.4 98.3 66.1 20.3 13.6 91.5 8.5 0.0 Health Care 23.8 -7.4 14.7 93.8 90.0 10.0 0.0 80.0 16.7 3.3 Industrials 9.5 16.2 27.2 98.2 85.7 12.5 1.8 83.9 14.3 1.8 Information Technology 10.5 8.8 20.2 90.5 80.7 15.8 3.5 70.2 28.1 1.8 Materials 4.0 34.6 40.0 96.6 71.4 25.0 3.6 78.6 21.4 0.0 Real Estate 34.9 -10.1 21.3 94.9 64.9 32.4 2.7 59.5 32.4 8.1 Telecommunication Services 65.2 -37.7 3.0 100.0 100.0 0.0 0.0 100.0 0.0 0.0 Utilities 9.9 5.6 16.1 100.0 73.7 15.8 10.5 84.2 10.5 5.3SmallCap Sectors Consumer Discretionary 11.2 8.2 20.3 72.6 62.3 32.5 5.2 66.2 33.8 0.0 Consumer Staples -1.1 55.3 53.6 83.3 60.0 33.3 6.7 80.0 20.0 0.0 Energy 99.5 179.5 258.5 90.3 57.1 28.6 14.3 82.1 17.9 0.0 Financials 5.7 8.5 14.7 98.9 61.8 29.2 9.0 79.8 20.2 0.0 Health Care 4.6 26.1 32.0 94.7 57.7 29.6 12.7 78.9 21.1 0.0 Industrials 9.8 7.5 18.1 91.2 68.8 28.0 3.2 74.2 25.8 0.0 Information Technology 11.2 1.8 13.2 90.4 64.7 25.9 9.4 64.7 31.8 3.5 Materials 19.3 2.7 22.5 91.2 67.7 32.3 0.0 74.2 25.8 0.0 Real Estate -33.3 -37.2 -58.2 82.4 42.9 46.4 10.7 17.9 71.4 10.7 Telecommunication Services 71.7 -50.8 57.4 88.9 50.0 37.5 12.5 50.0 50.0 0.0 Utilities 10.2 7.2 18.2 100.0 42.9 57.1 0.0 42.9 57.1 0.0
Table 2B: Slices & Dices
Sector/Industries % EPS Surprise
ExpectedY/Y EPS
Growth (%)
Actual Y/Y EPS Growth
(%)
%CompaniesReported
% with Positive EPS
Surprise
% with Negative
EPSSurprise
% with On Target EPS
% with Positive Y/Y EPS Growth
% with Negative Y/Y EPS Growth
% with Flat Y/Y EPS Growth
LargeCap S&P 500 ex-Energy 6.8 14.7 22.5 96.8 79.1 14.5 6.4 86.1 12.8 1.1 S&P 500 ex-Financials & Real Estat 7.2 15.6 23.9 96.2 79.6 13.8 6.5 87.2 12.0 0.8 S&P 500 ex-Tech 6.6 15.5 23.1 97.5 76.7 16.6 6.7 84.8 14.0 1.2 S&P 500 Retail Composite 7.3 14.5 22.9 85.7 60.0 33.3 6.7 86.7 13.3 0.0 S&P 500 Discretionary Retail 10.6 15.8 28.0 86.2 60.0 32.0 8.0 84.0 16.0 0.0 S&P 500 Staples Retail 1.4 12.2 13.7 83.3 60.0 40.0 0.0 100.0 0.0 0.0 S&P 500 Industrials Composite 7.3 15.7 24.1 95.8 80.4 13.2 6.5 88.3 11.1 0.6 S&P 500 Transportation 6.7 20.0 28.1 100.0 85.7 7.1 7.1 85.7 14.3 0.0 S&P 500 Industrials ex-GE 9.4 18.0 29.1 - - - - - - - S&P 500 ex-Apple 7.2 16.0 24.4 - - - - - - - Information Technology ex-Apple 10.2 18.3 30.4 - - - - - - -MidCap S&P 400 ex-Energy 9.7 11.6 22.4 93.4 74.9 19.7 5.4 76.9 20.8 2.3 S&P 500 ex-Financials & Real Estat 10.0 11.0 22.1 92.4 74.8 20.5 4.7 75.2 23.0 1.8 S&P 400 ex-Tech 9.8 13.2 24.3 94.1 71.0 22.7 6.3 77.3 20.5 2.2 S&P 400 Retail Composite -1.6 -23.5 -24.7 72.2 46.2 38.5 15.4 69.2 30.8 0.0 S&P 400 Discretionary Retail 2.2 -4.0 -1.8 66.7 50.0 30.0 20.0 80.0 20.0 0.0 S&P 400 Staples Retail -8.7 -67.2 -81.9 100.0 33.3 66.7 0.0 33.3 66.7 0.0 S&P 400 Industrials Composite 9.9 11.1 22.1 91.6 74.4 21.2 4.4 73.6 24.8 1.6 S&P 400 Transportation 15.9 37.4 59.3 100.0 88.9 11.1 0.0 100.0 0.0 0.0SmallCap S&P 600 ex-Energy 8.4 6.4 15.3 88.6 61.9 30.8 7.3 69.2 29.6 1.2 S&P 500 ex-Financials & Real Estat 12.9 13.7 28.3 87.2 62.9 29.9 7.2 71.3 28.0 0.7 S&P 600 ex-Tech 9.2 11.5 21.7 88.3 61.1 31.5 7.4 70.9 28.4 0.7 S&P 600 Retail Composite -6.5 15.2 7.7 63.0 51.7 44.8 3.4 58.6 41.4 0.0 S&P 600 Discretionary Retail -4.0 19.6 14.8 62.8 55.6 40.7 3.7 59.3 40.7 0.0 S&P 600 Staples Retail -23.4 -7.7 -29.3 66.7 0.0 100.0 0.0 50.0 50.0 0.0 S&P 600 Industrials Composite 12.4 13.9 28.0 86.8 62.4 30.3 7.3 71.2 28.0 0.8 S&P 600 Transportation 27.4 18.4 50.8 92.3 91.7 0.0 8.3 91.7 8.3 0.0
Source: Thomson Reuters I/B/E/S and Yardeni Research.
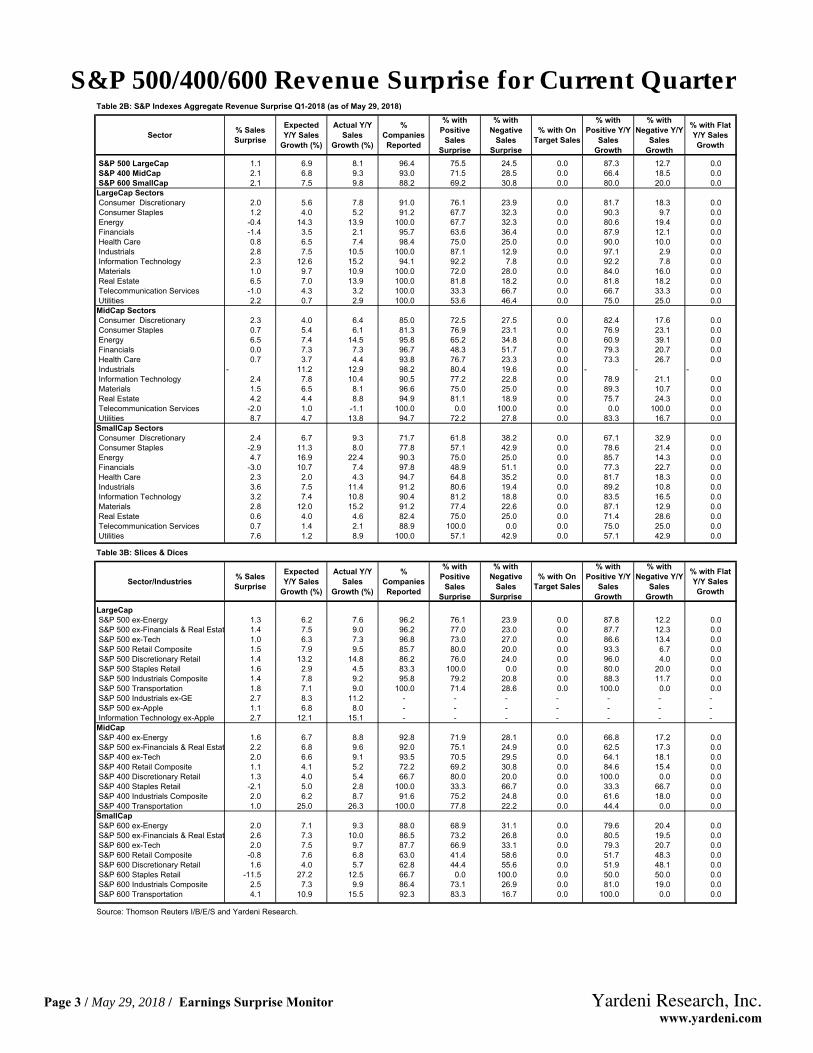
S&P 500/400/600 Revenue Surprise for Current Quarter
Page 3 / May 29, 2018 / Earnings Surprise Monitor www.yardeni.com
Yardeni Research, Inc.
S&P 500/400/600 Revenue Surprise for Current Quarter
Page 3 / May 29, 2018 / Earnings Surprise Monitor www.yardeni.com
Yardeni Research, Inc.
Table 2B: S&P Indexes Aggregate Revenue Surprise Q1-2018 (as of May 29, 2018)
Sector % Sales Surprise
ExpectedY/Y Sales
Growth (%)
Actual Y/Y Sales
Growth (%)
%CompaniesReported
% with Positive
SalesSurprise
% with Negative
SalesSurprise
% with On Target Sales
% with Positive Y/Y
SalesGrowth
% with Negative Y/Y
SalesGrowth
% with Flat Y/Y Sales Growth
S&P 500 LargeCap 1.1 6.9 8.1 96.4 75.5 24.5 0.0 87.3 12.7 0.0 S&P 400 MidCap 2.1 6.8 9.3 93.0 71.5 28.5 0.0 66.4 18.5 0.0 S&P 600 SmallCap 2.1 7.5 9.8 88.2 69.2 30.8 0.0 80.0 20.0 0.0LargeCap Sectors Consumer Discretionary 2.0 5.6 7.8 91.0 76.1 23.9 0.0 81.7 18.3 0.0 Consumer Staples 1.2 4.0 5.2 91.2 67.7 32.3 0.0 90.3 9.7 0.0 Energy -0.4 14.3 13.9 100.0 67.7 32.3 0.0 80.6 19.4 0.0 Financials -1.4 3.5 2.1 95.7 63.6 36.4 0.0 87.9 12.1 0.0 Health Care 0.8 6.5 7.4 98.4 75.0 25.0 0.0 90.0 10.0 0.0 Industrials 2.8 7.5 10.5 100.0 87.1 12.9 0.0 97.1 2.9 0.0 Information Technology 2.3 12.6 15.2 94.1 92.2 7.8 0.0 92.2 7.8 0.0 Materials 1.0 9.7 10.9 100.0 72.0 28.0 0.0 84.0 16.0 0.0 Real Estate 6.5 7.0 13.9 100.0 81.8 18.2 0.0 81.8 18.2 0.0 Telecommunication Services -1.0 4.3 3.2 100.0 33.3 66.7 0.0 66.7 33.3 0.0 Utilities 2.2 0.7 2.9 100.0 53.6 46.4 0.0 75.0 25.0 0.0MidCap Sectors Consumer Discretionary 2.3 4.0 6.4 85.0 72.5 27.5 0.0 82.4 17.6 0.0 Consumer Staples 0.7 5.4 6.1 81.3 76.9 23.1 0.0 76.9 23.1 0.0 Energy 6.5 7.4 14.5 95.8 65.2 34.8 0.0 60.9 39.1 0.0 Financials 0.0 7.3 7.3 96.7 48.3 51.7 0.0 79.3 20.7 0.0 Health Care 0.7 3.7 4.4 93.8 76.7 23.3 0.0 73.3 26.7 0.0 Industrials - 11.2 12.9 98.2 80.4 19.6 0.0 - - - Information Technology 2.4 7.8 10.4 90.5 77.2 22.8 0.0 78.9 21.1 0.0 Materials 1.5 6.5 8.1 96.6 75.0 25.0 0.0 89.3 10.7 0.0 Real Estate 4.2 4.4 8.8 94.9 81.1 18.9 0.0 75.7 24.3 0.0 Telecommunication Services -2.0 1.0 -1.1 100.0 0.0 100.0 0.0 0.0 100.0 0.0 Utilities 8.7 4.7 13.8 94.7 72.2 27.8 0.0 83.3 16.7 0.0SmallCap Sectors Consumer Discretionary 2.4 6.7 9.3 71.7 61.8 38.2 0.0 67.1 32.9 0.0 Consumer Staples -2.9 11.3 8.0 77.8 57.1 42.9 0.0 78.6 21.4 0.0 Energy 4.7 16.9 22.4 90.3 75.0 25.0 0.0 85.7 14.3 0.0 Financials -3.0 10.7 7.4 97.8 48.9 51.1 0.0 77.3 22.7 0.0 Health Care 2.3 2.0 4.3 94.7 64.8 35.2 0.0 81.7 18.3 0.0 Industrials 3.6 7.5 11.4 91.2 80.6 19.4 0.0 89.2 10.8 0.0 Information Technology 3.2 7.4 10.8 90.4 81.2 18.8 0.0 83.5 16.5 0.0 Materials 2.8 12.0 15.2 91.2 77.4 22.6 0.0 87.1 12.9 0.0 Real Estate 0.6 4.0 4.6 82.4 75.0 25.0 0.0 71.4 28.6 0.0 Telecommunication Services 0.7 1.4 2.1 88.9 100.0 0.0 0.0 75.0 25.0 0.0 Utilities 7.6 1.2 8.9 100.0 57.1 42.9 0.0 57.1 42.9 0.0
Table 3B: Slices & Dices
Sector/Industries % Sales Surprise
ExpectedY/Y Sales
Growth (%)
Actual Y/Y Sales
Growth (%)
%CompaniesReported
% with Positive
SalesSurprise
% with Negative
SalesSurprise
% with On Target Sales
% with Positive Y/Y
SalesGrowth
% with Negative Y/Y
SalesGrowth
% with Flat Y/Y Sales Growth
LargeCap S&P 500 ex-Energy 1.3 6.2 7.6 96.2 76.1 23.9 0.0 87.8 12.2 0.0 S&P 500 ex-Financials & Real Estat 1.4 7.5 9.0 96.2 77.0 23.0 0.0 87.7 12.3 0.0 S&P 500 ex-Tech 1.0 6.3 7.3 96.8 73.0 27.0 0.0 86.6 13.4 0.0 S&P 500 Retail Composite 1.5 7.9 9.5 85.7 80.0 20.0 0.0 93.3 6.7 0.0 S&P 500 Discretionary Retail 1.4 13.2 14.8 86.2 76.0 24.0 0.0 96.0 4.0 0.0 S&P 500 Staples Retail 1.6 2.9 4.5 83.3 100.0 0.0 0.0 80.0 20.0 0.0 S&P 500 Industrials Composite 1.4 7.8 9.2 95.8 79.2 20.8 0.0 88.3 11.7 0.0 S&P 500 Transportation 1.8 7.1 9.0 100.0 71.4 28.6 0.0 100.0 0.0 0.0 S&P 500 Industrials ex-GE 2.7 8.3 11.2 - - - - - - - S&P 500 ex-Apple 1.1 6.8 8.0 - - - - - - - Information Technology ex-Apple 2.7 12.1 15.1 - - - - - - -MidCap S&P 400 ex-Energy 1.6 6.7 8.8 92.8 71.9 28.1 0.0 66.8 17.2 0.0 S&P 500 ex-Financials & Real Estat 2.2 6.8 9.6 92.0 75.1 24.9 0.0 62.5 17.3 0.0 S&P 400 ex-Tech 2.0 6.6 9.1 93.5 70.5 29.5 0.0 64.1 18.1 0.0 S&P 400 Retail Composite 1.1 4.1 5.2 72.2 69.2 30.8 0.0 84.6 15.4 0.0 S&P 400 Discretionary Retail 1.3 4.0 5.4 66.7 80.0 20.0 0.0 100.0 0.0 0.0 S&P 400 Staples Retail -2.1 5.0 2.8 100.0 33.3 66.7 0.0 33.3 66.7 0.0 S&P 400 Industrials Composite 2.0 6.2 8.7 91.6 75.2 24.8 0.0 61.6 18.0 0.0 S&P 400 Transportation 1.0 25.0 26.3 100.0 77.8 22.2 0.0 44.4 0.0 0.0SmallCap S&P 600 ex-Energy 2.0 7.1 9.3 88.0 68.9 31.1 0.0 79.6 20.4 0.0 S&P 500 ex-Financials & Real Estat 2.6 7.3 10.0 86.5 73.2 26.8 0.0 80.5 19.5 0.0 S&P 600 ex-Tech 2.0 7.5 9.7 87.7 66.9 33.1 0.0 79.3 20.7 0.0 S&P 600 Retail Composite -0.8 7.6 6.8 63.0 41.4 58.6 0.0 51.7 48.3 0.0 S&P 600 Discretionary Retail 1.6 4.0 5.7 62.8 44.4 55.6 0.0 51.9 48.1 0.0 S&P 600 Staples Retail -11.5 27.2 12.5 66.7 0.0 100.0 0.0 50.0 50.0 0.0 S&P 600 Industrials Composite 2.5 7.3 9.9 86.4 73.1 26.9 0.0 81.0 19.0 0.0 S&P 600 Transportation 4.1 10.9 15.5 92.3 83.3 16.7 0.0 100.0 0.0 0.0
Source: Thomson Reuters I/B/E/S and Yardeni Research.
S&P 500/400/600 Change in Shares Outstanding
Page 4 / May 29, 2018 / Earnings Surprise Monitor www.yardeni.com
Yardeni Research, Inc.
S&P 500/400/600 Change in Shares Outstanding
Page 4 / May 29, 2018 / Earnings Surprise Monitor www.yardeni.com
Yardeni Research, Inc.
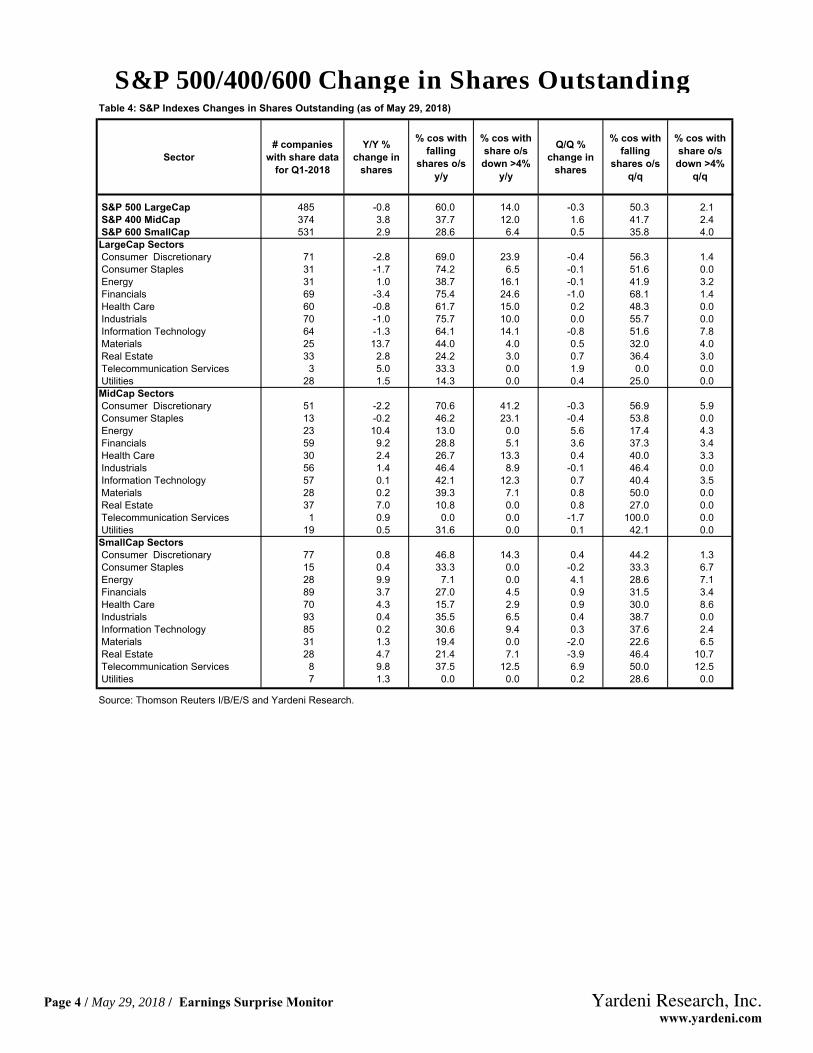
Table 4: S&P Indexes Changes in Shares Outstanding (as of May 29, 2018)
Sector# companies
with share data for Q1-2018
Y/Y % change in
shares
% cos with falling
shares o/s y/y
% cos with share o/s down >4%
y/y
Q/Q % change in
shares
% cos with falling
shares o/s q/q
% cos with share o/s down >4%
q/q
S&P 500 LargeCap 485 -0.8 60.0 14.0 -0.3 50.3 2.1 S&P 400 MidCap 374 3.8 37.7 12.0 1.6 41.7 2.4 S&P 600 SmallCap 531 2.9 28.6 6.4 0.5 35.8 4.0LargeCap Sectors Consumer Discretionary 71 -2.8 69.0 23.9 -0.4 56.3 1.4 Consumer Staples 31 -1.7 74.2 6.5 -0.1 51.6 0.0 Energy 31 1.0 38.7 16.1 -0.1 41.9 3.2 Financials 69 -3.4 75.4 24.6 -1.0 68.1 1.4 Health Care 60 -0.8 61.7 15.0 0.2 48.3 0.0 Industrials 70 -1.0 75.7 10.0 0.0 55.7 0.0 Information Technology 64 -1.3 64.1 14.1 -0.8 51.6 7.8 Materials 25 13.7 44.0 4.0 0.5 32.0 4.0 Real Estate 33 2.8 24.2 3.0 0.7 36.4 3.0 Telecommunication Services 3 5.0 33.3 0.0 1.9 0.0 0.0 Utilities 28 1.5 14.3 0.0 0.4 25.0 0.0MidCap Sectors Consumer Discretionary 51 -2.2 70.6 41.2 -0.3 56.9 5.9 Consumer Staples 13 -0.2 46.2 23.1 -0.4 53.8 0.0 Energy 23 10.4 13.0 0.0 5.6 17.4 4.3 Financials 59 9.2 28.8 5.1 3.6 37.3 3.4 Health Care 30 2.4 26.7 13.3 0.4 40.0 3.3 Industrials 56 1.4 46.4 8.9 -0.1 46.4 0.0 Information Technology 57 0.1 42.1 12.3 0.7 40.4 3.5 Materials 28 0.2 39.3 7.1 0.8 50.0 0.0 Real Estate 37 7.0 10.8 0.0 0.8 27.0 0.0 Telecommunication Services 1 0.9 0.0 0.0 -1.7 100.0 0.0 Utilities 19 0.5 31.6 0.0 0.1 42.1 0.0SmallCap Sectors Consumer Discretionary 77 0.8 46.8 14.3 0.4 44.2 1.3 Consumer Staples 15 0.4 33.3 0.0 -0.2 33.3 6.7 Energy 28 9.9 7.1 0.0 4.1 28.6 7.1 Financials 89 3.7 27.0 4.5 0.9 31.5 3.4 Health Care 70 4.3 15.7 2.9 0.9 30.0 8.6 Industrials 93 0.4 35.5 6.5 0.4 38.7 0.0 Information Technology 85 0.2 30.6 9.4 0.3 37.6 2.4 Materials 31 1.3 19.4 0.0 -2.0 22.6 6.5 Real Estate 28 4.7 21.4 7.1 -3.9 46.4 10.7 Telecommunication Services 8 9.8 37.5 12.5 6.9 50.0 12.5 Utilities 7 1.3 0.0 0.0 0.2 28.6 0.0
Source: Thomson Reuters I/B/E/S and Yardeni Research.
2009 2010 2011 2012 2013 2014 2015 2016 2017 2018-2.0
-1.5
-1.0
-.5
.0
.5
1.0
1.5
2.0
2.5
3.0
3.5
-2.0
-1.5
-1.0
-.5
.0
.5
1.0
1.5
2.0
2.5
3.0
3.5
Q1
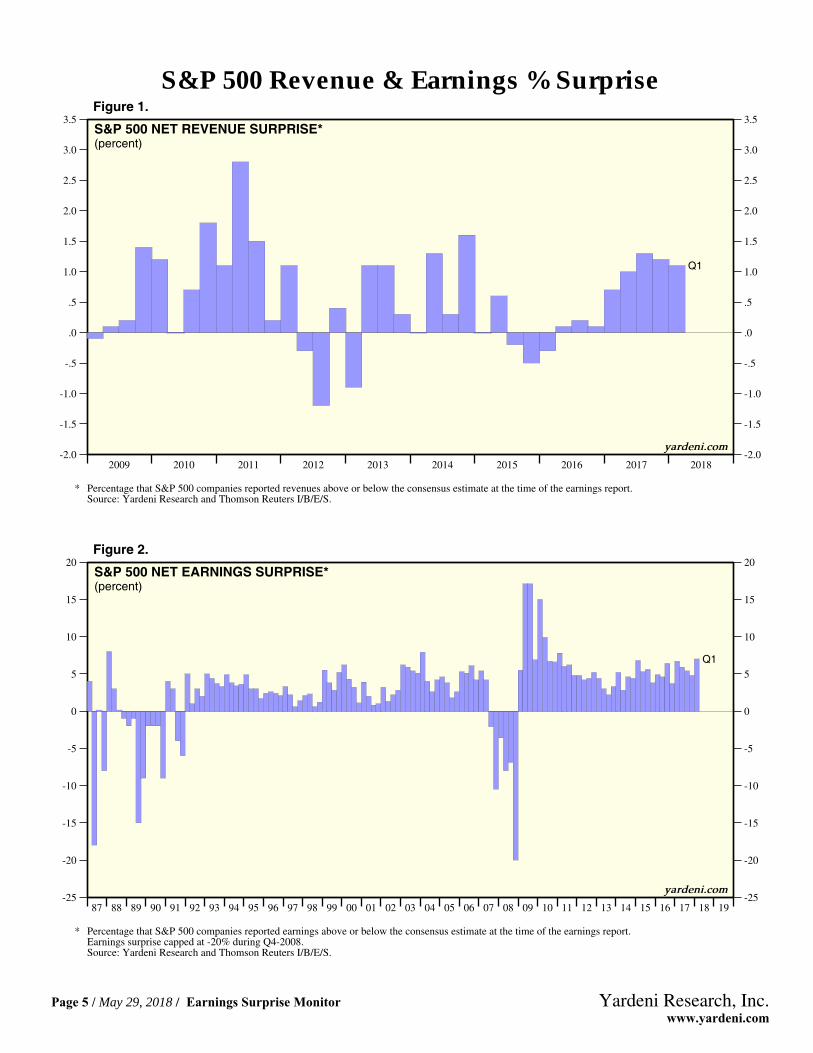
S&P 500 NET REVENUE SURPRISE*(percent)
* Percentage that S&P 500 companies reported revenues above or below the consensus estimate at the time of the earnings report.Source: Yardeni Research and Thomson Reuters I/B/E/S.
yardeni.com
Figure 1.
87 88 89 90 91 92 93 94 95 96 97 98 99 00 01 02 03 04 05 06 07 08 09 10 11 12 13 14 15 16 17 18 19-25
-20
-15
-10
-5
0
5
10
15
20
-25
-20
-15
-10
-5
0
5
10
15
20
Q1
S&P 500 NET EARNINGS SURPRISE*(percent)
* Percentage that S&P 500 companies reported earnings above or below the consensus estimate at the time of the earnings report.Earnings surprise capped at -20% during Q4-2008.Source: Yardeni Research and Thomson Reuters I/B/E/S.
yardeni.com
Figure 2.
S&P 500 Revenue & Earnings % Surprise
Page 5 / May 29, 2018 / Earnings Surprise Monitor www.yardeni.com
Yardeni Research, Inc.
2009 2010 2011 2012 2013 2014 2015 2016 2017 2018-80
-60
-40
-20
0
20
40
60
80
100
-80
-60
-40
-20
0
20
40
60
80
100
Q1
Q1
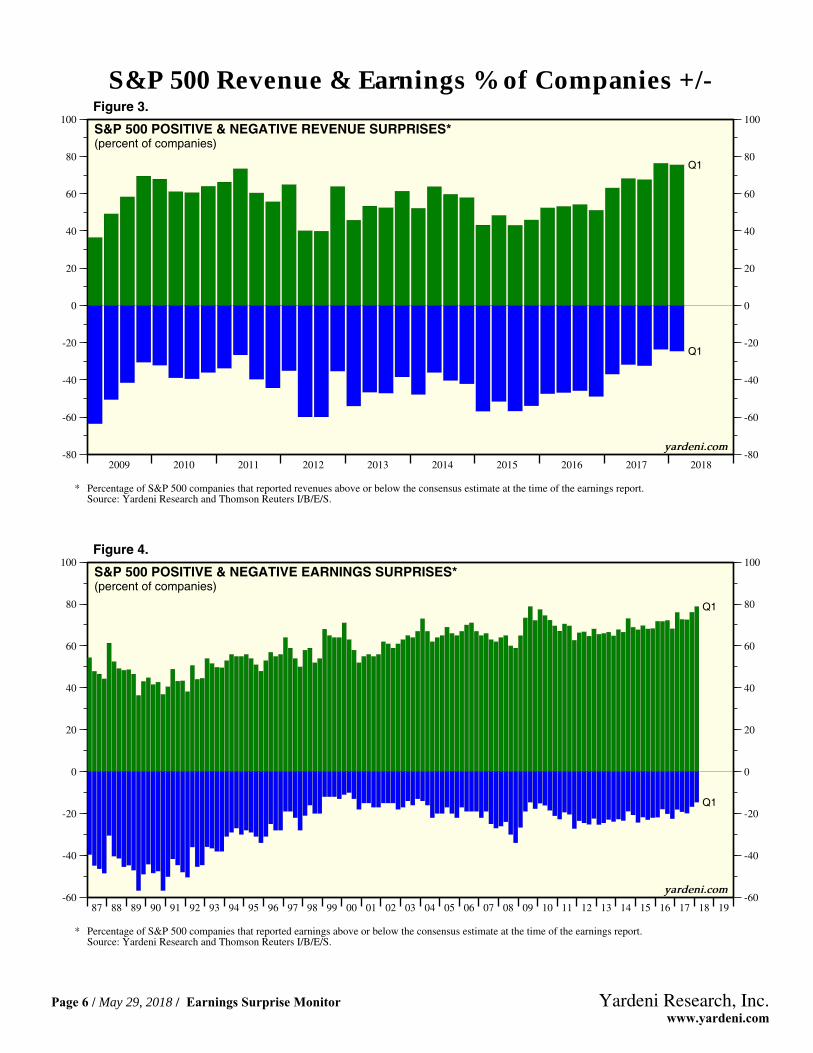
S&P 500 POSITIVE & NEGATIVE REVENUE SURPRISES*(percent of companies)
* Percentage of S&P 500 companies that reported revenues above or below the consensus estimate at the time of the earnings report.Source: Yardeni Research and Thomson Reuters I/B/E/S.
yardeni.com
Figure 3.
87 88 89 90 91 92 93 94 95 96 97 98 99 00 01 02 03 04 05 06 07 08 09 10 11 12 13 14 15 16 17 18 19-60
-40
-20
0
20
40
60
80
100
-60
-40
-20
0
20
40
60
80
100
Q1
Q1
S&P 500 POSITIVE & NEGATIVE EARNINGS SURPRISES*(percent of companies)
* Percentage of S&P 500 companies that reported earnings above or below the consensus estimate at the time of the earnings report.Source: Yardeni Research and Thomson Reuters I/B/E/S.
yardeni.com
Figure 4.
S&P 500 Revenue & Earnings % of Companies +/-
Page 6 / May 29, 2018 / Earnings Surprise Monitor www.yardeni.com
Yardeni Research, Inc.
-6
-4
-2
0
2
4
6
8
10
-6
-4
-2
0
2
4
6
8
10
Q1
2011 2012 2013 2014 2015 2016 2017 2018-.8
-.6
-.4
-.2
.0
.2
.4
.6
.8
1.0
1.2
-.8
-.6
-.4
-.2
.0
.2
.4
.6
.8
1.0
1.2
Q1
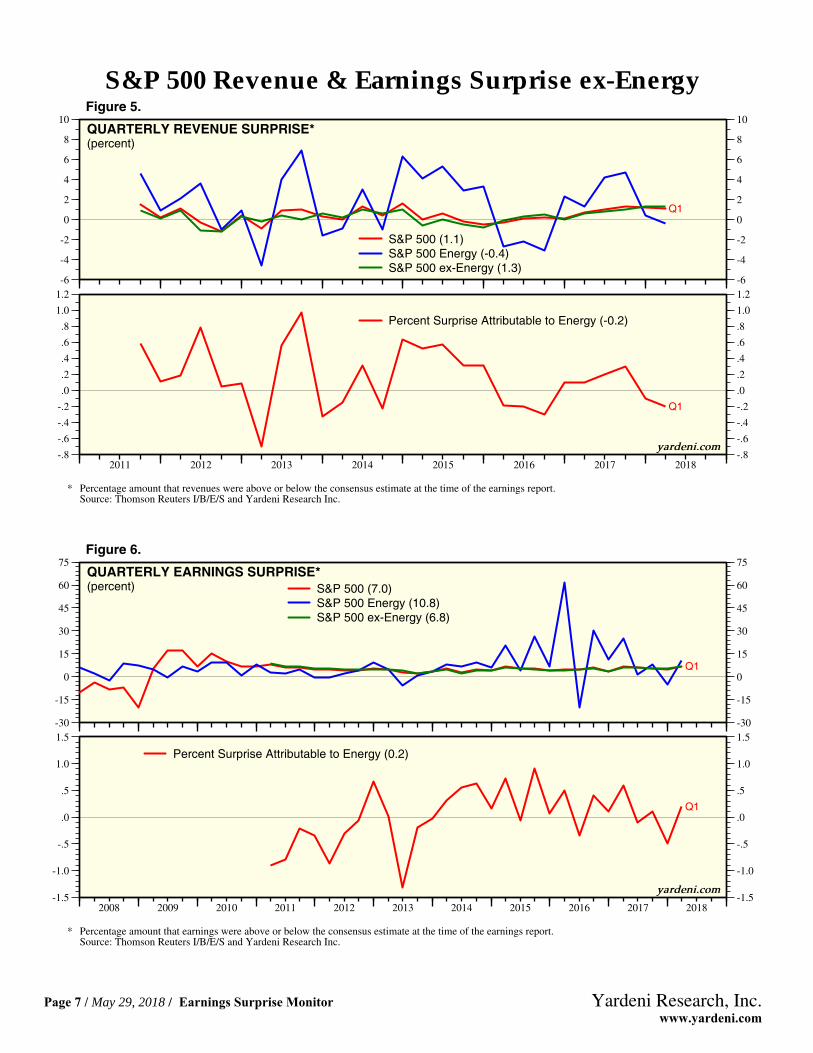
QUARTERLY REVENUE SURPRISE*(percent)
S&P 500 (1.1)S&P 500 Energy (-0.4)S&P 500 ex-Energy (1.3)
Percent Surprise Attributable to Energy (-0.2)
* Percentage amount that revenues were above or below the consensus estimate at the time of the earnings report.Source: Thomson Reuters I/B/E/S and Yardeni Research Inc.
yardeni.com
Figure 5.
-30
-15
0
15
30
45
60
75
-30
-15
0
15
30
45
60
75
Q1
2008 2009 2010 2011 2012 2013 2014 2015 2016 2017 2018-1.5
-1.0
-.5
.0
.5
1.0
1.5
-1.5
-1.0
-.5
.0
.5
1.0
1.5
Q1
QUARTERLY EARNINGS SURPRISE*(percent) S&P 500 (7.0)
S&P 500 Energy (10.8)S&P 500 ex-Energy (6.8)
Percent Surprise Attributable to Energy (0.2)
* Percentage amount that earnings were above or below the consensus estimate at the time of the earnings report.Source: Thomson Reuters I/B/E/S and Yardeni Research Inc.
yardeni.com
Figure 6.
S&P 500 Revenue & Earnings Surprise ex-Energy
Page 7 / May 29, 2018 / Earnings Surprise Monitor www.yardeni.com
Yardeni Research, Inc.
-2
-1
0
1
2
3
4
5
-2
-1
0
1
2
3
4
5
Q1
2011 2012 2013 2014 2015 2016 2017 2018-.6
-.4
-.2
.0
.2
.4
.6
-.6
-.4
-.2
.0
.2
.4
.6
Q1
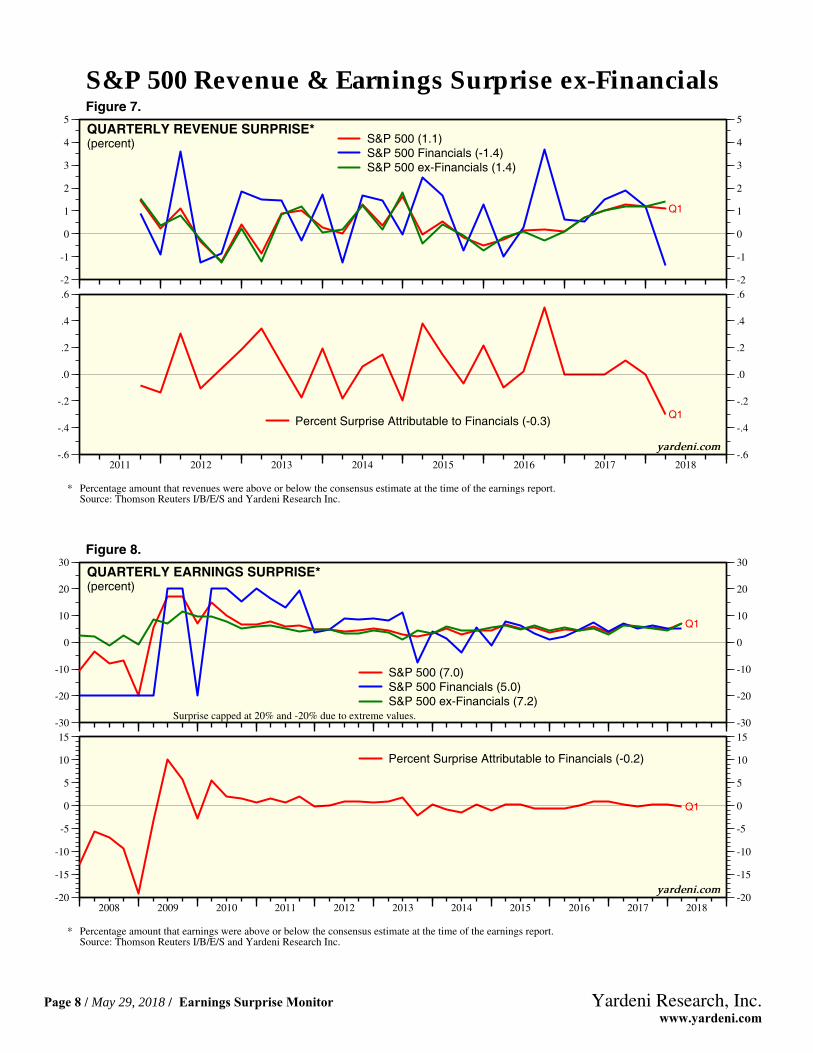
QUARTERLY REVENUE SURPRISE*(percent) S&P 500 (1.1)
S&P 500 Financials (-1.4)S&P 500 ex-Financials (1.4)
Percent Surprise Attributable to Financials (-0.3)
* Percentage amount that revenues were above or below the consensus estimate at the time of the earnings report.Source: Thomson Reuters I/B/E/S and Yardeni Research Inc.
yardeni.com
Figure 7.
-30
-20
-10
0
10
20
30
-30
-20
-10
0
10
20
30
Q1
2008 2009 2010 2011 2012 2013 2014 2015 2016 2017 2018-20
-15
-10
-5
0
5
10
15
-20
-15
-10
-5
0
5
10
15
Q1
QUARTERLY EARNINGS SURPRISE*(percent)
S&P 500 (7.0)S&P 500 Financials (5.0)S&P 500 ex-Financials (7.2)
Percent Surprise Attributable to Financials (-0.2)
Surprise capped at 20% and -20% due to extreme values.
* Percentage amount that earnings were above or below the consensus estimate at the time of the earnings report.Source: Thomson Reuters I/B/E/S and Yardeni Research Inc.
yardeni.com
Figure 8.
S&P 500 Revenue & Earnings Surprise ex-Financials
Page 8 / May 29, 2018 / Earnings Surprise Monitor www.yardeni.com
Yardeni Research, Inc.
-40
-30
-20
-10
0
10
20
30
40
-40
-30
-20
-10
0
10
20
30
40
Q1
2011 2012 2013 2014 2015 2016 2017 2018-8
-6
-4
-2
0
2
4
-8
-6
-4
-2
0
2
4
Q1
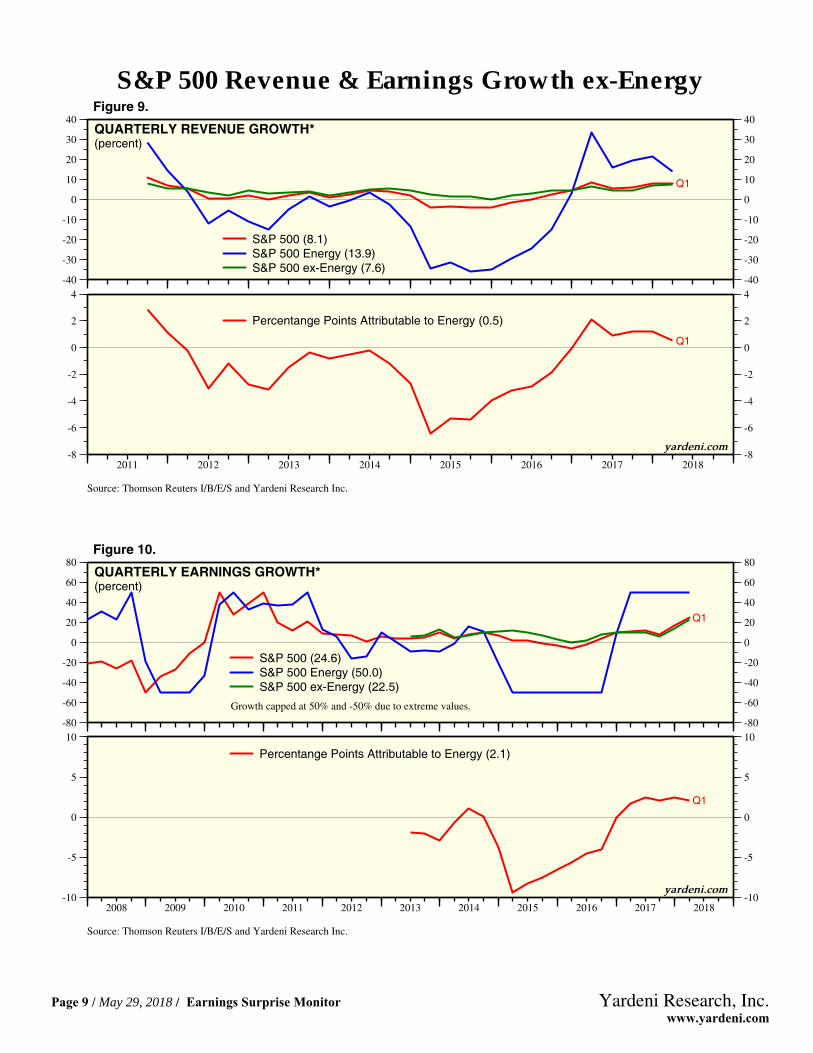
QUARTERLY REVENUE GROWTH*(percent)
S&P 500 (8.1)S&P 500 Energy (13.9)S&P 500 ex-Energy (7.6)
Percentange Points Attributable to Energy (0.5)
Source: Thomson Reuters I/B/E/S and Yardeni Research Inc.
yardeni.com
Figure 9.
-80
-60
-40
-20
0
20
40
60
80
-80
-60
-40
-20
0
20
40
60
80
Q1
2008 2009 2010 2011 2012 2013 2014 2015 2016 2017 2018-10
-5
0
5
10
-10
-5
0
5
10
Q1
QUARTERLY EARNINGS GROWTH*(percent)
S&P 500 (24.6)S&P 500 Energy (50.0)S&P 500 ex-Energy (22.5)
Percentange Points Attributable to Energy (2.1)
Growth capped at 50% and -50% due to extreme values.
Source: Thomson Reuters I/B/E/S and Yardeni Research Inc.
yardeni.com
Figure 10.
S&P 500 Revenue & Earnings Growth ex-Energy
Page 9 / May 29, 2018 / Earnings Surprise Monitor www.yardeni.com
Yardeni Research, Inc.
-10
-5
0
5
10
15
20
-10
-5
0
5
10
15
20
Q1
2011 2012 2013 2014 2015 2016 2017 2018-2.0
-1.5
-1.0
-.5
.0
.5
1.0
1.5
2.0
-2.0
-1.5
-1.0
-.5
.0
.5
1.0
1.5
2.0
Q1
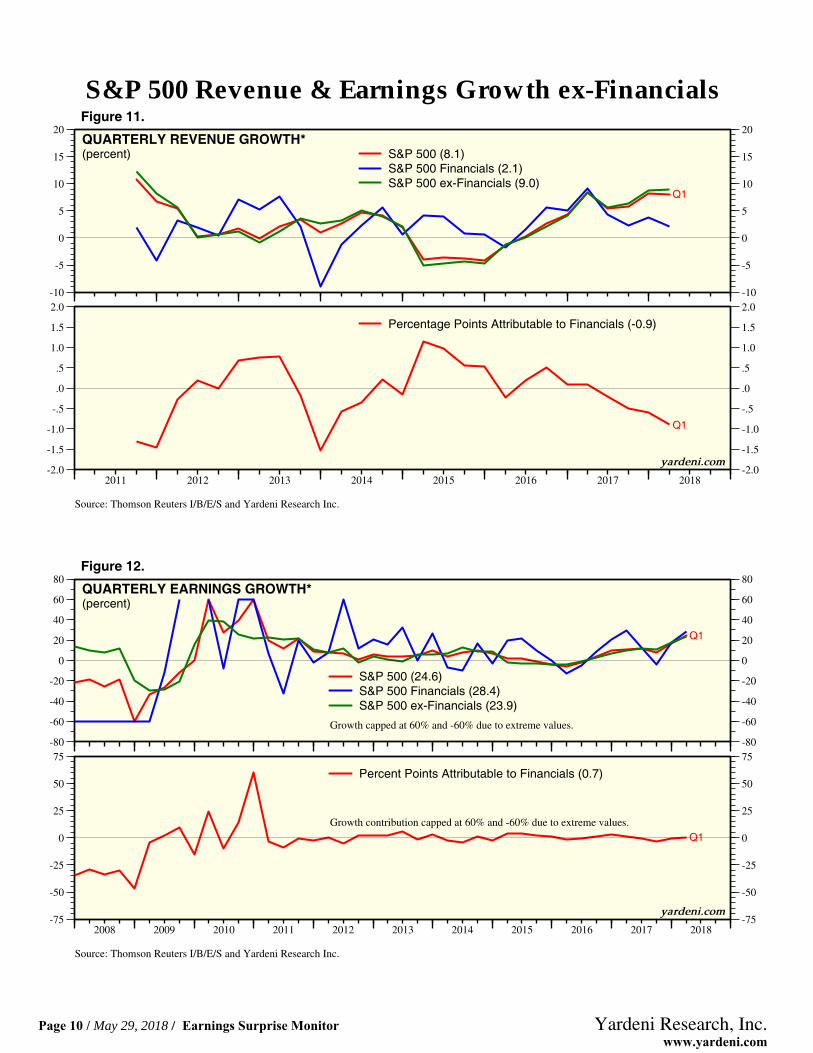
QUARTERLY REVENUE GROWTH*(percent) S&P 500 (8.1)
S&P 500 Financials (2.1)S&P 500 ex-Financials (9.0)
Percentage Points Attributable to Financials (-0.9)
Source: Thomson Reuters I/B/E/S and Yardeni Research Inc.
yardeni.com
Figure 11.
-80
-60
-40
-20
0
20
40
60
80
-80
-60
-40
-20
0
20
40
60
80
Q1
2008 2009 2010 2011 2012 2013 2014 2015 2016 2017 2018-75
-50
-25
0
25
50
75
-75
-50
-25
0
25
50
75
Q1
QUARTERLY EARNINGS GROWTH*(percent)
S&P 500 (24.6)S&P 500 Financials (28.4)S&P 500 ex-Financials (23.9)
Percent Points Attributable to Financials (0.7)
Growth capped at 60% and -60% due to extreme values.
Growth contribution capped at 60% and -60% due to extreme values.
Source: Thomson Reuters I/B/E/S and Yardeni Research Inc.
yardeni.com
Figure 12.
S&P 500 Revenue & Earnings Growth ex-Financials
Page 10 / May 29, 2018 / Earnings Surprise Monitor www.yardeni.com
Yardeni Research, Inc.

Figure 13.
2008 2009 2010 2011 2012 2013 2014 2015 2016 2017 2018 2019-100
-75
-50
-25
0
25
50
75
100
Q1
CONSUMER DISCRETIONARYearnings surprise (%)
2008 2009 2010 2011 2012 2013 2014 2015 2016 2017 2018 2019-50
0
50
100
150
200
Q1
CONSUMER DISCRETIONARY% of companies with positive and negative earningssurprise (percent)
2008 2009 2010 2011 2012 2013 2014 2015 2016 2017 2018 2019-2
0
2
4
6
8
10
Q1
CONSUMER STAPLES
2008 2009 2010 2011 2012 2013 2014 2015 2016 2017 2018 2019-50
-25
0
25
50
75
100
125
Q1
CONSUMER STAPLES
2008 2009 2010 2011 2012 2013 2014 2015 2016 2017 2018 2019-40
-20
0
20
40
60
80
Q1
ENERGY
2008 2009 2010 2011 2012 2013 2014 2015 2016 2017 2018 2019-50
-25
0
25
50
75
100
Q1ENERGY
2008 2009 2010 2011 2012 2013 2014 2015 2016 2017 2018 2019-75
-50
-25
0
25
50
75
Q1
FINANCIALS
2008 2009 2010 2011 2012 2013 2014 2015 2016 2017 2018 2019-75
-50
-25
0
25
50
75
100Q1FINANCIALS
2008 2009 2010 2011 2012 2013 2014 2015 2016 2017 2018 2019-2
0
2
4
6
8
10
12
14
Q1
HEALTH CARE
Source: Yardeni Research and Thomson Reuters I/B/E/S.
2008 2009 2010 2011 2012 2013 2014 2015 2016 2017 2018 2019-50
-25
0
25
50
75
100
125
Q1
HEALTH CARE
yardeni.com
S&P 500 Sectors Quarterly Earnings Surprises
Page 11 / May 29, 2018 / Earnings Surprise Monitor www.yardeni.com
Yardeni Research, Inc.
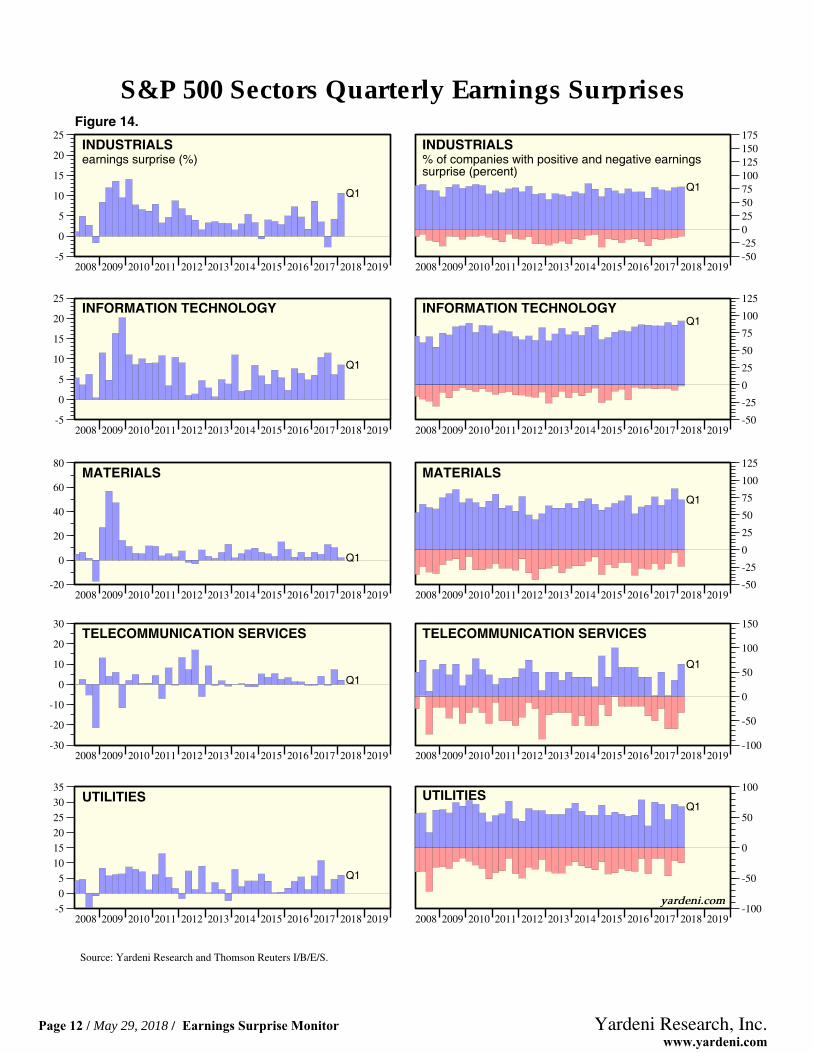
Figure 14.
2008 2009 2010 2011 2012 2013 2014 2015 2016 2017 2018 2019-5
0
5
10
15
20
25
Q1
INDUSTRIALSearnings surprise (%)
2008 2009 2010 2011 2012 2013 2014 2015 2016 2017 2018 2019-50-250255075100125150175
Q1
INDUSTRIALS% of companies with positive and negative earningssurprise (percent)
2008 2009 2010 2011 2012 2013 2014 2015 2016 2017 2018 2019-5
0
5
10
15
20
25
Q1
INFORMATION TECHNOLOGY
2008 2009 2010 2011 2012 2013 2014 2015 2016 2017 2018 2019-50
-25
0
25
50
75
100
125
Q1INFORMATION TECHNOLOGY
2008 2009 2010 2011 2012 2013 2014 2015 2016 2017 2018 2019-20
0
20
40
60
80
Q1
MATERIALS
2008 2009 2010 2011 2012 2013 2014 2015 2016 2017 2018 2019-50
-25
0
25
50
75
100
125
Q1
MATERIALS
2008 2009 2010 2011 2012 2013 2014 2015 2016 2017 2018 2019-30
-20
-10
0
10
20
30
Q1
TELECOMMUNICATION SERVICES
2008 2009 2010 2011 2012 2013 2014 2015 2016 2017 2018 2019-100
-50
0
50
100
150
Q1
TELECOMMUNICATION SERVICES
2008 2009 2010 2011 2012 2013 2014 2015 2016 2017 2018 2019-5
0
5
10
15
20
25
30
35
Q1
UTILITIES
Source: Yardeni Research and Thomson Reuters I/B/E/S.
2008 2009 2010 2011 2012 2013 2014 2015 2016 2017 2018 2019-100
-50
0
50
100
Q1UTILITIES
yardeni.com
S&P 500 Sectors Quarterly Earnings Surprises
Page 12 / May 29, 2018 / Earnings Surprise Monitor www.yardeni.com
Yardeni Research, Inc.
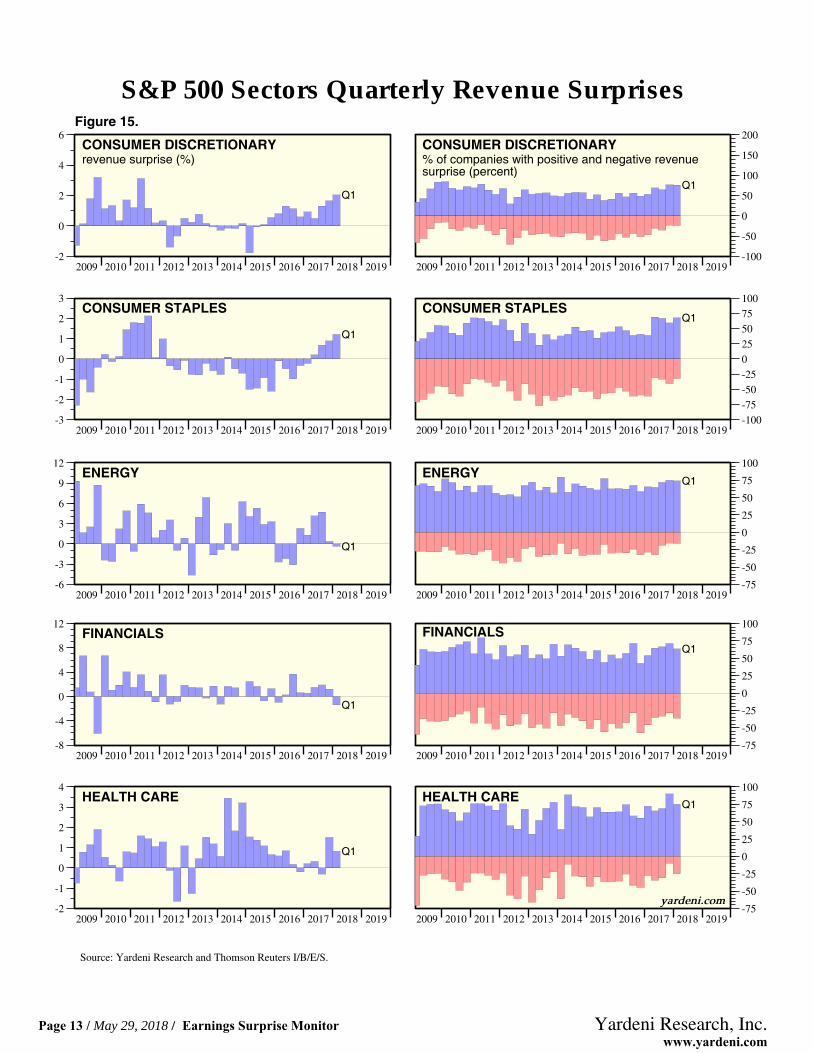
Figure 15.
2009 2010 2011 2012 2013 2014 2015 2016 2017 2018 2019-2
0
2
4
6
Q1
CONSUMER DISCRETIONARYrevenue surprise (%)
2009 2010 2011 2012 2013 2014 2015 2016 2017 2018 2019-100
-50
0
50
100
150
200
Q1
CONSUMER DISCRETIONARY% of companies with positive and negative revenuesurprise (percent)
2009 2010 2011 2012 2013 2014 2015 2016 2017 2018 2019-3
-2
-1
0
1
2
3
Q1
CONSUMER STAPLES
2009 2010 2011 2012 2013 2014 2015 2016 2017 2018 2019-100
-75
-50
-25
0
25
50
75
100
Q1CONSUMER STAPLES
2009 2010 2011 2012 2013 2014 2015 2016 2017 2018 2019-6
-3
0
3
6
9
12
Q1
ENERGY
2009 2010 2011 2012 2013 2014 2015 2016 2017 2018 2019-75
-50
-25
0
25
50
75
100
Q1ENERGY
2009 2010 2011 2012 2013 2014 2015 2016 2017 2018 2019-8
-4
0
4
8
12
Q1
FINANCIALS
2009 2010 2011 2012 2013 2014 2015 2016 2017 2018 2019-75
-50
-25
0
25
50
75
100
Q1FINANCIALS
2009 2010 2011 2012 2013 2014 2015 2016 2017 2018 2019-2
-1
0
1
2
3
4
Q1
HEALTH CARE
Source: Yardeni Research and Thomson Reuters I/B/E/S.
2009 2010 2011 2012 2013 2014 2015 2016 2017 2018 2019-75
-50
-25
0
25
50
75
100
Q1HEALTH CARE
yardeni.com
S&P 500 Sectors Quarterly Revenue Surprises
Page 13 / May 29, 2018 / Earnings Surprise Monitor www.yardeni.com
Yardeni Research, Inc.
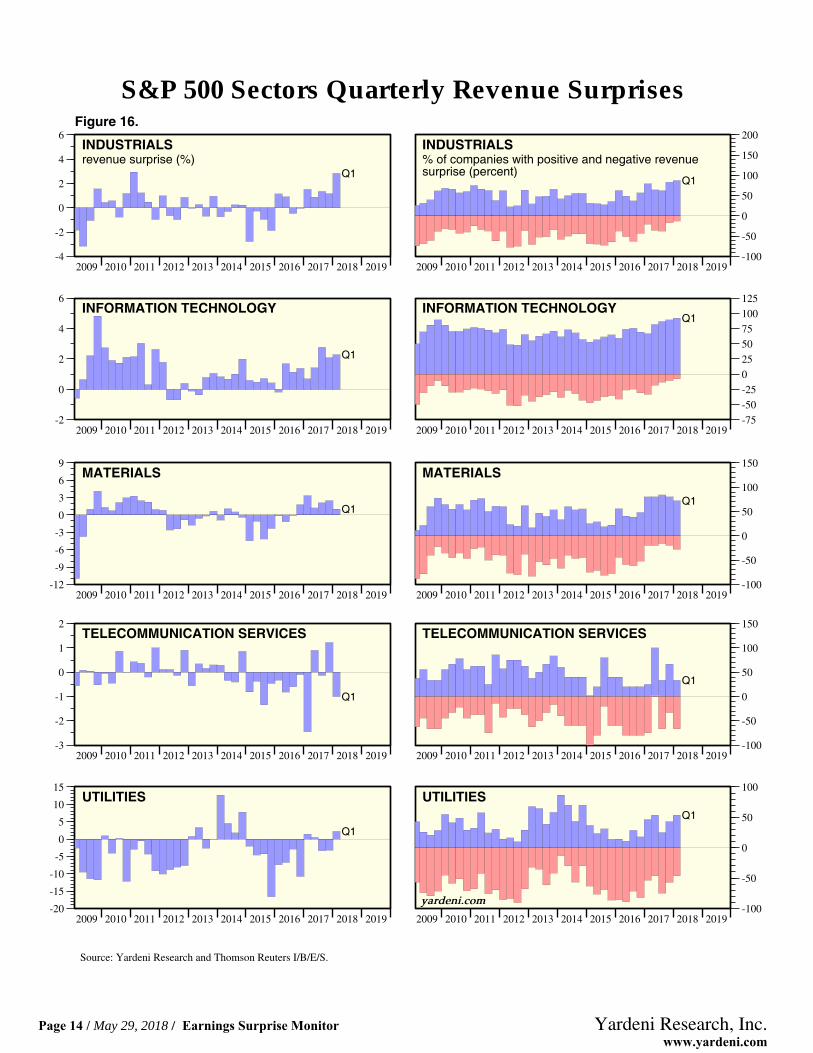
Figure 16.
2009 2010 2011 2012 2013 2014 2015 2016 2017 2018 2019-4
-2
0
2
4
6
Q1
INDUSTRIALSrevenue surprise (%)
2009 2010 2011 2012 2013 2014 2015 2016 2017 2018 2019-100
-50
0
50
100
150
200
Q1
INDUSTRIALS% of companies with positive and negative revenuesurprise (percent)
2009 2010 2011 2012 2013 2014 2015 2016 2017 2018 2019-2
0
2
4
6
Q1
INFORMATION TECHNOLOGY
2009 2010 2011 2012 2013 2014 2015 2016 2017 2018 2019-75
-50
-25
0
25
50
75
100
125
Q1INFORMATION TECHNOLOGY
2009 2010 2011 2012 2013 2014 2015 2016 2017 2018 2019-12
-9
-6
-3
0
3
6
9
Q1
MATERIALS
2009 2010 2011 2012 2013 2014 2015 2016 2017 2018 2019-100
-50
0
50
100
150
Q1
MATERIALS
2009 2010 2011 2012 2013 2014 2015 2016 2017 2018 2019-3
-2
-1
0
1
2
Q1
TELECOMMUNICATION SERVICES
2009 2010 2011 2012 2013 2014 2015 2016 2017 2018 2019-100
-50
0
50
100
150
Q1
TELECOMMUNICATION SERVICES
2009 2010 2011 2012 2013 2014 2015 2016 2017 2018 2019-20
-15
-10
-5
0
5
10
15
Q1
UTILITIES
Source: Yardeni Research and Thomson Reuters I/B/E/S.
2009 2010 2011 2012 2013 2014 2015 2016 2017 2018 2019-100
-50
0
50
100
Q1
UTILITIES
yardeni.com
S&P 500 Sectors Quarterly Revenue Surprises
Page 14 / May 29, 2018 / Earnings Surprise Monitor www.yardeni.com
Yardeni Research, Inc.
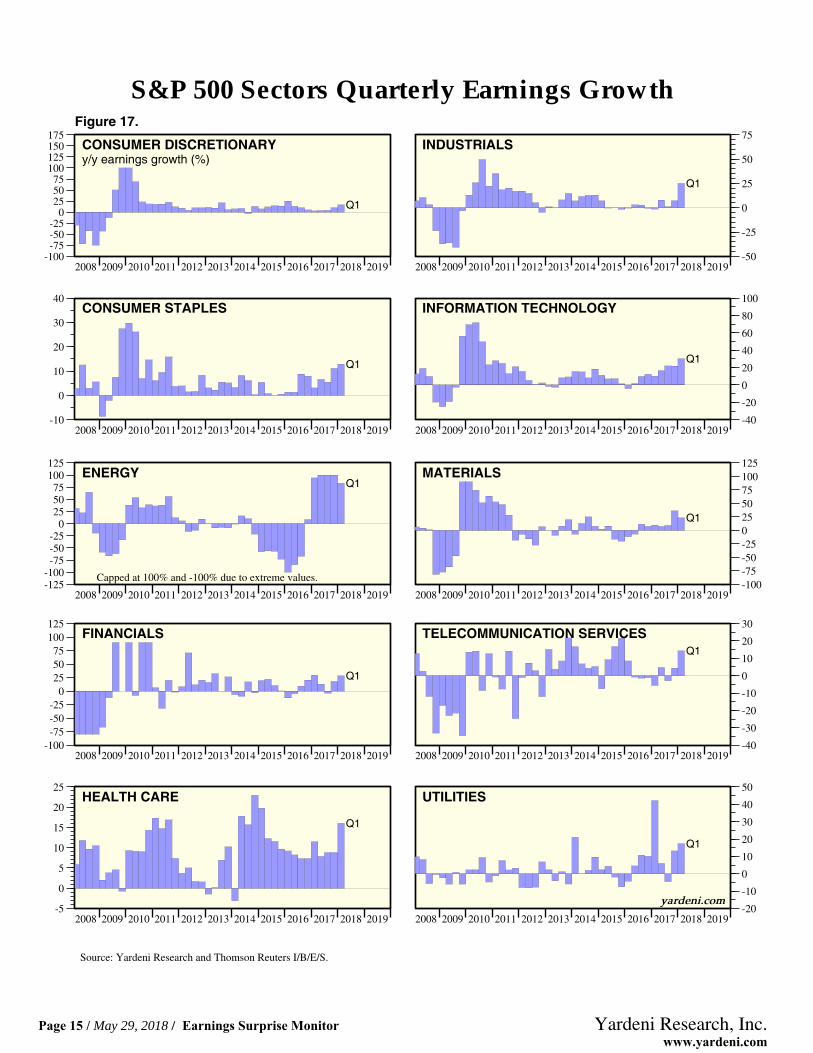
Figure 17.
2008 2009 2010 2011 2012 2013 2014 2015 2016 2017 2018 2019-100-75-50-25
0255075
100125150175
Q1
CONSUMER DISCRETIONARYy/y earnings growth (%)
2008 2009 2010 2011 2012 2013 2014 2015 2016 2017 2018 2019-50
-25
0
25
50
75
Q1
INDUSTRIALS
2008 2009 2010 2011 2012 2013 2014 2015 2016 2017 2018 2019-10
0
10
20
30
40
Q1
CONSUMER STAPLES
2008 2009 2010 2011 2012 2013 2014 2015 2016 2017 2018 2019-40
-20
0
20
40
60
80
100
Q1
INFORMATION TECHNOLOGY
2008 2009 2010 2011 2012 2013 2014 2015 2016 2017 2018 2019-125-100-75-50-25
0255075
100125
Q1ENERGY
Capped at 100% and -100% due to extreme values.
2008 2009 2010 2011 2012 2013 2014 2015 2016 2017 2018 2019-100-75-50-250255075100125
Q1
MATERIALS
2008 2009 2010 2011 2012 2013 2014 2015 2016 2017 2018 2019-100-75-50-25
0255075
100125
Q1
FINANCIALS
2008 2009 2010 2011 2012 2013 2014 2015 2016 2017 2018 2019-40
-30
-20
-10
0
10
20
30
Q1TELECOMMUNICATION SERVICES
2008 2009 2010 2011 2012 2013 2014 2015 2016 2017 2018 2019-5
0
5
10
15
20
25
Q1
HEALTH CARE
Source: Yardeni Research and Thomson Reuters I/B/E/S.
2008 2009 2010 2011 2012 2013 2014 2015 2016 2017 2018 2019-20
-10
0
10
20
30
40
50
Q1
UTILITIES
yardeni.com
S&P 500 Sectors Quarterly Earnings Growth
Page 15 / May 29, 2018 / Earnings Surprise Monitor www.yardeni.com
Yardeni Research, Inc.
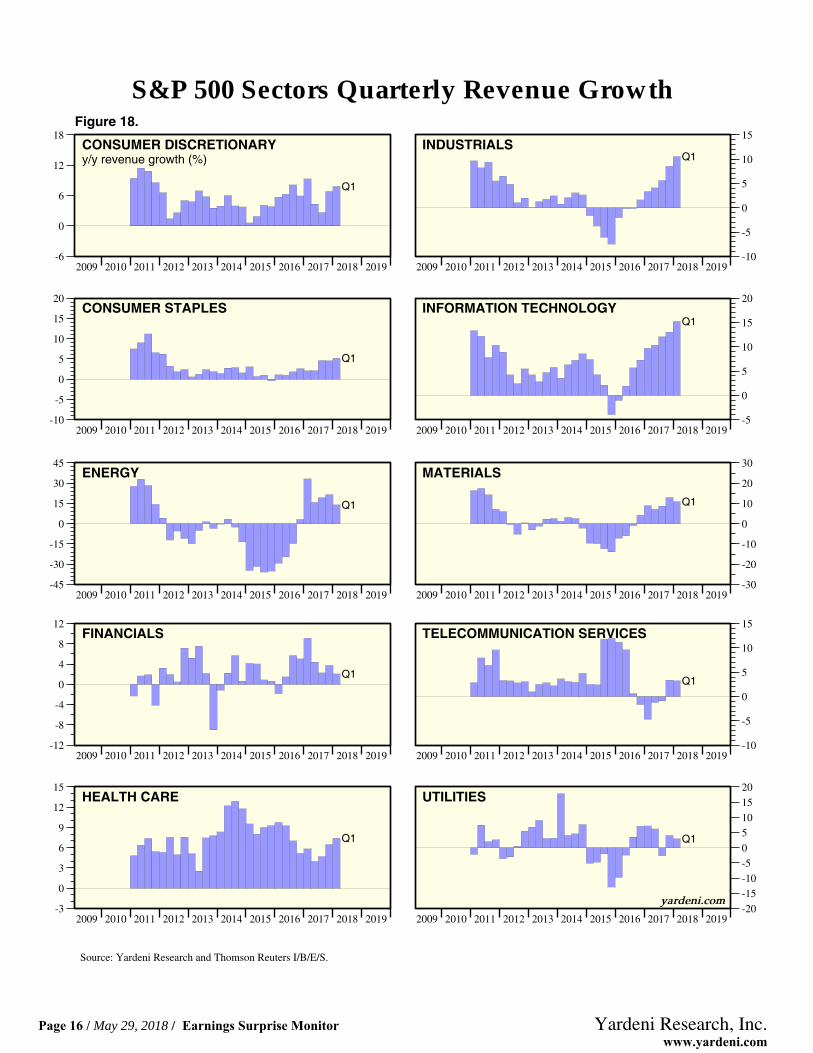
Figure 18.
2009 2010 2011 2012 2013 2014 2015 2016 2017 2018 2019-6
0
6
12
18
Q1
CONSUMER DISCRETIONARYy/y revenue growth (%)
2009 2010 2011 2012 2013 2014 2015 2016 2017 2018 2019-10
-5
0
5
10
15
Q1INDUSTRIALS
2009 2010 2011 2012 2013 2014 2015 2016 2017 2018 2019-10
-5
0
5
10
15
20
Q1
CONSUMER STAPLES
2009 2010 2011 2012 2013 2014 2015 2016 2017 2018 2019-5
0
5
10
15
20
Q1INFORMATION TECHNOLOGY
2009 2010 2011 2012 2013 2014 2015 2016 2017 2018 2019-45
-30
-15
0
15
30
45
Q1
ENERGY
2009 2010 2011 2012 2013 2014 2015 2016 2017 2018 2019-30
-20
-10
0
10
20
30
Q1
MATERIALS
2009 2010 2011 2012 2013 2014 2015 2016 2017 2018 2019-12
-8
-4
0
4
8
12
Q1
FINANCIALS
2009 2010 2011 2012 2013 2014 2015 2016 2017 2018 2019-10
-5
0
5
10
15
Q1
TELECOMMUNICATION SERVICES
2009 2010 2011 2012 2013 2014 2015 2016 2017 2018 2019-3
0
3
6
9
12
15
Q1
HEALTH CARE
Source: Yardeni Research and Thomson Reuters I/B/E/S.
2009 2010 2011 2012 2013 2014 2015 2016 2017 2018 2019-20
-15
-10
-5
0
5
10
15
20
Q1
UTILITIES
yardeni.com
S&P 500 Sectors Quarterly Revenue Growth
Page 16 / May 29, 2018 / Earnings Surprise Monitor www.yardeni.com
Yardeni Research, Inc.
http://blog.yardeni.com
http://blog.yardeni.com
Copyright (c) Yardeni Research, Inc. 2018. All rights reserved. The informationcontained herein has been obtained from sources believed to be reliable, but is notnecessarily complete and its accuracy cannot be guaranteed. No representation orwarranty, express or implied, is made as to the fairness, accuracy, completeness, orcorrectness of the information and opinions contained herein. The views and the otherinformation provided are subject to change without notice. All reports posted onwww.yardeni.com, blog.yardeni.com, and YRI’s Apps for iPads and iPhones are issuedwithout regard to the specific investment objectives, financial situation, or particular needsof any specific recipient and are not to be construed as a solicitation or an offer to buy or sellany securities or related financial instruments. Past performance is not necessarily a guideto future results. Company fundamentals and earnings may be mentioned occasionally, butshould not be construed as a recommendation to buy, sell, or hold the company’s stock.Predictions, forecasts, and estimates for any and all markets should not be construed asrecommendations to buy, sell, or hold any security--including mutual funds, futurescontracts, and exchange traded funds, or any similar instruments.
The text, images, and other materials contained or displayed on any Yardeni Research, Inc.product, service, report, email or website are proprietary to Yardeni Research, Inc. andconstitute valuable intellectual property. No material from any part of www.yardeni.com, blog.yardeni.com, and YRI’s Apps for iPads and iPhones may be downloaded, transmitted,broadcast, transferred, assigned, reproduced or in any other way used or otherwisedisseminated in any form to any person or entity, without the explicit written consent ofYardeni Research, Inc. All unauthorized reproduction or other use of material from YardeniResearch, Inc. shall be deemed willful infringement(s) of this copyright and other proprietaryand intellectual property rights, including but not limited to, rights of privacy. YardeniResearch, Inc. expressly reserves all rights in connection with its intellectual property,including without limitation the right to block the transfer of its products and services and/orto track usage thereof, through electronic tracking technology, and all other lawful means,now known or hereafter devised. Yardeni Research, Inc. reserves the right, without furthernotice, to pursue to the fullest extent allowed by the law any and all criminal and civilremedies for the violation of its rights.
The recipient should check any email and any attachments for the presence of viruses.Yardeni Research, Inc. accepts no liability for any damage caused by any virus transmittedby this company’s emails, website, blog and Apps. Additional information available onrequest.