quantec logging services inc. geophysical survey ... - draft bh geophysics report...quantec logging...
TRANSCRIPT

Quantec Logging Services Inc.116 Spadina Avenue, Suite 400
Toronto, ONPhone (416) 306-1941
Fax (416) 306-1949L SQuantec Logging Services Inc.
Geophysical Survey Interpretation Report BOREHOLE PHYSICAL PROPERTY SURVEYS
For Region of York, Peel, and Durham
DRAFT DRAFT DRAFT DRAFT DRAFT DRAFT DRAFT DRAFT DRAFT DRAFT DRAFT DRAFT
DRAFT DRAFT DRAFT DRAFT DRAFT DRAFT DRAFT DRAFT DRAFT DRAFT DRAFT DRAFT
February 2003 V. Gerrie K. Blasco S. Collins
Quantec Logging Services Draft YPD Report Borehole Physical Properties Survey
EXECUTIVE SUMMARY
INTRODUCTION A borehole geophysical logging program was initiated from April to December 2002 as part of the York Peel Durham (YPD) Groundwater Management Strategy Study in southern Ontario, Canada. Objectives of the logging program were: improving the understanding of the complex geology of the Oak Ridges Moraine; regional scale stratigraphic correlation; estimating hydrogeologic parameters; providing a greater confidence in the geologic input to numerical models; and making recommendations of merits of a more extensive long-term geophysical data acquisition program.
Key hydrostratigraphic units of the Oak Ridges Moraine and surrounding area such as the Newmarket Till, Lower Sediments, Upper Sediments, and channel-fill deposits were characterized with in-situ physical property measurements, namely: natural gamma, spectral gamma, neutron, density, full wave-form sonic (acoustic velocity), magnetic susceptibility, inductive conductivity, temperature, and fluid conductivity. Statistical characterizations, and cross-plotting of parameters, were used to identify common lithologies in the YPD area. Coarsening upward sequences in the lower sediment package were traced across the survey region, indicating that correlation of sediments over several kilometres is possible using geophysical logging.
RESULTS Results indicate that specific combinations of parameters are best suited to identifying key units. General results are summarised below for each key hydrostratigraphic unit, in addition to hydrogeologic properties, and spectral gamma ray testing:
Newmarket Till
The Newmarket Till is best characterized by acoustic velocity, neutron, and density parameters likely responding to the unique dense, low porosity, compact nature of the till.
Lower Sediments
The Lower Sediments are best mapped with natural gamma, conductivity, neutron and temperature gradient, which highlight unique, regional, repetitive coarsening upward sequences in various holes across the survey area.
Channel Fill Deposits
Acoustic velocity, density, and neutron logs best identify gravels that typically mark the base of channel fill deposits, where as the fill sediments typically exhibit a “noisy” conductivity response and in general have lower density values.
Upper Sediments
The geophysical information was useful in helping to map and identify various sediment types within the upper sediment package, however the upper sediments in general did not exhibit the more obvious and unique characteristics of the Newmarket Till or lower sediments. Of note, the sands from the upper sediments typically had lower densities than sands from the lower sediments. The best parameters for defining the upper sediments are density, neutron, natural gamma, and conductivity.
Hydrogeologic Properties
Neutron logs correlate well with moisture content samples taken from core in the Grasshopper and CVC-ORM-01b holes, indicating the potential of estimating porosity or moisture content from Neutron data. The neuron data has also indicated zones of perched water above the regional water table.
Temperature gradient logs can highlight areas of significant water flow through zones of high hydraulic conductivity such as coarse sand and gravel.
Spectral Gamma Ray
The results from the preliminary testing of the spectral gamma probe suggest that the method has some potential for lithologic discrimination of the Newmarket and Halton tills and other clay-rich sediments within the regional stratigraphy. Further work is required however, to confirm that the U/K ratios of the two tills are distinctive across regional scales.

Quantec Logging Services YPD Borehole Physical Properties Survey
RECOMMENDATIONS Recommendations from this report are briefly summarized below:
1. Run a complete suite of geophysical logs in all future “golden spike” holes with high quality geologic control (cored or frequently sampled) that intersect key hydrostratgraphic units.
2. Devise a routine borehole geophysical logging program aimed at cost effectively improving our understanding of the complex geology of the Oak Ridges moraine. The goal will be to acquire data efficiently by focussing on the parameters most likely to add value. Based on the results of this report, the “optimum” suite of parameters will vary depending the application.
3. Standardize well construction for all future “golden spike” boreholes or other holes where geophysical surveys are proposed or could add value. Casing type and size, back fill material/grout type and thickness, drill hole diameter etc. can all have a significant effect on geophysical measurements. Standardized well construction will allow for quantitative hole-to-hole comparisons of lithologies over great distances, where as wells constructed differently are limited to less desirable qualitative interpretations.
4. Determine correction factors between geophysical parameters logged through standard steel cased water wells vs. standard PVC cased wells. Some geophysical parameters such as neutron, density, and gamma can measure through PVC and steel cased holes although the steel has an attenuating effect. Quantifying the attenuation effect would allow for normalization of data recorded through both casing types.
5. The applicability of Spectral Gamma logging should be further investigated as it could provide quantitative information about clay mineralogy and in turn the provenance of the sediments.
6. Study the neutron-porosity relationship in more detail. Results have indicated an inverse relationship between neutron count rate and lab determined moisture content from core samples. This relationship however, is only based on two holes and appears to be somewhat complex warranting further study.
CONCLUSIONS The project was successful in achieving the initial goals, and a more extensive, routine, long-term geophysical acquisition program will clearly improve the overall understanding of the complex geology and hydrogeology of the Oak Ridges Moraine. Building a library of borehole geophysical results from across the YPD area will greatly improve regional scale stratigraphic correlation and ultimately provide greater confidence in the geologic input to numerical groundwater models.
QLS Project L-128 February 2003
ii

Quantec Logging Services YPD Borehole Physical Properties Survey
TABLE OF CONTENTS
1 INTRODUCTION.................................................................................................................5 2 SURVEY DETAILS .............................................................................................................6
2.1 Survey Overview........................................................................................................6 2.2 Survey Specifications ...............................................................................................9 2.3 Personnel .................................................................................................................10 2.4 Data Presentation ....................................................................................................11
2.4.1 Physical Property Data and Profiles.............................................................11 3 SURVEY RESULTS AND INTERPRETATION ................................................................12
3.1 Overview...................................................................................................................12 3.2 General Data Processing and Interpretation ........................................................12
3.2.1 Data Processing and Presentation...............................................................12 3.2.2 Geophysical Lithology Classification............................................................12 3.2.3 Statistical Characterization...........................................................................13 3.2.4 Data Quality: Single Hole Statistics..............................................................13
3.3 Spectral Gamma Processing and Interpretation ..................................................14 3.3.1 Spectral Gamma Processing .......................................................................14
3.4 Statistical Characterization Results ......................................................................15 3.4.1 Grasshopper Hole Sample Statistical Characterization...............................15 3.4.2 Multi-Hole Composite Statistical Characterization of Moraine Lithologies ..21
4 CONCLUSIONS................................................................................................................28 4.1 Geophysical Characterization of the Newmarket Till ..........................................28 4.2 Mapping of the Lower Sediments ..........................................................................29 4.3 Upper Sediments .....................................................................................................32 4.4 Tunnel Channels......................................................................................................33 4.5 Aquifer Properties ...................................................................................................33 4.6 Clay Marker Beds.....................................................................................................35 4.7 Spectral Gamma Results ........................................................................................36
4.7.1 Borehole OGS-PJB-19.................................................................................37 4.7.2 Borehole OGS-PJB-15.................................................................................39
4.8 Physical Property Analysis and Differences in Hole Construction....................40 5 RECOMMENDATIONS.....................................................................................................41
LIST OF APPENDICES
REFERENCES.........................................................................................................................43 APPENDIX A: STATEMENT OF QUALIFICATIONS............................................................44 APPENDIX B: YPD BASEMAP .............................................................................................47 APPENDIX C: MULTIHOLE STATISTICS.............................................................................48 APPENDIX D: STATISTICS BY LITHOLOGY.......................................................................61 APPENDIX E: COMPOSITE VIEWLOG PLOTS ...................................................................99 APPENDIX F: DIGITAL DATA.............................................................................................115
QLS Project L-128 February 2003
iii

Quantec Logging Services YPD Borehole Physical Properties Survey
LIST OF FIGURES AND TABLES
Figure 1: Viewlog YPD Location Basemap showing available well information .............................5 Figure 2: Location Map of the YPD Groundwater Project with boreholes logged by QLS in 2002.7 Figure 3: GSC and QLS P-Wave Velocity (m/s) Data for OGS-PJB-15 .........................................8 Figure 4: Sample ViewlogTM Composite Plot for Grasshopper hole .............................................11 Figure 5: OGS-PJB-19 – Till Unit Broken into two Geophysical Interpretation Units....................13 Figure 6: Sample Histogram – Natural Gamma, Grasshopper .....................................................14 Figure 7: Neutron statistics for each lithology, Grasshopper ........................................................16 Figure 8: Natural Gamma statistics for each lithology, Grasshopper............................................17 Figure 9: Magnetic Susceptibility statistics for each lithology, Grasshopper ................................18 Figure 10: Inductive Conductivity statistics for each lithology, Grasshopper................................19 Figure 11: Density statistics for each lithology, Grasshopper .......................................................20 Figure 12: P-Wave Velocity statistics for each lithology, Grasshopper.........................................21 Figure 13: 3.5 inch Composite Far Density plot based on Sub-Lithologies ..................................22 Figure 14: 3.5 inch Far Density Plot Based on General Lithologies .............................................23 Figure 15: 3.5 inch Diameter Survey Holes Cross-plot .................................................................24 Figure 16: 3 inch Far Density Composite Plot based on Sub-Lithologies.....................................25 Figure 17: 3 inch Far Density Composite based on General Lithologies......................................26 Figure 18: Composite plot for Till units in 3.0 and 3.5 inch Holes.................................................27 Figure 19: OGS-PJB-15 and OGS-PJB-19 NN-DC-PV Cross-plot showing unique identification of
Newmarket Till.........................................................................................................................28 Figure 20: Lower Sediment Coarsening Upward Sequences in Natural Gamma and Inductive
Conductivity Logs from Pontypool, GSC-BH-NOB-01, and Grasshopper (Note: logs not depth correlated - depth placement approximate) ............................................................................30
Figure 21: 3.5 Inch OGS Holes Far Density Upper and Lower Sand Contrast.............................32 Figure 22: Neutron and Moisture Content Correlation for CVC-ORM-01b (left) and Grasshopper (right)
Holes .......................................................................................................................................34 Figure 23: Neutron Composite Plot for Clay..................................................................................35 Figure 24: Spectral Gamma log of OGS-PJB-19 ..........................................................................36 Figure 25: Spectral gamma log for OGS-PJB-15..........................................................................37 Figure 26: Cross-plot of Natural gamma vs Potassium, Uranium for OGS-PJB-19 .....................38 Figure 27: Cross-plot of Potassium vs Uranium for OGS-PJB-19 ................................................38 Figure 28: Cross-plot of Natural gamma vs Potassium, Uranium for OGS-PJB-15 .....................39 Figure 29: Cross-plot of Potassium, Uranium for OGS-PJB-15...................................................40 Table 1: Borehole Locations............................................................................................................7 Table 2: Index of Physical Properties Surveyed .............................................................................9 Table 3: Physical Property Borehole Tools Utilized ......................................................................10
QLS Project L-128 February 2003
iv

Quantec Logging Services YPD Borehole Physical Properties Survey
1 INTRODUCTION
The objectives of the YPD groundwater management study were: to determine which geophysical logging tools were best suited to the Oak Ridges Moraine (ORM) area lithology structure, assess the applicability of geophysical logging for regional scale stratigraphic correlation of glacial sediments, increase the understanding of the geologic structure within the ORM and to provide greater confidence in the geologic input to numeric models.
An MS Access database of available wells within the ORM area was created using well records from various sources including, the Ministry of the Environment (MOE), the regions of York, Peel, and Durham, the Ontario geological Survey (OGS), the Geological Survey of Canada (GSC), and McMaster University. The wells entered into the database were chosen based on their construction (casing, hole length and diameter), the availability of core interpretation, the location, and the age and condition of the well. The database information included location and well construction information. This information was linked to a basemap using ViewlogTM software (see Figure 1). Any available well logs were also entered into the database and displayed using Viewlog software.
Figure 1: Viewlog YPD Location Basemap showing available well information
QLS Project L-128 February 2003
5

Quantec Logging Services YPD Borehole Physical Properties Survey
2 SURVEY DETAILS
2.1 SURVEY OVERVIEW The borehole geophysical surveys took place between June and November 2002 at various locations in the Greater Toronto area, encompassing the oak ridges moraine. Table 1gives location information about the 16 holes logged by Quantec Logging Services for the YPD project and Figure 2 shows the hole locations relative to the city of Toronto and the Oak Ridges Moraine (outlined in blue). (See Appendix B for an enlarged version of the basemap.)
Hole ID Region Easting Northing Elevation Angus Glen OW1 Durham 640886 4879489 338 CVC-ORM-01b Peel 588636 4852731 274
EE11-1F Durham 651134 4859701 175.5 EE11-1W Durham 651137 4859701 175.5
Grasshopper1 Durham 679510 4880186 287 Grasshopper2 Durham 679518 4880197 282
GSC-BH-NOB-01 York 611194 4864947 269 GSC-BH-VSR-01 York 630188 4873238 303
Hillcrest York 622288 4884347 253 Hillcrest2 York 622300 4884050 259
King Valley York 619195 4872622 318 OGS-PJB-15 York 635691 48769424 328.9 OGS-PJB-19 Durham 643905 4872693 300
Pontypool Scugog 689069 4886446 351 Ram Forest York 629555 4874585 303
Uxbridge Durham 651171 4885402 278
Table 1: Borehole Locations1
1 Elevations measured with hand-held GPS for most holes, and are therefore approximate.
QLS Project L-128 February 2003
6

Quantec Logging Services YPD Borehole Physical Properties Survey
Figure 2: Location Map of the YPD Groundwater Project with boreholes logged by QLS in 2002
Quantec Logging Services (QLS) consulted with the YPD team and the GSC regarding which holes would be most ideal to log, based on location, penetration depth, well construction, lithologies encountered, and availability. Six of the holes had been logged previously, four by the GSC and two by McMaster University. The logging completed by QLS supplemented the prior work with geophysical parameters that were not previously logged such as neutron and dual detector calibrated density. This earlier data was used as a quality check and comparison for the QLS data, for example in Figure 3 the GSC sonic data (from vertical seismic profiling) is overlain with the QLS data collected in 2002 with a full wave form acoustic velocity tool. The resultant velocities, recorded with different tools and methods, show a very similar trend. The GSC data shows more variation in the upper part of the hole because VSP tools are not limited to measuring velocities greater than that of the PVC pipe.
QLS Project L-128 February 2003
7

Quantec Logging Services YPD Borehole Physical Properties Survey
Metres P-Wave Velocity GSC500 4000
-20
-40
-60
-80
P-Wave Velocity QLS500 4000
Figure 3: GSC and QLS P-Wave Velocity (m/s) Data for OGS-PJB-15 (GSC data from Pullan, et al., 2000)
QLS Project L-128 February 2003
8

Quantec Logging Services YPD Borehole Physical Properties Survey
2.2 SURVEY SPECIFICATIONS The project consisted of a multiple physical property borehole profiling survey down 16 drill holes. See Table 2 for a list of the holes logged and the down-hole geophysical parameters measured. Quality control on the data involved 2 runs per tool2 (down and up) with both runs compared for repeatability. Tool calibrations are tested on a regular basis.
QLS experimented with repeat logs of all parameters at a variety of logging speeds and sampling rates to determine the most cost effective production rates for each tool without sacrificing data quality. The data acquisition rate and sample intervals were as follows: down runs at 5.00 m/min and 2cm intervals and up runs at 2.50 m/min at 2cm intervals for all logs except Sonic, which was run at 2.00 m/min with a 10cm sample interval.
Hole Identification
Hole Length (m
)
Length Logged (m)
Gam
ma/Tem
p/Fluid Res
Inductive Cond
Neutron
Density/C
aliper
Full Wave Sonic
Mag. Susc.
Spectral Gam
ma
Angus Glen OW1 152.40 141.98 √ ΝΑ √ √ ΝΑ ΝΑ −CVC-ORM-01b 180.62 178.98 √ √ √ √ √ √ −
EE11-1F 71.78 70.31 √ ΝΑ √ ΝΑ √ √ −EE11-1W 40.67 39.16 √ ΝΑ √ √ ΝΑ ΝΑ −
Grasshopper1 59.54 58.16 √ √ √ √ √ √ √Grasshopper2 140.59 139.00 √ √ √ √ √ √ √GSC-NOB-01 190.00 189.90 √ √ √ √ √ √ −GSC-VSR-01 127.00 126.00 √ √ √ √ √ √ −
Hillcrest 68.00 68.00 √ ΝΑ √ √ ΝΑ ΝΑ −Hillcrest2 111.56 111.56 √ ΝΑ √ √ ΝΑ ΝΑ −
King Valley 90.83 89.40 √ ΝΑ √ ΝΑ √ √ −OGS-PJB-15 85.00 82.89 √ √ √ √ √ √ √OGS-PJB-19 90.00 90.00 √ √ √ √ √ √ √
Pontypool 169.14 169.14 √ ΝΑ √ ΝΑ √ √ −Ram Forest 62.51 62.51 √ ΝΑ √ √ ΝΑ ΝΑ −
Uxbridge 84.73 84.73 √ √ √ √ √ √ −
Table 2: Index of Physical Properties Surveyed
The geophysical parameters measured are listed in Table 3, along with their respective units. The tools are all accurately calibrated, but some are designed to function with the tool in direct contact with the borehole wall. The casing and backfill material in the YPD holes can skew the measured values in some cases. Data Reduction was completed using VIEWLOG2TM software for all parameters except sonic.
No. Tool Name (Parameters Measured) Units 1. Magnetic Susceptibility mCGS 2. Gamma counts per second 3. Temperature Degrees Celsius 4. Fluid Resistivity Ohm-m
2 Note: The Density tool was only run in one direction (up) as the open caliper arm prevents the tool from going down-hole during data acquisition.
QLS Project L-128 February 2003
9

Quantec Logging Services YPD Borehole Physical Properties Survey
5. Density g/cc 6. Inductive Conductivity S/m 7. Full Wave Sonic m/s 8. Neutron counts per second 9. Spectral Gamma K,U,Th counts per second
Table 3: Physical Property Borehole Tools Utilized
2.3 PERSONNEL Field Project Operators were: Vince Gerrie of Toronto, ON, Canada; Shawn Collins of Hamilton, ON, Canada; Katie Blasco of Toronto, ON, Canada; and Trent Retallick of Australia. Data Processing was completed by: Vince Gerrie, Katie Blasco, and Shawn Collins.
QLS Project L-128 February 2003
10
Quantec Logging Services YPD Borehole Physical Properties Survey
2.4 DATA PRESENTATION
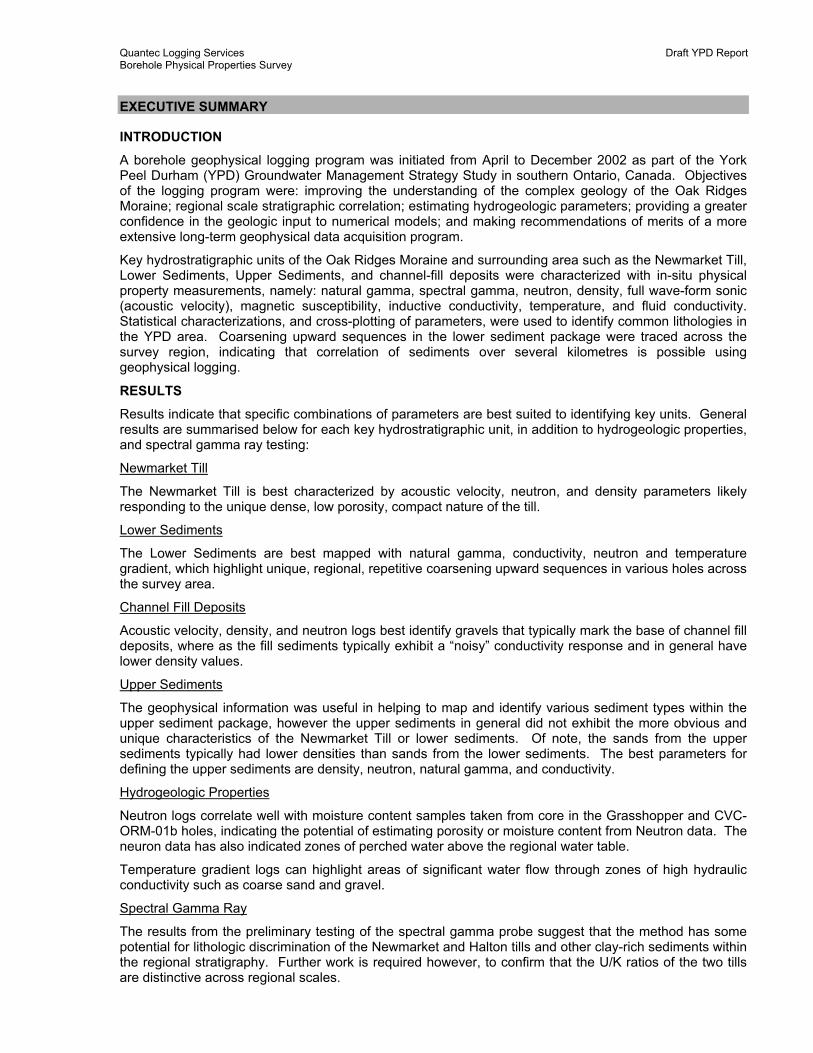
2.4.1 PHYSICAL PROPERTY DATA AND PROFILES The borehole data plots consist of 8 columns of physical property traces and geological and geophysical lithology information along with rock sample information (e.g. moisture content sample results). They are plotted according to depth from the ground surface. Figure 4 below is an example of a typical composite plot, from the Grasshopper hole. Full size 11x17 colour profiles for each hole surveyed are located in Appendix E.
York-Peel-Durham MunicipalitiesHole #Grass
Length: 140.59mAzimuth: 0Dip: 90Diameter:
Operator: KB,TR,SS,SC
Northing: 4880186Easting: 679510Drilled: 11/12/2002Logged: 14-Nov-02Durham
Surveyed and Processed by: QLS
BOREHOLE GEOPHYSICAL PROFILES
Metres Gamma(CPS)20 100
Caliper(in)0 10
Far Density(g/cc)1 3
Neutron(CPS)0 1500
Moisture Content0 .5
Pwave Vel(m/s)1500 4000
Mag Sus(mCGS)0 .3
ILM(mS/m)0 100
ILD(mS/m)0 100
Fluid Res(ohm-m)0 40
DT-.1 .1
Lithology Geophys Lith
0
-20
-40
-60
-80
-100
-120
-140
TopsoilSandy GravelFine SandSandy GravelMedium SandFine SandMedium SandFine Sandy SiltGravelFine SandGravelFine SandClayFine SandFine-Medium SandFine SandFine-Medium SandFine Sand-SiltGravelMedium SandGravel-Boulders
Cobbles
Fine Sand-SiltFine Sand-SiltSiltFine Sand-SiltSiltFine SandSiltFine SandSiltFine Sand-SiltSilt -ClayTillFine SandTillFine SandClayCoarse SandGravelClayFine SandClayTillClayey-SiltSandSiltFine SandSiltFine SandSiltClaySiltSandSiltTillSand-GravelClaySiltClayFine-Medium saturated Sand
Clay
Weathered Bedrock
Fine_Sandy-Silt_1grChGravel_1grChFine_Sand_1grChGravel_1grChFine_Sand_1grChClay_1grChFine_Sand_1grChFine-Med_Sand_2grChFine_Sand_1grChFine-Med_Sand_2grChFine_Sand-Silt_1grChGravel_2grChMed_Sand_1grCh
Gravel-Boulders_1grCh
Cobble_1grCh
Screen
Cobble_1grChFine_Sand-Silt_2grLNo_LogFine_Sand-Silt_2grLSilt_1grLFine_Sand-Silt_2grLSilt_1grLFine_Sand_2grLSilt_1grLFine_Sand_2grLSilt_1grLFine_Sand-Silt_2grLSilt-Clay_1grLTill_1grLFine_Sand_3grLTill_2grLFine_Sand_3grLClay_2grLCoarse_Sand_1grLGravel_2grLClay_2grLFine_Sand_2grLClay_2grLTill_3grLClayey-Silt_1grLSand_1grLSilt_2grLFine_Sand_3Silt_2grLFine_Sand_3grLSilt_2grLClay_3grLSilt_3grLSand_1grLSilt_3grLNTill_grLSand-Grav el_1grLClay_4grLSilt_4grLClay_4grLClay_5grLScreenClay_6grL
Limestone_Wgr
Temp(degC)5 15
Figure 4: Sample ViewlogTM Composite Plot for Grasshopper hole
QLS Project L-128 February 2003
11

Quantec Logging Services YPD Borehole Physical Properties Survey
3 SURVEY RESULTS AND INTERPRETATION
3.1 OVERVIEW This study concerns the analysis of borehole petrophysical survey results, obtained in the York, Peel and Durham regions of Greater Toronto, Ontario, Canada as part of a YPD groundwater management strategy study. The surveys were undertaken by Quantec Logging Services, of Toronto, ON, Canada, between June and November 2002. The analysis consisted of multi-parameter measurements in 16 holes. The survey was conducted using a range of physical property tools to collect data that was then compared to lithologic core log information.
3.2 GENERAL DATA PROCESSING AND INTERPRETATION
3.2.1 DATA PROCESSING AND PRESENTATION LAS (log ASCII standard) files of the data were created from the raw data files while surveying each hole. The sonic data required additional analyses of P-wave 1ST-arrival behaviour, before a LAS file of the p-wave velocity was created. The LAS data from each drill-hole was then imported, screened, edited and shown as composite physical property logs (see Appendix F) using the VIEWLOGTM software program. Geological lithology information from core logs and sample information, such as moisture content, was also imported into the composite VIEWLOGTM
plots. All of the log data from the VIEWLOGTM composite plots were then uploaded into a MS ACCESS database for the project.
3.2.2 GEOPHYSICAL LITHOLOGY CLASSIFICATION Examination of the VIEWLOGTM composite plots for each hole indicated areas of geophysical variation within the major lithology divisions. For this reason, the major lothologic classes were sometimes broken down into sub-units based upon their geophysical character. For example, in Figure 5, the large till unit in OGS-PJB-19 is broken in two tills because of the distinct geophysical difference between the top and bottom of the unit seen across most of the parameters. Statistical analysis of geophysical parameters based upon the original single till lithology would yield ambiguous results because of the obvious difference in physical properties. Statistics were therefore originally calculated based upon the sub-lithologies, not the main lithologies. The hole lithologies were also divided based upon their sediment package classification – i.e. channel sediments, upper sediments, lower sediments, and Newmarket Till. Each lithology was also given a hole code (e.g. gr = Grasshopper, o19 = OGS-PJB-19, etc.) to track its source in the composite statistical analysis.
QLS Project L-128 February 2003
12

Quantec Logging Services YPD Borehole Physical Properties Survey
York-Peel-Durham MunicipalitiesHole #OGS-PJB-19
Length: 90mAzimuth: 0Dip: 90Diameter: 0.0889
Operator: Vince Gerrie/Shawn Collins Northing: 4872693Easting: 643905Drilled: Logged: 7/4/2002Durham
Surveyed and Processed by: QLS
BOREHOLE GEOPHYSICAL PROFILES
Metres Gamma (CPS) 20 100 Caliper
(in) 0 10 Far Density
(g/cc) 1 3 Neutron
(CPS) 0 1500 Moisture Content 0 .5
Pwave Vel(m/s)1500 4000
Mag Sus(mCGS)0 .3
ILM(mS/m)0 100
ILD(mS/m)0 100
Fluid Res
(ohm-m)0 40 DT-.1 .1
Lithology Geophys Lith
-40
-60
-80
Till
Clay
NTill_1o9
NTill_2o9
Clay_1o9L
Division between upper and lower Till from physical property contrast
Temp(degC)5 15
Figure 5: OGS-PJB-19 – Till Unit Broken into two Geophysical Interpretation Units
3.2.3 STATISTICAL CHARACTERIZATION The various petrophysical data (gamma, susceptibility, etc.) for each hole were exported from
VIEWLOGTM as composite LAS files for statistical analysis. The statistical characterisation included calculating centroids (means or medians) and spreads for each of the physical properties based upon lithology. For example, determining the median value for magnetic susceptibility within the Newmarket Till. This analysis allows for the unique identification of each lithology subset based upon its physical properties, provided sufficient contrasts exist among the lithologies studied. Before calculating the final statistics for each lithology across the suite of holes, the data was inspected on a hole per hole basis for data quality.
3.2.4 DATA QUALITY: SINGLE HOLE STATISTICS The success rate of the entire interpretation process depends on data quality. For this reason, statistics were generated and inspected for each hole prior to using the data in a multi-hole composite analysis. Statistics for the Grasshopper hole are included in the body of the report as an example. For reference, a colour composite plot for the Grasshopper hole is located above in Figure 4. The log data from each hole used for the statistical analysis is edited to remove unnatural data such as measurements inside screens or beside metal casing. Histograms for each parameter are calculated to graphically represent data distributions and provide a quick and useful method of reviewing the data quality and distribution. Figure 6 below is a sample histogram of natural gamma data for the Grasshopper borehole.
QLS Project L-128 February 2003
13

Quantec Logging Services YPD Borehole Physical Properties Survey
Figure 6: Sample Histogram – Natural Gamma, Grasshopper
3.3 SPECTRAL GAMMA PROCESSING AND INTERPRETATION Spectral gamma methods employ measurements of the energy levels of gamma rays emitted from the formation sediments to determine the abundances of the radioactive elements potassium (K), uranium (U) and thorium (Th). Potassium is the primary gamma emitter in sediments and has a distinctive energy peak of 1.46 MeV (‘Mega electron volts’) on spectral records. U and Th are present in lower abundances and are distinguished by a broader range of energies with average energy peaks of 1.76 and 2.62 MeV respectively. Knowledge of the abundance and ratios of radioactive elements can in turn provide useful information about the mineralogy of the formation sediments. Th/K ratios for example are used widely in petroleum geology for typing clay mineralogy (Quirein, et al., 1977). Spectral methods have not been employed widely for lithologic identification and correlation in groundwater geophysics.
Spectral gamma logging was evaluated in this study as a further tool for identifying and differentiating tills and clay-rich deposits within the regional stratigraphy. A primary focus was to determine if spectral methods had the potential to discriminate the two regional tills within the study area (Newmarket and Halton Tills). The Newmarket Till is a typically a dense, calcareous silty till with low clay mineral content while the Halton Till is commonly a clay-silt or clayey-sand till with a higher content of clays derived from overridden glaciolacustrine deposits. It was reasoned that the differences in clay content and mineralogy might permit ‘typing’ of the tills using cross-plots of U/K and Th/K.
3.3.1 SPECTRAL GAMMA PROCESSING
QLS Project L-128 February 2003
14

Quantec Logging Services YPD Borehole Physical Properties Survey
The raw spectral logs were processed using the spectral stripping method. This method partitions the energy levels using calibration values obtained from a radioactive source with known radionuclide concentrations. The stripped logs give the relative abundance of Uranium, Potassium and Thorium in counts per second. All stripped logs were smoothed using a 25-point boxcar filter.
3.4 STATISTICAL CHARACTERIZATION RESULTS Several different combinations of statistical characterizations are presented in this report. A composite statistical characterization of all holes was completed to assign petrophysical characteristics to each lithology logged within the oak ridges moraine. Presentation of composite analysis are grouped in plots as follows:
1. 3 inch pvc constructed holes (Appendix C)
2. 3.5 inch pvc constructed holes (Appendix C)
3. Tills (Appendix D)
4. Clays (Appendix D)
5. Sands (Appendix D)
6. Silts (Appendix D)
7. Cobble and Gravel (Appendix D)
The Grasshopper hole sample statistics are shown below, with explanations of how the various geophysical parameters relate to lithology characteristics. Following is an explanation of the multi-hole composite analyses. Within the box and whisker plots, the lithologies are abbreviated as follows: med = medium, f = fine, c = coarse.
Some geophysical lithology picks have a suffix indicating their hole of origin (gr = Grasshopper, vs = GSC-BH-VSR-01, cv = CVC-ORM-01b, o5 = OGS-PJB-15, o9 = OGS-PJB-19, nb = GSC-BH-NOB-01) and their approximate sedimentary origin (U or Up = Upper Sediment package, C = Meltwater Channel, L or Lw = Lower Sediment package). For example the unit assigned the title: F_Sand_grU, equates to Fine Sand from the Grasshopper hole Upper Sediment package.
3.4.1 GRASSHOPPER HOLE SAMPLE STATISTICAL CHARACTERIZATION The data from the two grasshopper property holes were merged to create one log plot, and therefore; one statistical analysis was done for the resultant composite log. Overall statistical results for the Grasshopper hole are outlined graphically, by lithology, in “Box and Whisker” plots (Figure 7 to Figure 12). The box represents the centroid (median parameter value) for each sub-lithology and the whiskers indicate the standard deviation. The bars beneath each lithology value represent the number of data points used to calculate the median. Unit values with smaller bars may not be as accurate or reliable, as a fewer number of points were used to calculate the statistics.
The following observations are made regarding the single-hole statistical characterization for Grasshopper:
Grasshopper Neutron (cps), Figure 7: Neutron measurements are used as an indicator of moisture content within the sediments surrounding the borehole where moisture content has an inverse relationship to neutron count The Grasshopper neutron statistics indicate that the Sand-Gravel_1 unit, the Sand_1 unit and the unit identified as NTill3 have significantly low moisture contents compared to the other lithology
3 The geophysical data and preliminary geological logs (personal communication with Gayle Soochan -CLOCA) indicate that this unit is similar to Newmarket Till.
QLS Project L-128 February 2003
15

Quantec Logging Services YPD Borehole Physical Properties Survey
units in the hole. Till_3 also has a higher neutron value, and therefore lower moisture content. The clays are generally lower neutron count, indicating high moisture content.
Figure 7: Neutron statistics for each lithology, Grasshopper
Grasshopper Natural Gamma Ray (API), Figure 8: The natural gamma log gives an indication of naturally occurring radioactive minerals present within the surrounding lithologies, with potassium being the most abundant source of gamma rays. Clays are typically high in potassium, as can be seen in the gamma statistical results for the Grasshopper hole.
QLS Project L-128 February 2003
16

Quantec Logging Services YPD Borehole Physical Properties Survey
Figure 8: Natural Gamma statistics for each lithology, Grasshopper
Grasshopper Magnetic Susceptibility (mCGS), Figure 9: Magnetic Susceptibility measurements give an indication of magnetic minerals present, in particular, magnetite. The sediments in the Grasshopper hole have a wide range of magnetic susceptibility values, which do not seem to be characteristic based on a particular grain size or lithology. The MS response could be more related to the sediment source as opposed to depositional environment. Of note, the clays have the highest and lowest magnetic susceptibility values of all lithology types in the Grasshopper hole, suggesting a significant variation in ferromagnetic minerals within the clay units.
QLS Project L-128 February 2003
17

Quantec Logging Services YPD Borehole Physical Properties Survey
Figure 9: Magnetic Susceptibility statistics for each lithology, Grasshopper
Grasshopper Deep Inductive Conductivity (S/m), Figure 10: Clays tend to be very conductive due to their high moisture content and cation exchange capacity, i.e. the willingness of positive ions of some species to leave a clay site and be exchanged by ions of certain other species (Hearst, et al., 2000). The Grasshopper clays have significantly higher conductivities as indicated in the single-hole statistics. The Grasshopper NTill has a very low conductivity and the sands and silts are in the mid-conductivity range in general. Several of the units have large spreads of conductivity values resulting from the significant variation in conductivity response. This “noisy” conductivity response tends to be lithology dependent with channel fill deposits being “noisy” and the clays of the lower sediments having a very uniform response. This pattern is also seen in other YPD holes such as Uxbridge.
QLS Project L-128 February 2003
18

Quantec Logging Services YPD Borehole Physical Properties Survey
Figure 10: Inductive Conductivity statistics for each lithology, Grasshopper
Grasshopper Far Density (g/cc), Figure 11: The dual density tool measures the density at locations near and far from the borehole wall. The far density values were used for analysis for the YPD project, because it appeared that the near measure did not significantly penetrate the formation and was therefore more affected by grouting and casing. The tills and gravels generally have a higher density than silts and sands, and the clays can have medium to high densities likely depending on their water content/porosity and degree of compaction. The unit that is geophysically grouped as Newmarket Till has a very high density in the Grasshopper hole. In general most lower sediments had higher density values than channel fill deposits of similar grain size.
QLS Project L-128 February 2003
19

Quantec Logging Services YPD Borehole Physical Properties Survey
Figure 11: Density statistics for each lithology, Grasshopper
Grasshopper P-Wave Velocity (m/s), Figure 12: P-wave velocity is calculated from the difference between arrival times at two receivers on the sonic probe. The Sonic tool used for the YPD survey was not used in the steel cased holes because it would only detect velocities greater than that of the steel and none of the YPD lithologies have velocities in that range. For the YPD survey, the sonic tool was used in PVC cased holes, although it could not differentiate any velocities lower that that of the PVC. This creates a false clustering of P-wave velocity data points around 1900 m/s (the approximate velocity of the pick pipe) as can be seen in the statistics for the Grasshopper hole P-wave velocity (Figure 12). The sonic tool is useful in isolating units with high P-wave velocity, such as the Newmarket Till. The till unit in the Grasshopper hole with high P-wave velocity is geophysically grouped as Newmarket, partially because of it’s velocity character. The Cobble_1 unit and the Sand-Gravel_1 unit have large spreads of velocity data, this is partially due to their small population size and both units have variable velocities throughout. The lower sediments generally have higher velocities than the channel fill deposits, except for the cobble unit.
QLS Project L-128 February 2003
20

Quantec Logging Services YPD Borehole Physical Properties Survey
Figure 12: P-Wave Velocity statistics for each lithology, Grasshopper
3.4.2 MULTI-HOLE COMPOSITE STATISTICAL CHARACTERIZATION OF MORAINE LITHOLOGIES
A multi-hole, multi-parameter statistical characterization was completed for each sub-lithology, defining it’s upper and lower geophysical limits in the YPD survey area. The results are summarized in detail in Appendix C and D in box and whisker plots. The high-quality survey holes in which all geophysical parameters were measured were divided into two statistical categories based on hole construction: the two OGS holes which were constructed with 3.5 inch pvc pipe and Uxbridge, Nobleton, CVC-ORM-01b, Grasshopper and Vandorf which were constructed with 3 inch pvc casing. The results are also displayed by lithology (Clays to Cobbles) for these 7 holes so differences in construction could be observed. The remainder of the hole statistics were analyzed on an individual hole basis, as outlined in section 3.3.1 above. No accurate lithology information was available for King Valley, Ram Forest, and Hillcrest2 because these holes were not cored or sampled, so they were not included in the statistical classification, composite plots of the data collected from these holes are located in Appendix E.
The lithologies used in the statistical analysis were derived from core logs that were subdivided and shifted based on geophysical differences. The major lithologic units are: Sand, Silt, Gravel, Till, Cobble, and Clay. These were originally broken into sub-units and identified by hole for the composite statistics plots. The statistical plots shown in Appendix C are divided into major units so that overall lithology differences can be observed. The original subdivision of lithologies is represented in the geophysical interpretation column on the end of the composite data plots (Appendix E).
QLS Project L-128 February 2003
21

Quantec Logging Services YPD Borehole Physical Properties Survey
3.4.2.1 3.5 inch Hole Composite Statistics
The 3.5 inch PVC hole composite analysis includes OGS holes 15 and 19, located in the York and Durham regions of greater Toronto, respectively. The holes were logged previously by the Geological Survey of Canada with a different suite of logging tools. Figure 13 and Figure 14 are examples of the composite statistics plot for density of the 3.5 inch holes (OGS-PJB-15, and 19), the remainder of the statistics plots can be found in Appendix C. The first plot has the units broken out by hole and lithology subdivision, the second groups both holes together by overall unit to get a more general sense of the differences between Upper and Lower Sediments and Newmarket Till.
Figure 13: 3.5 inch Composite Far Density plot based on Sub-Lithologies
QLS Project L-128 February 2003
22

Quantec Logging Services YPD Borehole Physical Properties Survey
Figure 14: 3.5 inch Far Density Plot Based on General Lithologies
QLS Project L-128 February 2003
23

Quantec Logging Services YPD Borehole Physical Properties Survey
The subclasses o5 and o9 represent holes OGS-PJB-15 and OGS-PJB-19 respectively. The sand and silt units followed immediately by a ‘U’ in these plots are unsaturated units and have a lower density because of their lack of water. Their high neutron count (see Appendix C) is also due to their location within an unsaturated zone. Units followed by an Lw or Up represent the Lower and Upper sediment sequences, respectively. Several till units in the OGS holes were identified in core as Newmarket Till, and have a comparatively higher density than the other units. These till units were also picked out as having a high p-wave velocity.
The survey parameters for the 3.5 inch holes were cross-plotted to better represent the statistical segregation of each lithology class. Figure 15 below is a cross plot of P-Wave Velocity, Neutron, and Density for the two OGS holes. The two classes identified as Newmarket Till are indicated within the red circles. Both groups have a higher P-Wave Velocity, but their densities vary. The clustering of the data points allows for unique identification of the two classes of Newmarket Till in the OGS holes.
3.5 inch Survey HolesOGS-PJB-15 and OGS-PJB-19
F-Med_Sand F_Sand Gravel NTill Sand Silt Clay Till
Figure 15: 3.5 inch Diameter Survey Holes Cross-plot
3.4.2.2 3 inch Hole Composite Statistics
The 3-inch hole statistics include data from the following holes: Uxbridge, Nobleton, CVC-ORM-01b, Grasshopper and Vandorf.
QLS Project L-128 February 2003
24

Quantec Logging Services YPD Borehole Physical Properties Survey
Figure 16: 3 inch Far Density Composite Plot based on Sub-Lithologies
QLS Project L-128 February 2003
25

Quantec Logging Services YPD Borehole Physical Properties Survey
Figure 17: 3 inch Far Density Composite based on General Lithologies
The Gravel, Cobble, and Newmarket Till have the highest overall densities across the 3 inch holes. In the lower range, are silts and some of the finer sands. Grasshopper and Uxbridge appear to have the lowest density sediments out of all the 3 inch holes. This may be due to the composition of the sediments, or it may have something to do with hole construction or probe survey position (see section 4.7 for further explanation).
3.4.2.3 7-Hole Till Classification
Figure 18 represents the P-wave velocities for all till units encountered within the 6 YPD drill holes with a full suite of logs (no till was classified in CVC-ORM-01b). The subclasses are labelled as follows: o9 = OGS-PJB-19, o5 = OGS-PJB-15, ux = Uxbridge, vs = GSC-BH-VSR-01, nb = GSC-BH-NOB-01, and gr = Grasshopper. The tills identified geologically and/or geophysically as Newmarket have significantly higher velocities compared to the other tills. The lithology plots, such as this one, were also used to distinguish geophysical differences caused by hole construction (i.e. different hole diameters, and casing types). P-wave velocity should not be affected by hole diameter because it is calculated based on travel time difference. Because many of the units, for example, sand, have such a wide range of variability, it was difficult to find a quantitative measure of effects caused by hole casing diameter and type. Also see section 4.7 for a description of logging in a variety of hole constructions.
QLS Project L-128 February 2003
26

Quantec Logging Services YPD Borehole Physical Properties Survey
Figure 18: Composite plot for Till units in 3.0 and 3.5 inch Holes
QLS Project L-128 February 2003
27

Quantec Logging Services YPD Borehole Physical Properties Survey
4 CONCLUSIONS
4.1 GEOPHYSICAL CHARACTERIZATION OF THE NEWMARKET TILL The Newmarket Till was indicated to be an important marker bed within the ORM hydrostratigraphy, as it acts as a regional aquitard separating upper confined and lower confined aquifer systems (Desbarats, et al., 2001). Statistical analysis of the logging results indicates that the Newmarket Till is usually recognizable by surveying with a combination of acoustic velocity, neutron, and density logging within pvc cased wells (see Figure 19). Magnetic Susceptibility measurements highlighted variations within the Newmarket Till but were not particularly useful at distinguishing the till from other lithologies. Inductive conductivity and natural gamma both demonstrated a consistent uniform response through the Newmarket Till but lacked sufficient contrasts to identify the till. The till was geophysically and geologically distinguished in wells OGS-PJB-15, OGS-PJB-19, and GSC-BH-VSR-01. Lithology units, with geophysical signatures resembling Newmarket, that were identified as till in core logs; were also apparent in EE11-F and Grasshopper holes. It is likely that the Newmarket Till could be identified in steel cased holes as both neutron and density parameters, although attenuated, can measure through steel.
3.5 inch Survey Holes
OGS-PJB-15 and OGS-PJB-19F-Med_Sand F_Sand Gravel NTill Sand Silt Clay Till
Figure 19: OGS-PJB-15 and OGS-PJB-19 NN-DC-PV Cross-plot showing unique identification of Newmarket Till
The Newmarket Till appears to be distinguishable from other tills in the area based on the statistical analysis (see Appendix D). The Newmarket Till is also a good indicator of the separation boundary between the upper and lower sediments, i.e., when present, it lies between the two.
QLS Project L-128 February 2003
28

Quantec Logging Services YPD Borehole Physical Properties Survey
NEWMARKET TILL
Parameter Rating Usefulness Comments
Neutron ∗∗∗∗ Newmarket Till has very low porosity/moisture content easily identifiable with neutron; works in pvc and steel cased holes
Can measure through steel casing
Density ∗∗∗ Newmarket Till generally higher density
Can measure through steel casing
Full Waveform Sonic ∗∗∗∗
Newmarket Till has a very high P-Wave velocity compared to other ORM sediments
Can only measure in pvc holes with water
Natural Gamma ∗
Very little contrast between Newmarket and other lithologies; works in pvc and steel
May be affected by radioactive elements in grout, Some attenuation in steel cased holes
Inductive Conductivity ∗∗
No apparent conductivity contrast in the Newmarket, although values seem lower than other lithologies
Works only in pvc cased holes
Magnetic Susceptibility ∗∗
Although not significant and consistent, magnetic susceptibility values tend to be higher in the Newmarket Till. Significant MS variations within the Till have been observed
Works only in pvc cased holes
4.2 MAPPING OF THE LOWER SEDIMENTS The lower sediments appear to be recognizable by a coarsening upward pattern in the logs from holes: Grasshopper, GSC-BH-NOB-01, and Pontypool. Keith Fligg (Ontario Ministry of the Environment) initially identified these sequences by their geophysical response (Fligg, et al., 1983). The pattern is seen in the natural gamma and inductive conductivity logs for the PVC cased holes (see Figure 20 – note the Pontypool casing was bent near surface physically preventing the inductive conductivity log for this hole). In this study, the general pattern of these sequences can be traced between the Pontypool and Nobleton holes, an approximate distance of 80 km. This suggests that there is a recognizable structural consistency across the oak ridges moraine area that can be mapped accurately with more geophysical borehole survey information. The upper part of the sequence is missing in the Grasshopper hole because of channel erosion and deposition of channel sediments. The temperature gradient, DT, in Figure 21, responds similarly to the inductive conductivity log in the coarsening upward sequences. This indicates that DT may be useful for identifying the lower sediments in steel cased holes, where the inductive conductivity tool cannot be used.
QLS Project L-128 February 2003
29

Quantec Logging Services YPD Borehole Physical Properties Survey
NG Pontypool30 80
NG Nobleton20 100
NG Grasshopper20 90
ILD Nob0 60
ILD Grasshopper0 60
Figure 20: Lower Sediment Coarsening Upward Sequences in Natural Gamma and Inductive Conductivity Logs from Pontypool, GSC-BH-NOB-01, and Grasshopper (Note: logs not depth
correlated - depth placement approximate)
QLS Project L-128 February 2003
30

Quantec Logging Services YPD Borehole Physical Properties Survey
Figure 21: Variation in DT for GSC-BH-NOB-01
LOWER SEDIMENTS
Parameter Rating Usefulness Comments
Neutron ∗∗∗
Lower sediments have clay layers that stand out with Neutron because of their moisture content. The coarsening upward sequences can be seen in the neutron data but are not as obvious as with natural gamma and IC
Can be measured in PVC and steel cased boreholes. Affected by hole size and absence of water in hole
Density ∗∗
Higher densities may indicate presence of lower sediments due to burial compaction (see Upper Sediment section 4.3)
Can be measured in PVC and steel cased boreholes
Sonic ∗ Most lower sediments P-wave velocity equivalent or lower than PVC velocity
Can only measure in PVC holes with water
Natural Gamma ∗∗∗∗ Coarsening upward sequences identifiable with Gamma
Can measure through steel casing - attenuated
Inductive Conductivity ∗∗∗∗ Coarsening Upward sequences identifiable with IC
Works only in PVC cased holes
QLS Project L-128 February 2003
31

Quantec Logging Services YPD Borehole Physical Properties Survey
Magnetic Susceptibility ∗∗
There are anomalous MS zones in the lower sediments there is a possibility that MS may be used to identify a “marker” within the lower seds
Works only in pvc cased holes
Temperature Gradient ∗∗∗ Mimics the inductive conductivity and natural gamma responses through coarsening upward trends
Can be used in steel and PVC cased holes
4.3 UPPER SEDIMENTS No grain size patterns are apparent in the upper sediments, as they are in the lower. Much of the upper sediments lie within the upper casing in the holes, which is typically steel and many of these sediments are unsaturated, both of which affect the log responses. There is therefore, more limited statistical information about the upper sediments. Additionally, the lack of patterns in the upper sediments may be attributed to their depositional environment. Within the two OGS holes the upper sands have a lower density than the lower sands as apparent in Figure 22 within the red circles. This is likely due to higher compaction at deeper burial depths and is probably consistent across most holes in the region.
Figure 22: 3.5 Inch OGS Holes Far Density Upper and Lower Sand Contrast
UPPER SEDIMENTS
Parameter Rating Usefulness Comments
Neutron ∗∗ Identify saturated and unsaturated zones, indication of moisture content
Can measure through steel casing
QLS Project L-128 February 2003
32

Quantec Logging Services YPD Borehole Physical Properties Survey
of moisture content
Density ∗∗∗ Upper Sediments usually less compact with a lower density
Can measure through steel casing
Sonic ∗∗∗ Upper Sediments typically have lower velocities
Can only measure in PVC holes with water
Natural Gamma ∗∗ Can identify clay units Can measure through steel casing - attenuated
Inductive Conductivity ∗∗ Can identify clay units Works only in PVC cased holes
Magnetic Susceptibility ∗ Needs further investigation Works only in PVC cased holes
4.4 TUNNEL CHANNELS Channel fill sediments are apparent in holes: CVC-ORM-01b, GSC-BH-NOB-01, Pontypool, Grasshopper, Uxbridge, and GSC-BH-VSR-01, as indicated by the core logging done by the Geological Survey of Canada, YPD team, and McMaster University. The channel bottom is represented by a layer of gravel in most holes, that forms part of a regional unconformity (Russell, et al., 2002). Gravel has a distinct geophysical signature, including a high density and a high P-wave velocity, which can be easily picked out on log traces. Inductive conductivity logs through the channel sediments have a distinct noisy character, which can be seen in the upper part of the Grasshopper hole (see Figure 20).
MELT-WATER CHANNELS
Parameter Rating Usefulness Comments
Neutron ∗ Needs further investigation Can measure through steel casing
Density ∗∗∗ Can be used to pick out gravel layer at channel bottom
Can measure through steel casing
Sonic ∗∗∗ Can be used to pick out gravel layer at channel bottom
Can only measure in pvc holes with water
Natural Gamma ∗ Needs further investigation Can measure through steel casing - attenuated
Inductive Conductivity ∗∗∗ Noisy patterns in conductivity log representative of channel fill
Works only in pvc cased holes
Magnetic Susceptibility ∗ Needs further investigation Works only in pvc cased holes
4.5 AQUIFER PROPERTIES Variations in the neutron log in the upper part of hole, OGS-PJB-19, indicate the presence of perched water above the regional water table. Moisture content sampling was completed for Grasshopper and CVC-ORM-01b, the results of which correspond inversely to the QLS neutron logs. Highs and lows in the neutron log (shown in black) correspond to lows and highs in moisture content (shown in red) and therefore, porosity, respectively (see Figure 23). The fluid property logs, i.e. temperature, temperature gradient, and fluid resistivity, can give some indication about water properties in and around the hole.
QLS Project L-128 February 2003
33

Quantec Logging Services YPD Borehole Physical Properties Survey
Metres CVC-ORM-01b Neutron0 1000
Grasshopper Neutron0 1000
-50
-100
-150
CVC Moisture Content0 .5
Grasshopper Moisture Con0 .5
Figure 23: Neutron and Moisture Content Correlation for CVC-ORM-01b (left) and Grasshopper (right) Holes
AQUIFERS
Parameter Rating Usefulness Comments
Neutron ∗∗∗∗ Can be correlated directly to moisture content
Can measure through steel casing
Density ∗∗ May indicate saturated areas Can measure through steel casing
Sonic ∗ Needs further investigation Can only measure in pvc holes with water
Natural Gamma ∗∗ Good indication of clay presence
Can measure through steel casing - attenuated
Inductive Conductivity ∗∗ Good indication of clay presence Works only in pvc cased holes
Magnetic Susceptibility ∗ No discernable magnetic susceptibility contrast Works only in pvc cased holes
QLS Project L-128 February 2003
34

Quantec Logging Services YPD Borehole Physical Properties Survey
4.6 CLAY MARKER BEDS The major feature associated with the clay units is the coarsening upward patterns mentioned in relation to the lower sediments seen in holes: Pontypool, Grasshopper, and GSC-NOB-01. The clay-rich layers are associated with higher gamma and inductive conductivity counts in all three holes (no inductive conductivity log was run for Pontypool, because the diameter of the hole would not accommodate the tool). As mentioned previously, the coarsening upward sequences are an important stratigraphic marker for the lower sediments. The clays represent the base of these sequences. The neutron log indicates that the clays have very high moisture content. In Figure 24 the clay units in holes: Grasshopper, GSC-BH-NOB-01, OGS-PJB-19, and CVC-ORM-01b have a neutron range less than 500 counts per second, where the other lithology units can reach counts of 1400.
Figure 24: Neutron Composite Plot for Clay
CLAY BEDS
Parameter Rating Usefulness Comments
Neutron ∗∗∗ Relates to moisture content, which may indicate clay presence
Can measure through steel casing
Density ∗∗ Needs further investigation Can measure through steel casing
Sonic ∗ Velocity of clay too low to be discernable
Can only measure in pvc holes with water
Natural Gamma ∗∗∗∗ Good indicator of clay presence
Can measure through steel casing - attenuated
QLS Project L-128 February 2003
35

Quantec Logging Services YPD Borehole Physical Properties Survey
Inductive Conductivity ∗∗∗∗ Good indicator of clay presence Works only in pvc cased holes
Magnetic Susceptibility ∗ No distinctive magnetic susceptibility contrast Works only in pvc cased holes
4.7 SPECTRAL GAMMA RESULTS The spectral gamma logs for OGS-19 and OGS-15 are shown in Figure 25 and Figure 26. The natural gamma (total count) log is also shown for comparison. The U, K and Th counts in both holes are characterized by low overall count levels (< 2 cps). The lithologic logs for each hole are based on core log data provided by the Geological Survey of Canada.
Metres Th
(CPS)0 1U
(CPS)0 1Gamma
(CPS) 20New Text Column
0
-10
-20
-30
-40
-50
-60
-70
-80
-90
Halton Till aSiltHalton Till B
Sand
Sand
Sand
Till c
Gravel
Newmarket Till 2i
Newmarket Till 2ii
Clay
K(CPS)0 2 0 1
Figure 25: Spectral Gamma log of OGS-PJB-19
QLS Project L-128 February 2003
36

Quantec Logging Services YPD Borehole Physical Properties Survey
Metres Th(CPS)0 1
U(CPS)0 1
Gamma(CPS) 5
New Text Column
0
-10
-20
-30
-40
-50
-60
-70
-80
Silt
Fine Sand
SiltTill (massive sandy silt with pebbles)Sand (very fine to fine grained)
SiltSand (very fine to fine grained)SiltSand (very fine to fine grained)
Sand (fine to medium)
Sand (very fine to fine grained)
Silt
Newmarket Till
Sand (medium to fine and very fine sand interbedded)
K(CPS)0 2 0 7
Figure 26: Spectral gamma log for OGS-PJB-15
4.7.1 BOREHOLE OGS-PJB-19 In OGS-19 the U and K logs show a similar response to the natural gamma in the Halton Till and in the underlying sandy sequence that extends to 28 m depth. The Thorium count levels are very low (<< 1 or in some cases 0) throughout the log and are deemed to be too low to allow lithologic interpretation of the log response. The spectral response in the Newmarket Till shows increasing U and K towards the base of the unit; a corresponding increase in counts is not evident in the natural gamma. The increase in K and U may reflect increasing abundance of clays (main source of K) and crystalline lithic fragments (source of U and also K) within the bottom half of the till. The cross-plotted U/K values are shown in Figure 27. The count levels have been normalized to a maximum value of one for both parameters. The Newmarket and Halton tills plot as two well-defined linear data clusters with different slopes indicating that they have distinctive U/K ratios. The Newmarket till shows a lower U/K ratio than the Halton till (lower slope) and an increase in both U and K with depth. The cross plot also suggests a two-part subdivision of the Newmarket till at this location. The lower sub-unit of the Newmarket shows a steeper U/K and merges in the upper right quadrant of the plot with the data cluster representing the underlying clay-rich lower sediments (Figure 28).
QLS Project L-128 February 2003
37

Quantec Logging Services YPD Borehole Physical Properties Survey
Natural Gamma Versus U and KOGs-19
Till 2iiTill 2iTill bTill aGravelTill cSandClaySilt
Figure 27: Cross-plot of Natural gamma vs. Potassium, Uranium for OGS-PJB-19
Till 2iiTill 2iTill bTill aGravelTill cSandClaySilt
Figure 28: Cross-plot of Potassium vs. Uranium for OGS-PJB-19
The Th/K ratios were not cross-plotted for OGS-19 because the Th count levels were too low to provide a statistically significant measurement. The clear linear trends in the U/K ratios suggest however, that the method has some potential for lithologic typing of the tills. Further logging and
QLS Project L-128 February 2003
38

Quantec Logging Services YPD Borehole Physical Properties Survey
fieldwork is being conducted to investigate the use of U/K and Th/K ratios for typing till deposits and other clay-rich Quaternary sediments (see below).
4.7.2 BOREHOLE OGS-PJB-15 In OGS-15 the U and K parallel the natural gamma log in the upper 40 m sequence of interbedded silt clay sands and till. All three logs show increasing count levels due to an increase in silt and clay upwards in the sequence. The K log response in the underlying Newmarket Till shows an inverse trend, with K declining with depth while the natural gamma counts increase. This trend is interpreted as a decrease in clay content with depth. The U/K cross plot for OGS-15 is shown in Figure 29 and Figure 30. Only the Newmarket Till is present at this borehole so no comparisons could be made between the Newmarket and Halton till U/K ratios. The cross-plot shows a broad cluster with a more overlap between the lithologic units than in OGS-19. This in part reflects the more homogenous sandy composition of the till and overlying sandy sequences in this borehole; no clays are present at this location. The plot does demonstrate however, that the Newmarket can be distinguished from fine sand and silt facies based on their U/K ratios.
K, U vs Natural GammaOGS-15
Fine SandSandSiltTill
Figure 29: Cross-plot of Natural gamma vs. Potassium, Uranium for OGS-PJB-15
QLS Project L-128 February 2003
39

Quantec Logging Services YPD Borehole Physical Properties Survey
K Vs UOGS-15
Fine SandSandSiltTill
Figure 30: Cross-plot of Potassium, Uranium for OGS-PJB-15
4.8 PHYSICAL PROPERTY ANALYSIS AND DIFFERENCES IN HOLE CONSTRUCTION The multi-hole statistical analyses completed for the YPD study looked at a comparison of similarly constructed holes, i.e. 3 inch pvc and 3.5 inch pvc, where all survey parameters were measured. Differences in hole construction can include: casing type, inside casing diameter, outside hole diameter, amount and type of grouting used, and the presence of screens. All of which can have a significant effect on geophysical data collection, i.e. create unnatural data highs or lows, or skew the data positively or negatively. The best scenario for sedimentary environments, where casing is necessary, is to utilize a consistent hole size, casing type and size, and grouting thickness and type. A standard should be set for future construction of water wells in the YPD area, where the casing diameter and type, and hole diameter and grouting type and thickness are consistent.
QLS Project L-128 February 2003
40

Quantec Logging Services YPD Borehole Physical Properties Survey
5 RECOMMENDATIONS
Recommendations from this report are briefly summarized below:
• Run a complete suite of geophysical logs in all future “golden spike” holes with high quality geologic control (cored or frequently sampled) that intersect key hydrostratigraphic units. This will provide additional data to build upon the results of this report and optimise the value of geolphysical logs in the future. Some hydrostratigraphic units were only intersected in a few holes and thus the results of this report are based on a limited statistics. In addition to improving our knowledge and understanding of key hydrostratigraphic units, data from future “golden spike” holes will provide an opportunity to study lateral variations in the physical properties
• Devise a routine borehole geophysical logging program aimed at cost effectively improving our understanding of the complex geology of the Oak Ridges moraine. The goal is to acquire data efficiently by focussing on the parameters most likely to add value. The “optimum” suite of parameters can vary depending on the application and well construction. The Newmarket till, for example is best identified by acoustic velocity, neutron, and density whereas natural gamma, inductive conductivity, and neutron are best suited to map the lower sediments. Well construction, especially casing type, can preclude the use of certain parameters. Inductive conductivity, and magnetic susceptibility, for example cannot measure through steel casing whereas parameters such as neutron, natural gamma and density can. The routine geophysical logging program should have optimum suites of parameters identified for specific applications and casing type.
• Standardize well construction for all future “golden spike” boreholes or other holes where geophysical surveys are proposed or could add value. Casing type and size, back fill material/grout type and thickness, drill hole diameter etc. can all have a significant effect on geophysical measurements. Standardized well construction will allow for quantitative hole-to-hole comparisons of lithologies over great distances, where as wells constructed differently are limited to less desirable qualitative interpretations.
• Determine correction factors between geophysical parameters logged through standard steel cased water wells vs. standard PVC cased wells. Some geophysical parameters such as neutron, density, and gamma can measure through PVC and steel cased holes although the steel has an attenuating effect. Quantifying the attenuation effect would allow for normalization of data recorded through both casing types. Ideally, if a standard steel cased water well existed adjacent to (thus intersecting the same key lithologies) a standard PVC cased well a direct correlation could be established.
• The applicability of Spectral Gamma logging should be further investigated as it could provide quantitative information about clay mineralogy and in turn the provenance of the sediments. This work will be conducted by Shawn Collins as part of his M.Sc. thesis work at McMaster University.
• Study the neutron-porosity relationship in more detail. Results have indicated an inverse relationship between neutron count rate and lab determined moisture content from core samples. This relationship however, is only based on two holes and appears to be somewhat complex warranting further study.
The project was successful in achieving the initial goals, and a more extensive, routine, long-term geophysical acquisition program will clearly improve the overall understanding of the complex geology and hydrogeology of the Oak Ridges Moraine. Building a library of borehole geophysical results from across the YPD area will greatly improve regional scale stratigraphic correlation and ultimately provide greater confidence in the geologic input to numerical groundwater models. The initial geophysical logging
QLS Project L-128 February 2003
41

Quantec Logging Services YPD Borehole Physical Properties Survey
program in the York-Peel-Durham region was very successful in terms of characterizing the ORM sediments, correlating sediment patterns regionally, and determining which tools are best suited for mapping specific lithologic sequences.
RESPECTFULLY SUBMITTED
Vince Gerrie President, P.Geo – QLS
Katie Blasco B.Sc. Engineering Geophysics – QLS
Shawn Collins Masters Student, Geophysics – McMaster University
QLS Project L-128 February 2003
42

Quantec Logging Services YPD Borehole Physical Properties Survey
REFERENCES
Desbarats, A.J., Hinton, M.J., Logan, C.E., and Sharpe, D.R. 2001. Geostatistical mapping of leakance in a regional aquitard, Oak Ridges Moraine area, Ontario, Canada. Hydrogeology Journal. http://link.springer.de Fligg, K., and Rodrigues, B., 1983. Geophysical Well Log Correlations Between Barrie and the Oak Ridges Moraine. Water Resources Branch, Ontario Ministry of the Environment Map 2273 Hearst, J.R., Nelson, P.H., and Paillet, F.L. 2000. Well Logging for Physical Properties: A Handbook for Geophysicists, Geologists, and Engineers. New York: McGraw-Hill Book Company. Pullan, S.E., Hunter, J.A., Pugin, A., Burns, R.A., and Hinton, M.J. 2000. Downhole seismic logging techniques in a regional hydrogeology study, Oak Ridges Moraine, southern Ontario in Proceedings of a Symposium on the Application of Geophysics to Engineering and Environmental Problems, Environmental and Engineering Geophysical Society, Arlington VA. p.643-652.
Quirein, J.A., Baldwin, J.L., Terry, R.L. and Hendrieks, M. 1982. Estimation of clay types and volumes from well log data: an extension of the GLOBAL method. 22nd Annual SPWLA Log. Symp. Trans., pap. Q. Russell, H.A.J., Arnott, R.W.C., and Sharpe, D.R. 2002. Evidence for rapid sedimentation in a tunnel channel, Oak Ridges Moraine, southern Ontario, Canada. Sedimentary Geology. Article in Press. p. 1-23.
QLS Project L-128 February 2003
43

Quantec Logging Services YPD Borehole Physical Properties Survey
APPENDIX A: STATEMENT OF QUALIFICATIONS
STATEMENT OF QUALIFICATIONS:
I, Vince J. Gerrie, hereby declare that:
1) I am a registered professional geoscientist with residence in Toronto, Ontario and am presently employed in this capacity with Quantec Logging Services Inc. of Toronto, Ontario. 2) I am a graduate of The University of Waterloo, Waterloo, Ontario with an Honors B.Sc. in Earth Sciences. 3) I have practiced my profession continuously since Graduation.
4) I am a member of the Canadian Society of Exploration Geophysicists, and the Prospectors and Developers Association.
5) I have no interest, nor do I expect to receive any interest in the properties or securities of York, Peel, and Durham municipalities or their subsidiaries.
6) I am the author of this report and the statements contained represent my professional opinion based on my consideration of the information available to me at the time of writing this report.
Toronto, Canada February 2003
Vince J. Gerrie, P.Geo President Quantec Logging Services
QLS Project L-128 February 2003

Quantec Logging Services YPD Borehole Physical Properties Survey
APPENDIX A
STATEMENT OF QUALIFICATIONS:
I, Katie A. Blasco, hereby declare that:
1) I am a geoscientist with residence in Toronto, Ontario and am presently employed in this capacity with Quantec Logging Services Inc. of Toronto, Ontario.
2) I am a graduate of Queen’s University, Kingston, Ontario in 2001 with a B.Sc.Eng. in
Engineering Geophysics.
3) I have practiced my profession continuously since Graduation.
4) I have no interest, nor do I expect to receive any interest in the properties or securities of York, Peel, and Durham municipalities or their subsidiaries.
5) I am the author of this report and the statements contained represent my professional opinion
based on my consideration of the information available to me at the time of writing this report.
Toronto, Canada February 2003
Katie A. Blasco B.Sc. Engineering Geophysics Quantec Logging Services
QLS Project L-128 February 2003

Quantec Logging Services YPD Borehole Physical Properties Survey
APPENDIX A
STATEMENT OF QUALIFICATIONS:
I, Shawn Collins, hereby declare that:
1) I am a geoscientist with residence in Hamilton, Ontario and am presently employed in this capacity with Quantec Logging Services Inc. of Toronto, Ontario.
2) I am in the process of completing a Masters in Geophysics at McMaster University, Hamilton,
Ontario and received a B.Sc. in Geology from McMaster in 2002.
3) I have no interest, nor do I expect to receive any interest in the properties or securities of York, Peel, and Durham municipalities or their subsidiaries.
4) I am the author of this report and the statements contained represent my professional opinion
based on my consideration of the information available to me at the time of writing this report.
Toronto, Canada February 2003
Shawn Collins B.Sc. Geology Quantec Logging Services
QLS Project L-128 February 2003

Quantec Logging Services YPD Borehole Physical Properties Survey
APPENDIX B: YPD BASEMAP
QLS Project L-128 February 2003
Cobo
Otonabee
South Mon
Emily
Township
Verulam
Township
Fenelon
Hamilton
Townshi
City of
Peterborough
Port Hope
Cavan
Millbrook North
Eldon
Douro
Towns
Ops
Township
Manvers
Township
Tow
nsh
ip o
f Adja
la-
Toso
rontio
Bradford -
West
GwillimburyNewTecumseth
Township
Town of
InnisfilEssaTownship
City ofBarrie
LakeSimcoe
SpringwaterTownship
Lindsay
Town
ofNewmarket
Town
ofAurora
City of
Vaughan
Town of
Markham
Town of
Whitchurch
Stoufville
Town of
East
Gwillimbury
Town of
Georgina
Township
ofUxbridge
City of
PickeringT
own of W
hitbyC
ity of Oshaw
a
Municipality of
Clarington
Scugog Township
Brock
Township
Town
of Ajax
Township of
King
Tow
n o
f
Rich
mond
Hill
Town
ofNewmarket
Town
ofAurora
City of
Vaughan
Town of
Markham
Town of
Whitchurch
Stoufville
Town of
East
Gwillimbury
Town of
Georgina
Township
ofUxbridge
City of
PickeringT
own of W
hitbyC
ity of Oshaw
a
Municipality of
Clarington
Mariposa
Township
Town
of Ajax
Township of
King
Tow
n o
f
Rich
mond
Hill
Nessleton
Station
Utica
Epsom
Marsh
Hill Greenbank
Saintfield
Seagrave
Maple
Beach
Gamebridge
Beaverton
Derryville
Vroomanton
CanningtonPort
Bolster
Blackwater
Sunderland
Leaskdale
Zephyr
Victoria
Corners
Scugog
Centre
Sandford
Cadmus
Blackstock
Caesarea
Port
PerryUxbridge
Coppins
Corners
Goodwood
Balsam
GreenwoodKinsale
Brougham
Green
River
Whitevale
Claremont
Raglan
Columbus
AshburnMyrtle
Brooklin
Maple
Grove
Solina
Taunton
Enfield
PortDarlington
Brownsville
Crooked
Creek
Newtonville
Courtice
Haydon
Enniskillen
Hampton
Tyrone
Kendal
KirbyLeskard
Bowmanville
Newcastle
OronoOrono
NewcastleBowmanville
Leskard
Kirby
Kendal
Tyrone
Hampton
Enniskillen Haydon
Courtice
Newtonville
Crooked
Creek
Brownsville
PortDarlington
Enfield
Taunton
Solina
Maple
Grove
Brooklin
Myrtle
Ashburn
Columbus
Raglan
Claremont
Whitevale
Green
River
Brougham
Kinsale
Greenwood
Balsam
Goodwood
Coppins
Corners
UxbridgePort
Perry
Caesarea
Blackstock
CadmusSandford
Scugog
Centre
Victoria
Corners
Zephyr Leaskdale
Sunderland
Blackwater
Port
Bolster
Cannington
Vroomanton
Derryville
Beaverton
Gamebridge
Maple
Beach
Seagrave
Saintfield
GreenbankMarsh
Hill
Epsom
Utica
Nessleton
Station
Slesw
ick
Bolto
n
Palg
rave
Lock
ton
Mono
Mills
Albio
n
Ced
ar M
ills
Cov
entryCas
tlede
rg
Caled
on
East
Sandh
ill
Tulla
mor
e
May
field
Wild
field
Che
ltenh
am
Bosto
nM
ills
Ingl
ewoo
d
Slig
o
Credi
tFor
ks
Cal
edon
Kilm
anag
h
Cal
dwel
l
Mount Albert
Schomberg
Nobleton
King City
Klienberg
Aurora
Newmarket
Oak Ridges
Stouffville
Holland
LandingQueensville
Highw
ay 50
Nashville Rd.
Cou
ntry
side
Dr.
May
field
Rd.
Cas
tlem
ore
Rd.
Coleraine Dr.
Clarkway Dr.The Gore RoadM
cVean Dr.Goreway Dr.Airport Rd
Torbram R
d.Bramalea Rd.Dixie Rd.
Heart Lake RdK
Airport Rd.
King S
t.
Old S
choo
l Rd.
No.
32
Sid
eroa
d
Heart Lake Road
Horseshoe Hill Road
Huntin
gto
n R
d.
Hig
hw
ay
27
Kip
l;i ng A
ve.
McC
ow
an
Rd.
Kennedy
Rd.
Ward
en A
ve.
Lesl
ie S
t.
Hig
hw
ay
48
Nin
th L
ine
Tent
h L
ine
Woodbin
e A
ve.
Pin
e V
alle
y D
r.
Cold
Cre
ek
Rd.
West
on R
d.
Jane S
t.
Keele
St.
Dufferin
St.
Bath
urs
t S
t.
Yong
e S
t.
Bayv
iew
Ave
.
King Rd.
15th Sideroad
16th Sideroad
Kirby Rd.
Teston Rd.
Elgin Mills Rd. E.
Major Mackenzie Dr. E.
Major Mackenzie Dr. W.
King Vaughan Rd.
17th Sideroad
Bethesda Sideroad
Stouffville Rd.
19th Ave.
18th Sideroad
19th Sideroad Lloydtown-Aurora Rd.
St. John's Sideroad
Aurora Rd.
Vandorf Sideroad
Bloomington Rd.
Wellington St. W.
Highway 9
Miller's Sideroad Vivian Rd.
Davis Dr.
Herald Rd.
Hig
hw
ay
48
Green Lane E.
Doane Rd.Mount Albert R
d.
Old Homestead Rd.
Smith Blvd.
Frog Rd.
Old Shiloh Rd.
Ravenshoe Rd.
Ravenshoe Rd.
Boag Rd.
Boag Rd.
Holborn Rd.
Holborn Rd.
Queensville Sideroad
Queensville Sideroad
Doanne Rd.
Kenne
dy
Rd.
Lesl
ie S
t.
Yonge
St.
Bath
urs
t S
t.
2nd C
oncess
ion R
d.
Civ
ic C
entr
e R
d.
McC
ow
an
Rd.
Highway 48
Glenwoods Ave.
Her
on
Rd
.
Dagm
ar R
d.
Ash
burn
Rd.
Duffs
Rd
.
8th
Conc.
7th
Conc. Ja
ne S
t.
Hig
hw
ay
40
0
Keele
St.
Wes
ton
Rd.
Lak
e R
idge R
d.
Zephyr Rd.
Meyers Rd.
Hollingers Rd.
Ashworth Rd.
Sanford Rd.
Davis Dr.
Feasby Rd.
Wagg Rd.
Conc
. 2 Con
c. 3
Conc
. 4 Con
c. 5
Leaskdale Rd.
Reach St.
Con
c. 7
Scugog Line 14
Blue Mountain Rd.
Scugog Line 12
Cragg Rd.
Scugog Line 10
Scugog Line 9
Scugog Line 8
Scugog Line 6
Reach St.
Mast R
d.
Con
c. 7
Lake
Rid
ge R
d.
Con
c. 8
Chalk Lake Rd.Middle March Rd.
Ashburn R
d.
Hig
hway
7/1
2
Mars
h H
ill R
d.
Highway 7a
Scugog Line 2
Townline Rd.
Uxbridge-Pickering Townline
Webb Rd.
Bro
ck R
d.
Con
c. 6
Mur
phy
Rd.
Lon
g S
ault
Rd.
Concession Rd. 9
Mckee Rd.
Devitts Rd.
Highway 7a
Proutt Rd.
Malcolm Rd.
Edgerton Rd.
Church St.
Bradburn Rd.
Cart
wrigh
t East
Qua
rter
Lin
e
Car
twrig
ht W
est
Qua
rter
Lin
e
Wils
on
Ave
.
Boundary Rd.
Boundary Rd.
Ced
ard
ale R
d.
Howden Rd.
Raglan Rd.
Concession Rd. 10
Mount Joy Rd.
Byers Rd. Old
Scu
gog
Rd.
Reg
iona
l Rd.
57
Concession Rd. 7
Concession Rd. 8
Lib
erty
St.
Bet
hesd
a R
d. Les
kard
Rd.
Hig
hw
ay
35/1
15
Hig
hw
ay
35/1
15
Best
Rd.
Mosp
ort
Rd.
Bro
wn R
d.
Concession Rd. 10
Bra
gg R
d.
Pro
viden
ce R
d.Lam
bs R
d.
Concession Rd. 6
Taunton Rd.
Solin
a R
d.
Rund
le R
d.
Mid
dle R
d.
Mid
dle S
t.
Acr
es
Rd
.
Gra
ssho
pper
Park
Rd.
Rits
on R
d.
Wils
on R
d.
Har
mon
y R
d.
Tow
nlin
e R
d.
Enfie
ld R
d.
Lan
gmai
d R
d.
Reg
iona
l Rd.
57
(Wav
erly
Rd.
)
New
tonv
ille
Rd.
Ganaraska Rd.
Concession Rd. 7
Concession Rd. 6
Concession Rd. 5
Concession Rd. 4
Shi
loh
Rd.
Gilm
ore
Rd
.
Sope
r R
d.
Lang
staf
f R
d.
Mor
gans
Rd.
Sta
ple
ton
Rd.
Scugog Line 3
Regio
nal R
oad 2
Lake Simcoe RegionCons. Authority
Kawartha RegionCons. Authority
Otonabee RegioCons. Authority
Ganaraska RegioCons. Authority
Central Lake OntarioCons. Authority
Toronto RegionCons. Authority
Graham Creek
Oshawa Creek
Lynde Creek
Bowmanville
Creek
Soper Creek
Duffins Creek
Petticoat
Creek
Highland Creek
Rouge River
Nonquon River
EastcrossCreek
Beaver River
Pefferlaw & UxbridgeBrook
Black River
MaskinongeCreek
West HollandRiver
East HollandRiver
Humber River
Don River
Ganaraska River
Wilmot Creek
600000 620000 640000 660000 680000 700000 720000Easting

Quantec Logging Services YPD Borehole Physical Properties Survey
APPENDIX C: MULTIHOLE STATISTICS
MULTI-HOLE COMPOSITE STATISTICAL CHARACTERIZATION BY CONSTRUCTION
• 3.5 INCH HOLE COMPOSITE
o OGS-PJB-15
o OGS-PJB-19
• 3 INCH HOLE COMPOSITE
o CVC-ORM-O1B
o GRASSHOPPER
o GSC-BH-NOB-01
o GSC-BH-VSR-01
o UXBRIDGE
QLS Project L-128 February 2003

Quantec Logging Services YPD Borehole Physical Properties Survey
APPENDIX C – 3.5 INCH FAR DENSITY STATISTICS
QLS Project L-128 February 2003

Quantec Logging Services YPD Borehole Physical Properties Survey
APPENDIX C – 3.5 INCH NATURAL GAMMA STATISTICS
QLS Project L-128 February 2003

Quantec Logging Services YPD Borehole Physical Properties Survey
APPENDIX C – 3.5 INCH DEEP INDUCTIVE CONDUCTIVITY STATISTICS
QLS Project L-128 February 2003

Quantec Logging Services YPD Borehole Physical Properties Survey
APPENDIX C – 3.5 INCH MAGNETIC SUSCEPTIBILITY STATISTICS
QLS Project L-128 February 2003

Quantec Logging Services YPD Borehole Physical Properties Survey
APPENDIX C – 3.5 INCH NEUTRON STATISTICS
QLS Project L-128 February 2003
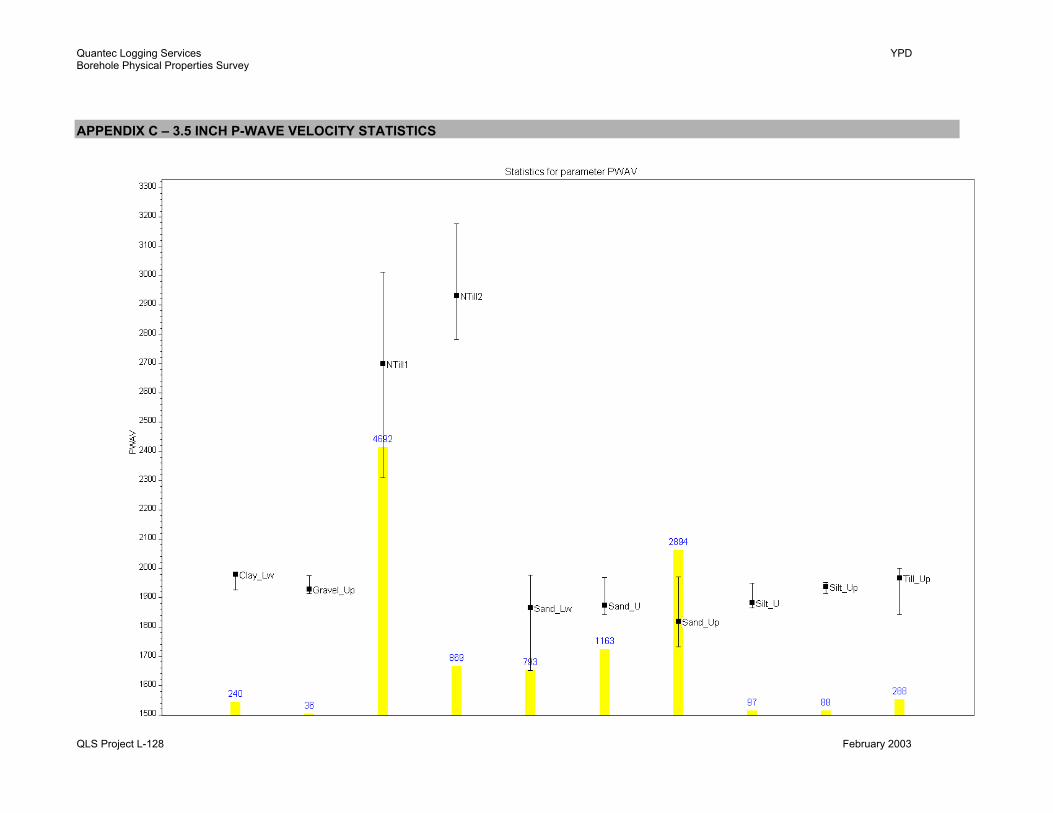
Quantec Logging Services YPD Borehole Physical Properties Survey
APPENDIX C – 3.5 INCH P-WAVE VELOCITY STATISTICS
QLS Project L-128 February 2003

Quantec Logging Services YPD Borehole Physical Properties Survey
APPENDIX C – 3.0 INCH FAR DENSITY STATISTICS
QLS Project L-128 February 2003

Quantec Logging Services YPD Borehole Physical Properties Survey
APPENDIX C – 3.0 INCH NATURAL GAMMA STATISTICS
QLS Project L-128 February 2003

Quantec Logging Services YPD Borehole Physical Properties Survey
APPENDIX C – 3.0 INCH DEEP INDUCTIVE CONDUCTIVITY STATISTICS
QLS Project L-128 February 2003

Quantec Logging Services YPD Borehole Physical Properties Survey
APPENDIX C – 3.0 INCH MAGNETIC SUSCEPTIBILITY STATISTICS
QLS Project L-128 February 2003

Quantec Logging Services YPD Borehole Physical Properties Survey
APPENDIX C – 3.0 INCH NEUTRON STATISTICS
QLS Project L-128 February 2003
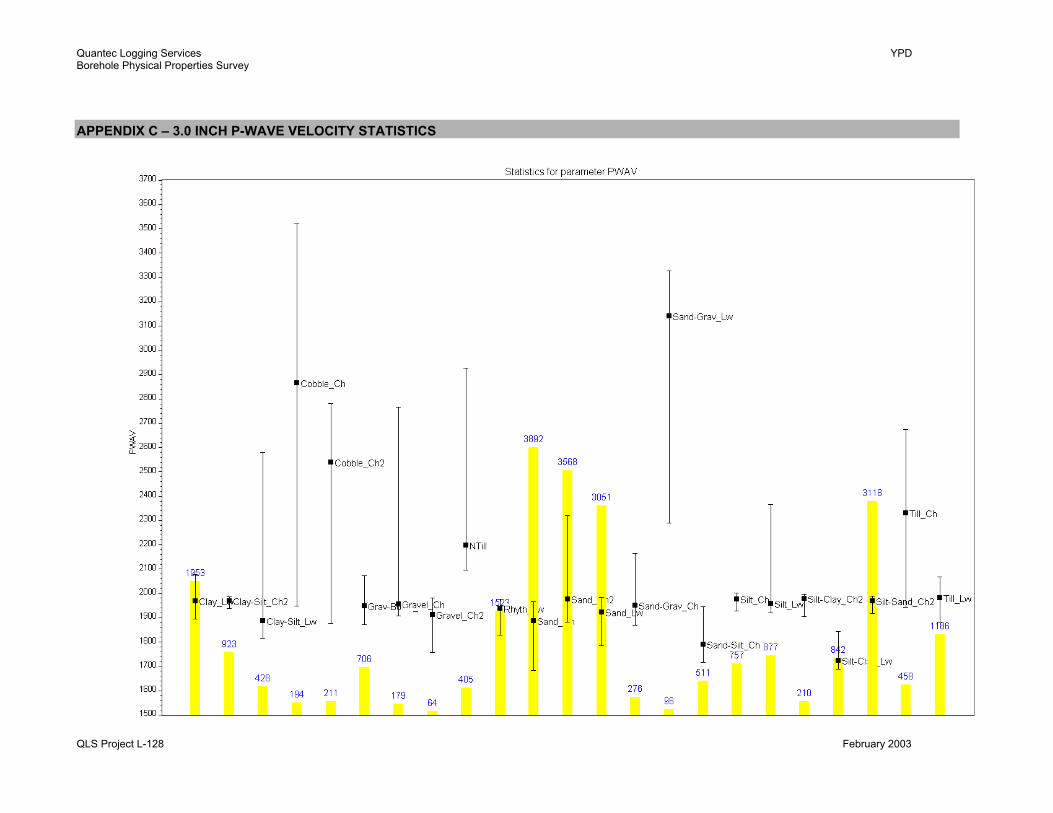
Quantec Logging Services YPD Borehole Physical Properties Survey
APPENDIX C – 3.0 INCH P-WAVE VELOCITY STATISTICS
QLS Project L-128 February 2003
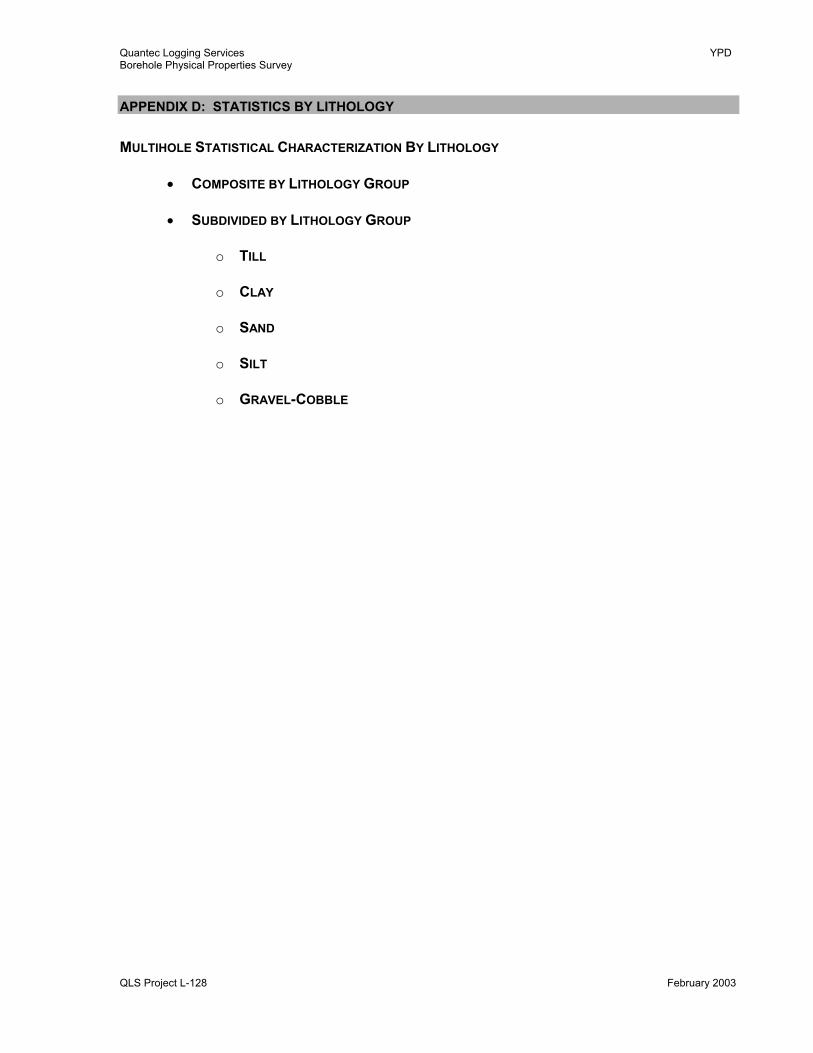
Quantec Logging Services YPD Borehole Physical Properties Survey
APPENDIX D: STATISTICS BY LITHOLOGY
MULTIHOLE STATISTICAL CHARACTERIZATION BY LITHOLOGY
• COMPOSITE BY LITHOLOGY GROUP
• SUBDIVIDED BY LITHOLOGY GROUP
o TILL
o CLAY
o SAND
o SILT
o GRAVEL-COBBLE
QLS Project L-128 February 2003

Quantec Logging Services YPD Borehole Physical Properties Survey
APPENDIX D – FAR DENSITY COMPOSITE STATISTICS BY LITHOLOGY
QLS Project L-128 February 2003

Quantec Logging Services YPD Borehole Physical Properties Survey
APPENDIX D – NATURAL GAMMA COMPOSITE STATISTICS BY LITHOLOGY
QLS Project L-128 February 2003

Quantec Logging Services YPD Borehole Physical Properties Survey
APPENDIX D – DEEP INCONDUCTIVE CONDUCTIVITY COMPOSITE STATISTICS BY LITHOLOGY
QLS Project L-128 February 2003

Quantec Logging Services YPD Borehole Physical Properties Survey
APPENDIX D – MAGNETIC SUSCEPTIBILITY COMPOSITE STATISTICS BY LITHOLOGY
QLS Project L-128 February 2003

Quantec Logging Services YPD Borehole Physical Properties Survey
APPENDIX D – NEUTRON COMPOSITE STATISTICS BY LITHOLOGY
QLS Project L-128 February 2003

Quantec Logging Services YPD Borehole Physical Properties Survey
APPENDIX D – P-WAVE VELOCITY COMPOSITE STATISTICS BY LITHOLOGY
QLS Project L-128 February 2003

Quantec Logging Services YPD Borehole Physical Properties Survey
APPENDIX D – TILL FAR DENSITY COMPOSITE STATISTICS
QLS Project L-128 February 2003

Quantec Logging Services YPD Borehole Physical Properties Survey
APPENDIX D – TILL NATURAL GAMMA STATISTICS
QLS Project L-128 February 2003

Quantec Logging Services YPD Borehole Physical Properties Survey
APPENDIX D – TILL DEEP INDUCTIVE CONDUCTIVITY STATISTICS
QLS Project L-128 February 2003

Quantec Logging Services YPD Borehole Physical Properties Survey
APPENDIX D – TILL MAGNETIC SUSCEPTIBILITY COMPOSITE STATISTICS
QLS Project L-128 February 2003

Quantec Logging Services YPD Borehole Physical Properties Survey
APPENDIX D – TILL NEUTRON COMPOSITE STATISTICS
QLS Project L-128 February 2003

Quantec Logging Services YPD Borehole Physical Properties Survey
APPENDIX D – TILL P-WAVE VELOCITY COMPOSITE STATISTICS
QLS Project L-128 February 2003

Quantec Logging Services YPD Borehole Physical Properties Survey
APPENDIX D – CLAY FAR DENSTIY COMPOSITE STATISTICS
QLS Project L-128 February 2003

Quantec Logging Services YPD Borehole Physical Properties Survey
APPENDIX D – CLAY NATURAL GAMMA COMPOSITE STATISTICS
QLS Project L-128 February 2003

Quantec Logging Services YPD Borehole Physical Properties Survey
APPENDIX D – CLAY DEEP INDUCTIVE CONDUCTIVITY COMPOSITE STATISTICS
QLS Project L-128 February 2003

Quantec Logging Services YPD Borehole Physical Properties Survey
APPENDIX D – CLAY MAGNETIC SUSCEPTIBILITY COMPOSITE STATISTICS
QLS Project L-128 February 2003

Quantec Logging Services YPD Borehole Physical Properties Survey
APPENDIX D – CLAY NEUTRON COMPOSITE STATISTICS
QLS Project L-128 February 2003

Quantec Logging Services YPD Borehole Physical Properties Survey
APPENDIX D – CLAY P-WAVE VELOCITY COMPOSITE STATISTICS
QLS Project L-128 February 2003

Quantec Logging Services YPD Borehole Physical Properties Survey
APPENDIX D –SAND FAR DENSITY COMPOSITE STATISTICS
QLS Project L-128 February 2003
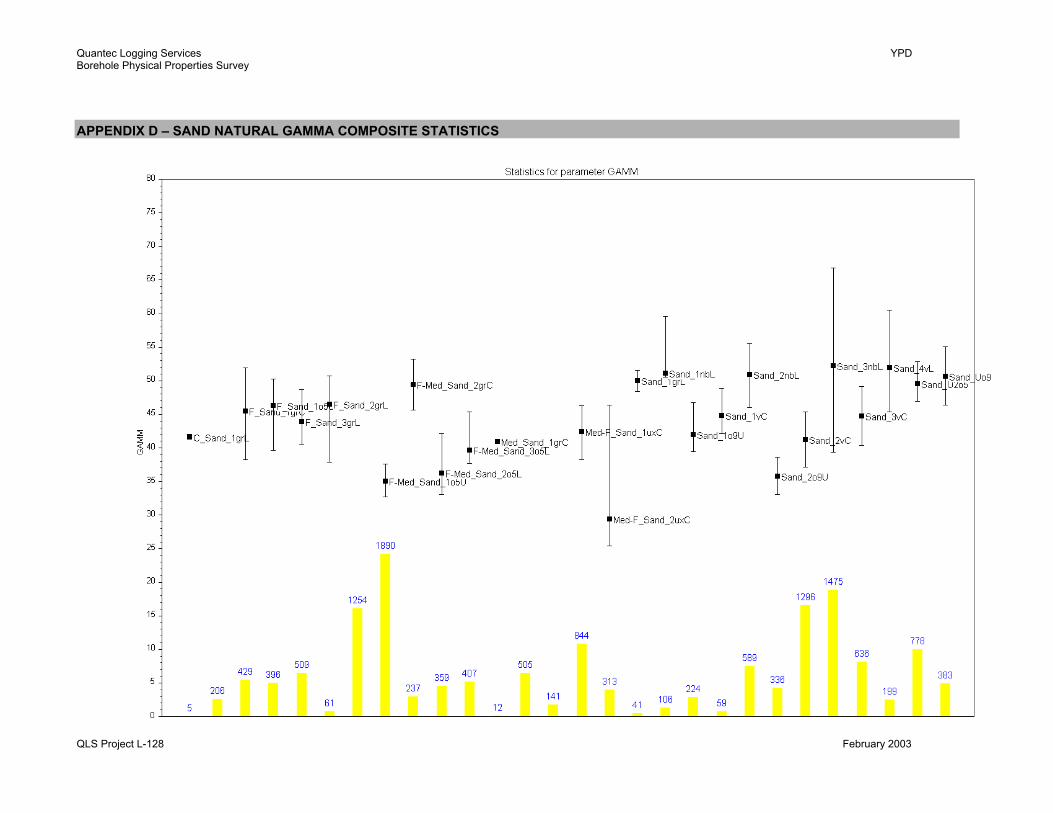
Quantec Logging Services YPD Borehole Physical Properties Survey
APPENDIX D – SAND NATURAL GAMMA COMPOSITE STATISTICS
QLS Project L-128 February 2003

Quantec Logging Services YPD Borehole Physical Properties Survey
APPENDIX D – SAND DEEP INDUCTIVE CONDUCTIVITY COMPOSITE STATISTICS
QLS Project L-128 February 2003

Quantec Logging Services YPD Borehole Physical Properties Survey
APPENDIX D – SAND MAGNETIC SUSCEPTIBILITY COMPOSITE STATISTICS
QLS Project L-128 February 2003

Quantec Logging Services YPD Borehole Physical Properties Survey
APPENDIX D – SAND NEUTRON COMPOSITE STATISTICS
QLS Project L-128 February 2003
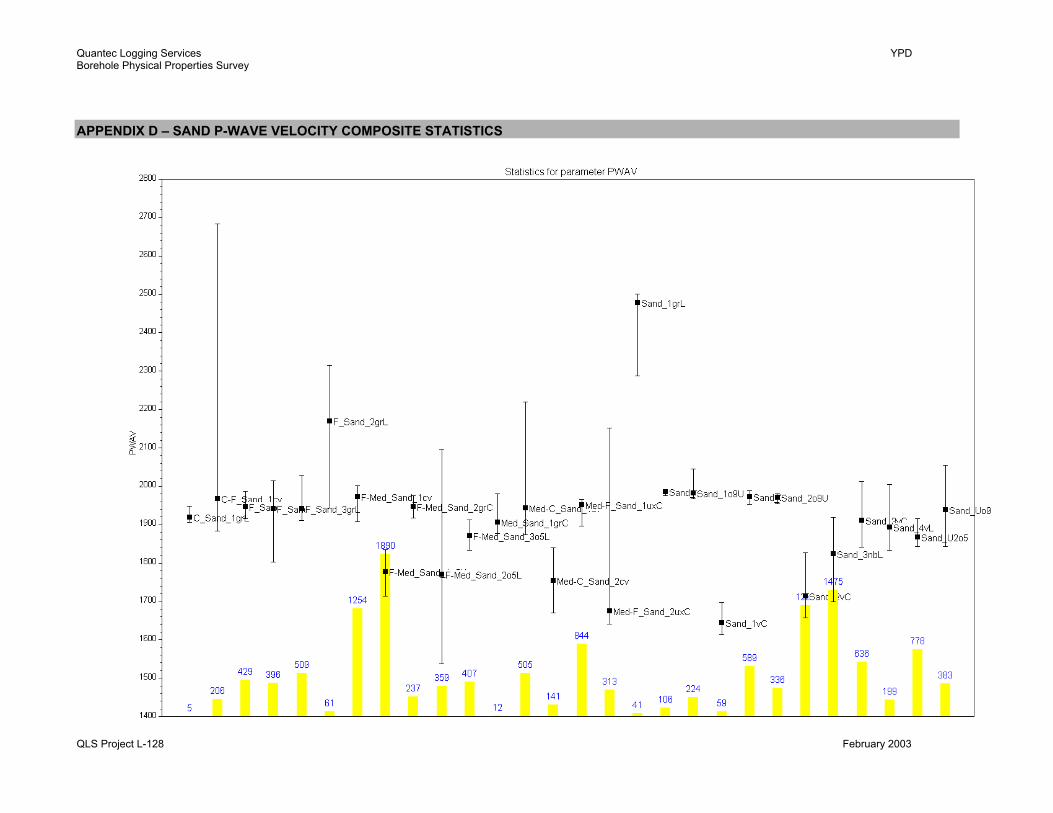
Quantec Logging Services YPD Borehole Physical Properties Survey
APPENDIX D – SAND P-WAVE VELOCITY COMPOSITE STATISTICS
QLS Project L-128 February 2003

Quantec Logging Services YPD Borehole Physical Properties Survey
APPENDIX D – SILT FAR DENSITY COMPOSITE STATISTICS
QLS Project L-128 February 2003
Quantec Logging Services YPD Borehole Physical Properties Survey
APPENDIX D – SILT NATURAL GAMMA COMPOSITE STATISTICS
QLS Project L-128 February 2003

Quantec Logging Services YPD Borehole Physical Properties Survey
APPENDIX D – SILT DEEP INDUCTIVE CONDUCTIVITY STATISTICS
QLS Project L-128 February 2003

Quantec Logging Services YPD Borehole Physical Properties Survey
APPENDIX D – SILT MAGNETIC SUSCEPTIBILITY COMPOSITE STATISTICS
QLS Project L-128 February 2003

Quantec Logging Services YPD Borehole Physical Properties Survey
APPENDIX D – SILT NEUTRON COMPOSITE STATISTICS
QLS Project L-128 February 2003

Quantec Logging Services YPD Borehole Physical Properties Survey
APPENDIX D – SILT P-WAVE VELOCITY COMPOSITE STATISTICS
QLS Project L-128 February 2003

Quantec Logging Services YPD Borehole Physical Properties Survey
APPENDIX D – GRAVEL/COBBLE FAR DENSITY COMPOSITE STATISTICS
QLS Project L-128 February 2003

Quantec Logging Services YPD Borehole Physical Properties Survey
APPENDIX D – GRAVEL/COBBLE NATURAL GAMMA COMPOSITE STATISTICS
QLS Project L-128 February 2003

Quantec Logging Services YPD Borehole Physical Properties Survey
APPENDIX D – GRAVEL/COBBLE DEEP INDUCTIVE CONDUCTIVITY COMPOSITE STATISTICS
QLS Project L-128 February 2003

Quantec Logging Services YPD Borehole Physical Properties Survey
APPENDIX D – GRAVEL/COBBLE MAGNETIC SUSCEPTIBILITY COMPOSITE STATISTICS
QLS Project L-128 February 2003

Quantec Logging Services YPD Borehole Physical Properties Survey
APPENDIX D – GRAVEL/COBBLE NEUTRON COMPOSITE STATISTICS
QLS Project L-128 February 2003

Quantec Logging Services YPD Borehole Physical Properties Survey
APPENDIX D – GRAVEL/COBBLE P-WAVE VELOCITY COMPOSITE STATISTICS
QLS Project L-128 February 2003


Quantec Logging Services YPD Borehole Physical Properties Survey
APPENDIX E: COMPOSITE VIEWLOG PLOTS
COMPOSITE PLOTS:
• Angus Glen OW1 • CVC-ORM-01b • EE11-1F • EE11-1W • Grasshopper • GSC-BH-NOB-01 • GSC-BH-VSR-01 • Hillcrest • Hillcrest2 • King Valley • OGS-PJB-15 • OGS-PJB-19 • Pontypool • Ram Forest • Uxbridge
QLS Project L-128 February 2003
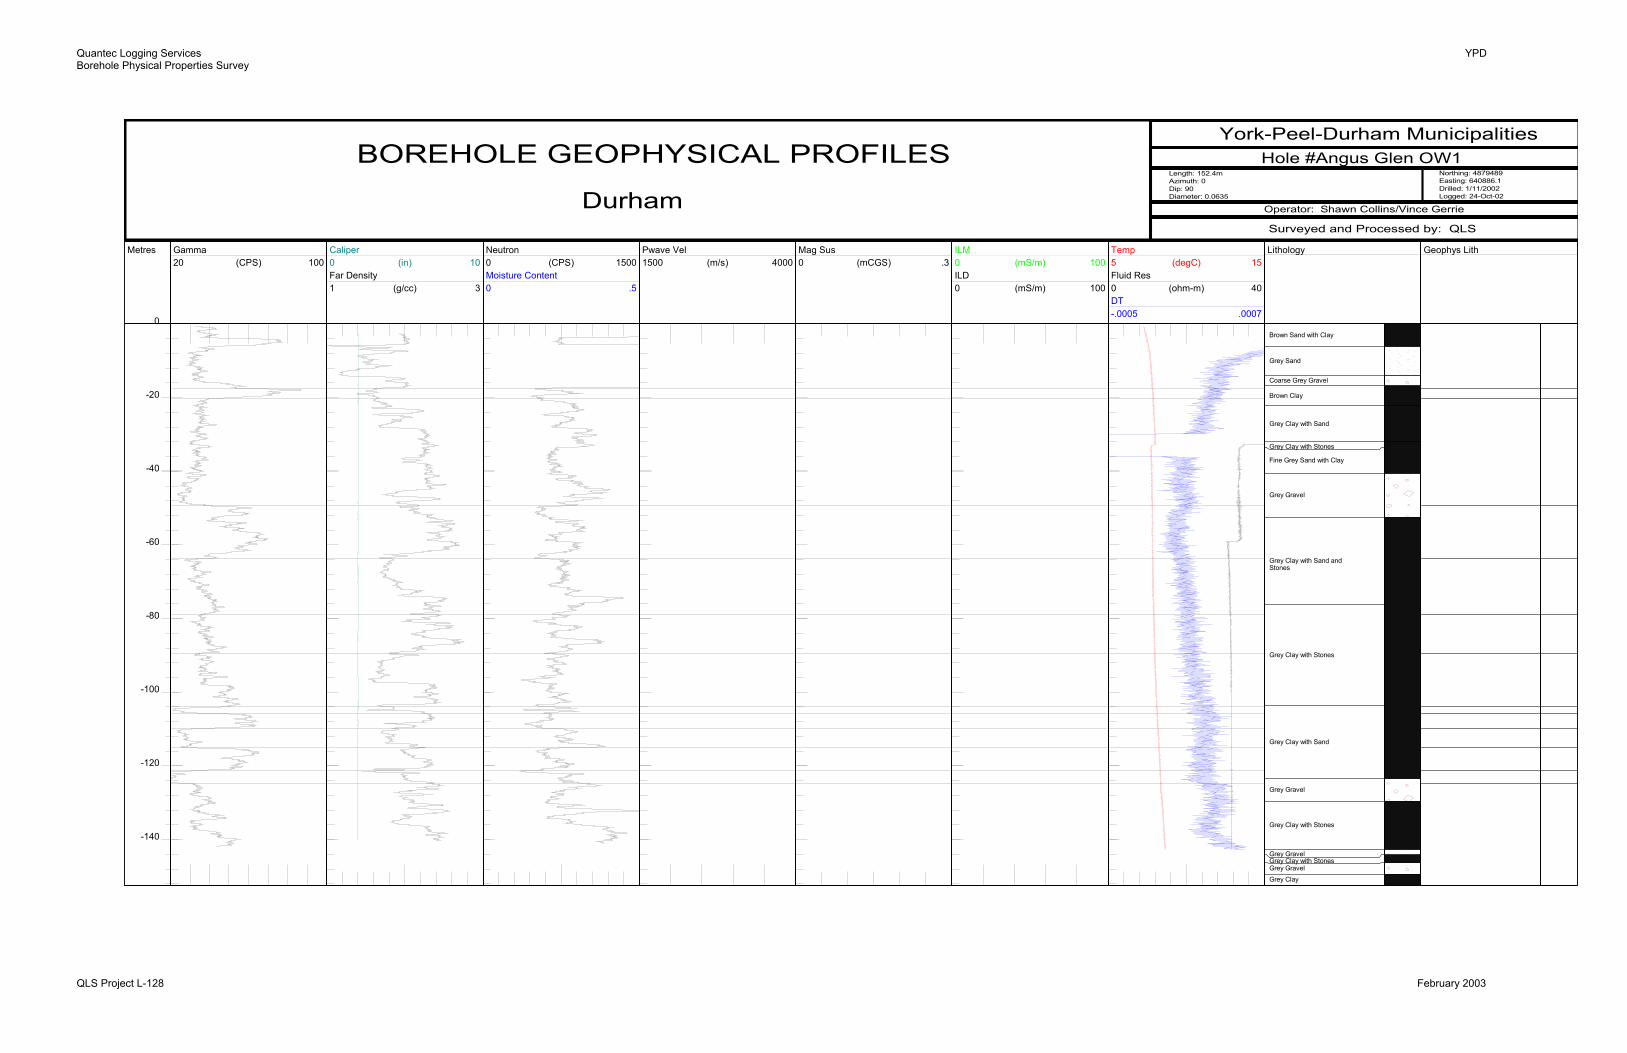
Quantec Logging Services YPD Borehole Physical Properties Survey
York-Peel-Durham MunicipalitiesHole #Angus Glen OW1
Length: 152.4mAzimuth: 0Dip: 90Diameter: 0.0635
Operator: Shawn Collins/Vince Gerrie
Northing: 4879489Easting: 640886.1Drilled: 1/11/2002Logged: 24-Oct-02Durham
Surveyed and Processed by: QLS
BOREHOLE GEOPHYSICAL PROFILES
Metres Gamma(CPS)20 100
Caliper(in)0 10
Far Density(g/cc)1 3
Neutron(CPS)0 1500
Moisture Content0 .5
Pwave Vel(m/s)1500 4000
Mag Sus(mCGS)0 .3
ILM(mS/m)0 100
ILD(mS/m)0 100 (ohm-m)0 40
DT-.0005 .0007
Lithology Geophys Lith
0
-20
-40
-60
-80
-100
-120
-140
Brown Sand with Clay
Grey Sand
Coarse Grey Gravel
Brown Clay
Grey Clay with Sand
Grey Clay with Stones
Fine Grey Sand with Clay
Grey Gravel
Grey Clay with Sand and Stones
Grey Clay with Stones
Grey Clay with Sand
Grey Gravel
Grey Clay with Stones
Grey GravelGrey Clay with StonesGrey GravelGrey Clay
Temp(degC)5 15
Fluid Res
QLS Project L-128 February 2003

Quantec Logging Services YPD Borehole Physical Properties Survey
York-Peel-Durham MunicipalitiesHole #CVC-ORM-01b
Length: 180.62mAzimuth: 0Dip: 90Diameter: 0.0762
Operator: Vince Gerrie/Shawn Collins/Katie Blasco
Northing: 4852731Easting: 588636Drilled: Logged: 6/28/2002Peel
Surveyed and Processed by: QLS
BOREHOLE GEOPHYSICAL PROFILES
Metres Gamma(CPS)20 100
Caliper(in)0 10
Far Density(g/cc)1 3
Neutron(CPS)0 1500
Moisture Content0 .5
Pwave Vel(m/s)1500 4000
Mag Sus(mCGS)0 .3
ILM(mS/m)0
ILD(mS/m)0 100 (ohm-m)0 40
DT-.0005 .0008
Lithology Geophys Lith
0
-20
-40
-60
-80
-100
-120
-140
-160
-180
Medium Sand
Grey Sandy/silt, clay content increasing with depth, dispensed pebbles and granu-les, cohesive; Grey Clayey/-silt
Clayey/silt
Silty/sand to Silty/clay
Silty Sand
Silty Clay
Fine-Medium Sand
Coarsening upwards: Silty/s-and to medium cross-bedded sand;Some coarse sand lensesConsolidated Silty/sand unit with numerous Pebbles and clasts of various sizes;Very much like a diamict.Medium-Coarse Sand with pebbles and clasts of various sizeInterbedded Silty/sand with Pebbles and deformation structures; Silty/sand matrix with Pebbles. Some coarse sand lenses presentCoarse-Fine SandCobbles-Coarse Sand
Medium-Coarse Sand
GravelMedium-Coarse Sand
Cobble
Black Shale
Clayey-Silt_1cv
Silty-Sand_1cv
Silty-Clay_1cv
F-Med_Sand_1cv
Coarsening_Upcv
Silty-Sand_2cv
Med-C_Sand_1cv
Silty-Sand_3cv
C-F_Sand_1cv
Cob-C_Sand_1cv
Med-C_Sand_1cv
Gravel_1cvMed-C_Sand_2cvCobble_1cvCobble_2cvBlack_Shale_cv
100Temp
(degC)5 15Fluid Res
QLS Project L-128 February 2003

Quantec Logging Services YPD Borehole Physical Properties Survey
York-Peel-Durham MunicipalitiesHole #EE11-1F
Length: 71.78mAzimuth: 0Dip: 90Diameter:
Operator: Vince Gerrie/Shawn Collins
Northing: 4859701Easting: 651134Drilled: Logged: 7/29/2002Durham
Surveyed and Processed by: QLS
BOREHOLE GEOPHYSICAL PROFILES
Metres Gamma(CPS)20 100
Caliper(in)0 10
Far Density(g/cc)1 3
Neutron(CPS)0 1500
Moisture Content0 .5
Pwave Vel(m/s)1500 4000
Mag Sus(mCGS)0 .3
ILM(mS/m)0 100
ILD(mS/m)0 100 (ohm-m)0 40
DT-.0005 .0007
Lithology Geophys Lith
0
-20
-40
-60
Topsoil OverburdenSand
Till
Granite Cobble
Till
Sand Stringers (<20mm)TillSandTillGravel
Silt & Clay
GravelSilt & ClaySilt & SandSilt & ClayTillSandSilt & Sand (Gravel Trace)SandTillSand & ClayGravelSilt & ClaySiltShale
NTill_1eef
NTill_2eef
Gravel_1eefL
Silt-Clay_1eefL
Silt-Sand_1eefL
Silt-Clay_2eefL
Till_1eefLTill_2eefLSand_1eefLSilt-Sand_2eefLSand_1eefLTill_2eefLSand-Clay_1eefLGravel_2eefLSilt-Clay_3eefLSilt_1eefL
Temp(degC)5 15
Fluid Res
QLS Project L-128 February 2003

Quantec Logging Services YPD Borehole Physical Properties Survey
York-Peel-Durham MunicipalitiesHole #EE11-1W
Length: 40.67mAzimuth: 0Dip: 90Diameter:
Operator: Vince Gerrie/Shawn Collins
Northing: 4859701Easting: 651137Drilled: Logged: 7/29/2002Durham
Surveyed and Processed by: QLS
BOREHOLE GEOPHYSICAL PROFILES
Metres Gamma(CPS)20 100
Caliper(in)0 10
Far Density(g/cc)1 3
Neutron(CPS)0 1500
Moisture Content0 .5
Pwave Vel(m/s)1500 4000
Mag Sus(mCGS)0 .3
ILM(mS/m)0 100
ILD(mS/m)0 100 (ohm-m)0 40
DT-.001 .0005
Lithology Geophys Lith
0
-20
-40
Topsoil OverburdenSand
Till
Granite Cobble
Till
Sand Stringers (<20mm)TillSand?TillGravelSilt & Clay
Temp(degC)5 15
Fluid Res
QLS Project L-128 February 2003

Quantec Logging Services YPD Borehole Physical Properties Survey
York-Peel-Durham MunicipalitiesHole #Grasshopper
Length: 140.59mAzimuth: 0Dip: 90Diameter:
Operator: KB,TR,SS,SC
Northing: 4880186Easting: 679510Drilled: 11/12/2002Logged: 14-Nov-02Durham
Surveyed and Processed by: QLS
BOREHOLE GEOPHYSICAL PROFILES
Metres Gamma(CPS)20 100
Caliper(in)0 10
Far Density(g/cc)1 3
Neutron(CPS)0 1500
Moisture Content0 .5
Pwave Vel(m/s)1500 4000
Mag Sus(mCGS)0 .3
ILM(mS/m)0 100
ILD(mS/m)0 100 (ohm-m)0 40
DT-.0005 .0008
Lithology Geophys Lith
0
-20
-40
-60
-80
-100
-120
-140
TopsoilSandy GravelFine SandSandy GravelMedium SandFine SandMedium SandFine Sandy SiltGravelFine SandGravelFine SandClayFine SandFine-Medium SandFine SandFine-Medium SandFine Sand-SiltGravelMedium SandGravel-Boulders
Cobbles
Fine Sand-SiltFine Sand-SiltSiltFine Sand-SiltSiltFine SandSiltFine SandSiltFine Sand-SiltSilt-ClayTillFine SandTillFine SandClayCoarse SandGravelClayFine SandClayTillClayey-SiltSandSiltFine SandSiltFine SandSiltClaySiltSandSiltTillSand-GravelClaySiltClayFine-Medium saturated Sand
Clay
Weathered Bedrock
F_Sandy-Silt_1grCGravel_1grCF_Sand_1grCGravel_1grCF_Sand_1grC
F-Med_Sand_2grC
F_Sand_1grCF-Med_Sand_2grCF_Sand-Silt_1grCGravel_2grCMed_Sand_1grC
Grav-Bould_1grC
Cobble_1grC
ScreenCobble_1grCF_Sand-Silt_2grLNo_LogF_Sand-Silt_2grLSilt_1grLF_Sand-Silt_2grLSilt_1grLF_Sand_2grLSilt_1grLF_Sand_2grLSilt_1grLF_Sand-Silt_2grLSilt-Clay_1grLTill_1grLF_Sand_3grLTill_2grLF_Sand_3grLClay_2grLC_Sand_1grLGravel_2grLClay_2grLF_Sand_2grLClay_2grLTill_3grLClayey-Silt_1grLSand_1grLSilt_2grLF_Sand_3grLSilt_2grLClay_3grLSilt_3grLSand_1grLSilt_3grLNTill_grLSand-Gravel_1grLClay_4grLSilt_4grLClay_4grLClay_5grLScreen
Clay_6grL
Limestone_Wgr
Temp(degC)5 15
Fluid Res
QLS Project L-128 February 2003

Quantec Logging Services YPD Borehole Physical Properties Survey
York-Peel-Durham MunicipalitiesHole #GSC-BH-NOB-01
Length: 190mAzimuth: 0Dip: 90Diameter:
Operator: Shawn Collins
Northing: 4864947Easting: 611194Drilled: Logged: 20-Aug-02York
Surveyed and Processed by: QLS
BOREHOLE GEOPHYSICAL PROFILES
Metres Gamma(CPS)20 100
Caliper(in)0 10
Far Density(g/cc)1 3
Neutron(CPS)0 1500
Moisture Content0 .5
Pwave Vel(m/s)1500 4000
Mag Sus(mCGS)0 .3
ILM(mS/m)0 100
ILD(mS/m)0 100 (ohm-m)0 40
DT-.0001 .0008
Lithology Geophys Lith
0
-20
-40
-60
-80
-100
-120
-140
-160
-180
Silt/Clay
Fine to Med Sand
Sand clay interbed
Clay
Rhythmites
Diamicton fine sandSand/Gravel
Sand/Gravel
Clay
Rhythmites sand silt
Sand
Fining upward sets
Clay
Sand
Diamicton
Sand
Silt/clay
Sand
Clay/silt
Sand
Sand/Diamicton
Sand/Gravel
Bedrock
Rhythmites_1nbL
Sand_1nbL
Clay_1nbL
Sand_2nbL
Till_1nbL
Sand_3nbL
Silt-Clay_1nbL
Silt-Clay_2nbL
Sand_3nbL
Clay-Silt_1nbL
Sand_3nbL
Till_2nbL
Temp(degC)5 15
Fluid Res
QLS Project L-128 February 2003

Quantec Logging Services YPD Borehole Physical Properties Survey
York-Peel-Durham MunicipalitiesHole #GSC-BH-VSR-01
Length: 127mAzimuth: 0Dip: 90Diameter:
Operator: Trent Retallick/Susanna Scappin
Northing: 4873238Easting: 630188Drilled: Logged: 23-Nov-02York
Surveyed and Processed by: QLS
BOREHOLE GEOPHYSICAL PROFILES
Metres Gamma(CPS)20 100
Caliper(in)0 10
Far Density(g/cc)1 3
Neutron(CPS)0 1500
Moisture Content0 .5
Pwave Vel(m/s)1500 4000
Mag Sus(mCGS)0 .3
ILM(mS/m)0 100
ILD(mS/m)0 100 (ohm-m)0 40
DT-.0001 .0007
Lithology Geophys Lith
-20
-40
-60
-80
-100
-120
Sand
Sand-Silt
Fine Sandy Silt
Sand
Fine Sandy Silt
Sand
Silt DiamictionSandy Silt
Sand
Gravel
Stoney Sandy Silt Diamicton
Silt Diamicton
Silt Rhythmites
Sand
Sand with Organics
F_Sandy-Silt_1vC
Sand_1vC
F_Sandy-Silt_1vC
Sand_2vC
Silt_Till_1vCSandy-Silt_1vC
Sand_3vC
Gravel_1vC
NTill_v
Silt_Till_2vL
Silt_Rhythmites_vL
Sand_4vL
Unknown_vL
Temp(degC)5 15
Fluid Res
QLS Project L-128 February 2003

Quantec Logging Services YPD Borehole Physical Properties Survey
York-Peel-Durham MunicipalitiesHole #Hillcrest
Length: 73.76mAzimuth: 0Dip: 90Diameter:
Operator: Vince Gerrie, Katie Blasco
Northing: 4884347Easting: 622288Drilled: 8/30/2002Logged: 05-Sept-02York
Surveyed and Processed by: QLS
BOREHOLE GEOPHYSICAL PROFILES
Metres Gamma(CPS)20 100
Caliper(in)0 10
Far Density(g/cc)1 3
Neutron(CPS)0 1500
Moisture Content0 .5
Pwave Vel(m/s)1500 4000
Mag Sus(mCGS)0 .3
ILM(mS/m)0 100
ILD(mS/m)0 100 (ohm-m)0 40
DT-.0007 .0005
Lithology Geophys Lith
0
-20
-40
-60
Brown SoilBrown SandBrown Clay with Sand and Stones
Grey Clay with Sand and Gravel
Grey Clay
Grey Sand
Grey Clay
Temp(degC)5 15
Fluid Res
QLS Project L-128 February 2003

Quantec Logging Services YPD Borehole Physical Properties Survey
York-Peel-Durham MunicipalitiesHole #Hillcrest2
Length: 111.56mAzimuth: 0Dip: 90Diameter: .1143
Operator: Vince Gerrie/Shawn Collins
Northing: 4884050Easting: 622300Drilled: 9/1/1972Logged: 08-Oct-02York
Surveyed and Processed by: QLS
BOREHOLE GEOPHYSICAL PROFILES
Metres Gamma(CPS)20 100
Caliper(in)0 10
Far Density(g/cc)1 3
Neutron(CPS)0 1500
Moisture Content0 .5
Pwave Vel(m/s)1500 4000
Mag Sus(mCGS)0 .3
ILM(mS/m)0 100
ILD(mS/m)0 100 (ohm-m)0 40
DT-.0004 .0008
Lithology Geophys Lith
-20
-40
-60
-80
-100
Temp(degC)5 15
Fluid Res
QLS Project L-128 February 2003

Quantec Logging Services YPD Borehole Physical Properties Survey
York-Peel-Durham MunicipalitiesHole #King Valley
Length: 90.83mAzimuth: 0Dip: 90Diameter: .0508
Operator: Shawn Collins/Katie Blasco
Northing: 4872622Easting: 619195Drilled: 3/7/2002Logged: 06-Nov-02York
Surveyed and Processed by: QLS
BOREHOLE GEOPHYSICAL PROFILES
Metres Gamma(CPS)20 100
Caliper(in)0 10
Far Density(g/cc)1 3
Neutron(CPS)0 1500
Moisture Content0 .5
Pwave Vel(m/s)1500 4000
Mag Sus(mCGS)0 .3
ILM(mS/m)0 100
ILD(mS/m)0 100 (ohm-m)0 40
DT-.001 .006
Lithology Geophys Lith
0
-20
-40
-60
-80
Black Top SoilBrown Fine Sand
Brown Gravel with Clay, Stones
Brown Clay
Blue Clay with Gravel
Blue Clay
Grey Sand with Clay
Blue Clay with Stones
Blue Clay with Silt
Blue Clay with Gravel, Stones
Grey Fine Sand
Clayey-Sand_L
Clayey-Silt-StonesL
Clay-Gravel_1kvL
Clay-Gravel_2kvL
Temp(degC)5 15
Fluid Res
QLS Project L-128 February 2003

Quantec Logging Services YPD Borehole Physical Properties Survey
York-Peel-Durham MunicipalitiesHole #OGS-PJB-15
Length: 85mAzimuth: 0Dip: 90Diameter: 0.0889
Operator: Vince Gerrie/Shawn Collins
Northing: 4879424Easting: 635691Drilled: Logged: 6/20/2002York
Surveyed and Processed by: QLS
BOREHOLE GEOPHYSICAL PROFILES
Metres Gamma(CPS)20 100
Caliper(in)0 10
Far Density(g/cc)1 3
Neutron(CPS)0 1500
Moisture Content0 .5
Pwave Vel(m/s)1500 4000
Mag Sus(mCGS)0 .3
ILM(mS/m)0 100
ILD(mS/m)0 100 (ohm-m)0 40
DT-.0005 .0007
Lithology Geophys Lith
0
-20
-40
-60
-80
Silt
Fine_Sand
SiltTill (massive sandy silt with pebbles)Sand (very fine to fine grained)SiltSand (very fine to fine grained)SiltSand (very fine to fine grained)Sand (fine to medium)
Sand (very fine to fine grained)
Silt
Till (massive gritty silty sand to sandy silt with 5-10% clasts)
Sand (medium to fine and very fine sand interbedded)
Sand_U2o5
Silt_U1o5Sand_U2o5Silt_U1o5F_Sand_1o5U
F-Med_Sand_1o5U
Silt_1o5U
NTill_1o5
NTill_2o5
F-Med_Sand_2o5L
F-Med_Sand_3o5L
Temp(degC)5 15
Fluid Res
QLS Project L-128 February 2003

Quantec Logging Services YPD Borehole Physical Properties Survey
York-Peel-Durham MunicipalitiesHole #OGS-PJB-19
Length: 90mAzimuth: 0Dip: 90Diameter: 0.0889
Operator: Vince Gerrie/Shawn Collins
Northing: 4872693Easting: 643905Drilled: Logged: 7/4/2002Durham
Surveyed and Processed by: QLS
BOREHOLE GEOPHYSICAL PROFILES
Metres Gamma(CPS)20 100
Caliper(in)0 10
Far Density(g/cc)1 3
Neutron(CPS)0 1500
Moisture Content0 .5
Pwave Vel(m/s)1500 4000
Mag Sus(mCGS)0 .3
ILM(mS/m)0 100
ILD(mS/m)0 100 (ohm-m)0 40
DT-.0005 .0007
Lithology Geophys Lith
0
-20
-40
-60
-80
TillSiltTill
Sand
Sand
Sand
Till
Gravel
Till
Clay
Sand_Uo9U
Sand_1o9U
Sand_2o9U
Till_1o9U
Gravel_1o9U
NTill_1o9
NTill_2o9
Clay_1o9L
Temp(degC)5 15
Fluid Res
QLS Project L-128 February 2003

Quantec Logging Services YPD Borehole Physical Properties Survey
York-Peel-Durham MunicipalitiesHole #Pontypool
Length: 169.14mAzimuth: 0Dip: 90Diameter:
Operator: Shawn Collins
Northing: 4886446.05652Easting: 689068.8735Drilled: Logged: 20-Aug-02Scugog
Surveyed and Processed by: QLS
BOREHOLE GEOPHYSICAL PROFILES
Metres Gamma(CPS)20 100
Caliper(in)0 10
Far Density(g/cc)1 3
Neutron(CPS)0 1500
Moisture Content0 .5
Pwave Vel(m/s)1500 4000
Mag Sus(mCGS)0 .3
ILM(mS/m)0 100
ILD(mS/m)0 100 (ohm-m)0 40
DT-.0005 .0009
Lithology Geophys Lith
0
-20
-40
-60
-80
-100
-120
-140
-160
SandSandGravelClaySandGravelSandGravel
Sand
Sand
Silt-sand/silt diamicton
Sand
Silt-sand/silt diamictonGravelClay-clay/silt diamictonSandSand
SandSandGravelSiltGravelSand
Sand
Gravel
Silt
Clay-clay/silt diamicton
SandClay-clay/silt diamictonSandClay-clay/silt diamicton
Sand
Clay
Sand
Clay-clay/silt diamicton
Silt
Clay
Silt-sand/silt diamictonBedrock
SSS_Till_1ptLGravel_1ptLCCS_Till_1ptL
Sand_1ptL
Sand_2ptLGravel_2ptLSilt_1ptLGravel_3ptLSand_1ptL
Sand_4ptL
Gravel_4ptL
Silt_2ptL
CCS_Till_2ptL
Sand_5ptLCCS_Till_3ptLSand_6ptLCCS_Till_4ptL
CCS_Till_5ptL
Sand_7ptL
Clay_1ptL
Sand_8ptL
CCS_Till_2ptL
CCS_Till_6ptL
Silt_3ptL
Clay_2ptL
Clay_3ptL
Temp(degC)5 15
Fluid Res
QLS Project L-128 February 2003

Quantec Logging Services YPD Borehole Physical Properties Survey
York-Peel-Durham MunicipalitiesHole #Ram Forest
Length: 117.96mAzimuth: 0Dip: 90Diameter: 0.16764
Operator: Shawn Collins/Trent R
Northing: 4874585Easting: 629555Drilled: 9/10/2002Logged: 05-Sept-02York
Surveyed and Processed by: QLS
BOREHOLE GEOPHYSICAL PROFILES
Metres Gamma(CPS)20 100
Caliper(in)0 10
Far Density(g/cc)1 3
Neutron(CPS)0 1500
Moisture Content0 .5
Pwave Vel(m/s)1500 4000
Mag Sus(mCGS)0 .3
ILM(mS/m)0 100
ILD(mS/m)0 100 (ohm-m)0 40
DT-.001 .0005
Lithology Geophys Lith
0
-20
-40
-60
-80
-100
Brown Clay
Grey Clay
Cemented Gravel
Grey Clay, Stone
Cemented Gravel
Clay, Stone
Clay, Silt
Temp(degC)5 15
Fluid Res
QLS Project L-128 February 2003

Quantec Logging Services YPD Borehole Physical Properties Survey
York-Peel-Durham MunicipalitiesHole #Uxbridge BH1
Length: 84.73mAzimuth: 0Dip: 90Diameter:
Operator: Shawn Collins
Northing: 4885402Easting: 651171Drilled: Logged: 08-Sept-02Durham
Surveyed and Processed by: QLS
BOREHOLE GEOPHYSICAL PROFILES
Metres Gamma(CPS)20 100
Caliper(in)0 10
Far Density(g/cc)1 3
Neutron(CPS)0 1500
Moisture Content0 .5
Pwave Vel(m/s)1500 4000
Mag Sus(mCGS)0 .3
ILM(mS/m)0 100
ILD(mS/m)0 100 (ohm-m)0 40
DT-.002 .0005
Lithology Geophys Lith
0
-20
-40
-60
-80
-100
TopsoilSandy-Silt fill, trace claySilt, trace clay
Fine Sands
Coarse Sands with some gravelSilty Fine SandsSand and Gravel
Silt and Fine Sand
Medium-Fine Sands
Sand and Gravel
Till
Bedrock
Steel_Casingux
Silty-F_Sand_1uxCSand-Gravel_1uxC
Silt-F_Sand_1uxC
Silt-F_Sand_2uxC
Med-F_Sand_1uxC
Med-F_Sand_2uxC
Sand-Gravel_2uxC
Unknown_uxC
Till_1uxC
Till_2uxC
Temp(degC)5 15
Fluid Res
QLS Project L-128 February 2003

Quantec Logging Services YPD Borehole Physical Properties Survey
APPENDIX F: DIGITAL DATA
DIGITAL DATA
RAW DATA AND PROCESSED DATA ON CD-ROM (700 MB)
Raw Viewlog composite profile files: according to borehole number (####), i.e. 30323.AAA where AAA refers to: HDR = Viewlog header file 001 = Viewlog data file for parameter #1 (i.e., Gamma or MS) 002 = Viewlog data file for profile parameter #2 … 00N = Viewlog data file for final profile parameter. Processed Data - Viewlog and Related Files: TEMPLATE HEADER 11X17.map = Viewlog template 11x17 plot header template header YPD.hdr = Viewlog data display template for aboveground holes L-128 Database.mbd = Microsoft Access database containing all processed data and lithologic
information L-128.db = file linking template to database within Viewlog L-128.prj = Viewlog project file YPD Lithology.lsm = Viewlog lithologic symbol library
QLS Project L-128 February 2003