quantification of dynamic droplet impact onto a solid...
TRANSCRIPT

American Institute of Aeronautics and Astronautics
1
Quantification of Dynamic Water Droplet Impact onto a Solid
Surface by using a Digital Image Projection Technique
Haixing Li1, Rye M. Waldman2, Kai Zhang3, Hui Hu4()
Iowa State University, Ames, Iowa, 50011, USA
In the present study, an experimental investigation was conducted to quantify the dynamics
of the water droplet impact process on a solid surface in order to elucidate underlying
physics to improve our understanding of the important microphysical processes pertinent to
aircraft icing phenomena. The Reynolds number (Re) and Weber number (We) of the water
droplets ranged from Re 1700 to 4900, and We 29 to 216, respectively, while all the
experiments were done at a room temperature of Tambinet=𝟐𝟏℃. Digital image projection
(DIP) was used to achieve time-resolved measurements of the water film thickness
distributions during the entire impact process. Based on the time-resolved measurements of
the water film/droplet thickness distributions, the droplet impact process was divided into
three distinct stages, i.e., the spreading, receding, and oscillating stages. By comparing the
droplet shape evolution under different impact velocities, the dynamics of droplet impact
process at different Weber numbers or Reynolds numbers was analyzed in detail. With
increasing impact velocity, the oscillation phenomenon would disappear rapidly, and thus
the droplet impact process was shortened. Based on the time-resolved film thickness
measurements, the liquid-air interface area was calculated, thus, the time evolution of the
surface energy of water droplet during the entire impact process could be examined
quantitatively.
Nomenclature
K = Displacement-to-thickness factor
𝑅𝑒 = Reynolds number
𝑊e = Weber number
𝜌 = Density of the droplet
𝜇 = Droplet dynamic viscosity
𝛾 = Surface tension coefficient between liquid and air
𝑈0 = Droplet velocity before impinging onto the solid surface
𝐷0 = Droplet initial diameter before impact on the solid surface
𝑑𝑚𝑎𝑥 = Maximum spreading diameter of the impact droplet
𝜆 = capillary wavelength
𝛽 = Spreading factor
ℎ𝑚𝑖𝑛 = Minimum thickness at the central part of the impact droplet
𝛥𝑝 = Pressure difference at the interface between the liquid and air
𝑅1, 𝑅2 = Principal radii of curvature
𝐸𝑑 = Energy dissipated by the viscosity
𝐸𝑠 = Surface energy of the impact droplet
𝐸𝑠0 = Droplet surface energy just before impact on the solid surface
𝐸0 = Droplet total energy just before impact on the solid surface
𝐸𝑠𝑚𝑎𝑥 = Droplet surface energy when the droplet at the maximum spreading diameter
V = Volume of the droplet
1 Graduate Student, Department of Aerospace Engineering 2 Postdoctoral Research Associate, Department of Aerospace Engineering 3 Postdoctoral Research Associate, Department of Aerospace Engineering 4 Martin C. Jischke Professor, Dept. of Aerospace Engineering, AIAA Associate Fellow, Email: [email protected]
Dow
nloa
ded
by I
OW
A S
TA
TE
UN
IVE
RSI
TY
on
Febr
uary
13,
201
7 | h
ttp://
arc.
aiaa
.org
| D
OI:
10.
2514
/6.2
017-
0942
55th AIAA Aerospace Sciences Meeting
9 - 13 January 2017, Grapevine, Texas
AIAA 2017-0942
Copyright © 2017 by Haixing Li, Rye M. Waldman, Kai Zhang, Hui Hu. Published by the American Institute of Aeronautics and Astronautics, Inc., with permission.
AIAA SciTech Forum
American Institute of Aeronautics and Astronautics
2
𝜙 = Viscous function
m = Mass of the droplet
x = Deflection from the neutral
k = Spring constant
c = Damping coefficient
A = Liquid-air area
𝜃 = Equilibrium contact angle
I. Introduction
ircraft icing is widely recognized as a significant hazard to aircraft operations in cold weather. When an aircraft
or rotorcraft flies in a cold climate, some of the supercooled droplets impact and freeze on the exposed aircraft
surfaces to form ice shapes. Ice may accumulate on every exposed frontal surface of an airplane, not only on the
wing, propeller and windshield, but also on the antennas, vents, intakes, and cowlings. Icing accumulation can
degrade the aerodynamic performance of an airplane significantly by decreasing lift while increasing drag. In
moderate to severe conditions, the ice accretions may become so severe that continued flight is impossible. The
airplane may stall at much slower speeds and lower angles of attack than normal. It could roll or pitch
uncontrollably, and recovery may be impossible. Ice can also cause engine stoppage by either icing up the carburetor
or, in the case of a fuel-injected engine, blocking the engine’s air source. The importance of proper ice control for
aircraft operation in cold climate was highlighted by many aircraft crashes in recent years like the ATR-72 aircraft
of American Eagle flight that crashed in Roselawn, Indiana, due to ice buildup on its wings, killing all 66 people
aboard on October 31, 1994. After investigation, it was found that the aircraft encountered a supercooled large
droplets (SLD) icing environment, which was not defined in Appendix C of Part 25 of Federal Aviation Regulations
(FAR25 Appendix C), and the aircraft crashed from abnormal icing on airfoils1 (Ice Protection Harmonization
Working Group-IPHWG, 2005). A number of previous studies showed that the ice accretion over airfoil surfaces
under different icing conditions are significantly different, especially with different impact velocity and icing
temperature2,3,4. Further research about droplet impact is highly desirable in order to uncover the underlying physics
pertinent to aircraft icing phenomena.
Droplet impact, such as the fingering of an inkblot or a coffee stain, is familiar to everyone. Droplet impact,
which has been studied extensively since 18765, has a very wide range of applications, including atomization
processes6, raindrop dynamics7, inkjet printing8, blood pattern and drop trajectories9, and micro-fabrication10. While
it also involves most of the key issues of surface flows, droplet impact is characteristic of multiphase flows11. A
droplet impact process can usually be divided into three stages, an early contact stage that consider the central
bubble12 and skating on air13, a spreading or splash stage14,15, and a receding or rebounding stage16,17. While most of
the previous studies were concentrated on the air layer radius or thickness12,13, maximum spreading radius16,17,18,
minimal thickness of the water layer19, and whether the impacting droplet would splash15,20 or rebounding16,17, very
few studies considered the droplet shape evolution during the impact process. The accurate measurement of the
droplet shape or the film thickness of the impact droplet could help reveal the underlying physics and improve the
theoretical physics models used in the impact process.
In the present study, an experimental investigation was conducted to quantify the shape evolution of the droplet
during the impact process on a solid surface in order to elucidate underlying physics to improve our understanding
of the important microphysical processes pertinent to aircraft icing phenomena. A digital image projection (DIP)
technique21 was used to achieve time-resolved measurements of the droplet thickness during the entire droplet
impact process, including the spreading, receding and fluctuation stages. By comparing the droplet shape evolution
under different impact velocities, the dynamics of droplet impact under different Weber numbers or Reynolds
numbers was analyzed in detail. Based on the time-resolved film thickness of the impact droplet, the surface energy
evolution during the whole impact process was determined. A better understanding of the droplet impact process
would be helpful to improve the icing accretion model for more accurate prediction of ice formation and accretion
over aircraft wings and to develop effective and robust anti-/de-icing strategies to ensure safer and more efficient
operation of aircraft in cold weather.
A
Dow
nloa
ded
by I
OW
A S
TA
TE
UN
IVE
RSI
TY
on
Febr
uary
13,
201
7 | h
ttp://
arc.
aiaa
.org
| D
OI:
10.
2514
/6.2
017-
0942

American Institute of Aeronautics and Astronautics
3
II. Experimental Setup
Figure 1 shows the schematic of the experimental setup used in present study to implement the DIP technique to
quantify the shape evolution of the droplet during the impact process. The experimental setup was comprised of a
droplet generator, an environmental chamber containing the solid substrate, a projector and lens system, a high-
speed camera, and a host computer controlling both the projector and high-speed camera.
Figure 1. Experimental setup for the measurement of droplet impingement and ice accreting
A volume-type droplet generator system was used to generate single water droplets. The system includes three
parts: a piezo-actuated cavity, a pulse generator (Rigol 1074Z-S), and a water reservoir bottle. As shown in figure 2,
the main body of the droplet generator system includes a water cavity, a piezoelectric plate, and a droplet nozzle.
The water cavity and droplet nozzle were rapid prototyped. Upon receiving a pulse signal from the pulse generator,
the piezoelectric plate would warp and squeeze the water cavity, which would extrude a droplet from the nozzle.
With suitable pulse voltage and duration, the droplet generator could eject a single droplet from each pulse. The
droplet size was controlled by the nozzle inner diameter and the pulse voltage, and the droplet impingement velocity
was controlled by the initial ejection velocity and the height between the droplet generator and the solid substrate.
The size variation of the generated droplets when using the same pulse shape and the same nozzle was less than
0.02mm. The droplet size can be controlled from about 1.5mm to 3.0mm by using different inner diameter nozzles
and different pulse voltages, and the impact velocity of the droplet can be set to any value between 0.5m/s to 3.5m/s.
To enhance the light diffusion on the droplet surface, a low concentration (5% by volume) of latex was added to
the water. The impact substrate was mounted in a relatively closed experimental chamber to minimize the
environmental disturbances. The main part of the substrate is an aluminum plate (2𝑖𝑛𝑐ℎ × 2𝑖𝑛𝑐ℎ × 1/4𝑖𝑛𝑐ℎ). The
plate surface was coated with Rustoleum enamel, and was wet-sanded with 2000 grit sandpaper. The advancing and
receding contact angles on the surface were measured as more than 90 degrees and less than 20 degrees respectively.
Dow
nloa
ded
by I
OW
A S
TA
TE
UN
IVE
RSI
TY
on
Febr
uary
13,
201
7 | h
ttp://
arc.
aiaa
.org
| D
OI:
10.
2514
/6.2
017-
0942

American Institute of Aeronautics and Astronautics
4
Figure. 2 Main part of the droplet generator system
A DLP projector (Young Optics Light Crafter) was used to project a pattern of parallel lines on the test plate for
the DIP measurement. The distance between each two adjacent lines was set to be about 0.15 mm to satisfy the
measurement resolution requirement (in our study, the droplet initial diameter is about 2.4mm, and the maximum
spreading diameter of the droplet was more or around 5mm). A high-speed camera (PCOtech Dimax S4) was used
for recording the light pattern images. The frame rate of the high-speed camera was set to 5,000fps and the exposure
time was set to 100𝜇𝑠 to adequately time-resolve the dynamic process and minimize motion blur. The recorded
images had a spatial resolution between 624 𝑝𝑖𝑥𝑒𝑙𝑠 × 620 𝑝𝑖𝑥𝑒𝑙𝑠 to 912 𝑝𝑖𝑥𝑒𝑙𝑠 × 900 𝑝𝑖𝑥𝑒𝑙𝑠 , and a physical
measurement window size between 9.2𝑚𝑚 × 9.1𝑚𝑚 to 13.4𝑚𝑚 × 13.2𝑚𝑚 . The window sizes were selected
depending on the expected spreading diameter for a particular trial.
Three different impact velocities (0.77m/s, 1.60m/s, and 2.12m/s) were tested. The impact velocity was set by
adjusting the droplet release height.
III. Water Film/Droplet Thickness Measurements Using DIP Technique
Water droplet/film thickness measurements using DIP technique
During the experiment, a reference pattern of the clean surface and the distorted patterns of the droplet shape were
recorded with a high-speed imaging system. The droplet thickness information was extracted from the pattern-
images using the image processing described here.
Figure 3 shows the process of extracting droplet shape data from the recorded images. Figure 3(a) shows the
reference image that was recorded before the droplet impact. Figure 3(b) shows the image during the droplet impact
onto the surface and illustrates how the projected light lines appear distorted in the camera view. The lines in the
reference and deformed images were digitized, yielding the position information as shown in figures 3(c) and (d).
By comparing the position of the digitized lines in figure 3(c) and (d), the image displacement of the projected
pattern in the droplet region was obtained. Based on the DIP calibration (figure 4), the droplet shape during the
impact process was reconstructed from the displacements of the projected lines relative to the reference image.
Figure 4 shows that the displacement-to-thickness factor is
0.0196 /K mm pixel (1)
Figure 3(e) shows the thickness data extracted from the image pair.
Piezoelectric plate
Water cavity
Nozzle
Squeeze water cavity
Dow
nloa
ded
by I
OW
A S
TA
TE
UN
IVE
RSI
TY
on
Febr
uary
13,
201
7 | h
ttp://
arc.
aiaa
.org
| D
OI:
10.
2514
/6.2
017-
0942

American Institute of Aeronautics and Astronautics
5
Figure 3. Droplet thickness extracted from the recorded images by using the DIP technique.
(a) Acquired reference raw image; (b) Acquired raw image after water droplet impact onto the surface; (c) Projected
lines positions of the reference image; (d) Projected lines positions after droplet impacts; (e) Reconstructed droplet
shape or film thickness over the test plate.
Figure 4. The displacement-to-thickness factor obtained through a DIP calibration procedure
Dow
nloa
ded
by I
OW
A S
TA
TE
UN
IVE
RSI
TY
on
Febr
uary
13,
201
7 | h
ttp://
arc.
aiaa
.org
| D
OI:
10.
2514
/6.2
017-
0942
American Institute of Aeronautics and Astronautics
6
IV. Results and Discussion
In the present study, all of the experimental data was recorded at room temperature, T = 21°C. The droplet
diameter was kept at D = 2.4mm, while the impact velocity was varied from 0.7m/s to 2.12 m/s; therefore, the
Reynolds number varied from about 1776 to 4862 and the Weber number varied from about 29 to 216, respectively.
Since the droplet was 5% (by volume) latex solution, the surface tension of the solution was measured as 52mN/m,
and the viscosity is 1.09N ∙ s/m2, while the density is 1.01g/μL. The Reynolds number and Weber number are
defined as:
0 0ReU D
(2)
2
0 0WeU D
(3)
Where 𝑅𝑒 is the Reynolds number, 𝜌 is the droplet density, 𝑈0 is the droplet impact velocity, D0 is the droplet
diameter, 𝜇 is the droplet dynamic viscosity, 𝑊𝑒 is the Weber number, and 𝛾 is the droplet surface tension.
4.1 Three stages of the droplet impact process
Using the DIP technique, the time-resolved thickness of the droplet throughout the impact process was measured
in detail. Based on the time-resolved droplet shape results, three distinct dynamical stages during the impact process
were identified: the spreading stage, the receding stage, and the oscillating stage. To explain the three distinct
dynamical stages, the droplet impact process under a single impact condition is discussed in detail. Here, the droplet
initial diameter is 𝐷0 = 2.4𝑚𝑚 and the impact velocity is 𝑈0 = 0.77𝑚/𝑠. The corresponding Reynolds and Weber
numbers are 𝑅𝑒 = 1776 and 𝑊𝑒 = 29, respectively.
a. Spreading stage
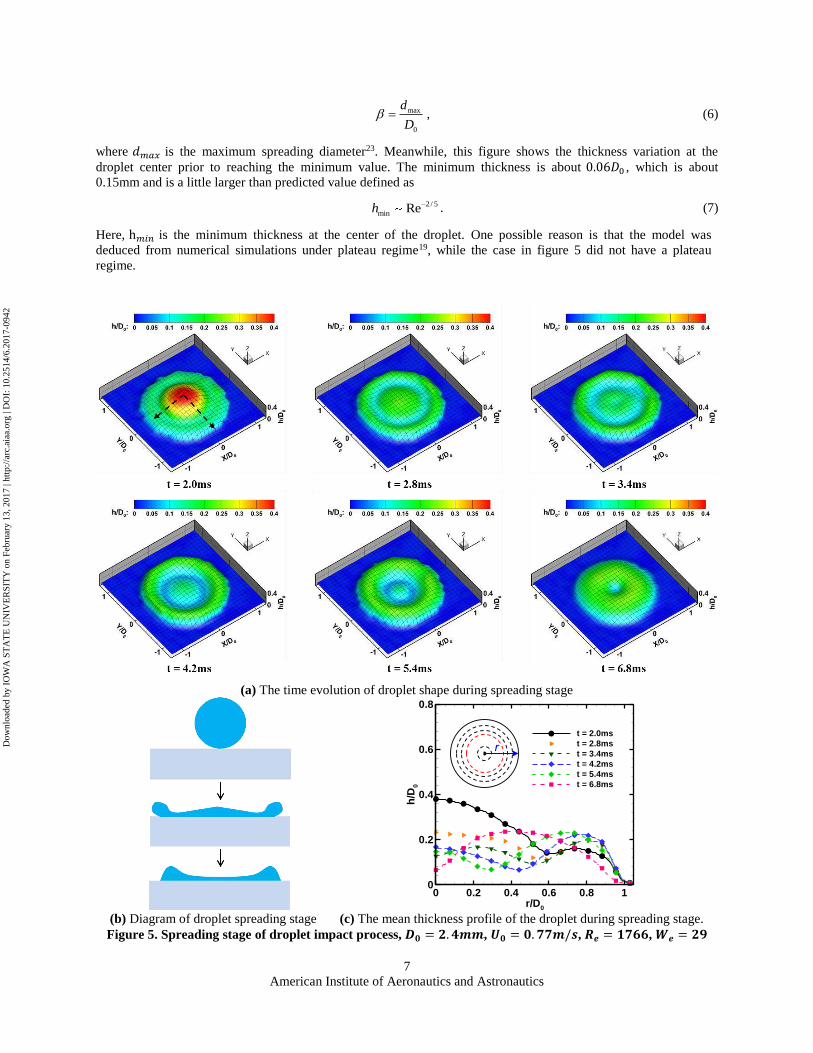
As the first stage of the droplet impact process, the spreading stage begins when the droplet contacts surface, and
it ends when the center of the droplet decreases to the minimal thickness, as shown in figure 5(b). During this stage,
the droplet diameter achieves the maximum value diameter (the spreading diameter) observed during the impact
process. Later in the stage, the thickness at the center of the droplet achieves the minimum thickness observed
during the impact process.
Figure 5(a) shows the time evolution of droplet shape during this stage, and thus the film thickness at all parts of
the droplet have been measured precisely. In this study, the time of 0ms was defined as the time when the droplet
first contacted the surface. After the initial contact, the droplet continues to flatten and expand, exhibiting surface
capillary waves22. The edge advances until reaching the maximum spreading diameter, and then exhibits a slight
retraction from the maximum spreading diameter. The center of the droplet reaches the minimum thickness at the
center, which defines the end of the first stage. As shown in figure 5(a) at the time t=3.4ms, the droplet center has
decreased to a local minimum thickness. However, after another 0.8ms, the droplet center rebounded to a local
maximum within the inner region of the droplet. The capillary wavelength can be calculated as
2
0U
, (4)
where λ is the capillary wavelength, and γ is the surface tension coefficient. For the parameters in figure 5, we
obtain λ ≈ 0.1mm. At the time t=4.2ms, the droplet extended to the maximum spreading diameter, and at the time
t=6.8ms, the center point decreased to the minimum thickness. During this stage, the water mass inside the droplet is
moving radially outward.
In this study, all the droplets impact velocity directions are perpendicular to the solid surface; therefore, we
assumed that the droplets are axially symmetric. Figure 5(c) shows the circumferentially-averaged thickness of the
droplet versus the radial position. This figure clearly shows that the droplet maximum spreading diameter is about 2
times the initial diameter of the droplet, which agrees well with the predicted value defined as
1/ 4We , (5)
where β is spreading factor defined by:
Dow
nloa
ded
by I
OW
A S
TA
TE
UN
IVE
RSI
TY
on
Febr
uary
13,
201
7 | h
ttp://
arc.
aiaa
.org
| D
OI:
10.
2514
/6.2
017-
0942
American Institute of Aeronautics and Astronautics
7
max
0
d
D , (6)
where 𝑑𝑚𝑎𝑥 is the maximum spreading diameter23. Meanwhile, this figure shows the thickness variation at the
droplet center prior to reaching the minimum value. The minimum thickness is about 0.06𝐷0 , which is about
0.15mm and is a little larger than predicted value defined as
2 / 5
min Reh . (7)
Here, h𝑚𝑖𝑛 is the minimum thickness at the center of the droplet. One possible reason is that the model was
deduced from numerical simulations under plateau regime19, while the case in figure 5 did not have a plateau
regime.
(a) The time evolution of droplet shape during spreading stage
(b) Diagram of droplet spreading stage (c) The mean thickness profile of the droplet during spreading stage.
Figure 5. Spreading stage of droplet impact process, 𝑫𝟎 = 𝟐. 𝟒𝒎𝒎, 𝑼𝟎 = 𝟎. 𝟕𝟕𝒎/𝒔, 𝑹𝒆 = 𝟏𝟕𝟔𝟔, 𝑾𝒆 = 𝟐𝟗
r/D0
h/D
0
0 0.2 0.4 0.6 0.8 10
0.2
0.4
0.6
0.8
t = 2.0ms
t = 2.8ms
t = 3.4ms
t = 4.2ms
t = 5.4ms
t = 6.8ms
rDow
nloa
ded
by I
OW
A S
TA
TE
UN
IVE
RSI
TY
on
Febr
uary
13,
201
7 | h
ttp://
arc.
aiaa
.org
| D
OI:
10.
2514
/6.2
017-
0942
American Institute of Aeronautics and Astronautics
8
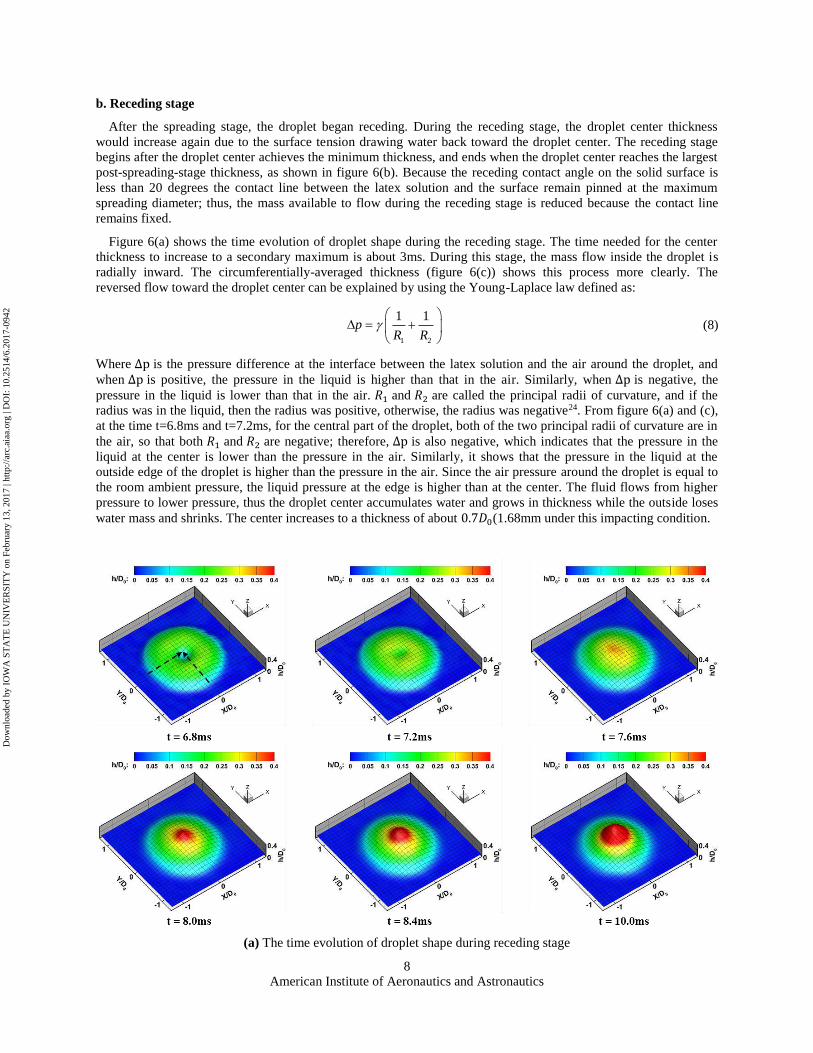
b. Receding stage
After the spreading stage, the droplet began receding. During the receding stage, the droplet center thickness
would increase again due to the surface tension drawing water back toward the droplet center. The receding stage
begins after the droplet center achieves the minimum thickness, and ends when the droplet center reaches the largest
post-spreading-stage thickness, as shown in figure 6(b). Because the receding contact angle on the solid surface is
less than 20 degrees the contact line between the latex solution and the surface remain pinned at the maximum
spreading diameter; thus, the mass available to flow during the receding stage is reduced because the contact line
remains fixed.
Figure 6(a) shows the time evolution of droplet shape during the receding stage. The time needed for the center
thickness to increase to a secondary maximum is about 3ms. During this stage, the mass flow inside the droplet is
radially inward. The circumferentially-averaged thickness (figure 6(c)) shows this process more clearly. The
reversed flow toward the droplet center can be explained by using the Young-Laplace law defined as:
1 2
1 1p
R R
(8)
Where ∆p is the pressure difference at the interface between the latex solution and the air around the droplet, and
when ∆p is positive, the pressure in the liquid is higher than that in the air. Similarly, when ∆p is negative, the
pressure in the liquid is lower than that in the air. 𝑅1 and 𝑅2 are called the principal radii of curvature, and if the
radius was in the liquid, then the radius was positive, otherwise, the radius was negative24. From figure 6(a) and (c),
at the time t=6.8ms and t=7.2ms, for the central part of the droplet, both of the two principal radii of curvature are in
the air, so that both 𝑅1 and 𝑅2 are negative; therefore, ∆p is also negative, which indicates that the pressure in the
liquid at the center is lower than the pressure in the air. Similarly, it shows that the pressure in the liquid at the
outside edge of the droplet is higher than the pressure in the air. Since the air pressure around the droplet is equal to
the room ambient pressure, the liquid pressure at the edge is higher than at the center. The fluid flows from higher
pressure to lower pressure, thus the droplet center accumulates water and grows in thickness while the outside loses
water mass and shrinks. The center increases to a thickness of about 0.7𝐷0(1.68mm under this impacting condition.
(a) The time evolution of droplet shape during receding stage
Dow
nloa
ded
by I
OW
A S
TA
TE
UN
IVE
RSI
TY
on
Febr
uary
13,
201
7 | h
ttp://
arc.
aiaa
.org
| D
OI:
10.
2514
/6.2
017-
0942

American Institute of Aeronautics and Astronautics
9
(b) Diagram of droplet spreading stage (c) The mean thickness profile of the droplet during spreading stage.
Figure 6. Receding stage of droplet impact process, 𝑫𝟎 = 𝟐. 𝟒𝒎𝒎, 𝑼𝟎 = 𝟎. 𝟕𝟕𝒎/𝒔, 𝑹𝒆 = 𝟏𝟕𝟔𝟔, 𝑾𝒆 = 𝟐𝟗
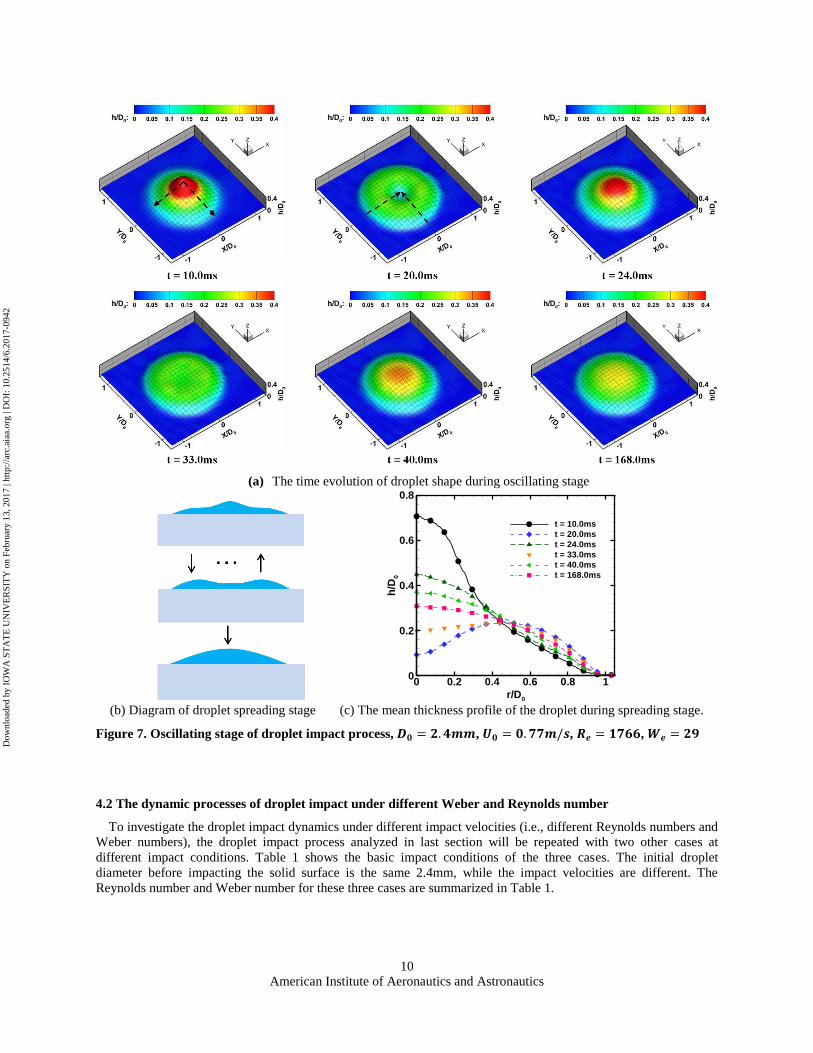
c. Oscillating stage
After the receding stage, the droplet begins the oscillating stage. The oscillating stage begins when the droplet
center reaches the maximum thickness (after the spreading stage, at the end of the receding stage), and ends when
the droplet is finally at rest on the solid surface. As shown in figure 7(b), the oscillating stage is a process switching
between spreading and receding processes. However, these spreading processes and receding processes are less
pronounced than in the initial spreading and receding stages.
As shown in figure 7(a) at the time t=10.0ms, when the center reaches the maximum thickness at the end of the
receding stage, the pressure at the center would exceed the pressure at the outside edge, so that the mass in the
central part of the droplet would flow outward. This would lead to the decrease of the center thickness, and the
increase of the edge thickness. At the time t=20.0ms, the droplet center decreases to a minimum thickness again. At
this point, using the Laplace-Young law again, then we can predict that the cycle will repeat again, as shown in
figure 7(a) at the time t=24.0ms. This spreading and receding process would keep repeating until the droplet is
finally at rest on the surface, as shown in figure 7(a) at the time t=168.0ms. The circumferentially averaged
thickness shown in figure 7(c) shows this oscillation more clearly. At the time t=10.0ms, the central part thickness
(1st maximum thickness) is about 0.7𝐷0, at the time t=24.0ms, the central part thickness (2nd maximum thickness) is
about 0.45𝐷0, and at the time t=40.0ms, the central part thickness (3rd maximum thickness) is about 0.37𝐷0, while
at the time t=20.0ms, the central part thickness (1st minimum thickness) is about 0.1𝐷0, at the time t=33.0ms, the
central part thickness (2nd minimum thickness) is about 0.2𝐷0, and at the time t=46.0ms, the central part thickness
(3rd minimum thickness) is about 0.25𝐷0, these thicknesses shows that the oscillating amplitude becomes less and
less pronounced. This amplitude decay can be explained through energy analysis. Since the droplet has viscosity,
energy is dissipated due to the internal flow inside the droplet. The energy dissipated by the viscosity could be
calculated by25:
0
t
dV
E dVdt , (9)
where 𝐸𝑑 is the energy dissipated by the viscosity, 𝑉 is the volume in which viscous dissipation occurs, and ∅ is the
viscous function defined as26:
2
2
y xU U
x y
. (10)
During the droplet impact process, internal fluid flow continuously dissipates the kinetic energy until the droplet
rests motionless on the solid surface.
r/D0
h/D
0
0 0.2 0.4 0.6 0.8 10
0.2
0.4
0.6
0.8
t = 6.8ms
t = 7.2ms
t = 7.6ms
t = 8.0ms
t = 8.4ms
t = 10.0ms
Dow
nloa
ded
by I
OW
A S
TA
TE
UN
IVE
RSI
TY
on
Febr
uary
13,
201
7 | h
ttp://
arc.
aiaa
.org
| D
OI:
10.
2514
/6.2
017-
0942
American Institute of Aeronautics and Astronautics
10
(a) The time evolution of droplet shape during oscillating stage
(b) Diagram of droplet spreading stage (c) The mean thickness profile of the droplet during spreading stage.
Figure 7. Oscillating stage of droplet impact process, 𝑫𝟎 = 𝟐. 𝟒𝒎𝒎, 𝑼𝟎 = 𝟎. 𝟕𝟕𝒎/𝒔, 𝑹𝒆 = 𝟏𝟕𝟔𝟔, 𝑾𝒆 = 𝟐𝟗
4.2 The dynamic processes of droplet impact under different Weber and Reynolds number
To investigate the droplet impact dynamics under different impact velocities (i.e., different Reynolds numbers and
Weber numbers), the droplet impact process analyzed in last section will be repeated with two other cases at
different impact conditions. Table 1 shows the basic impact conditions of the three cases. The initial droplet
diameter before impacting the solid surface is the same 2.4mm, while the impact velocities are different. The
Reynolds number and Weber number for these three cases are summarized in Table 1.
r/D0
h/D
0
0 0.2 0.4 0.6 0.8 10
0.2
0.4
0.6
0.8
t = 10.0ms
t = 20.0ms
t = 24.0ms
t = 33.0ms
t = 40.0ms
t = 168.0ms
Dow
nloa
ded
by I
OW
A S
TA
TE
UN
IVE
RSI
TY
on
Febr
uary
13,
201
7 | h
ttp://
arc.
aiaa
.org
| D
OI:
10.
2514
/6.2
017-
0942

American Institute of Aeronautics and Astronautics
11
Table 1. The initial diameter before droplet impact on the solid surface, the impact velocity, and
corresponding Reynolds and Weber number under three different conditions
𝐃𝟎 (mm) 𝐔𝟎 (m/s) Re We
Case 1 2.4 0.77 1776 29
Case 2 2.4 1.60 3670 123
Case 3 2.4 2.12 4862 216
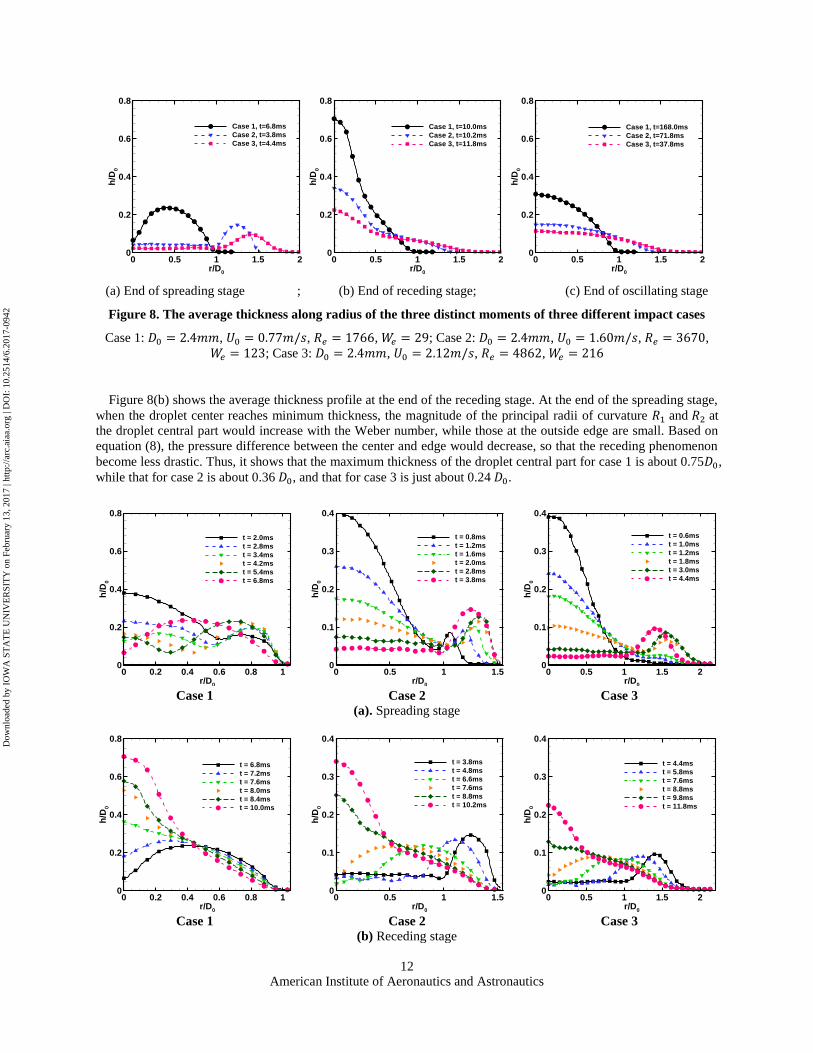
Figure 8 shows the average thickness along radius at three distinct moments during the droplet impact process.
Figure 8(a) shows the moment at the end of the spreading stage, figure 8(b) shows the moment at the end of the
receding stage, and figure 8(c) shows the moment at the end of the oscillating stage. Figure 9 shows profiles
throughout the three stages. Based on the time resolved thickness profiles along radius, the impact velocity or the
Weber and Reynolds numbers’ influence to the dynamics of the impact droplet could be discussed carefully.
Figure 8(a) shows the average thickness profile at the end of the spreading stage, and as expected, the spreading
process of the droplet under different Weber number proceeds similarly. During the spreading stage, the droplet
center descends until it reaches a minimum thickness, while the droplet diameter expands until it reaches the
maximum spreading diameter, and the mass flow direction is radially outward. However, there still are some
differences in the dynamics. First, with the larger Weber number, the central decent speed is larger during the early
time regime (i.e., first 2ms) due to the larger impact velocity of the droplet. Larger Weber number also accompanies
a larger spreading speed. The time for the droplet to reach the minimum thickness should decrease, however, the
spreading stage for these three cases are 6.8ms, 3.8ms, and 4.4ms, which does not agree with the analysis, and the
explanation requires additional study.
As shown in figure 8(a), at the end of the spreading stage the shapes of the droplet in these three cases have
obvious differences, especially at the center. When the droplet center decreases to a minimum thickness, all of these
three cases have similar ridge shape at the outside edge of the droplet, and the bottom width of the ridge for case 1 is
from 0 𝐷0 to about 1 𝐷0, while that for case 2 is from about 0.9 𝐷0 to about 1.5 𝐷0, and that for case 3 is from about
1.1 𝐷0 to about 1.7 𝐷0. When considering the central part of the droplet, the shape has obvious differences. For case
2 and 3, when the Weber number increase to 123 and 216, the spreading droplet has obvious level liquid plate,
which is called a plateau. The plateau length for case 2 is about 0.9 𝐷0, and that for case 3 is about 1 𝐷0, while there
is no such plateau in case 1. This is because when the Weber number is small, the descent speed of the droplet center
and the expanding speed is small and the droplet does not have enough energy to overcome surface tension during
the spreading process. Therefore, when the droplet center decreases to the minimum thickness, the outside edge
already begins receding and the center will reverse direction. However, when the Weber number increases to a
certain value, the droplet has enough energy to overcome the surface tension during the spreading process, and will
achieve a larger spreading diameter, so that when the droplet center reaches the minimum thickness, the receding
liquid from the outside part is still far away, thus these impact droplets will have a so called plateau at the central
part. Figure 9 visualizes this difference. Figure 10 shows the 3D shape instead of the average one. As shown in
figure 10, the ridge becomes a thin ring, and from the 3D shape, we even could find that the rings in case 2 and case
3 are different. With the increase of the Weber number (i.e., from 123 to 216), the relative smooth ring becomes
rough. The stability of the droplet would decrease due to the interactions among the droplet, the solid surface and the
air around the droplet20. When the Weber number or the impact velocity increases to a certain value, the stability of
the droplet would become unstable enough, which leads to the droplet splash during the spreading stage. Another
phenomenon that was observed is the maximum spreading diameter. As discussed in last section, the droplet
maximum spreading diameter would increase with the increase of the Weber number, and the spreading factors β
agree well with the predicted values defined by equation (6). For the minimum thickness, case 1 is about 0.06𝐷0, the
case 2 is about 0.04𝐷0, the case 3 is about 0.03𝐷0, and these thicknesses are about 0.15mm, 0.1mm, and 0.07mm
respectively, which agree well with the predicted value based on equation (7), except for case 1. As discussed in last
section about the spreading stage, one possible reason for the disagreement of case 1 is that the case one does not
exhibit a plateau, which is present in the other two cases.
Dow
nloa
ded
by I
OW
A S
TA
TE
UN
IVE
RSI
TY
on
Febr
uary
13,
201
7 | h
ttp://
arc.
aiaa
.org
| D
OI:
10.
2514
/6.2
017-
0942
American Institute of Aeronautics and Astronautics
12
(a) End of spreading stage ; (b) End of receding stage; (c) End of oscillating stage
Figure 8. The average thickness along radius of the three distinct moments of three different impact cases
Case 1: 𝐷0 = 2.4𝑚𝑚, 𝑈0 = 0.77𝑚/𝑠, 𝑅𝑒 = 1766, 𝑊𝑒 = 29; Case 2: 𝐷0 = 2.4𝑚𝑚, 𝑈0 = 1.60𝑚/𝑠, 𝑅𝑒 = 3670,
𝑊𝑒 = 123; Case 3: 𝐷0 = 2.4𝑚𝑚, 𝑈0 = 2.12𝑚/𝑠, 𝑅𝑒 = 4862, 𝑊𝑒 = 216
Figure 8(b) shows the average thickness profile at the end of the receding stage. At the end of the spreading stage,
when the droplet center reaches minimum thickness, the magnitude of the principal radii of curvature 𝑅1 and 𝑅2 at
the droplet central part would increase with the Weber number, while those at the outside edge are small. Based on
equation (8), the pressure difference between the center and edge would decrease, so that the receding phenomenon
become less drastic. Thus, it shows that the maximum thickness of the droplet central part for case 1 is about 0.75𝐷0,
while that for case 2 is about 0.36 𝐷0, and that for case 3 is just about 0.24 𝐷0.
Case 1
Case 2
Case 3
(a). Spreading stage
Case 1
Case 2
Case 3
(b) Receding stage
r/D0
h/D
0
0 0.5 1 1.5 20
0.2
0.4
0.6
0.8
Case 1, t=6.8ms
Case 2, t=3.8ms
Case 3, t=4.4ms
r/D0
h/D
0
0 0.5 1 1.5 20
0.2
0.4
0.6
0.8
Case 1, t=10.0ms
Case 2, t=10.2ms
Case 3, t=11.8ms
r/D0
h/D
0
0 0.5 1 1.5 20
0.2
0.4
0.6
0.8
Case 1, t=168.0ms
Case 2, t=71.8ms
Case 3, t=37.8ms
r/D0
h/D
0
0 0.2 0.4 0.6 0.8 10
0.2
0.4
0.6
0.8
t = 2.0ms
t = 2.8ms
t = 3.4ms
t = 4.2ms
t = 5.4ms
t = 6.8ms
r/D0
h/D
0
0 0.5 1 1.50
0.1
0.2
0.3
0.4
t = 0.8ms
t = 1.2ms
t = 1.6ms
t = 2.0ms
t = 2.8ms
t = 3.8ms
r/D0
h/D
0
0 0.5 1 1.5 20
0.1
0.2
0.3
0.4
t = 0.6ms
t = 1.0ms
t = 1.2ms
t = 1.8ms
t = 3.0ms
t = 4.4ms
r/D0
h/D
0
0 0.2 0.4 0.6 0.8 10
0.2
0.4
0.6
0.8
t = 6.8ms
t = 7.2ms
t = 7.6ms
t = 8.0ms
t = 8.4ms
t = 10.0ms
r/D0
h/D
0
0 0.5 1 1.50
0.1
0.2
0.3
0.4
t = 3.8ms
t = 4.8ms
t = 6.6ms
t = 7.6ms
t = 8.8ms
t = 10.2ms
r/D0
h/D
0
0 0.5 1 1.5 20
0.1
0.2
0.3
0.4
t = 4.4ms
t = 5.8ms
t = 7.6ms
t = 8.8ms
t = 9.8ms
t = 11.8ms
Dow
nloa
ded
by I
OW
A S
TA
TE
UN
IVE
RSI
TY
on
Febr
uary
13,
201
7 | h
ttp://
arc.
aiaa
.org
| D
OI:
10.
2514
/6.2
017-
0942

American Institute of Aeronautics and Astronautics
13
Case 1
Case 2
Case 3
(c) Oscillating stage
Figure 9. The average thickness along radius of the three distinct stages of three different impact cases.
Case 1: 𝐷0 = 2.4𝑚𝑚, 𝑈0 = 0.77𝑚/𝑠, 𝑅𝑒 = 1766, 𝑊𝑒 = 29; Case 2: 𝐷0 = 2.4𝑚𝑚, 𝑈0 = 1.60𝑚/𝑠, 𝑅𝑒 = 3670,
𝑊𝑒 = 123; Case 3: 𝐷0 = 2.4𝑚𝑚, 𝑈0 = 2.12𝑚/𝑠, 𝑅𝑒 = 4862, 𝑊𝑒 = 216
(a) Case1, t=6.8ms (b) Case 2, t=3.8ms; (c) Case 3, t=4.4ms
Figure 10. The impact droplet shape at the end of the spreading stage under different impact conditions
Case 1: 𝐷0 = 2.4𝑚𝑚, 𝑈0 = 0.77𝑚/𝑠, 𝑅𝑒 = 1766, 𝑊𝑒 = 29; Case 2: 𝐷0 = 2.4𝑚𝑚, 𝑈0 = 1.60𝑚/𝑠, 𝑅𝑒 = 3670,
𝑊𝑒 = 123; Case 3: 𝐷0 = 2.4𝑚𝑚, 𝑈0 = 2.12𝑚/𝑠, 𝑅𝑒 = 4862, 𝑊𝑒 = 216
Figure 11. Time evolution of the droplet center point thickness under different impacting conditions
Case 1: 𝐷0 = 2.4𝑚𝑚, 𝑈0 = 0.77𝑚/𝑠, 𝑅𝑒 = 1766, 𝑊𝑒 = 29; Case 2: 𝐷0 = 2.4𝑚𝑚, 𝑈0 = 1.60𝑚/𝑠, 𝑅𝑒 = 3670,
𝑊𝑒 = 123; Case 3: 𝐷0 = 2.4𝑚𝑚, 𝑈0 = 2.12𝑚/𝑠, 𝑅𝑒 = 4862, 𝑊𝑒 = 216
Figure 8(c) shows the average thickness profile at the end of the oscillating stage. When the droplet finally comes
to rest on the solid surface, the shape of the droplet would look like a spherical cap, and with the increase of the
Weber number, the cap becomes flatter and wider. For case 1, the central part thickness of the droplet is about 0.3𝐷0,
and the bottom radius of the droplet is about 1𝐷0, while those for case 2 are about 0.16𝐷0, 1.3𝐷0, for case 3 are
about 0.12𝐷0 and 1.5𝐷0 respectively. Since the receding contact angle of the latex solution on the solid surface is
r/D0
h/D
0
0 0.2 0.4 0.6 0.8 10
0.2
0.4
0.6
0.8
t = 10.0ms
t = 20.0ms
t = 24.0ms
t = 33.0ms
t = 40.0ms
t = 168.0ms
r/D0
h/D
0
0 0.5 1 1.50
0.1
0.2
0.3
0.4
t = 10.2ms
t = 13.8ms
t = 15.8ms
t = 23.0ms
t = 35.8ms
t = 71.8ms
r/D0
h/D
0
0 0.5 1 1.5 20
0.1
0.2
0.3
0.4
t = 11.8ms
t = 13.8ms
t = 15.8ms
t = 17.8ms
t = 21.8ms
t = 37.8ms
Dow
nloa
ded
by I
OW
A S
TA
TE
UN
IVE
RSI
TY
on
Febr
uary
13,
201
7 | h
ttp://
arc.
aiaa
.org
| D
OI:
10.
2514
/6.2
017-
0942
American Institute of Aeronautics and Astronautics
14
less than 20 degrees, when the droplet reaches the maximum spreading diameter during the spreading stage, the
bottom of the droplet would not recede, thus the contact line between droplet and solid surface would stay at the
maximum spreading position. Therefore, when the droplet finally rests on the solid surface, the shape of the droplet
would remain flatter and wider with the increase of the droplet impact velocity or the Weber number.
Meanwhile, with the increase of the Weber number, the total time needed for the droplet finally rest on the solid
surface would decrease; specifically, the total time for case 1 is about 168.0ms, while those for case 2 and 3 are
71.8ms and 37.8ms respectively. From figure 8(a) and (b), the total time for the droplet spreading and receding
stages are nearly same, the time for all of these three cases is around 10ms, so that the main difference is in the
oscillating stage. Figure 11 shows the oscillatory spreading and receding process clearly, since figure 11 shows the
time evolution of the droplet center point thickness. The peaks of the curve mean that the droplet is at the end of the
receding phases, and the valleys means that the droplet is at the end of the spreading phases. From this figure, it can
be seen that the spreading and receding stages looks similar in main shape variation, except for the central thickness
fluctuation in case 1, and the obvious plateau at the central part in case 2 and 3. However, there is significantly
different dynamics in the oscillating stage. For case 1, it shows at least 7 obvious spreading and receding cycles
during the oscillating stage, while for case 2 and case 3, only 1 obvious spreading and receding cycle could be seen
during the oscillating stage. One possible reason for this is that with the increase of the Weber number, the energy
dissipation rate would increase with the increase of the kinetic energy. To uncover the physics under this kind of
phenomenon, some more detailed analysis is needed. At the end of the spreading stage, the kinetic energy inside the
droplet is nearly 0, thus the main energy at this moment inside the droplet is surface energy27. Thus, the oscillating
of the droplet could be assumed as damped harmonic oscillator defined as28,29
mx kx cx , (11)
where, 𝑥 is the deflection from a neutral (the center point thickness when the droplet is finally rest on the solid
surface), m is the mass of the system (the droplet mass), k is a spring constant which related with the surface tension
of the droplet, and c is a damping coefficient which related with the viscosity of the droplet.
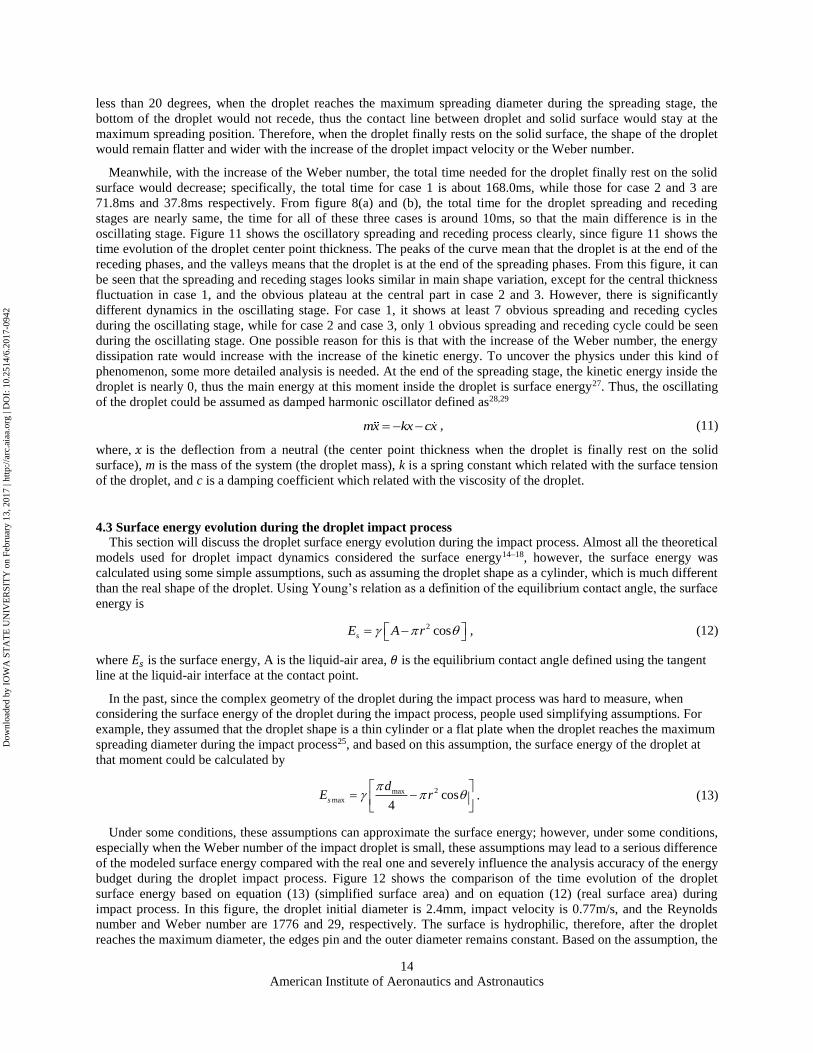
4.3 Surface energy evolution during the droplet impact process
This section will discuss the droplet surface energy evolution during the impact process. Almost all the theoretical
models used for droplet impact dynamics considered the surface energy14–18, however, the surface energy was
calculated using some simple assumptions, such as assuming the droplet shape as a cylinder, which is much different
than the real shape of the droplet. Using Young’s relation as a definition of the equilibrium contact angle, the surface
energy is
2cossE A r , (12)
where 𝐸𝑠 is the surface energy, A is the liquid-air area, 𝜃 is the equilibrium contact angle defined using the tangent
line at the liquid-air interface at the contact point.
In the past, since the complex geometry of the droplet during the impact process was hard to measure, when
considering the surface energy of the droplet during the impact process, people used simplifying assumptions. For
example, they assumed that the droplet shape is a thin cylinder or a flat plate when the droplet reaches the maximum
spreading diameter during the impact process25, and based on this assumption, the surface energy of the droplet at
that moment could be calculated by
2max
max cos4
s
dE r
. (13)
Under some conditions, these assumptions can approximate the surface energy; however, under some conditions,
especially when the Weber number of the impact droplet is small, these assumptions may lead to a serious difference
of the modeled surface energy compared with the real one and severely influence the analysis accuracy of the energy
budget during the droplet impact process. Figure 12 shows the comparison of the time evolution of the droplet
surface energy based on equation (13) (simplified surface area) and on equation (12) (real surface area) during
impact process. In this figure, the droplet initial diameter is 2.4mm, impact velocity is 0.77m/s, and the Reynolds
number and Weber number are 1776 and 29, respectively. The surface is hydrophilic, therefore, after the droplet
reaches the maximum diameter, the edges pin and the outer diameter remains constant. Based on the assumption, the
Dow
nloa
ded
by I
OW
A S
TA
TE
UN
IVE
RSI
TY
on
Febr
uary
13,
201
7 | h
ttp://
arc.
aiaa
.org
| D
OI:
10.
2514
/6.2
017-
0942

American Institute of Aeronautics and Astronautics
15
surface area of the droplet does not change after the reaching the maximum diameter. The surface energy based on
the real surface area measured by using DIP technique is much bigger than that the simplified model surface area
(thin cylinder) by about a factor of four. Compared with the total energy 𝐸0 before droplet impact25, the assumption
can lead to a 20 percent error in the energy budget during the impact process. The film thickness measurement of the
droplet during the impact process can significantly improve the energy budget, and can help correct the models
developed based on the energy budget.
Figure 12. Time evolution of the droplet surface energy during impact process
𝐷0 = 2.4𝑚𝑚, 𝑈0 = 0.77𝑚/𝑠, 𝑅𝑒 = 1766, 𝑊𝑒 = 29
4.4 Discussions on Measurement Uncertainty
Figure 13 shows the DIP technique measurement accuracy in droplet thickness measurement. Figure 13(a) shows
droplet volume during the entire impacting process measured by DIP technique and the volume calculated based on
initial droplet size before the droplet impact on the solid surface. The droplet initial diameter is 2.4mm, the impact
velocity is 1.60m/s, and the Reynolds and Weber numbers are 3670 and 123 respectively. This shows that the DIP
technique measurement results agree well with the calculated volume based on the initial droplet size, except
between about 1.5–4ms. This is because the DIP technique can only measure the top surface of the droplet, while it
cannot measure the air thickness under the droplet, as shown in figure 13(b). In the time between about 1.5–4ms, the
droplet was in the spreading stage, and during this stage, the droplet spreading speed at the edge was faster than the
contact line between droplet and the solid surface. Therefore, the air underneath the droplet, which is occluded from
the view in the DIP image, was erroneously considered as part of the droplet during the thickness measurement.
Thus, during the spreading process, the droplet volume measured by DIP technique is a little higher than that
calculated based on initial droplet size before droplet impact on the surface. The compared results show that the
measurement error of the volume is less than 5%, while the measurement uncertainty is less than 2%.
(a) Measured droplet volume (b) Droplet contact line during the spreading process.
Figure 13. DIP technique measurement accuracy
Dow
nloa
ded
by I
OW
A S
TA
TE
UN
IVE
RSI
TY
on
Febr
uary
13,
201
7 | h
ttp://
arc.
aiaa
.org
| D
OI:
10.
2514
/6.2
017-
0942

American Institute of Aeronautics and Astronautics
16
V. Conclusions
In the present study, an experimental investigation was conducted to quantify the shape evolution of the droplet
during the impact process on solid surface in order to elucidate underlying physics to improve our understanding of
the important microphysical processes pertinent to aircraft icing phenomena. A digital image projection (DIP)
technique was used to achieve time-resolved measurements of the droplet thickness during the entire droplet impact
process, including the spreading, receding and oscillating stages. By comparing the droplet shape evolution under
different impact velocities, the dynamics of droplet impact under different Weber numbers or Reynolds numbers
were analyzed in detail. Based on the time-resolved film thickness of the impact droplet, the surface energy
evolution during the whole impact process was obtained.
By comparing the droplet volume measure by digital image projection technique during the impact process with
the droplet volume calculated based on the initial diameter of the droplet before contacting on the surface, the digital
image projection technique measurement error and uncertainty was validated. The compared result shows that the
measurement error of the technique is less than 5%, while the measurement uncertainty is less than 2%.
Based on the time-resolved droplet film thickness, the droplet impact on a solid surface could be divided into
three distinct stages: the spreading stage, which begins when the droplet first contacts the surface and ends when the
droplet center reaches the minimum thickness; the receding stage, which begins following the end of the spreading
stage and ends when the droplet center achieves a secondary maximum thickness; and the oscillating stage, which
begins following the end of the receding stage and ends when the droplet finally comes to rest on the solid surface.
These three stages were analyzed and the dynamical physics were uncovered based on the quantified thickness
results.
By comparing the droplet shape evolution under different impact velocities, it was found that with the increase of
the Weber number, the maximum spreading diameter of the droplet would increase, as would with the spreading
speed. Additionally, the droplet has a plateau at the center under high Weber number conditions, while under the
low Weber condition, no plateau was observed. Also, with a much longer oscillation stage compared with the higher
Weber number cases, the total time for the droplet to finish the impact process under the lower Weber number
condition is longer. Meanwhile, the reason for the rapid decay of the oscillation when the Weber number increase
was discussed.
As a very important factor dominating the droplet impact process, the surface energy of the droplet during the
impact process was calculated based on the time-resolved shape information. Comparing with the surface energy
based on the droplet geometry assumptions, the surface energy based on the measured surface area can significantly
improve the energy budget, and can help correct the models developed based on the energy budget.
Acknowledgments
The research work is partially supported by NASA grant number NNX12AC21A and Iowa Space Grant Consortium
(ISGC) Base Program for Aircraft Icing Studies. The authors also gratefully acknowledge the support of National
Science Foundation under award numbers CBET-1064196 and CBET-1435590.
References
1 Report, A. A., “National Transportation Safety in-Flight Icing Encounter and Loss of Control,” vol. 1, 1994.
2 Potapczuk, M. G., John, N., and Field, L., “Ice Mass Measurement: Implications For The Ice Accretion Process,” AIAA
41th Aerospace Sciences Meeting & Exhibit, Reno, NE, 2003.
3 Waldman, R., and Hu, H., “High-Speed Imaging to Quantify the Transient Ice Accretion Process on a NACA 0012
Airfoil,” 53rd AIAA Aerospace Sciences Meeting, 2015, pp. 2–5.
4 Liu, Y., Waldman, R., and Hu, H., “An Experimental Investigation on the Unsteady Heat Transfer Process Over an Ice
Accreting NACA 0012 Airfoil,” 53rd AIAA Aerospace Sciences Meeting, 2015, pp. 1–16.
5 Worthington, “On the forms assumed by drops of liquids falling vertically on a horizontal plate,” 1876, pp. 261–272.
6 Eggers, J., and Villermaux, E., “Physics of liquid jets,” vol. 71, 2008.
7 Planchon, O., “A Physical Model for the Action of Raindrop Erosion on Soil Microtopography,” vol. 74, 2010.
8 Minemawari, H., Yamada, T., Matsui, H., Tsutsumi, J., Haas, S., Chiba, R., Kumai, R., and Hasegawa, T., “Inkjet
printing of single-crystal films,” Nature, vol. 475, 2011, pp. 364–367.
Dow
nloa
ded
by I
OW
A S
TA
TE
UN
IVE
RSI
TY
on
Febr
uary
13,
201
7 | h
ttp://
arc.
aiaa
.org
| D
OI:
10.
2514
/6.2
017-
0942
American Institute of Aeronautics and Astronautics
17
9 Attinger, D., Moore, C. B., Donaldson, A., and Stone, H. A., “Fluid dynamics topics in bloodstain pattern analysis :
Comparative review and research opportunities,” 2013.
10 Antkowiak, A., Audoly, B., and Josserand, C., “Instant fabrication and selection of folded structures using drop impact,”
vol. I.
11 Rein, M., “Phenomena of liquid drop impact on solid and liquid surfaces,” vol. 12, 1993, pp. 61–93.
12 Engineering, M., Drive, E., and Engineering, E., “The air bubble entrapped under a drop impacting on a solid surface,”
vol. 545, 2005, pp. 203–212.
13 Street, G., and Street, G., “Air cushioning with a lubrication/inviscid balance,” vol. 482, 2003, pp. 291–318.
14 Eggers, J., Fontelos, M. A., Josserand, C., Zaleski, S., Eggers, J., Fontelos, M. A., Josserand, C., and Zaleski, S., “Drop
dynamics after impact on a solid wall : Theory and simulations Drop dynamics after impact on a solid wall : Theory and
simulations,” vol. 062101, 2016.
15 Chr. Mundo, M. Sommerfeld, C. T., “Droplet-Wall Collisions: Experimental Studies of the Deformation and Breakup
Process,” vol. 21, 1995.
16 Rioboo, R., Heat, E., and Sa, P., “Outcomes from a Drop Impact on Solid Surfaces,” 2001.
17 Statistique, P., and Lhomond, R., “Retraction dynamics of aqueous drops upon impact on non-wetting surfaces,” vol.
545, 2005, pp. 329–338.
18 Roisman, I. V, Berberović, E., Tropea, C., Roisman, I. V, Berberovi, E., and Tropea, C., “Inertia dominated drop
collisions . I . On the universal flow in the lamella Inertia dominated drop collisions . I . On the universal flow in the
lamella,” vol. 052103, 2016.
19 Lagubeau, G., Fontelos, M. A., Josserand, C., Maurel, A., Pagneux, V., and Petitjeans, P., “Spreading dynamics of drop
impacts,” 2012, pp. 50–60.
20 Xu, L., Zhang, W. W., and Nagel, S. R., “Drop Splashing on a Dry Smooth Surface,” vol. 184505, 2005, pp. 1–4.
21 Zhang, K., Wei, T., and Hu, H., “An experimental investigation on the surface water transport process over an airfoil by
using a digital image projection technique,” Experiments in Fluids, vol. 56, 2015, p. 173.
22 RENARDY, Y., POPINET, S., DUCHEMIN, L., RENARDY, M., ZALESKI, S., JOSSERAND, C., DRUMRIGHT-
CLARKE, M. A., RICHARD, D., CLANET5, C., and QUERE, D., “Pyramidal and toroidal water drops after impact on
a solid surface,” vol. 484, 2003, pp. 69–83.
23 CLANET, C. S., BE´GUIN, C. D., RICHARD, D., and QU ´ ER ´E, D., “Maximal deformation of an impacting drop ´,”
vol. 517, 2004, pp. 199–208.
24 Lautrup, B., Physics of Continuous Matter, Institute of physics Publishing Ltd, 2005.
25 Chandra, S., and Avedisian, C. T., “On the collision of a droplet with a solid surface,” Proc. R. Soc. London, Ser. A, vol.
432, 1991, pp. 13–41.
26 Qian, T., Wang, X., and Sheng, P., “A variational approach to moving contact line hydrodynamics,” J. Fluid Mech., vol.
564, 2006, pp. 333–360.
27 Lee, J. B., Derome, D., Dolatabadi, A., and Carmeliet, J., “Energy Budget of Liquid Drop Impact at Maximum
Spreading: Numerical Simulations and Experiments,” 2016.
28 Manglik, R. M., Jog, M. A., Gande, S. K., Ravi, V., Manglik, R. M., Jog, M. A., Gande, S. K., and Ravi, V., “Damped
harmonic system modeling of post-impact drop-spread dynamics on a hydrophobic surface Damped harmonic system
modeling of post-impact drop-spread dynamics on a hydrophobic surface,” vol. 082112, 2013.
29 Boinovich, L., Emelyanenko, A. M., Korolev, V. V., and Pashinin, A. S., “Effect of wettability on sessile drop freezing:
When superhydrophobicity stimulates an extreme freezing delay,” Langmuir, vol. 30, 2014, pp. 1659–1668.
Dow
nloa
ded
by I
OW
A S
TA
TE
UN
IVE
RSI
TY
on
Febr
uary
13,
201
7 | h
ttp://
arc.
aiaa
.org
| D
OI:
10.
2514
/6.2
017-
0942