quantification of exploitable tidal energy resources in uk
TRANSCRIPT

npower juice
Quantification of Exploitable Tidal Energy Resources in UK Waters Vol. 1: Main Text and Appendices
Date: July 2007
Project Ref: R/3671/4 Report No: R.1349


Quantification of Exploitable Tidal Energy Resources in UK Waters
Summary Introduction
This npower juice funded project has applied a consistent and transparent methodology of analysis across the UK Continental Shelf to review and quantify the exploitable tidal resources in UK waters. The study has supplemented the best available national tidal resource information (from the DTI Renewable Atlas) with a number of local scale datasets, to provide a detailed description of annual tidal currents at half-hourly intervals. This information has been incorporated into a comprehensive GIS database to support the following activities: Mapping areas where physical conditions are suitable for the deployment of tidal
stream technologies; Investigation into possible Marine Spatial Planning constraints that may affect the
deployment of tidal devices; and Quantify the likely device deployment capacities and annual energy yields that could
potentially be achieved in the next 10 years. Over tidal stream 35 devices were identified and of these 21 had an appropriate level of information to be included in this study. These technologies have been analysed using device groups identified in existing research, as below:
Group A Horizontal axial-flow (single or bi-directional directional) turbines (fixed
turbine direction); Group B Horizontal axial-flow multiple direction (yawing) turbines. This type of
turbine can rotate according to the direction of the tidal flow direction; Group C Vertical axis (cross-flow turbines). These turbines rotate regardless of
the flow direction; Group D Oscillating hydrofoil; and Group E Air injection technology (hydraulic).
Three depth bandings have been adopted for this study, these have been created in-line with existing industry definitions and are used throughout this report:
Shallow water (depth 4-25m LAT); Intermediate (>25-40m LAT); and Deep water (>40-100m LAT).
Areas Suitable for Tidal Technology Deployment The area physically suitable for tidal technology deployment was identified using mean spring peak currents, water depths and proximity to land. The elliptical form of tidal flows was researched as part of the project, however, due to the dominance of bi-directional flows eccentricity was not included as part of the physical constraint criteria. Locations suitable for
R/3671/4 (i) R.1349

Quantification of Exploitable Tidal Energy Resources in UK Waters
R/3671/4 (ii) R.1349
technology deployment were analysed using individual device specifications provided by a range of tidal stream technology developers. Approximately 28,000km² of UK waters has suitable physical conditions for the deployment of tidal technologies and this represents approximately 3.1% of the UK Continental Shelf. Many devices have similar physical requirements and, therefore, the predicted deployment locations for technologies demonstrate a considerable area of overlap. The overall area for deployment is similar between Groups A and C, with technologies from both groups potentially being deployed in over 3% of UK waters. These groups have much larger possible physical area for deployment than Groups B (1%), D (0.5%), and E (0.8%). Based on physical constraints alone, Group A has the greatest potential deployment area, and as this group has both the minimum and maximum depth values combined with the shared minimum current requirements, it encompasses all possible sea areas that are suitable for tidal technology deployment. When all technology groups are considered, potential deployment areas are similar in shallow (7,750km²) and intermediate (7,170km²) waters, while there is almost double the potential deployment area in deep (13,010km²) water. Potential Constraints Many areas of UK waters are subject to pressures from competing resources that wish to utilise the seabed, water column or surface. Areas where existing activities are present, which are unlikely to be able to co-exist with tidal technologies, have been excluded from the predicted tidal resource. Areas where existing activities are present that can potentially co-exist with tidal technologies have been researched and reported. Twelve existing marine uses and users were considered as exclusion constraints and result in the net loss of 12% of the suitable area of tidal resource. Existing marine cables account for over half of the excluded AOI while aggregate licence areas (18%) and pipelines (14%) also provide significant contributions to the total area of exclusion. More areas of exclusion constraints are located in shallower areas with almost half of the excluded AOI located shallow depth zone. The remaining exclusion area is split between 27% in intermediate water depths and 25% in deep water. Some activities have the potential to co-exist with tidal technologies, usually because they utilise different aspects of the marine resource. The precise circumstances where these activities may be able to co-exist will vary greatly, between different local areas of tidal resource and individual sites of interest, and will have to be fully investigated as part of the planning for technology deployment. Seven groups of potentially co-existing activity were analysed and several of these are widespread in areas of potential tidal technology deployment. Navigation is considered to offer the largest potential conflict resulting from the co-existing constraints that were investigated.

Quantification of Exploitable Tidal Energy Resources in UK Waters
R/3671/4 (iii) R.1349
Installed Capacity
Several assumptions have been applied to manage the predictions of installed capacity including limiting individual deice power ratings to 5MW and only analysing farms with a capacity of 5-30MW/km². This calculation was undertaken for all areas that are physically suitable for the deployment but dismissed areas subject to exclusion constraints. This is a different approach to many other site-specific studies, which focus on the areas of greatest potential resource and are less likely to predict device deployments in other areas, which although less appealing, may still have suitable tidal flows. In addition, this study has adopted a process of analysis that considers the precise tidal flows, available water depth, variable turbine power ratings and deployment densities to calculate the potential installed capacity for areas of suitable for tidal resource. The work has calculated a range of parameters that have often only been considered independently in existing research and offers a detailed and transparent approach to analysis. The overall predicted installed capacities for technology groups range from approximately 19,000-39,000MW with an average 36,000MW when areas of overlapping technologies deployment predictions are accounted for. The capped maximum capacity of 30MW/km2 is predicted for areas of tidal resource around the Channel Islands, the Isle of Wight, Portland, Ramsay Island, Bardsay Island, Anglesey, at the Mull of Galloway, in the North Channel, around the Isle of Islay, in Pentland Firth and around the Orkney Islands.
Technically Extractable Tidal Energy
Potential annual energy yields have been calculated for areas of tidal resource that are suitable for technology deployment and free from exclusion constraints. The energy calculations have only been undertaken for areas that are less than 40m deep as the design specifications of large deepwater devices is currently unresolved, and it is unlikely that deep water areas will be exploited within the 5-10 year timeframe considered by the energy calculation in this project. The power calculation includes the Betz Law coefficient, estimates of turbine efficiency, the active area of technologies in a device group, the number of devices that can be deployed in a cell, the power rating of those devices, and is based on a full year of predicted currents for all potential resource areas. The equation also assumes a 100% uptime for deployed devices as information regarding likely down-time for routine maintenance and break fixes is presently unavailable. The total predicted annual energy yield for UK waters is estimated as approximately 94TWh/y. Over two thirds of this is located in intermediate waters between 25 and 40m deep. The overall energy yields are quite similar between all technology groups.

Quantification of Exploitable Tidal Energy Resources in UK Waters
R/3671/4 (iv) R.1349
It is stressed that the predicted annual energy yield of 94TWh/y assumes that all potentially suitable areas of UK waters up to 40m deep, that are free from existing exclusion constraints, are developed for tidal technology deployment. However, with present technologies this would require approximately 200,000 devices to be deployed across over 11,000km². These results are therefore presented as a reference to the technically achievable maximum energy yield, should political, economic, and grid connection issues allow all areas of good tidal resource to be developed for energy extraction.
Exploitable Tidal Energy Resource (Next 5-10 years)
The actual extent of tidal technology deployment over the next 5-10 years will depend on many technological, economic and political factors. These will include the establishment of a robust supply chain and appropriate legislation to support the tidal industry. In order to quantify the likely exploitable resource in the next 5-10 years, the 50 of best tidal data cells of resource have been identified and are summarised in the table below.
Location Number of Cells
Area (km2)
No. of Devices
Deployed
Installed Capacity
(MW)
Annual Energy Yield
(GWh/y)
Potential No. of
Devices Deployed
Potential Capacity
(MW)
Potential AEY
(GWh/Y)
Alderney Race 22 63 204 660 1,937 1,483 5,201 15,145 West Islay 7 21 112 210 584 465 896 2,460 South Pentland Firth 6 16 61 180 555 335 1135 3,444 Anglesey 3 9 47 90 238 170 341 873 Ramsay Island 2 6 35 60 183 119 210 631 North Pentland Firth 2 5 17 60 181 103 377 1,150 SW Islay 2 6 30 60 179 131 261 773 Westray Firth 2 5 13 60 177 123 571 1,674 Pentland Skerries 2 5 20 60 162 104 312 843 South Isle of Wight 2 6 30 60 161 125 249 663 Total 50 143 569 1,500 4,356 3,157 9,553 27,656
The top 50 cells of tidal resource fall within 10 distinct geographic areas. It is predicted that that the deployment of 569 devices are arranged into 30MW farms, totalling an installed capacity of 1,500MW, has the potential to generate over 4.3TWh/y of energy at these sites. This prediction assumes a 100% uptime of all tidal deployed devices and will therefore be slightly reduced in true operating conditions due to turbine down-time for planned and unplanned maintenance. It has also been calculated that if the 30MW limit on tidal farm size is removed from the analysis these areas have the potential to produce over 27TWh/y of energy, through the deployment of over 3,000 devices creating a total installed capacity of around 9,500MW. This calculation still assumes a maximum turbine rating of between 1.5-5.0MW. It is acknowledged that the cumulative effects on energy removal by successive 30MW rated arrays in areas confined areas of tidal resource, and also grid connection issues, may provide a potential barrier to the deployment of such large capacities. However, it is also possible that future technology developments, creating higher capacity turbines, may enable the predicted energy yields to being realised.

Quantification of Exploitable Tidal Energy Resources in UK Waters
Recommendations The methodology developed in this project provides comprehensive regional analysis of potential tidal energy resources and it is suggest that additional work on two specific enhancements would add considerable benefit to the results presented in this report: Refine results using more specific technology parameters; and Investigation into specific sites of identified tidal resource.
R/3671/4 (v) R.1349

Quantification of Exploitable Tidal Energy Resources in UK Waters
R/3671/4 (vi) R.1349
Acknowledgements The research presented in this report would not have been possible without good quality contemporary information regarding technical specification, present status, and predicted future evolution of tidal technologies in the next 5-10 years. The project team would like to thank the following individuals who have provided valuable information to the project. Michael Todman (TidalStream Partnership); John Hassard (HydroVenturi); Professor A S Bahaj and Dr William M.J. Batten
(The Sustainable Energy Research Group, Southampton University); Hervé Majastre (Hydrohelix Energies); Glen B. Darou (Clean Current Power Systems Incorporated); George Gibberd (Tidal Generation); Marc Paish (Pulse Generation); Alan Owen (The Robert Gordon University, Aberdeen); James Orme (Swanturbines); and Peter C. Scheijgrond (Ecofys).
The project team would also like to thank the Sustainable Development Commission for providing access to a draft version of their ‘UK Tidal Resource Review’ project output.

Quantification of Exploitable Tidal Energy Resources in UK Waters
R/3671/4 (vii) R.1349
Glossary and Abbreviations ABPmer ABP Marine Environmental Research Ltd AC Alternating Current Active Area Part of the tidal device that directly interacts with the water currents
e.g. turbine blade or hydrofoil AOI Area of Interest (areas where tidal currents and water depth are
suitable for the deployment of at least one tidal device) BWEA British Wind Energy Association CCGT Combined Cycle Gas Turbine CCW Countryside Council for Wales CEFAS Centre for Environment, Fisheries and Aquaculture Science DTi Department of Trade and Industry EC European Community Exceedance The percentage of time that a tidal current flow speed exceeds a
specified speed. Generator A machine that converts one form of energy into another, particularly
mechanical energy into electrical energy. GIS Geographical Information System GW Gigawatt (1,000,000,000 watts, 1,000 megawatts) GWh/y Gigawatt - hours per year HRCS High Resolution Continental Shelf numerical model produced by POL Hodograph A diagram giving a vectorial representation of the movement of a body
or a fluid. The position of any plotted data on such a diagram is proportional to the velocity of the moving particle. It is also called a velocity diagram, and shows the elliptical form of the tide.
HVDC High Voltage Direct Current kg/m³ Kilograms per metre cubed km Kilometre LAT Lowest Astronomical Tide LECs Levy Exemption Certificates m/s Metres per Second M2 Component of the tide that describes the forces derived from one
semi-diurnal component of the gravitational field of the moon MAGIC Multi-Agency Geographic Information for the Countryside

Quantification of Exploitable Tidal Energy Resources in UK Waters
R/3671/4 (viii) R.1349
MOD Ministry of Defence MLW Mean Low Water MNPC Mean Neap Peak Currents MNR Marine Nature Reserves MSP Marine Spatial Planning MSPC Mean Spring Peak Currents MW Megawatt (1,000,000 watts) Nm Nautical mile (1.852km or 0.998383 geographic miles) O&M Operation and Maintenance POL Proudman Oceanographic Laboratory ROCs Renewable Obligation Certificates ROVs Remotely Operated Vehicles RYA Royal Yachting Association S2 Component of the tide that describes the forces derived from one
semi-diurnal component of the gravitational field of the sun SAC Special Area of Conservation SD Standard Deviation SEA Strategic Environmental Assessment SEPA Scottish Environment Protection Agency SIF Significant Impact Factor SPA Special Protection Area SSSI Sites of Special Scientific Interest Tidal Cycle The variation of ambient water depth and velocity as a function of time
occurring due to tidal (lunar and solar) influences. One tidal period, the duration of the tidal cycle, is typically 12 hours and 25 minutes.
TW Terrawatt (1,000,000,000,000 watts, 1,000,000 megawatts, 1,000 gigawatts)
TWh/y Terra-watt-hours per year UK United Kingdom UKCS UK Continental Shelf VSC Voltage Source Converters W Watt electrical (W) is a term that refers to power produced as
electricity. SI prefixes can be used, for example megawatt electrical (MW).

Quantification of Exploitable Tidal Energy Resources in UK Waters
R/3671/4 (ix) R.1349
Quantification of Exploitable Tidal Energy Resources in UK Waters Contents
Page Summary ..................................................................................................................................... i Acknowledgements ................................................................................................................... vi Glossary and Abbreviations...................................................................................................... vii
1. Introduction....................................................................................................................1 1.1 Objective ......................................................................................................................1 1.2 Background ..................................................................................................................2 1.3 Summary of Existing Research ....................................................................................2
1.3.1 UK Atlas of Offshore Renewable Energy Resources.....................................2 1.3.2 Phase II UK Tidal Stream Energy Resource Assessment .............................3 1.3.3 Variability of UK Marine Resources ...............................................................3 1.3.4 Potential Impacts of Marine Energy Developments in Welsh Waters ............3 1.3.5 Wales Marine Energy Site Selection..............................................................3 1.3.6 The Path to Power .........................................................................................4 1.3.7 Potential Impacts of Wave and Tidal Energy Extraction by Marine
Renewable Developments .............................................................................4 1.3.8 Scottish Marine Renewable Strategic Environmental Assessment................5 1.3.9 UK Tidal Resource Review ............................................................................5 1.3.10 SuperGen Marine Consortium .......................................................................5
2. Existing Tidal Technologies ...........................................................................................6 2.1 Device Types ...............................................................................................................6 2.2 Grouping of Devices.....................................................................................................6 2.3 Assumptions.................................................................................................................8
3. Technical Device Constraints ........................................................................................8 3.1 Tidal Currents...............................................................................................................8 3.2 Depth..........................................................................................................................10 3.3 Eccentricity of Tidal Flows..........................................................................................12
4. Areas of Interest (AOI) Physically Suitable for Technology Deployment .....................15 4.1 Methodology for Deriving the AOI ..............................................................................15 4.2 Locations Physically Suitable for Tidal Technology Deployment ...............................16
5. Marine Spatial Planning (MSP) constraints .................................................................18 5.1 Exclusion Activities.....................................................................................................19

Quantification of Exploitable Tidal Energy Resources in UK Waters
R/3671/4 (x) R.1349
5.1.1 Reasons for Exclusion .................................................................................19 5.1.2 Effects of Exclusions on the AOI..................................................................20 5.1.3 Spatial Distribution of Exclusion Constraints................................................22 5.1.4 Effects of Exclusion Constraints on Technology Group Areas.....................23
5.2 Co-existing Activities ..................................................................................................24 5.2.1 Potential Conflicts Resulting from Co-existing Activities ..............................24 5.2.2 Location of Co-existing Constraints .............................................................26
6. Energy Yield ................................................................................................................29 6.1 Energy Equation.........................................................................................................30 6.2 Device Size ................................................................................................................31
6.2.1 Vertical Constraints......................................................................................32 6.2.2 Device Size Calculation ...............................................................................33 6.2.3 Active Area ..................................................................................................35
6.3 Turbine Rating............................................................................................................36 6.4 Tidal Farm Arrays and Deployment Densities............................................................38
6.4.1 Lateral Spacing............................................................................................38 6.4.2 Longitudinal Spacing....................................................................................38 6.4.3 Tidal Farm Size and Capacity......................................................................40
6.5 Tidal Farm Capacity ...................................................................................................40 6.6 Technically Extractable Tidal Energy .........................................................................44
6.6.1 Comparison with Existing Research ............................................................45 6.7 Exploitable Tidal Energy Resource (next 5-10 years) ................................................46
7. Other Considerations...................................................................................................47 7.1 Electricity Grid Connection.........................................................................................47
7.1.1 Distance to Electrical Grid Infrastructure......................................................48 7.1.2 Maximum Cable Depth ................................................................................49 7.1.3 Grid Access Capacity...................................................................................49
7.2 Support Structure .......................................................................................................50 7.3 Engineering Challenges .............................................................................................51 7.4 Wave Climate.............................................................................................................52 7.5 Seabed Sediments and Geology................................................................................52 7.6 Maintenance...............................................................................................................53 7.7 Markets/Economics....................................................................................................53
8. Conclusions .................................................................................................................57 8.1 Device Groups and Areas Physically Suitable for Technology Deployment ..............57 8.2 MSP Constraints ........................................................................................................59 8.3 Potential Energy Yields ..............................................................................................59 8.4 Other Considerations .................................................................................................61
9. Recommendations.......................................................................................................61 9.1 Refine Results Using More Specific Technology Parameters ....................................61 9.2 Further Investigation into Specific Sites of Identified Tidal Resource.........................62
10. References ..................................................................................................................62 10.1 Online References .....................................................................................................65

Quantification of Exploitable Tidal Energy Resources in UK Waters
R/3671/4 (xi) R.1349
Appendices A. Devices Considered in the Study B. Assumptions and Constants Applied C. Methodology for Estimating the Rated Device Speed and Power for a Site D. Top Fifty Sites of Tidal Resource in the UK Tables 1. Depth statistics for the study AOI ................................................................................12 2. Selection criteria applied for each device group ..........................................................15 3. Areas suitable for technology deployment ...................................................................16 4. Potential technology deployment areas based on primary physical constraints ..........18 5. Exclusion constraints...................................................................................................21 6a. Areas excluded in shallow water for each device group ..............................................23 6b. Areas excluded in intermediate water for each device group ......................................23 6c. Areas excluded in deep water for each device group ..................................................23 6d. Areas excluded in all water depths for each device group...........................................24 7. Potential uses and users that could co-exist with tidal technologies............................24 8. Definitions of the active area for each device group ....................................................31 9. Active areas for each device group .............................................................................35 10. Power rating (MW) for devices based on MSPC and depth.........................................38 11. Potentially installed capacity........................................................................................41 12. Predicted annual energy yield .....................................................................................44 13. Summary of best sites of UK tidal resource.................................................................46

Quantification of Exploitable Tidal Energy Resources in UK Waters
R/3671/4 (xii) R.1349
Figures 1. Percentage of devices in each device group .................................................................7 2. Idealised vertical flow profile for a smooth seabed ...................................................... 11 3. Bi-directional hodograph (eccentricity = 0.995) ........................................................... 13 4. Multi-directional hodograph (eccentricity = 0.25) ......................................................... 13 5. Eccentricity of tidal ellipses in the AOI plotted against MSPC ..................................... 14 6. Example of tidal current speeds at 30-minute intervals for 30 days............................. 30 7. Vertical constraints on available water column for tidal devices .................................. 32 8. A comparison of predicted active areas with depth ..................................................... 36 9. Effect of turbine power rating on output ....................................................................... 37 10. Theoretical turbine deployment densities when lateral and longitudinal spacing
rules are applied .......................................................................................................... 39 11. Comparison between the active area for a horizontal-axis (Groups A, B, and E)
and vertical-axis (Group C) device .............................................................................. 42 12. Support structure concepts.......................................................................................... 51 13. Cost of generating electricity (per kWh) with no cost of CO2 emissions included ........ 54 14. Estimated costs of energy today.................................................................................. 55 15. UK tidal stream cost-resource curves.......................................................................... 55 16. Summary of best estimates of unit cost evolution........................................................ 56 GIS Figures (Bound Separately - Volume 2) 1. Study Area and Regional Sub-Areas 2. Tidal Model Scales 3. Peak Flow for a Mean Spring Tide - North 4. Peak Flow for a Mean Spring Tide - East 5. Peak Flow for a Mean Spring Tide - South 6. Peak Flow for a Mean Spring Tide - West 7. Area of Interest (AOI) Suitable for the Deployment of at Least 1 Tidal Technology Type
- North 8. Area of Interest (AOI) Suitable for the Deployment of at Least 1 Tidal Technology Type
- East

Quantification of Exploitable Tidal Energy Resources in UK Waters
R/3671/4 (xiii) R.1349
9. Area of Interest (AOI) Suitable for the Deployment of at Least 1 Tidal Technology Type - South
10. Area of Interest (AOI) Suitable for the Deployment of at Least 1 Tidal Technology Type - West
11. Bathymetry - North 12. Bathymetry - East 13. Bathymetry - South 14. Bathymetry - West 15. Depth Zones - North 16. Depth Zones - East 17. Depth Zones - South 18. Depth Zones - West 19. Areas Physically Suitable for the Deployment of Devices in Group A - Horizontal axial
flow (bi-direction) 20. Areas Physically Suitable for the Deployment of Devices in Group B - Horizontal axial
flow (multi-direction) 21. Areas Physically Suitable for the Deployment of Devices in Group C - Vertical Axis 22. Areas Physically Suitable for the Deployment of Devices in Group D - Oscillating
Hydrofoil 23. Areas Physically Suitable for the Deployment of Devices in Group E - Air Injection
technology 24. Areas Physically Suitable for the Deployment of All Devices (Groups A - E) 25. Areas Excluded - North 26. MSP Exclusion Constraints: Activities - North 27. MSP Exclusion MSP Constraints: Installations - North 28. MSP Exclusion Constraints: Obstructions - North 29. Areas Excluded - East 30. MSP Exclusion Constraints: Activities - East 31. MSP Exclusion Constraints: Installations - East 32. MSP Exclusion Constraints: Obstructions - East 33. Areas Excluded - South 34. MSP Exclusion Constraints: Activities - South 35. MSP Exclusion Constraints: Installations - South 36. MSP Exclusion Constraints: Obstructions - South 37. Areas Excluded - West

Quantification of Exploitable Tidal Energy Resources in UK Waters
R/3671/4 (xiv) R.1349
38. MSP Exclusion Constraints: Activities - West 39. MSP Exclusion Constraints: Installations - West 40. MSP Exclusion Constraints: Obstructions - West 41. MSP Co-existing Constraints: Biology - North 42. MSP Co-existing Constraints: Biology - East 43. MSP Co-existing Constraints: Biology - South 44. MSP Co-existing Constraints: Biology - West 45. MSP Co-existing Constraints: Military - North 46. MSP Co-existing Constraints: Military - East 47. MSP Co-existing Constraints: Military - South 48. MSP Co-existing Constraints: Military - West 49. MSP Co-existing Constraints: Navigation and Energy Resources - North 50. MSP Co-existing Constraints: Navigation and Energy Resources - East 51. MSP Co-existing Constraints: Navigation and Energy Resources - South 52. MSP Co-existing Constraints: Navigation and Energy Resources - West 53. MSP Co-existing Constraints: Environmental Designations - North 54. MSP Co-existing Constraints: Environmental Designations - East 55. MSP Co-existing Constraints: Environmental Designations - South 56. MSP Co-existing Constraints: Environmental Designations - West 57. MSP Co-existing Constraints: Recreation - North 58. MSP Co-existing Constraints: Recreation - East 59. MSP Co-existing Constraints: Recreation - South 60. MSP Co-existing Constraints: Recreation - West 61. Potential Deployment Capacity per square km - Groups A, B and E 62. Potential Deployment Capacity per square km - Group C 63. Potential Deployment Capacity per square km - Group D 64. Best Sites of UK Tidal Resource 65. Great Britain Electricity Transmission Network

Quantification of Exploitable Tidal Energy Resources in UK Waters
R/3671/4 1 R.1349
1. Introduction
1.1 Objective The npower juice fund was created in 2003 and is aimed at supporting new renewable technologies, focusing on wave and tidal stream developments. In autumn 2006, ABP Marine Environmental Research Ltd (ABPmer) was awarded funding from npower juice to help quantify the exploitable tidal energy resources within UK waters. Tidal flows are a regular quantifiable resource primarily created by gravitational forces exerted on water bodies by the moon and sun. Tidal stream energy converters, or ‘technologies’ operate in free flowing tidal waters and extract energy from water currents, which is converted to electricity. At the time of this project, tidal technologies are at various stages of development with approximately 36 converters being researched worldwide. The design of each tidal device varies, creating a range of suitable tidal currents and operating depths for each technology group. Many areas within UK waters have conditions that are suitable to support tidal technologies however, these sites are often subject to constraints and pressures resulting from other marine activities. This study has incorporated many of these primary constraints investigate the potential exploitable tidal resource within the UK waters by addressing the following objectives: Map areas that are physically suitable for the deployment of different types of
tidal technology; Research potential Marine Spatial Planning constraints occurring from
coinciding activities; Calculate potential tidal energy yield; Investigate other potential issues associated with device deployment.
All of the project datasets were compiled into a Geographical Information System (GIS) which includes powerful spatial analysis tools. The GIS and associated spatial database were utilised to identify areas of suitable tidal resource where the physical water depth, proximity to land, and tidal current conditions are suitable for the deployment of tidal technologies. These areas have been assessed against a multitude of Marine Spatial Planning (MSP) constraints to review areas where existing activities may complicate the deployment of devices. The project has also calculated the likely tidal energy yields that may be achieved from tidal technologies and considered the economic factors that may influence whether marginal areas of resource become more or less exploitable in the future. The research has adopted a standardised approach for the entire UK Continental Shelf (UKCS) study area (GIS Figure 1) and therefore provides a consistent regional analysis and representation of exploitable tidal resources. Several parts of the

Quantification of Exploitable Tidal Energy Resources in UK Waters
R/3671/4 2 R.1349
research have been reported by regional sub-areas, also shown on GIS Figure 1. The research has focused on tidal stream technologies that are developing towards commercial deployment within approximately 5-10 years (2012-2017) and does not consider tidal barrage technology.
1.2 Background This project builds upon existing research that has been undertaken by ABPmer and other parties. Research presented by the DTi Atlas of UK Marine Renewable Energy Resource and the Carbon Trust Marine Energy Challenge provides a good quantification of tidal energy resources within the UKCS. However, these studies do not consider potential constraints for technology deployment. Other studies such as the Scottish Marine Renewables Strategic Environmental Assessment (SEA) and the Wales Marine Energy Site Selection have investigated the potential constraints for deployment of technology in local areas of tidal resource. Previous juice funded research, Path to Power, has investigated the electricity grid connectivity and legal issues related to wave and tidal technology deployment and also consulted a range of potential stakeholders about other anticipated issues associated with developing commercial scale projects. Further studies have documented emerging tidal technologies or investigated potential nature impacts from deployment. Despite recent growth of research in this sector, the present study represents the first comprehensive investigation into exploitable tidal resources within the entire UKCS which incorporates information about technology requirements and potential Marine Spatial Planning (MSP) constraints. The research has been supplemented with information regarding the potential energy yields from different technology groups and also investigates other potential deployment constraints. A summary of key existing research is presented below.
1.3 Summary of Existing Research
1.3.1 UK Atlas of Offshore Renewable Energy Resources This project was led by ABPmer on behalf of the Department of Trade and Industry (DTi) and aimed to provide, for the first time a detailed description of the offshore wind, wave and tidal energy resources across the UK continental shelf. The tidal data for the project was provided by the newly developed Proudman Oceanographic Laboratory (POL) High Resolution Continental Shelf (HRCS) numerical model which described the tidal resource at a consistent resolution of 1nm (nautical mile) (approximately 1.8km). The Atlas provides a good consistent description of the tidal resource, however, does not consider the potential constraints for technology deployment. The Atlas is still considered as the primary resource for identifying offshore renewable resources at a regional scale (ABPmer, 2004).

Quantification of Exploitable Tidal Energy Resources in UK Waters
R/3671/4 3 R.1349
1.3.2 Phase II UK Tidal Stream Energy Resource Assessment This study was undertaken as part of the Marine Energy Challenge funded by the Carbon Trust and undertaken by Black & Veatch. It followed a Phase I report (Black & Veatch, 2004) which introduced the Farm, and the preferred Flux method of calculating the potential energy available from UK tidal resources. The Flux method includes a Significant Impact Factor (SIF), which represents the total extractable energy from a given site, and was applied as a 20% constant in the Phase 1 study. The Phase II study refined the SIF calculation, classifying five different types of tidal resource site, and investigated the ten most important UK tidal resource sites representing an estimated 80% of the technically extractable resource. Calculations were based on data from the DTI Renewable Atlas, Admiralty Charts and other tidal stream atlases. The research concluded that the total UK extractable resource is around 18TWh/y. When analysed by depth the work reported that 4.4% of exploitable tidal resource is located in shallow waters (<25m), 32.4% in intermediate waters (25-40m) and the remaining 63.2% in deep water (>40m) (Black & Veatch, 2005).
1.3.3 Variability of UK Marine Resources This Carbon Trust funded research utilised DTI Renewable Atlas data supplemented with Admiralty Tidal Atlas data to characterise tidal resource at 36 locations around the UK. In the methodology for power calculations, the report details several assumptions which include a device cut-in velocity of 1m/s, efficiency at 45% and a rated velocity at 70% of the Mean Spring Peak Current (MSPC) speed. The project outputs are focused towards the temporal variability in generated energy peaks compared with electricity demand, however, it also includes a site-by-site prediction of energy yields. The research estimates that 3GW of wave and tidal stream capacity could be installed by the year 2020 (Environmental Change Institute, 2005).
1.3.4 Potential Impacts of Marine Energy Developments in Welsh Waters This study was funded by the Countryside Council for Wales (CCW) and investigated the potential nature conservation impacts of marine renewable energy developments in Welsh territorial waters. For tidal stream technologies the project identified potential sites for deployments using information from 21 potential devices. The work highlighted potential nature conservation issues that are present within Welsh territorial waters and assessed the magnitude of potential change to nature conservation and landscape interests resulting from each technology type (ABPmer, 2005).
1.3.5 Wales Marine Energy Site Selection This study was funded by the Welsh Development Agency and built upon the CCW investigation into potential impacts of marine renewables. The project investigated the practicable offshore wind, wave and tidal energy resources around the Welsh coast. For tidal energy the study considered three device types for the potential deployment in

Quantification of Exploitable Tidal Energy Resources in UK Waters
R/3671/4 4 R.1349
shallow (<30m LAT) and deep (>30m LAT) waters from Mean Low Water (MLW) to the 12nm limit. The work utilised DTI Atlas tidal data to calculate the potential areas of tidal resource and also considered a series of potential constraints to deployment including grid connection, environmental designations, Ministry of Defence, other sea uses and other users of the sea. The work concluded that there are two potential sites suitable for shallow water devices at Pembrokeshire (1.4km², 110MW) and in the Bristol Channel (10km² and 800mW). For deep water the study highlighted three suitable locations at Anglesey (176km², 14,080MW), Pembrokeshire (0.6km², 40MW), and in the Bristol Channel (8km², 640MW) (Project Management Support Services, 2006).
1.3.6 The Path to Power This three stage study was commissioned by the British Wind Energy Association (BWEA) and npower juice in response to the growing need for the UK Government to commit support to wave and tidal stream industry. The study sourced of information from over 100 interviews to investigate the legal and regulatory requirements, stakeholder views on deployment and potential issues associated with electricity grid network access. The project reported a series of general concerns that stakeholders had regarding the tidal technologies and these where grouped as environmental, navigation and safety, fishing, and ‘other’ which includes military, marine aggregates, oil and gas, recreation and marine archaeology (ABPmer, 2006b, Bond Pearce, 2006, Climate Change Capital, 2006). The research defined several scales of tidal energy projects, from prototypes which have up to 1MW of installed capacity, small arrays (up to 5MW), large arrays (up to 30MW) and significant projects which will have over 30MW of installed capacity. It was also suggested that only prototypes and small arrays will be installed up to 2010 with large arrays being deployed in around 2010-2012. Significant projects will be achieved from 2012 onwards, assuming the improvement in the electricity grid connection in northern England and Scotland at around 2015. The study predicted that long-term tidal energy has the potential to contribute 3-5% of UK electricity demand. The report also identified three distinct hurdles for the sector, with a hierarchy of importance: Financing; Grid access; and Planning and permitting.
1.3.7 Potential Impacts of Wave and Tidal Energy Extraction by Marine Renewable
Developments This project was funded by CCW and the Crown Estate and built upon the earlier investigation CCW into potential impacts of marine energy developments (ABPmer, 2005). The work reviewed the likely levels of energy extraction by wave and tidal

Quantification of Exploitable Tidal Energy Resources in UK Waters
R/3671/4 5 R.1349
devices in Welsh Territorial Waters and documented the possible nature and extent of environmental impacts. Consultation was undertaken with five tidal developers who were at the relatively advanced development stage, undertaking pre-commercial demonstration. The project predicted the likely deployment locations for four different types of tidal energy converters in both shallow and deep water locations, however it did not attempt to calculate actual energy yields. The report considers likely environmental effects and suggests the level and type of data that are likely to be required for wet marine renewable developments (ABPmer, 2006a).
1.3.8 Scottish Marine Renewable Strategic Environmental Assessment This project was funded by the Scottish Executive and investigated the potential environmental effects of developing wave and tidal devices off of the West and North coasts of Scotland. The effects on a wide range of environmental parameters are considered in general locations for tidal technology deployment within the study area. The project concludes that it may be possible for Scotland to meet the Scottish Marine Energy Group estimate of 10% of electricity generation from wave and tidal stream power, however there is a further need for site specific studies and that site location and device design are likely to provide the largest impacts on environmental effects (Faber Munsell & Metoc, 2007).
1.3.9 UK Tidal Resource Review This project was commissioned by the Sustainable Development Commission (SDC) and provides a review of the tidal energy resource in the UK as well as grid connection, policy issues and sea level change. The research draws together and compares existing available information, such as the DTi Renewable Atlas, and has not undertaken any new analysis or development. For tidal energy resources the report highlights good areas of tidal stream resource and the importance of good high-resolution data for site specific tidal resource assessments (Metoc, 2007).
1.3.10 SuperGen Marine Consortium The SuperGen Marine Energy Consortium includes five academic partners and is funded Engineering and Physical Sciences Research Council (EPSRC). The research aims to increase knowledge and understanding of the extraction of energy from the sea to reduce investment risk and uncertainty. It is anticipated that this will increase confidence for future stakeholders in the development and deployment of the technology that will convert and deliver marine energy to the market. The vision of the consortium is that methodologies will be established to progress new concepts and devices so that marine energy will, as soon as possible, occupy its appropriate position in the future energy portfolio. The key areas of work are modelling, testing, guidance economics, and outreach (SuperGen Marine Energy Consortium Website (April 2007).

Quantification of Exploitable Tidal Energy Resources in UK Waters
R/3671/4 6 R.1349
2. Existing Tidal Technologies
2.1 Device Types The scope of this study includes the consideration of technologies that are working towards a commercial implementation in approximately 5-10 years time. Due to the nature of the study, several items of data were required from each technology and the work has considered a range of devices where good information was available regarding preferred operating depths, tidal flows, energy outputs, performance, and construction. A comprehensive list of tidal stream devices was created by collating research from previous studies, journals and other industry publications, Internet searches and the existing knowledge of the project team. The full list of the devices used to complete the study is given in Appendix A. Information on each device was collected to capture the following key design elements enabling resource quantification to be completed: Development design stage (concept, scaled model laboratory tested, scaled
prototype marine tested, etc.); Minimum and maximum operational water depth; Minimum current flow required to generate electricity; Generation capacity (MW); and Directional flow capability (bi- or multi-directional).
Other available information such as prototype trial results, installation details, and planned activities, were also captured for general reference to support the study.
2.2 Grouping of Devices The global development of tidal stream electricity generators is still in its infancy with only solitary scaled versions currently being tested in marine environments to date. The offshore wind sector also went through a similar process of concept testing prior to the emergence of a single technology type. Wave renewable energy technologies are also currently undergoing a process of many different concepts being proposed, designed, and tested. This report makes reference to generic tidal device groups, as first defined in the CCW investigation into potential nature conversation and landscape impacts of marine renewable energy development in Welsh Territorial Waters (ABPmer, 2005). This approach was adopted to avoid commenting on individual devices, and to instead report on the general strengths for each key device types. It also enabled general technology analysis to be undertaken using a range of operating specifications within each group. From the 21 devices used for this study (Appendix A), five distinct device groups have been defined, as below:

Quantification of Exploitable Tidal Energy Resources in UK Waters
R/3671/4 7 R.1349
Group A Horizontal Axial-flow (single or bi-directional directional)
turbines (fixed turbine direction); Group B Horizontal Axial-flow multiple direction (yawing) turbines. This
type of turbine can rotate according to the direction of the tidal flow direction;
Group C Vertical Axis (cross-flow turbines). These turbines rotate regardless of the flow direction;
Group D Oscillating Hydrofoil; and Group E Air Injection technology (hydraulic).
Most devices (around 90%, see Figure 1) fall within Groups A, B or C which are based on either horizontal or vertical-axis rotors. Some horizontal-axis devices have flow enhancers, in the form of ducts, which increase pressure and flow speeds by taking the flow from a larger area and funnel it into a smaller rotor.
Figure 1. Percentage of devices in each device group There are some generators (10% of the sample) that work on fundamentally different principles. Half of these use an oscillating hydrofoil type while the half remaining utilise air injection technology which runs a conventional turbine on the pressure drop generated by a constriction in the flow.

Quantification of Exploitable Tidal Energy Resources in UK Waters
R/3671/4 8 R.1349
2.3 Assumptions Within each technology group there are still a wide range of potential designs being considered and therefore it has been necessary to work with average device specifications when undertaking analysis within the project. When defining the potential locations for technology deployment this study has selected areas based on preferred current speed and depth required by individual technologies thus providing an accurate deployment prediction without commenting on specific devices. The precise variation in the effects of each technology type on other marine uses and users are currently unknown, therefore all technologies have been assumed to have the same general effects for the purpose of Marine Spatial Planning (MSP) constraint analysis in this report. Energy calculations have been undertaken for each device group, however, as the majority of the technologies remain untested in the marine environment this required several assumptions to be made. A full description of all assumptions and constants used in this study can be found in Appendix B. The assumptions made in this project are based on the best available information sourced from current research and consultation with various developers. Together this provides a good baseline of relevant information for a regional study and offers a robust method for general site selection, constraint analysis, and calculation of potential energy yield, which can be reapplied for individual technologies when more precise input parameters are available.
3. Technical Device Constraints The technical specification of devices govern how they interact with the marine environment and several parameters will influence potential areas that physically suitable for the technology deployment. For this study three primary factors have been considered: Tidal Currents; Depth; and Eccentricity of tidal flows.
These parameters have been investigated for each technology type and analysed in the GIS to identify areas that are suitable for technology deployment.
3.1 Tidal Currents The minimum current speed at which a device can produce useful amounts of electricity is the key constraint which limits the potential location for siting tidal devices. The research undertaken for this report has shown that several developers presently

Quantification of Exploitable Tidal Energy Resources in UK Waters
R/3671/4 9 R.1349
claim to be able to extract commercially viable energy at 1.5m/s, with one developer claiming to be able to generate electricity from a flow speed of 1.0m/s, however this device has not been included in the study due to lack of other relevant information. It is important to clarify that these are ‘cut-in’ velocities, where the generator will start to produce commercially viable electricity, which will increase up to the rated velocity of the device e.g. a device might be rated to produce 1MW when the flow speed is 2.7m/s or greater. Maximum flow rates are not commonly stated by developers, however, excessive flow rates will pose engineering challenges for ensuring a stable mounting in relation to the hydrodynamic forces imparted onto the structure and it’s moorings. Another high flow speed consideration is that the rotor should be designed for a maximum tip speed of 10m/s or less to keep the tips clear of cavitation (Section 7.2). Two main parameters of tidal current data have been utilised in the study to define the tidal resource, namely, MSPC, and annual tidal current flows. These parameters have been analysed across the entire UKCS study area to identify areas that are physically suitable for tidal technology deployment and calculate potential energy yields. The tidal datasets utilised in the project have been derived from the DTi UK Atlas of Offshore Renewable Energy and supplemented with additional hydrodynamic modelling results from the Mersey, Humber and Bristol Channel which have been made available by ABPmer. The Atlas data is supplied at a scale of 1nm which is approximately 1.8km. The ABPmer model output has been included at a scale of 40m for the Mersey, 150m for the Humber, and 900m for the Bristol Channel, as seen in GIS Figure 2. When combined, this data adds over 70,000 additional cells of information into the tidal database (240,000 cells) utilised within the project. This represents a significant improvement in core resolution for these areas, and provides new information about tidal resources in nearshore locations that were previously unresolved. The MSPC values were derived by adding the M2 and S2 components of the tide in each data cell. This approach was originally adopted for the DTi Atlas, and in order to maintain consistency, was applied to all other ABPmer modelling outputs that were incorporated into the project. GIS Figures 3-6 show the MSPC for the north, east, south and west regions of the study area and it can be seen that the tidal resource is often highly localised. Several areas in the north region have a reasonable tidal resource with the southern Shetland Islands, Fair Isle, and the Isle of Skye all subject to MSPC speeds of up to 2.5m/s. Notable hotspots of high MSPC occur in the region around the Orkney Islands and in Pentland Firth where speeds can exceed 5m/s. In comparison tidal currents in the east area are significantly lower, with the largest MSPC in the order of 2-3m/s located in the outer Humber, and around the Norfolk and Dover coastlines.

Quantification of Exploitable Tidal Energy Resources in UK Waters
R/3671/4 10 R.1349
Another hotspot of high currents is located in the south region to the east of Alderney where the MPSC speeds again exceed 5m/s. It is also noted that the pattern of this area of resource suggests that there is likely to be a significant current resource in adjacent French waters. Other southern areas, including the remaining Channel Islands, Isle of Wight, Portland Bill and Ramsey Island experience MSPC speeds of 2.5-4m/s while reasonable tidal resource is also found in the Bristol Channel and with speeds up to 3m/s. In the west region the largest tidal resource is located around Islay where MSPC speeds of up to 4m/s are found. The North Channel, Mull of Galloway, Isle of Man, Mersey, Anglesey and Bardsay Island also all have a good tidal resource with MSPC speeds ranging from 2-3.5m/s. The majority of existing research, and information available from tidal technology developers, considers the tidal resource in terms of MSPC speeds. This provides a good representation of the peak tidal current velocities achieved during an average spring tide, however, does not consider a multitude of other tidal current parameters including the variability between the flood and ebb tidal flows, spring and neap tidal variation, half yearly equinox tidal levels or persistence of current flows. Within the project database additional information is available regarding the precise tidal flows throughout an average year. This is particularly useful data as it incorporates all of the flood and ebb tidal flows, 14-day spring neap cycle, and the half-yearly tidal variation resulting from the inclination of the moon’s orbit to provide a more refined description of the potential tidal resource. This information has been applied to calculate the potential energy yields from tidal technology in a greater level of detail than has previously been achieved in a complete study of UK waters.
3.2 Depth
Existing prototype tidal stream generators are typically poorly adapted to shallow flows, usually being designed for water at least 25m deep. This means that often they must be positioned some distance from the shore, and therefore must be engineered to cope with very heavy seas, which adds cost to potential developments. Three depth bandings have been adopted for this study and these have been created in-line with existing industry definitions, which are used throughout this report: Shallow water (depth 4-25m LAT); Intermediate (>25-40m LAT); and Deep water (>40-100m LAT).
Research has indicated that currently predicted operating depths for tidal devices range from 4 to 100m. Despite the tendency to develop intermediate and deep water devices, there are some systems that are ideally suited to exploit near-shore, shallow tidal flows. Shallow water flows are an ideal resource as they are close to the shore, and are often sheltered from heavy seas, which can lead to major cost reductions. Beyond 100m deep, it is likely that tidal flows will be reduced so that economic

Quantification of Exploitable Tidal Energy Resources in UK Waters
R/3671/4 11 R.1349
deployment of present technologies becomes unlikely due to increased installation and maintenance costs. It is also typical for current velocities to reduced in the lower water column due to friction effects induced by the bed. Therefore devices should not be placed so low in the water column that they suffer from reduction in energy production. A resource validation exercise including field measurements is required to understand the precise hydrodynamic characteristics of any proposed location and quantify water depths and loss of energy due to near-bed effects. Research into tidal technology deployments in Alderney has suggested that the lower 25% of the water column is unsuitable for the capture of energy by tidal generators (Bahaj & Myers, 2004). This is also supported in research published by CCW (ABPmer, 2006a) which suggests that the mid depth currents have the greatest likelihood of uniform flows (Figure 2).
0%
20%
40%
60%
80%
100%
0 0.2 0.4 0.6 0.8 1
Velocity / max Velocity
Dep
th /
max
Dep
th
Benthic boundary layer
Avoidance of surface waters(tidal range, waves, vessels)
Focus at mid-depths(minimal vertical shear)
Avoidance of benthic layer
(Source: ABPmer, 2006a)
Figure 2. Idealised vertical flow profile for a smooth seabed For this project it has been assumed that the blades or hydrofoils of any deployed tidal device will not encroach on the lower 25% of the water column. This also ensures that the devices will not disturb the low speed benthic boundary layer which may effect around 10% of the water column. The project has also ensured that tidal devices are not exposed at Lowest Astronomical Tide water levels, and a 3.5m water surface buffer has been applied to avoid small craft and interference from waves.

Quantification of Exploitable Tidal Energy Resources in UK Waters
R/3671/4 12 R.1349
The physical areas where tidal currents and depths are most suitable for tidal technology deployment have been calculated and defined as the project Area of Interest (AOI) as shown in GIS Figures 7-10 and the full calculation method is explained in Section 4. Water depth data for the study has been derived from the DTi Atlas and ABPmer model datasets, and therefore provides a consistent scale of analysis when compared to the tidal information. The water depth data for the UKCS is shown in GIS Figures 11-14. In most areas the AOI is constrained by the tidal resource rather than depth and this is true for all of the eastern and southern regions where the relatively gently sloping shallow continental shelf means that devices could potentially be deployed in all locations with suitable tidal resource without limitations posed by deep water. In the northern region the continental shelf deepens more rapidly however the highly localised areas of tidal resource are all located in areas that meet the depth constraints. In the west, areas of tidal resource in the North Channel are limited by deep water however all other locations are not effected by the depth constraints. The total AOI is 28,459km² and if the depth constraints were removed this would only increase by 1.5% to 28,870km². The three project depth zones are shown on GIS Figures 15-18 and associated areas presented in Table 1. This shows that approximately 28% of the study AOI is within the shallow depth zone, 26% is within the intermediate and just over 46% is in the deep zone. It can also be seen that the average MSPC speeds are very similar in all depth zones. The GIS Figures show that tidal resource from all depth zones is present in all parts of the AOI however that the largest areas of shallow and intermediate resource are found in the east and south zones while north and west zones have a higher proportion of deep tidal resource. Table 1. Depth statistics for the study AOI
Depth Zone Depth(m LAT) Area (km²) Area(% of AOI) Average MSPC Shallow 4-25 7754 27.8 1.89 Intermediate > 25-40 7168 25.7 1.90 Deep > 40-100 13011 46.5 1.91
3.3 Eccentricity of Tidal Flows Eccentricity refers to the shape of the tidal flow when presented on a hodograph or ‘tidal rose’ ellipse diagram. The direction of the current flow during a tidal cycle when observed at a single position, is typically bi-directional with the flood and ebb flows running 180° apart in opposite directions. This type of flow is represented by a flat hodograph and a rectilinear flow regime (Figure 3), and is typical for sites within a constrained channel such as an estuary. More open coastal waters are likely to experience flows from a wider range of directions, resulting in a more circular hodograph and rotary flow regime (Figure 4).

Quantification of Exploitable Tidal Energy Resources in UK Waters
R/3671/4 13 R.1349
Figure 3. Bi-directional hodograph
(eccentricity = 0.995) Figure 4. Multi-directional hodograph
(eccentricity = 0.25) Depending on the type of flow at a potential deployment location, the type of device selected will optimise the energy extracted. Bi-directional sites will favour fixed bi-directional horizontal axial-flow devices, whereas a multi-directional flow might suit a device that rotates or can accept flows from any direction. This is potentially of importance when selecting the type of device to deploy at a particular location. Eccentricity was investigated as part of this study to establish if different technology groups have a preference for particular areas of UK tidal resource. A tidal ellipse was calculated for each cell in the database utilising the information from the DTI Atlas and ABPmer models. The eccentricity (ε) of each ellipse derived using the following equation:
Where
ε = eccentricity a = M2 semi-major axis b = M2 semi-minor axis

Quantification of Exploitable Tidal Energy Resources in UK Waters
R/3671/4 14 R.1349
This formula was applied using the M2 semi-major axis and M2 semi-minor axis parameters. The eccentricity data ranges from 0 to 1 with a larger value resulting in a higher ratio of a to b which represents a more bi-directional tidal ellipse. Results showed that for the 15,386 data cells within the AOI the mean eccentricity was 0.995 representing bias towards highly a bi-directional ellipse. Within this dataset the minimum eccentricity was 0.684 with only 11 cells recording an eccentricity below 0.8. The eccentricity results have been plotted on Figure 5.
Figure 5. Eccentricity of tidal ellipses in the AOI plotted against MSPC This analysis provides evidence that within the UKCS almost all areas with a MSPC speeds greater than 1.5m/s are subject to highly bi-directional tidal flows. Therefore it is concluded that eccentricity should not be incorporated as part of the criteria for identifying sites that are suitable for tidal technology deployment at a regional scale, as this parameter has minimal variability in areas of good tidal resource located within UK waters. Existing research (DTI, 2007) suggests that some sites can have flow reversal of 20° or more away from 180° such as the flow around islands and headlands, for example Portland Bill where a flow reversal of around 35° from rectilinearity is present. It is suggested that if a yawing turbine, rather than a fixed turbine, was to be used at unusual sites such as Portland Bill an extra 10% of energy may be harnessed (DTI, 2007).

Quantification of Exploitable Tidal Energy Resources in UK Waters
R/3671/4 15 R.1349
4. Areas of Interest (AOI) Physically Suitable for Technology Deployment
4.1 Methodology for Deriving the AOI All project data was managed using a Geographical Information System (GIS) and associated spatial database, which include powerful spatial analysis tools. The AOI physically suitable for tidal technology deployment was identified using water depths at the Lowest Astronomical Tide (LAT), Mean Spring Peak Currents (MSPC), and proximity to land. The elliptical form of tidal flows was research as part of the project (Section 3.3), however, due to the dominance of bi-directional flows eccentricity was not included as part of the physical constraint criteria. The criteria used for each technology group are presented in Table 2. Table 2. Selection criteria applied for each device group
Depth (m LAT) Device Group Min Max* Min MSPC
(m/s) Distance to Land (km)**
A . Horizontal Axial-flow (bi-direction) 4 100 1.5 50 B. Horizontal Axial-flow (multi-direction) 5 100 2.0 50 C. Vertical Axis 6 100 1.5 50 D. Oscillating Hydrofoil 10 100 2.2 50 E. Air Injection technology 10 60 2.0 50 * 100m limit for installation and maintenance costs **limit for cable costs
Tidal currents are very important in determining areas suitable for technology deployment. Research has indicated that bi-directional horizontal axial-flow (Group A) and vertical axial flow (Group C) technologies have the lowest required operating currents, with suitable deployment locations from 1.5m/s (MSPC) upwards. Research has also found that multi-directional horizontal axial-flow (Group B) and air injection technologies (Group E) have the potential to be deployed in sites with MSPC speeds from 2m/s and oscillating hydrofoil devices (Group D) can be sited at location with MPSC speeds of 2.2m/s and above. In shallower areas water depth will limit the size of the technology that can be deployed. Deployments in water depths less than 10m are likely to be small scale supplying energy to local users. The maximum deployment depth constraint has been limited to 100m as it is the anticipated that extracting tidal energy from deeper water will be unviable due to a reduced resource and increasing costs. When this methodology was applied it was found that the primary factor in determining the AOI is the current speeds. All areas of suitable resource are located in areas that are less than 50km from land and therefore this constraint does not limit the location of potentially exploitable tidal resource. If the depth constraint is removed the total AOI
Quantification of Exploitable Tidal Energy Resources in UK Waters
R/3671/4 16 R.1349
only increased by 1.5%, therefore limitations of tidal current speeds are responsible for deriving over 98% of the area of the potential resource.
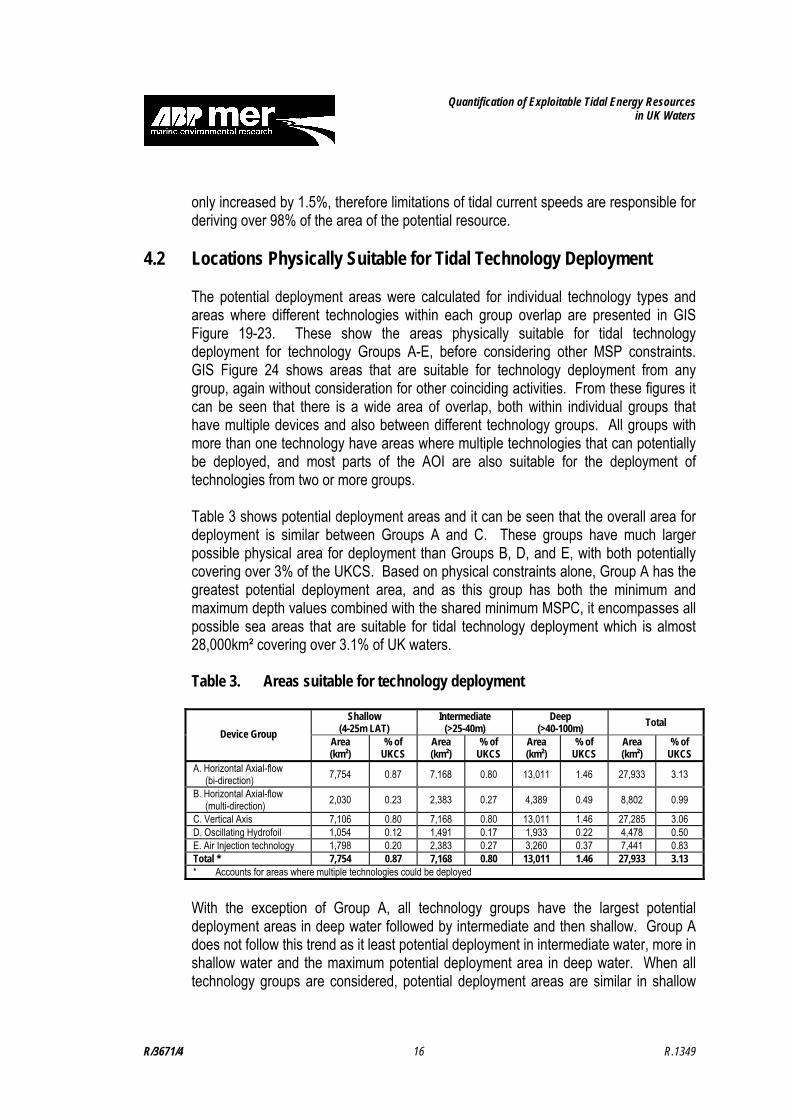
4.2 Locations Physically Suitable for Tidal Technology Deployment The potential deployment areas were calculated for individual technology types and areas where different technologies within each group overlap are presented in GIS Figure 19-23. These show the areas physically suitable for tidal technology deployment for technology Groups A-E, before considering other MSP constraints. GIS Figure 24 shows areas that are suitable for technology deployment from any group, again without consideration for other coinciding activities. From these figures it can be seen that there is a wide area of overlap, both within individual groups that have multiple devices and also between different technology groups. All groups with more than one technology have areas where multiple technologies that can potentially be deployed, and most parts of the AOI are also suitable for the deployment of technologies from two or more groups. Table 3 shows potential deployment areas and it can be seen that the overall area for deployment is similar between Groups A and C. These groups have much larger possible physical area for deployment than Groups B, D, and E, with both potentially covering over 3% of the UKCS. Based on physical constraints alone, Group A has the greatest potential deployment area, and as this group has both the minimum and maximum depth values combined with the shared minimum MSPC, it encompasses all possible sea areas that are suitable for tidal technology deployment which is almost 28,000km² covering over 3.1% of UK waters. Table 3. Areas suitable for technology deployment
Shallow (4-25m LAT)
Intermediate (>25-40m)
Deep (>40-100m) Total
Device Group Area (km²)
% of UKCS
Area (km²)
% of UKCS
Area (km²)
% of UKCS
Area (km²)
% of UKCS
A. Horizontal Axial-flow (bi-direction) 7,754 0.87 7,168 0.80 13,011 1.46 27,933 3.13
B. Horizontal Axial-flow (multi-direction) 2,030 0.23 2,383 0.27 4,389 0.49 8,802 0.99
C. Vertical Axis 7,106 0.80 7,168 0.80 13,011 1.46 27,285 3.06 D. Oscillating Hydrofoil 1,054 0.12 1,491 0.17 1,933 0.22 4,478 0.50 E. Air Injection technology 1,798 0.20 2,383 0.27 3,260 0.37 7,441 0.83 Total * 7,754 0.87 7,168 0.80 13,011 1.46 27,933 3.13 * Accounts for areas where multiple technologies could be deployed
With the exception of Group A, all technology groups have the largest potential deployment areas in deep water followed by intermediate and then shallow. Group A does not follow this trend as it least potential deployment in intermediate water, more in shallow water and the maximum potential deployment area in deep water. When all technology groups are considered, potential deployment areas are similar in shallow

Quantification of Exploitable Tidal Energy Resources in UK Waters
R/3671/4 17 R.1349
(7,754km²) and intermediate (7,167km²) waters while there is almost double the potential deployment area in deep (13,011km²) water. GIS Figure 19 shows the AOI where the tidal currents, water depth and distance from land are suitable for the deployment of horizontal-axis (bi-direction) tidal technologies (Group A). A total area of 27,933km² meets the criteria of at least one of the 13 technologies within Group A. This area is reduced to 22,001km² for locations that meet the criteria of two or more Group A technologies and only 115km², divided between Alderney, the Isle if Wight, Ramsey Island, Anglesey, the Isle of Islay, Pentland Firth, and the north Orkneys, is suitable for the deployment of the maximum 12 out of 13 Group A devices. Devices in Group A have the maximum area of potential deployment, and sites that meet the physical deployment criteria for all other technology groups are all located within the Group A area (see Table 2). There are presently only two horizontal-axis (multi-direction) devices considered in Group B and either of these devices could potentially be deployed in 8,802km² of UK waters (GIS Figure 20). Both of these devices are suitable for deployment in 5,983km² of the study area. Group C is made up of four vertical-axis devices and at least one of these devices is suitable for deployment in almost every area as Group A, with 27,285km² of suitable resources (GIS Figure 21). There are 1,372km² of UK waters that are suitable for all four vertical-axis technologies in Group C and these areas are located in most parts of the AOI. Groups D and E both only have a single device technology and the oscillating hydrofoil device in Group D is suitable for deployment in 4,478km² (GIS Figure 22) of UKCS and the air Injection technology in Group E has a potential deployment area of 7,441km² (GIS Figure 23). Due to the overlap between technology groups the total AOI suitable for any tidal technology deployment is the same as that for Group A, at 27,933km². GIS Figure 24 shows the spatial distribution of potential technology from all groups. There are several hotspots shown in red where the physical conditions can potentially support many devices from several technology groups. Particular hotspots include the Channel Islands, south Isle of Wight, Portland, Ramsey Island, north of Bardsay Island, north-west Anglesey, west of the isle of Islay, Pentland Firth and Orkney Islands which all have the potential to support 17 or more devices. The majority of these hot-spots are consistent with areas of good tidal resource within existing published research (ABPmer, 2004, Black & Veatch, 2005). However, it is noted that the Carbon Trust investigation into the Variability of UK Marine resources (see Section 1.3.3) did not propose tidal resource sites at Ramsay Island, Bardsay Island or Anglesey. The reason for these absences is unclear as these areas all sustain a good level of tidal resource and have ideal depths for the deployment of many different types of tidal technologies. The precise deployment area and potential numbers of device types are shown in Table 4. This shows that less than a third of the total AOI is suitable for the

Quantification of Exploitable Tidal Energy Resources in UK Waters
R/3671/4 18 R.1349
deployment of four or more device types and also highlights that no more than 16 device types are suitable for deployment in an individual area of shallow water. Table 4. Potential technology deployment areas based on primary physical
constraints
Shallow Intermediate Deep Total No. of Device Types
(All Groups) Area (km²)
% of AOI
Area (km²)
% of AOI
Area (km²)
% of AOI
Area (km²)
% of AOI
>= 1 7754 27.76 7168 25.66 13011 46.58 27,933 100.00 >= 2 7141 25.56 7168 25.66 13011 46.58 27,320 97.81 >= 3 7106 25.44 7168 25.66 7728 27.67 22,001 78.76 >= 4 1994 7.14 2383 8.53 4389 15.71 8,767 31.39 >= 5 1903 6.81 2383 8.53 4389 15.71 8,676 31.06 >= 9 1798 6.44 2383 8.53 4389 15.71 8,570 30.68 >= 10 1672 5.99 2383 8.53 3959 14.17 8,004 28.65 >= 11 1372 4.91 2383 8.53 3576 12.80 7,330 26.24 >= 12 1372 4.91 2383 8.53 2179 7.80 5,934 21.24 >= 13 1157 4.14 2383 8.53 1365 4.89 4,905 17.56 >= 14 790 2.83 2114 7.57 1341 4.80 4,244 15.19 >= 15 386 1.38 1438 5.15 759 2.72 2,583 9.25 >= 16 152 0.54 387 1.39 194 0.69 734 2.63 >= 17 - - 387 1.39 159 0.57 546 1.95 >= 18 - - 277 0.99 118 0.42 395 1.41 >= 19 - - 86 0.31 29 0.10 115 0.41
5. Marine Spatial Planning (MSP) constraints Many areas of UK waters are subject to pressures from competing resources that wish to utilise the seabed, water column or surface. Focus on the importance of such resource issues has been further promoted by the forthcoming Marine Bill and associated government research into Marine Spatial Planning (MSP) (ABPmer et al, 2006). The renewable energy sector currently competes for marine resources through the allocation of offshore wind farm sites and pressure will be further increased as wave and tidal electricity production develop into commercial deployments. To aid analysis, MSP constraints have been split into two categories. Areas where existing activities are present, which are unlikely to be able to co-exist with tidal technologies, have been excluded from the predicted tidal resource. Areas where existing activities are present that can potentially co-exist with tidal technologies have been researched and reported. At the present time there are a variety of device designs which make it very difficult to identify what the impacts of a ‘generic’ device type are likely to be on other marine uses and users. Additional uncertainty is associated with the size of devices, array spacing and the overall footprint of a tidal project. Consequently, it has not been possible to consider the differences in MSP

Quantification of Exploitable Tidal Energy Resources in UK Waters
R/3671/4 19 R.1349
constraints for each device type and in the following sections all tidal technologies have been considered collectively. The MSP datasets have only been analysed within the project AOI and to manage project resources most efficiently datasets were only sourced for this area. The data extent is shown on all relevant GIS Figures to inform where datasets remain un-sourced rather than features are not being present.
5.1 Exclusion Activities The project has defined 12 existing activities that can exclude the potential deployment of tidal technologies, as presented in Table 5. Several of these areas require an additional exclusion zone to be placed around the activity area, while others are represented by a licence area or activity zone polygon, as defined by GIS datasets attained for the project.
5.1.1 Reasons for Exclusion Several of these constraints have well-defined exclusion safety zones that are present for all marine activities. Oil and gas infrastructure, cables and pipelines are all protected by 500m buffers to maintain safety of both the infrastructure and other users of the marine environment. Disposal sites include ammunitions dumping grounds and also have a 500m buffer to maintain the safety of marine users. Wrecks have commonly been in-situ for long periods of time and may be of historic importance. This means that they could potentially be disturbed during the installation and maintenance of technologies. Tidal devices should avoid disturbing wrecks to protect both the historic environment, avoid potential environmental impacts of disturbed substances, and to reduce the risk of collision from disturbed items interacting device structures. Protected wrecks are subject to existing exclusion zones which should be avoided and for the purpose of this study a minimum exclusion zone of 100m has been implemented to cover all known wrecks. Other identified obstructions have also been allocated a 100m exclusion buffer as tidal flow will be disrupted in these areas, which will often require more complicated mounting requirements to avoid the obstruction. The remaining exclusion constraints concern existing activities that are currently present in the marine environment. Aggregate extraction requires full access to seabed sand and gravel resources and therefore cannot co-exist with tidal technologies. The same is true for maintenance dredging which requires the removal of the seabed sediments to maintain sufficient water depths for navigation. Anchorage areas and fish farms also represent other zones where activities cannot co-exist with tidal technologies. Offshore wind farms have also been taken as exclusions because current licensing conditions do not allow for dual use of the licence area.

Quantification of Exploitable Tidal Energy Resources in UK Waters
R/3671/4 20 R.1349
5.1.2 Effects of Exclusions on the AOI When the exclusion zones are applied to the total tidal technology AOI the net loss is 12% (Table 5). Existing marine cables, with a safety zone of 500m, account for over half of the excluded AOI while aggregate licence areas (18%) and pipelines (14%) also provide significant contributions to the total area of exclusion. All other exclusion constraints result in less than 1% of the AOI to be lost and no Fish Farms are located within the AOI. More areas of exclusion constraints are located in shallower areas with almost half of the excluded AOI located shallow depth zone. The remaining exclusion area is split with 27% of excluded in intermediate water depths and 25% in deep water. Several of the exclusion activities including aggregate extraction, offshore wind farms, anchorage areas, maintenance dredging, and fish farms are not present in the deep depth zone.

Quantification of Exploitable Tidal Energy Resources in UK Waters
R/3671/4 21 R.1349
Table 5. Exclusion constraints
Shallow (2-25m LAT) Intermediate (>25-40m) Deep (>40-100m) Total
Activity Description Data Source
Exclusion Zone Area Excluded
(km²) Area Excluded
(% of AOI) Area Excluded
(km²) Area Excluded
(% of AOI) Area Excluded
(km²) Area Excluded
(% of AOI) Area Excluded
(km²) Area Excluded
(% of AOI)
Oil and Gas Infrastructure
Surface and subsurface infrastructure including platforms, active wells and manifolds
DTi 500m 1.7 0.006 1.6 0.006 0.0 0.000 3.3 0.012
Cables Telecommunication, power, fibre-optic, data, mooring
SeaZone, Kingfisher 500m 619.7 2.219 519.3 1.859 642.3 2.299 1781.3 6.377
Pipelines Oil, gas, outfalls SeaZone 500m 372.8 1.335 93.4 0.334 45.0 0.161 511.3 1.830
Disposal Sites Includes ammunitions grounds SeaZone 500m 51.8 0.185 73.2 0.262 143.2 0.513 268.2 0.960
Wrecks Recorded wrecks SeaZone 100m 35.3 0.126 15.5 0.055 17.0 0.061 67.8 0.243
Protected Wrecks Wrecks designated for protection, includes military wrecks MCA Variable 0.9 0.003 0.0 0.000 0.0 0.000 0.9 0.003
Obstructions Includes seabed obstructions and foul ground SeaZone 100m 59.6 0.213 6.4 0.023 4.7 0.017 70.8 0.253
Aggregate Extraction Areas
Licence areas for marine aggregate extraction
The Crown Estate
Licence Polygon 436.5 1.563 203.7 0.729 0.0 0.000 640.2 2.292
Wind farm Licence
Round 1 and Round 2 offshore wind farm licence areas DTi Licence
Polygon 138.1 0.494 1.0 0.004 0.0 0.000 139.1 0.498
Anchorage Areas Anchorage Areas SeaZone Area Polygon 43.0 0.154 16.8 0.060 0.0 0.000 59.8 0.214
Maintenance Dredging
Areas where regular dredging occurs to maintain channels ABPmer Area
Polygon 0.5 0.002 0.0 0.000 0.0 0.000 0.5 0.002
Fish Farms Marine farms for crustaceans, fish, oysters/mussels SeaZone Area
Polygon 0.0 0.000 0.0 0.000 0.0 0.000 0.0 0.000
Total 1759.8 6.300 930.9 3.333 852.2 3.051 3543.2 12.684
Net Total* 1631.9 5.842 908.6 3.253 821.2 2.940 3361.7 12.035
* Accounts for areas where exclusions overlap

Quantification of Exploitable Tidal Energy Resources in UK Waters
R/3671/4 22 R.1349
5.1.3 Spatial Distribution of Exclusion Constraints Exclusions are present in almost all individual areas of tidal resource. GIS Figures 25-40 show the location and types of exclusion constraints and the remaining areas suitable for tidal technologies once these have been removed.
5.1.3.1 North From the GIS Figures it can be seen that in the north region the majority of the AOI is unaffected by the exclusion constraints. This is due the presence of few activities, such as anchorages, disposal sites, fish farms, which are all confined to coastal areas, and the absence of areas of maintenance dredging or marine aggregate extraction. There are numerous marine installations including cables and pipelines, however, almost all of these are located outside of the AOI. Additionally, the impact of the frequent obstructions caused by wrecks only excludes a relatively small AOI. This results in the majority of tidal resource in the north region being free from exclusion constraints. In the east region there are far more excluded areas. The presence of numerous aggregate extraction licence areas creates significant exclusion areas in the outer Humber and Norfolk areas. Offshore pipelines are present linking oil and gas installations in most northern areas of the region and cables provide further exclusions in the south of the region. Offshore wind farms have a slight impact providing exclusions in the outer Wash and Greater Thames areas. Anchorage areas and disposal sites are generally located outside of the AOI, however there is a large obstruction present offshore of Norflok. The impact of the hundreds of wrecks is limited by their relatively small exclusion zone. Overall, the east region is the most widely effected by the exclusion constraints. In the south region significant areas are excluded due to aggregate licence areas around the Isle of Wight. Disposal areas also result in small areas being excluded around the Isle of Wight, Channel Island, south of Milford Haven and west of Ramsay Island. Most other exclusions in the south region fall outside of the AOI except for cables and wrecks present in all parts of the AOI and, again, the impact of wrecks is limited to highly localised areas. The very good areas of resource to the east of Alderney, south Isle of Wight and around Bardsay Island are notably free from major exclusion constraints. The impact of exclusion constraints in the west region is limited. An anchorage area excludes part of the AOI in the outer Solway Firth and disposal sites are present creating exclusions in Morecambe Bay. The only other major exclusions result from cables and pipelines which intersect relatively small parts of the AOI in the region. This leaves much of the tidal resource free from exclusion constraints except wrecks, which result in highly localised exclusion in all parts of the western AOI.

Quantification of Exploitable Tidal Energy Resources in UK Waters
R/3671/4 23 R.1349
5.1.4 Effects of Exclusion Constraints on Technology Group Areas Tables 6a-d show the effect of exclusion constraints on the AOI for each technology group, in each depth zone. From these results it can be seen that Groups A and C have a similar pattern of exclusions with the approximately 21% of the shallow AOI subject to exclusions, reducing to just under 13% for the intermediate depths and 6% for the deep water. This pattern of reducing constraints with water depth is also present in Technology Group C and in the overall results for each depth region. However, Groups B and D do not share this trend having the least AOI excluded in the intermediate zone, more in the deep zone and the maximum percentage exclusions in the shallow depth zone. The large overall percentage (21%) of exclusions in the shallow zone results in the total remaining AOI of 6,122km² being less than that for the Intermediate zone at 6,259km². Table 6a. Areas excluded in shallow water for each device group
Group AOI (km²)
Excluded (km²)
Excluded (%)
Remaining AOI (km²)
Remaining AOI (%)
Remaining UKCS (%)
A 7754 1632 21.05 6122 78.95 0.69 B 2030 320 15.76 1710 84.24 0.19 C 7106 1544 21.73 5562 78.27 0.62 D 1054 118 11.20 936 88.80 0.10 E 1798 291 16.18 1507 83.82 0.17
All* 7754 1632 21.05 6122 78.95 0.69 * Accounts for areas where multiple technologies could be deployed Table 6b. Areas excluded in intermediate water for each device group
Group AOI (km²)
Excluded (km²)
Excluded (%)
Remaining AOI (km²)
Remaining AOI (%)
Remaining UKCS (%)
A 7168 909 12.68 6259 87.32 0.70 B 2383 154 6.46 2229 93.54 0.25 C 7168 909 12.68 6259 87.32 0.70 D 1491 68 4.56 1423 95.44 0.16 E 2383 154 6.46 2229 93.54 0.25
All* 7168 909 12.68 6259 87.32 0.70 * Accounts for areas where multiple technologies could be deployed Table 6c. Areas excluded in deep water for each device group
Group AOI (km²)
Excluded (km²)
Excluded (%)
Remaining AOI (km²)
Remaining AOI (%)
Remaining UKCS (%)
A 13011 821 6.31 12190 93.69 1.37 B 4389 328 7.47 4061 92.53 0.46 C 13011 821 6.31 12190 93.69 1.37 D 1933 124 6.41 1809 93.59 0.20 E 3260 183 5.61 3077 94.39 0.34
All* 13011 821 6.31 12190 93.69 1.37 * Accounts for areas where multiple technologies could be deployed

Quantification of Exploitable Tidal Energy Resources in UK Waters
R/3671/4 24 R.1349
Table 6d. Areas excluded in all water depths for each device group
Group AOI (km²)
Excluded (km²)
Excluded (%)
Remaining AOI (km²)
Remaining AOI (%)
Remaining UKCS (%)
A 27,933 3362 12.04 24571 87.96 2.75 B 8,802 802 9.11 8000 90.89 0.90 C 27,285 3274 12.00 24011 88.00 2.69 D 4,478 309 6.90 4169 93.10 0.47 E 7,441 628 8.44 6813 91.56 0.76
All* 27,933 3362 12.04 24571 87.96 2.75 * Accounts for areas where multiple technologies could be deployed
5.2 Co-existing Activities Some activities have the potential to co-exist with tidal technologies, usually because they utilise different aspects of the marine resource. Table 7 shows the existing activities that may not directly exclude the deployment of tidal technologies. The precise circumstances where these activities may be able to co-exist will vary greatly between different local areas of tidal resource and individual sites of interest will have to be fully investigated as part of the planning for technology deployment. Table 7. Potential uses and users that could co-exist with tidal technologies
Activity or Feature Description Data Source
Marine Biology Fish spawning and nursery grounds Centre for Environment, Fisheries and Aquaculture Science (CEFAS)
Fishing Fishing grounds, shellfish harvesting areas SeaZone and Multi-Agency Geographic Information for the Countryside (MAGIC)
Military Practice Areas Air Force, Army and Navy practice areas SeaZone
Navigation Commercial shipping routes, ferry routes, traffic separation zones, fairways
SeaZone
Non-renewable Energy Resources
Areas of oil and gas reserves UK Deal
Environmental Designations
Marine Nature Reserves (MNR), Special Protection Area (SPA), Special Area for Conservation (SAC), Ramsar, Sites of Special Scientific Interest (SSSI)
Natural England, Countryside Council for Wales (CCW) Scottish Environment Protection Agency (SEPA).
Recreation Includes recreational sailing and racing The Royal Yachting Association (RYA)
5.2.1 Potential Conflicts Resulting from Co-existing Activities
5.2.1.1 Biological
Fish and shellfish can potentially be impacted during both the installation and operation of tidal turbines. Noise, disturbance of sediments and the potential smothering of habitats could all impact on fish and shellfish species. During turbine operation there is a potential collision risk between mobile species and the moving parts of technologies, however the level of actual risk will be dependent on the size of fish relative to speed

Quantification of Exploitable Tidal Energy Resources in UK Waters
R/3671/4 25 R.1349
and size of the turbines. Operational noise is also considered as a potential impact on marine biology. Any negative effect on fish and shellfish has the potential to create conflicts with users of fishing grounds and shellfish harvesting areas. Mitigation measures include avoiding installation at sensitive breeding times and minimising potential collisions through biologically friendly device designs that are tailored to deployment locations. At the time of writing no data complete datasets regarding cetaceans was unavailable for the study area. It is essential that the potential impacts animals are considered prior to the installation of any tidal devices and it is therefore recommended that local cetacean datasets are included in any site specific studies.
5.2.1.2 Military Information regarding activities in offshore military practice areas is often sensitive and therefore published datasets are relatively general. This means that it will always be necessary to consult with the Ministry of Defence (MOD) about any precise deployment locations and consider how the installation and maintenance of tidal technologies may be affected by military activities. Byelaws and danger sites should be avoided and areas designated for submarine activities are also likely to impact on the deployment of tidal technologies. However many RAF and Army activities may be able to co-exist with tidal technologies and other areas of subject to more disruptive activities may be historic and used infrequently.
5.2.1.3 Navigation High volumes of commercial vessel navigation are found in recognised navigation lanes and approaches to ports. It is likely that the installation of devices will require temporary exclusion zones to be created to maintain safety during the installation activities. Exclusion zones may be continued during the operational lifespan of tidal farms creating a permanent diversion of shipping. Alternatively it is possible that in areas of deep water tidal devices could be deployed at a sufficient depth to enable the safe passage of ships above. Such deployments will require devices that do not encroach on the upper part of the water column and careful consideration will also have to be given to the implication of vessel movements for maintenance activities. Shipping density data provides more detailed information and would possible lead to some areas of high shipping activity being added to the exclusion constraints. At the time of writing shipping density data was not available for all of the study area and, therefore, it is recommended that this information source is included in any local investigation of site specific tidal resource.
5.2.1.4 Non-renewable energy resources It is likely that the exploitation of hydrocarbon and gas fields would have serious impact on the siting of tidal devices. Platform deployment, well drilling, and installation of pipelines are activities which are likely to conflict with potential tidal technologies.

Quantification of Exploitable Tidal Energy Resources in UK Waters
R/3671/4 26 R.1349
However, it is inappropriate to designate areas of potential non-renewable energy resources as exclusion zones until they have been approved for exploitation, and are subject to standard oil and gas safety zones.
5.2.1.5 Environmental designations EC Habitats Directive designations represent strictly protected sites and include Special Areas of Conversation (SAC) and Special Protected Areas (SPA). Currently these are all located in nearshore coastal areas, however work is currently underway to develop location for a series of marine SACs and SPAs within UK waters. Ramsar sites are an international designation of wetlands and can cover marine areas to a depth of 6m while Sites of Special Scientific Interest (SSSI) are UK specific designations which can only extend down to Low Water. Potential impacts of tidal technologies on environmental designations will be device specific and will vary between different sites, therefore, it is not appropriate to exclude these areas to tidal development, however, it is suggested that additional planning and mitigation activities are likely to be required for any potential development in designated areas. One technology has been granted consent to deploy a test device in Strangford Lock, Ireland. This area is subject to several designations including a SAC, SPA, SSSI, a Ramsar site however the environmental impact assessment for this development concluded that the deployment would have no significant impact of these designations (Royal Haskoning, 2005).
5.2.1.6 Recreational sailing The presence of small craft has been considered in this study by applying a 3.5m depth buffer to ensure that sufficient water depths are present above any deployed tidal technologies, to allow for keel clearance (Royal Yachting Association, 2005). However, the location of recreational activities also has the potential to affect the installation and ongoing maintenance of deployed tidal technologies and will therefore require further consideration.
5.2.2 Location of Co-existing Constraints The precise location of each potential co-existing activity is shown in GIS Figures 41-60. Each co-existing activity will require careful consideration prior to the deployment of a tidal device and some activities require enforced separation to ensure that they can co-exist.
5.2.2.1 Biological Potential biological constraints include fish spawning and nursery areas, fishing grounds and shellfish harvesting areas (GIS Figures 41-44). Data about fish spawning and nursery grounds is relatively general and therefore all parts of the project AOI are

Quantification of Exploitable Tidal Energy Resources in UK Waters
R/3671/4 27 R.1349
subject to at least one of these constraints. In the north and east regions all parts of the AOI are covered by both fish spawning and nursery grounds. Approximately 50% of the AOI in the south and east regions is covered by both spawning and nursery grounds with the remaining AOI only designated as a fish spawning area. Data regarding fishing grounds and shellfish harvesting is more detailed and shows that the north region is free from both of these constraints and fishing grounds are absent from the entire AOI. Shellfish harvesting areas in the east and west regions only intersect a very small portion of the total AOI however they do require further consideration in the southern region in the Solent and at Portland areas.
5.2.2.2 Military Military practice areas are present across large parts of the UKCS and cover Air Force, Army and Navy activities (GIS Figures 45-48). Particular attention has been given to submarine, firing and danger areas as these are the activities that are most likely to conflict with tidal technologies. However, it is also suggested that all other activities have the potential to disrupt tidal energy converters, and therefore local areas of tidal resource, and will require further consideration to establish the precise location and use of military practice areas. In the north region most parts of the AOI are free from military practice activities that are most likely conflict with tidal energy converters, except the areas of good resource located around the Isle of Skye. In the east region the only potential conflict with military activities is in the navy practice areas which coincide with a small part of the AOI in the Outer Thames region. In the south region most of the AOI in the English Channel is covered by military activities which are likely to conflict with tidal energy converters, however for the most part, the Channel Islands remain free from military constraints. The AOI in the Bristol Channel and Ramsay Island is also mainly clear of all types of military activities, however, potential conflicts exist for the tidal AOI in to the south of Milford Haven. In the west military activities have the potential to cause conflicts with tidal devices in the North Channel, around the Isle of Skye and in offshore areas at Bardsay Island, Anglesey, and the Mull of Galloway.
5.2.2.3 Navigation The navigation of large vessels is likely to interfere with the deployment of tidal technologies as larger clearances will be required to maintain navigation safety of commercial vessels as existing tankers can have draughts of up to 24m (PIANC, 1997). Busy waterways will also provide serious problems for installation and maintenance of tidal devices. Potential navigation constraints range from ferry routes to traffic separation zones (GIS Figures 49-52) and as with most of the potential co-existing constraints, each local area of tidal resource will have to be independently reviewed in order to understand the precise implications posed by navigation activities. This study provides regional information regarding the potential navigation constraints and from this it can be seen that these are possibly widespread. In the north several

Quantification of Exploitable Tidal Energy Resources in UK Waters
R/3671/4 28 R.1349
navigation lines are present around the Shetland and Orkney Islands and these provide the most likely navigation constraint in these areas. There are also some recommended tracks present in the tidal resource to the west of Skye. In the eastern part of the study area large traffic separation zones are present around Dover and the Outer Humber while shipping and navigation lines serving the ports of Harwich and Felixstowe provide additional constraints. In the south there are several restricted areas in the Solent and Bristol Channel while navigation lines are also present in almost all areas of tidal AOI with particular densities found around the Channel Islands. In the west, Anglesey and the North Channel are subject to two major traffic separation schemes, while other constraints are limited and posed by small navigation lines which are present in most parts of the AOI.
5.2.2.4 Non-renewable energy resources Non-renewable energy resources include hydro-carbon fields and gas pockets (GIS Figures 49-52). There are relatively few non-renewable energy resources areas that tidal technologies could utilise and therefore these only offer a limited potential constraint to tidal developments. All potential areas where these constraints are present need to be considered are in the deeper water parts of the AOI in the eastern part of the study area.
5.2.2.5 Environmental designations With the exception of very shallow water developments, environmental designations are not present in most areas of the tidal AOI (GIS Figures 53-56), however they will have to be considered when planning cable routes to connect tidal developments into the main UK electricity network grid. Output from a tidal device or farm will connect to the onshore grid via a landing point sub station. It is likely that sub sea cable shore landing points and connection assets such as landing point substations, run the risk of being in areas where it is more problematic to gain planning consents for example through/on sensitive nationally designated land. The most notable area where environmental designations co-exist with the tidal AOI in south-west Wales (GIS Figure 55) where a significant part of the tidal resource is also covered by a Special Area of Conservation. Marine Nature reserves will have a significant affect on the potential for the potential deployment of tidal technologies however, at the time of publishing these have only be designated within Welsh Waters and currently do not encroach on any noteworthy parts of the tidal AOI.
5.2.2.6 Recreational sailing Recreational sailing cruising routes, sailing areas and racing areas are present in most parts of the AOI (GIS Figures 57-60). The majority of sailing areas in the northern part of the study area are located outside of the AOI however almost all potential areas of

Quantification of Exploitable Tidal Energy Resources in UK Waters
R/3671/4 29 R.1349
tidal resource are subject to at least one cruising route. In the east many of the nearshore areas are subject to racing and sailing areas however, as the majority of the AOI is located further offshore, it remains unaffected by these activities. The recreation routes are relatively sparse when considered against the size of there AOI in the east, nevertheless there is at least one cruising route present in all major AOI areas. In the south, recreational cruising routes are also present in all areas AOI, except the southern Channel Islands where it is suspected that there is an absence of data rather than no recreational sailing. Racing and sailing areas affect nearshore parts of the AOI with a substantial presence in the Solent and inner Bristol Channel. This pattern is also repeated in the western area where most nearshore parts of the AOI, except the North Channel and Islay, are affected by racing or sailing areas and recreational cruising routes are present in almost all potential areas of tidal resource.
6. Energy Yield It has been necessary to make several assumptions in order to quantify the potential energy yield for each device group within the entire UKCS. Energy yield has only been calculated in areas physically suitable for the deployment of tidal devices which are free from exclusion constraints. No provision for co-existing MSP constraints has been taken into consideration. The calculations have included typical parameters for the efficiency of the devices, however, the results have assumed that all turbines remain in service and operational, with a zero downtime. The energy calculations have only been undertaken in GIS database cells that are less than 40m deep as the design specifications of large deepwater devices is currently unresolved, and it is unlikely that deep water areas will be exploited within the 5-10 year timeframe considered by this project. Calculations in water depths greater than 40m were found to predict the deployment of large turbines that are theoretically possible, however information about the feasibility of larger devices is presently uncertain. Half-hourly time-series current flow speed data has been calculated for each cell in the project database by using the M2 and S2 tidal constituents. These are based on depth-averaged values and therefore the predicted tidal flows at mean water depths for each cell. This data has been converted into a rated wattage using the power calculation (Section 6.3). The hydrodynamic capacity factors are increased by using a generator rated at below the maximum power available in the stream, and this leads to a potential lower cost of electricity. The method of calculating the power rating for a deployed device in each cell, is detailed in Appendix C.

Quantification of Exploitable Tidal Energy Resources in UK Waters
R/3671/4 30 R.1349
6.1 Energy Equation The estimates for energy yields detailed in this report are based upon a standard formula for calculating the kinetic energy of moving water, where the energy per second (P) intercepted by the active area of the device Ao (m²) in water of density ρ, (kg/m3) and current velocity V (ms-1) is therefore given by:
P = 0.5 ρ Ao V3 (Eq. 1) The energy that can be converted to a useable mechanical form is further limited for a device in open water flow to;
P = 0.5 Cpρ Ao V3 (Eq. 2) Where Cp is the power coefficient (limited to a maximum of 0.593 according to Betz Law). Assuming a gearbox transmission efficiency of ŋ1 and a generator efficiency of ŋ2 then the electrical energy output can be estimated from; P = ŋ1 ŋ20.5 Cpρ Ao V3 (Eq. 3)
0.0
0.5
1.0
1.5
2.0
2.5
3.0
3.5
0 5 10 15 20 25 30
Days
Curre
nt S
peed
(m/s)
Figure 6. Example of tidal current speeds at 30-minute intervals for 30
days

Quantification of Exploitable Tidal Energy Resources in UK Waters
R/3671/4 31 R.1349
Tidal current speeds have been extracted from each cell in the database and computed for a full year. A 30-day sample of this data from a single cell in the database is presented in Figure 6. Representative values for gearbox transmission efficiency ŋ1 (0.94) and generator efficiency ŋ2 (0.92) have been taken from published literature (DTi, 2005). A standard seawater density (ρ) of 1,025kg/m³ has been used, as has power coefficient (Cp) of 0.45 (Binnie, Black & Veatch and IT Power, 2001). It is noted that these values will vary depending on the design features of a particular device and it’s deployment location, but for the purpose of this report these values have been treated as constants. The active area of the device differs for each device group, due to their fundamentally different design characteristics (Appendix A). These are summarised in Table 8 below. Table 8. Definitions of the active area for each device group
Device Group Active Area A. Horizontal Axial-flow bi-direction Circular area swept by turbine blade. B. Horizontal Axial-flow multiple direction Circular area swept by turbine blade. C. Vertical Axis Rectangular area of a cylinder as viewed from the side. D. Hydrofoil Lever Rectangular area of sweep x span. E. Air Injection technology Circular area intake of the generator.
It should be noted that recent research (Salter, 2007) in estimating energy yields has the potential to change the way in which energy estimate calculations are made, increasing energy estimates by up to 20 times from those calculated using the equations above. In summary, this research highlights the potential energy of a tidal wave resultant from the vertical displacement of water. These developments have not yet been published in peer-reviewed papers, and have therefore not been used for the calculations reported in this document. The work of David MacKay (University of Cambridge) and S H Salter details these developments (Salter, 2007 and DTi Website, April 2007).
6.2 Device Size In order to calculate the energy that a technology can generate it is necessary to predict the active area. The size of turbine is directly proportional to the active area, and the maximum turbine size that could potentially be deployed within each data cell has been calculated using the water depth dataset. This calculation is based on device statistics supplied by various developers and information sourced from available literature. The calculation has also required several assumptions to be made and a full explanation of the process and assumptions are outlined below.

Quantification of Exploitable Tidal Energy Resources in UK Waters
R/3671/4 32 R.1349
6.2.1 Vertical Constraints
The area of vertical water column available to all device groups has been limited from both the near-surface and near-bed zones. At the surface a provision has been made to allow for tidal range, waves and small craft. In the near-bed zone provision has been made to avoid reduced currents and the benthic boundary layer (Figure 7).
(Source: Adapted from ABPmer, 2006a)
Figure 7. Vertical constraints on available water column for tidal devices Tides: All water depths have been calculated to LAT to ensure that a sufficient
water depth is maintained in all tidal conditions; Small Craft: A safety zone of 3.5m, as advised by the Royal Yachting
Association (RYA), has been allocated to ensure that small craft navigation remains unaffected by devices (Royal Yachting Association, 2005);

Quantification of Exploitable Tidal Energy Resources in UK Waters
R/3671/4 33 R.1349
Waves: An additional buffer, equivalent to the annual mean significant wave height for each cell, has also been applied to ensure that other buffers remain intact, for example when a small craft is present in a wave trough, at LAT. The motion of waves will also interfere with the near surface currents however it has been assumed that the presence of the 3.5m small craft buffer will provide a sufficient margin to mitigate these effects;
Near-bed Currents: There is a significant in reduction tidal current velocity
towards the seabed due to friction. This affects the potential energy available for conversion and can also apply excessive stresses to devices where the larger forces applied to the active area in the faster flowing upper water column act against the lesser forces applied to the active area located in the reduced near-bed flows. The lower 25% of the water column is subject to velocity reductions of over 10% and this zone is unsuitable for device deployment.
Benthic Boundary Layer: The benthic boundary layer is present in the lower
10% of the water column however no additional buffer is required as this zone is protected by the 25% near-bed current buffer.
6.2.2 Device Size Calculation
The potential maximum size of device from each group, that could be deployed in each cell, has been calculated using following equations, which incorporate depth data and the constraints outlined above. The calculation can be used to derive both vertical and horizontal dimensions for a generic technology in each group.
6.2.2.1 Group A (horizontal-axis - bi-directional), B (horizontal-axis - multi-directional, and E (air injection technology) The maximum size of these devices is a combination of the maximum rotor diameter and size of the support structure to mount the device at the correct vertical location in the water column. A restriction to rotor blade diameter is the tip speed, since at high rotational speed the tip could create cavitation effects that reduce performance and increase fatigue (ABPmer, 2006a), therefore the maximum rotor diameter has been capped at 23.5m (pers.comm. Glen Darou, Clean Current Power Systems Inc.). The maximum rotor blade diameter that could be deployed in each cell has been calculated using the following equation:
Rotor Diameter = 0.75*d-3.5-hs (Eq. 4) Where
d = Water depth (LAT) hs = Annual mean significant wave height

Quantification of Exploitable Tidal Energy Resources in UK Waters
R/3671/4 34 R.1349
The rotor diameter is equal to the water depth at LAT, minus the mean wave height, minus 3.5m for small craft clearance, minus 25% of the water depth (LAT). The width of the device is equal to the maximum rotor diameter that can be deployed at a given depth capped to a maximum of 23.5m. The total height of a device is equal to the maximum rotor diameter that can be deployed at a given depth capped to a maximum of 23.5m, plus 25% of the water depth to account for the support structure. The active area is equal to the swept area of the rotor.
6.2.2.2 Group C (vertical-axis) The maximum size of these devices is governed by a 6 to 5 ratio of width to height. The turbine height is based on the water depth and limited to 23.5m. The maximum turbine height that could be achieved in each cell has been calculated using the following equation:
Turbine Height = 0.75*d-3.5-hs (Eq. 5) Where
d = Water depth (LAT) hs = Annual mean significant wave height
The height of the turbine is equal to the water depth at LAT, minus the mean wave height, minus 3.5m for small craft clearance, minus 25% of the water depth (LAT) and capped to 23.5m. The total height of a device is equal to the maximum turbine height that can be deployed at a given depth capped to a maximum of 23.5m, plus 25% of the water depth to account for the support structure. The width of the device is 1.2 times larger than the turbine height, following the 6:5 ratio. The active area is equal to the area of water that the turbine sweeps which equates to turbine height multiplied by device width.
6.2.2.3 Group D (oscillating hydrofoil) The maximum size of these devices is limited by the hydrofoil width and vertical sweep. The vertical sweep is calculated as 68% of the available water depth and, due to realistic design specifications for deployment in the next 5-10 years, limited to 20m. The maximum vertical sweep that could be achieved in each cell has been calculated using the following equation:
Vertical Sweep = (0.75*d-3.5-hs)*0.68 (Eq. 6) Where
d = Water depth (LAT) hs = Annual mean significant wave height
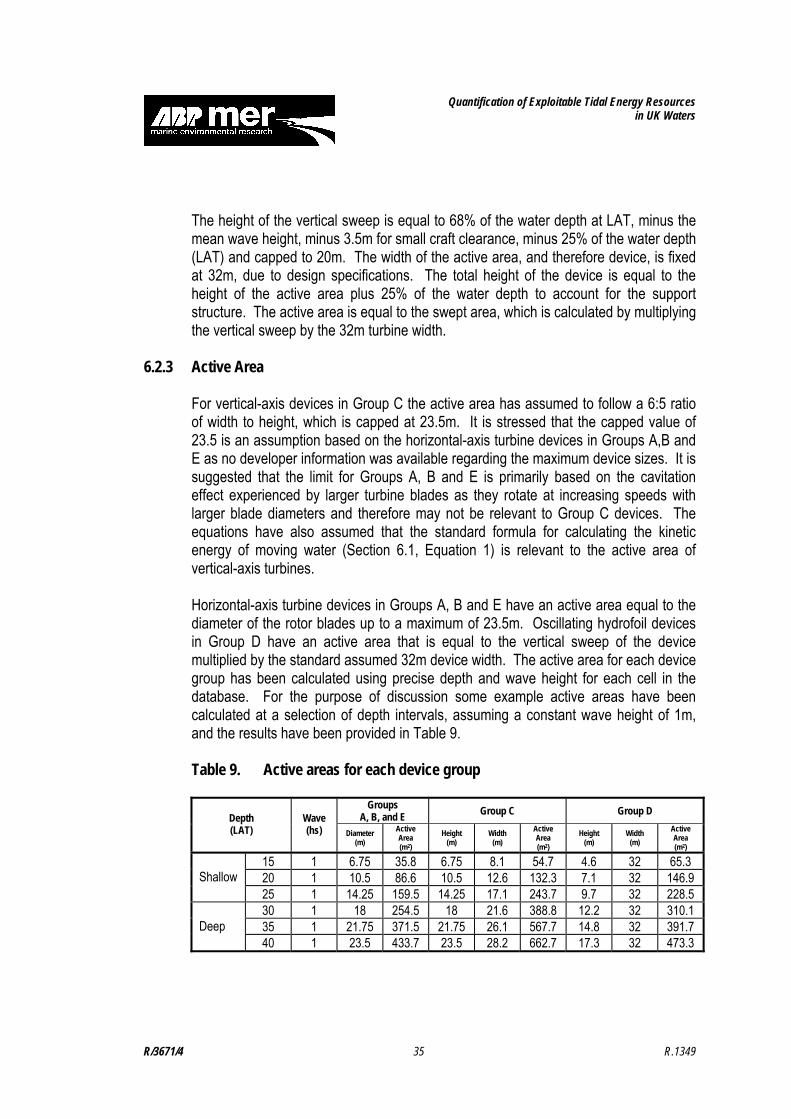
Quantification of Exploitable Tidal Energy Resources in UK Waters
R/3671/4 35 R.1349
The height of the vertical sweep is equal to 68% of the water depth at LAT, minus the mean wave height, minus 3.5m for small craft clearance, minus 25% of the water depth (LAT) and capped to 20m. The width of the active area, and therefore device, is fixed at 32m, due to design specifications. The total height of the device is equal to the height of the active area plus 25% of the water depth to account for the support structure. The active area is equal to the swept area, which is calculated by multiplying the vertical sweep by the 32m turbine width.
6.2.3 Active Area For vertical-axis devices in Group C the active area has assumed to follow a 6:5 ratio of width to height, which is capped at 23.5m. It is stressed that the capped value of 23.5 is an assumption based on the horizontal-axis turbine devices in Groups A,B and E as no developer information was available regarding the maximum device sizes. It is suggested that the limit for Groups A, B and E is primarily based on the cavitation effect experienced by larger turbine blades as they rotate at increasing speeds with larger blade diameters and therefore may not be relevant to Group C devices. The equations have also assumed that the standard formula for calculating the kinetic energy of moving water (Section 6.1, Equation 1) is relevant to the active area of vertical-axis turbines. Horizontal-axis turbine devices in Groups A, B and E have an active area equal to the diameter of the rotor blades up to a maximum of 23.5m. Oscillating hydrofoil devices in Group D have an active area that is equal to the vertical sweep of the device multiplied by the standard assumed 32m device width. The active area for each device group has been calculated using precise depth and wave height for each cell in the database. For the purpose of discussion some example active areas have been calculated at a selection of depth intervals, assuming a constant wave height of 1m, and the results have been provided in Table 9. Table 9. Active areas for each device group
Groups A, B, and E Group C Group D Depth
(LAT) Wave (hs) Diameter
(m) Active Area (m2)
Height (m)
Width (m)
Active Area (m2)
Height (m)
Width (m)
Active Area (m2)
15 1 6.75 35.8 6.75 8.1 54.7 4.6 32 65.3 20 1 10.5 86.6 10.5 12.6 132.3 7.1 32 146.9 Shallow 25 1 14.25 159.5 14.25 17.1 243.7 9.7 32 228.5 30 1 18 254.5 18 21.6 388.8 12.2 32 310.1 35 1 21.75 371.5 21.75 26.1 567.7 14.8 32 391.7 Deep 40 1 23.5 433.7 23.5 28.2 662.7 17.3 32 473.3

Quantification of Exploitable Tidal Energy Resources in UK Waters
R/3671/4 36 R.1349
When these values are plotted in Figure 8 it can be seen that Groups A, B, and E have the lowest active area at all depths and Group D has the largest active area until around 23m. Although the active area of Group C is relatively small at lower depths it grows rapidly achieving the largest active area in areas deep water. The active area directly influences the amount of energy that an individual device can extract from the tidal currents. However, in order to predict the overall energy yield for a technology located in each database cell of tidal resource, it is also necessary to consider how many devices can potentially be deployed and at what power rating.
0
100
200
300
400
500
600
700
15 20 25 30 35 40
Depth (mLAT)
Act
ive
Are
a (m
2 )
Groups A, B, & E Group C Group D
Shallow Depths Intermediate Depths
Figure 8. A comparison of predicted active areas with depth
6.3 Turbine Rating In order to quantify the potential tidal resource that can be captured it is also necessary to predict the turbine power rating and therefore this has been calculated for each cell in the database. This is the maximum power in megawatts that the turbine will output. This has been calculated by plotting the proportions of energy over a one year period against tidal current speeds, and using the subsequent graph to predict the current speed rating, for a range of depth and MSPC scenarios. A full description of this process in outlined in Appendix C.

Quantification of Exploitable Tidal Energy Resources in UK Waters
R/3671/4 37 R.1349
The effect of a turbine power rating on the energy output is shown in Figure 9, where the power output is capped to 1MW and, in this scenario, the additional potential energy available at higher flows is not captured by the device. Note that although this example is for a 30-day period all project calculations were undertaken on annual tidal current time series datasets.
0
1
2
3
4
5
6
0 5 10 15 20 25 30Time (Days)
Curre
nt S
peed
(m/s)
0.0
0.4
0.8
1.2
1.6
2.0
2.4
Powe
r (KW
)
Current Power
Figure 9. Effect of turbine power rating on output The power rating has been applied to each cell depending on its MSPC and depth group as defined in Table 10. This process has resulted in some areas of shallow, slow flowing resource to be unrated as the available energy yields resulted in predicted turbine ratings of less that 0.1MW, which are only deemed suitable for micro-generation. The turbine ratings in areas of high potential power returns have been capped at 5MW to reflect the likely available technology that will be ready for deployment in the 5-10 year horizon (until 2017) covered by this study.

Quantification of Exploitable Tidal Energy Resources in UK Waters
R/3671/4 38 R.1349
Table 10. Power rating (MW) for devices based on MSPC and depth
1.5-2.0 2.0-2.5 2.5-3.0 3.0-3.5 3.5-4.0 4.0-4.5 4.5-5.0 5.0-5.5 > 5.5 Depth (m LAT) (m/s)
- - - - - - # # # - - - - - - # # # <10 - 0.1 0.25 0.25 0.5 0.75 # # # - - - 0.1 0.2 # 0.5 0.5 # - - 0.1 0.15 0.25 # 0.75 0.75 # 10-15 - 0.25 0.5 0.75 1.5 # 3 4 # - - 0.15 0.25 0.5 0.75 # # # - 0.15 0.25 0.5 0.75 1.5 # # # 15-20
0.15 0.25 0.75 1 2 4 # # # - 0.15 0.25 0.5 1 1.5 2 3 4
0.1 0.25 0.5 1 1.5 3 3 4 5* 20-25 0.2 0.5 1 1.5 3 5 5* 5* 5* 0.1 0.25 0.5 1 1.5 # 4 5 #
0.15 0.5 0.75 1.5 2 # 5* 5* # 25-30 0.25 0.5 1 2 4 # 5* 5* # 0.15 0.5 0.75 1.5 2 4 5 5* # 0.25 0.75 1 2 4 5* 5* 5* # 30-35 0.25 0.75 1.5 3 4 5* 5* 5* # 0.2 0.5 1 1.5 3 5 # # #
0.25 1 1.5 3 5 5* # # # 35-40 0.25 0.75 1.5 3 4 5* # # #
Key Device Groups A, B and E - unrated Device Group C # no depth/MSPC combination in the database Device Group E * capped at 5MW
6.4 Tidal Farm Arrays and Deployment Densities In order to calculate the potential tidal power output for each cell in the database it is necessary to understand how many turbines each cell can support, however, there is limited existing research regarding tidal farm deployment arrays. Present understanding suggests that feasible tidal farms deployed in the next 5-10 will range from 5-30MW (Econnect, 2006).
6.4.1 Lateral Spacing It is recognised that conceptual layouts for tidal devices are likely to be in rows running perpendicular to the axis of dominant water flow. Existing laboratory and numerical modelling research indicates that the lateral spacing of devices along these rows should be at least one turbine width apart (Bahaj & Myers, 2004). This has been adopted for the present study which has assumed a lateral spacing equal to the width of the device, as calculated in Section 6.2.
6.4.2 Longitudinal Spacing Less research has been presented regarding the longitudinal spacing required between lateral turbine rows. Laboratory tests have indicated that water flows require

Quantification of Exploitable Tidal Energy Resources in UK Waters
R/3671/4 39 R.1349
between 10 and 20 times the turbine height to recover (ABPmer, 2006, University of Southampton Website, April 2007). However, it is also noted that successive turbine rows are likely to extract sufficient energy from the tidal water flows to make farms with multiple rows of devices unfeasible. Figure 10 shows the theoretical number of turbines that would be (Groups A, B and E) deployed in lateral rows an area of 1km², with a spacing of 1 turbine width and a longitudinal spacing of 15 device heights (including support structure), at three different depths. This layout would never be implemented without the staggering of devices, however from this simple example it can be seen that the number to turbines becomes unfeasible in lower water depths, as smaller devices result in many lateral turbines arranged in multiple deployment rows. It is suggested that such densities of deployment as unfeasible within a 1km² and even less likely when adjacent areas of tidal resource are considered.
Figure 10. Theoretical turbine deployment densities when lateral and
longitudinal spacing rules are applied The present study considers potential tidal energy extracted from the entire UKCS and, therefore, there are many areas where the potential power outputs have been calculated from relatively large areas of tidal resource. Consequently, to avoid a significant over estimate in the power calculations, it has been assumed that each square kilometre of resource will only be able to support a single turbine row. This assumption means that the assumed longitudinal spacing between turbine lines is 1km regardless of turbine size, and this helps to reduce the potential for over estimating the power due to the loss of downstream tidal currents in adjacent resource cells.

Quantification of Exploitable Tidal Energy Resources in UK Waters
R/3671/4 40 R.1349
6.4.3 Tidal Farm Size and Capacity
The longitudinal and lateral spacing have been used to calculate how many devices could be deployed within 1km2, based on the depth. This information has been combined with the area and power rating for each cell in the database to calculate the power capacity of energy converters that could be deployed, for each device group. This calculation has assumed that the deployment rows are aligned directly across the 1km2 area and therefore row lengths cannot exceed 1,000m. In areas of large resource this calculation shows that the 1.8km (3.24 km2) Atlas cells have the predicted capacity of several hundred megawatts. However, research suggests that technical and economic factors will limit typical farms installed in the next 5-10 years to a capacity of around 5-30MW (Econnect, 2006). This factor has been incorporated into the project and energy calculations have only been undertaken for areas of resource that can support more than 5W/km² of installed turbine capacity. The upper limit has also been capped to 30MW/km², which does not exclude the deployment of larger commercial arrays, with capacities of over 30MW, in areas where several adjacent 1km2 areas have a suitable unconstrained tidal resource.
6.5 Tidal Farm Capacity GIS Figures 61-63 show the potential installed capacity per square kilometre for each of the device groups. Parts of the AOI shown in grey have either been excluded from the power equation as they are greater than 40m LAT and therefore unlikely to be exploited in the next 5-10 years, or have an insufficient tidal resource to support at least a 5MW array of tidal devices. Black areas show parts of the tidal resource that have been excluded from the calculation due to the presence of MSP exclusion constraints (Section 5.1). As expected, the spatial distribution of potential installed capacity for all device groups follows the pattern of good tidal resource. Horizontal-axis turbines in Groups A, B and E all have the same predicted installed capacity because the power calculations, turbine sizes and therefore turbine power capacities were derived using the same equations (Sections 6.1-6.3). For these groups, the capped maximum capacity of 30MW/km2 is predicted for areas of tidal resource around Alderney, the Isle of Wight, Portland, Ramsay Island, Anglesey, in the North Channel, around the Isle of Islay, in Pentland Firth and Westray Firth in the Orkney Islands. This pattern is repeated for the predicted installed capacities for vertical-axis technologies from Group C, with the addition of 30MW/km2 rated areas around the remaining Channel Islands, at Bardsay Island, Mull of Galloway, and in other areas around the Orkney Islands. The potential deployed capacity for oscillating hydrofoil technologies in Group D also demonstrated a similar pattern with areas rated at the maximum 30MW/km2 located at Alderney, north of Jersey, the Isle of Wight, Portland, Ramsay Island, Anglesey, in the North Channel, Islay, in Pentland Firth and Westray Firth in the Orkney Islands.

Quantification of Exploitable Tidal Energy Resources in UK Waters
R/3671/4 41 R.1349
Table 11 shows the total installed capacities for each device group split by depth. This has been calculated by multiplying the predicted capacity per square kilometre by the area of each individual cell in the database. For areas where multiple device types are predicted in a cell, the total capacity has been derived by calculating the mean of the capacities for all potentially deployed devices. There is no installed capacity in the deep water zone as areas greater then 40m deep have been excluded from the power calculation. As explained above, Groups A, B and E have the same overall predicted installed capacities due to consistent calculation being applied. Table 11. Potentially installed capacity Group Shallow Capacity (GW) Intermediate Capacity (GW) Total Capacity (GW)
A 6.7 20.6 27.3 B 6.7 20.6 27.3 C 11.0 28.0 39.0 D 6.2 13.2 19.4 E 6.7 20.6 27.3
Total* 10.3 25.6 35.9 * Accounts for areas where devices from multiple groups could be deployed
The results show that all device groups have a larger potential installed capacity in intermediate water. Device Group D has the lowest potential installed capacity in both depth zones and Group C the highest. The installed capacity calculation is underpinned by the active area prediction (Section 6.2.3), turbine rating (Section 6.3) and deployment densities (Section 6.4). Despite Oscillating Hydrofoil devices in Group D having the largest active area, and therefore higher predicted turbine ratings, they have relatively low deployment densities due to the fixed 32m-device width, which results in a lower overall installed capacity. It is suggested that the installed capacity for Group D would be significantly increased if the maximum possible turbine rating were not capped at 5MW. This is also likely to be true for other technology groups, though to a lesser extent. Overall vertical-axis devices in Group C have the largest potential installed capacity. This result confirms that that the relatively large predicted active area of Group C devices combined with their relatively high predicted deployment densities, result in a significantly larger predicted installed capacity than the other technology groups. However, this result should be treated with caution as there is presently less information available regarding vertical-axis Group C turbines than other groups. Key assumptions have been made for vertical-axis devices include:

Quantification of Exploitable Tidal Energy Resources in UK Waters
R/3671/4 42 R.1349
The standard formula for calculating the kinetic energy of moving water (Section 6.1, Equation 1) is relevant to the active area of these types of devices;
The power rating of these devices can be derived from the distribution of tidal current speeds as proportions of annual energy yield (Appendix C); and
A maximum turbine height of 23.5m is feasible. It is also noted that the design of vertical-axis turbines does provide a larger active area than horizontal axis turbines when deployed in the same depth of available water. This is a result of rectangular active area calculation for the Vertical-axis turbines in Group C compared to the circular active area of the horizontal-axis devices in Groups A, B and E, as shown in Figure 11. As the active area is the most important part of the device for energy capture is it reasonable to suggest that Vertical-axis turbines do offer the potential for a greater installed capacity.
Height 10m
Width 12m
Height 10m
Horizontal Axis
Vertical-Axis
Active Area = 12 x 10 = 120m2
Active Area = π x 52 = 78.5m2
Seabed
Sea Surface
Width 10m
Figure 11. Comparison between the active area for a horizontal-axis (Groups A, B, and E) and vertical-axis (Group C) device

Quantification of Exploitable Tidal Energy Resources in UK Waters
R/3671/4 43 R.1349
The overall predicted installed capacities for technology groups range from 19,392-39,029MW with an average 35,896MW when areas of overlapping technologies deployment predictions are accounted for. Several existing studies have also estimated potential installed capacity for various parts of UK waters. The Carbon Trust funded research (Environmental Change Institute, 2005) quoted a total potential capacity of 4,424MW for the 34 top locations of good tidal resource in UK waters. Other research funded by the Welsh Development agency (Project Management Support Services, 2006) predicts an installed capacity of 15,670MW divided across five locations in Welsh Waters. Further work by Bahaj & Myers (2005) suggests an installed capacity of 1,496MW in the Alderney Race alone. This is markedly different to the 248MW of predicted installed capacity at Alderney quoted as part of the Carbon Trust funded research (Environmental Change Institute, 2005). The European Commission (Centre for Renewable Energy Sources, 2006) estimate the potential for marine current turbines in Europe to exceed 12,000MW of installed capacity and the Path to Power project (Climate Change Capital, 2006) suggests that the UK possesses 50% of Europe’s tidal resource. Other research funded by the Scottish Executive (Garrad Hassan, 2002) predicts a potential installed capacity of 686MW for the western isles of Scotland. The predictions within existing research vary significantly due to subtle differences in source data, calculation assumptions and methodologies, which often remain unreported. The predictions of potentially installed capacity in the present study are consistent with the predictions of over 15,000MW of installed capacity in Welsh Waters (Project Management Support Services, 2006), however, these are generally larger than other predictions that are presented in existing research. This project has applied a consistent and transparent methodology of analysis across the UK. Several assumptions have been applied to manage the predictions of installed capacity including limiting individual deice power ratings to 5MW and only analysing farms with a capacity of 5-30MW/km². This project includes all areas that are identified as physically suitable for the deployment of tidal technologies based on contemporary technology specifications, but also applies exclusions to rule out areas where existing users or users will prevent the deployment of tidal technologies. This is a different approach to many other site-specific studies, which focus on the areas of greatest potential resource and are less likely to predict device deployments in other areas, which although less appealing, may still have suitable tidal flows. In addition, this study has adopted a process on analysis that considers the precise tidal flows, available water depth, variable turbine power ratings and deployment densities to calculate the potential installed capacity for areas of suitable for tidal resource, in locations that are free from exclusion constraints. The work has calculated a range of parameters that have often only been considered independently in existing research and offers a detailed and transparent approach to analysis.

Quantification of Exploitable Tidal Energy Resources in UK Waters
R/3671/4 44 R.1349
6.6 Technically Extractable Tidal Energy
The power calculation has been applied to all cells in the database that are free from exclusion constraints to calculate a technically extractable annual energy yield for UK tidal resources. The power calculation includes the Betz Law coefficient, estimates of turbine efficiency and the active area of technologies in a device group, and is based on a full year of predicted currents for all potential resource areas, the number of devices that can be deployed in a cell, the power rating of those devices. The equation assumes also a 100% uptime for deployed devices as information regarding likely down-time for routine maintenance and break fixes is presently unavailable. Table 12 shows the predicted technically extractable annual energy yields for each technology group, split by depth areas. As explained Section 6.5, horizontal axis technologies in Groups A, B and E have the same overall predicted energy yields due to consistentices in the calculations that have been applied, and subtitle differences in their physical deployment criteria have been eliminated by limiting tidal farm sizes from 5-30MW and also excluding areas that are greater than 40m deep from the power calculations. Vertical-axis technologies in Group C have the largest predicted energy yield at both depth groups and this is a direct result of the larger active area of these technologies as discussed in Section 6.5. Oscillating Hydrofoil technologies in Group D have the lowest predicted energy yields and this is a consequence of the lower predicted installed capacities as discussed in Section 6.5. Table 12. Predicted annual energy yield
Group Shallow Energy Yield (TWh/y)
Intermediate Energy Yield (TWh/y)
Total Energy Yield (TWh/y)
A 16.9 54.7 71.6 B 16.9 54.7 71.6 C 25.3 71.4 96.7 D 17.0 41.4 58.4 E 16.9 54.7 71.6
Total* 25.3 69.1 94.4 * Accounts for areas where devices from multiple groups could be deployed
The total predicted annual energy yield for UK waters is estimated as 94.4 TWh/y. Over two thirds of this is located in intermediate waters between 25 and 40m deep. The overall energy yields are quite similar between all technology groups. Unsurprisingly, higher power yields are found in the areas of good tidal resource that have been identified throughout this report. It is stressed that the predicted annual energy yields in Table 12 assume that all potentially suitable areas of UK waters up to 40m deep, that are free from existing exclusion constraints, are developed for tidal technology deployment. However, with present technologies this would require approximately 200,000 devices to be deployed

Quantification of Exploitable Tidal Energy Resources in UK Waters
R/3671/4 45 R.1349
across over 11,000km². These results are therefore presented as a reference to the technically achievable maximum energy yield, should political, economic, and grid connection issues allow all areas of good tidal resource to be developed for energy extraction. The potential exploitable annual energy yields for areas with the largest predicted tidal resource, are discussed in Section 6.7.
6.6.1 Comparison with Existing Research The most widely quoted research into the potential annual energy yields from the entire tidal resource in UK waters was provided by the Carbon Trust Marine Energy Challenge research and undertaken by Black & Veatch (2005). This study predicted a total available UK tidal resource of 18TWh/y. The Carbon Trust has also published figures that are based on the same research that show a potential resource 15TWh/y for the best 34 tidal sites in the UK. Other studies have predicted the potential annual energy yields in more localised areas of tidal resource within UK waters. Bahaj & Myers (2005) suggest an annually energy yield of 1.3TWh/y from Alderney Race and Garrad Hassan (2002) predict a yield of 0.2TWh/y for the western isles of Scotland. The present study has calculated the potential exploitable tidal resource for individual data cells rather specific locations of tidal resource. This has avoided the need for a Significant Impact Factor (SIF) as in earlier work (Black & Veatch, 2005) as the power outputs are determined by the size and power rating of technologies that are predicted to be deployed in an individual cell, based on the current speeds and available depth. Other research (Bahaj & Myers, 2004, Black & Veatch, 2005) states that tidal energy converters should not remove more than 10-20% of the tidal energy available in the system and the detailed methodology adapted for this study has ensured that this does not occur with the maximum percentage of energy extracted at for an individual cell predicted at just over 7% Comparisons with existing research are complicated due to the many assumptions and methodologies that can be applied when attempting to calculate complex parameters for technologies that are at an early development stage. This process is also hampered as many studies do not provide detailed methodologies or include a full explanation of assumptions that have been made. It is believed that the present study offers valuable results regarding the potential technically extractable tidal energy in UK waters. The research based on a detailed methodology and provides a comprehensive review of tidal resources in UK waters. It is accepted that the levels of installed capacities and therefore annual energy yields presented are unfeasible with current technology, as this would require over 11,000km² of marine areas to be developed as tidal farms and require the licensing of many tidal farms with associated consultation and a supply chain that does not yet exist. Another barrier to the deployment of such large capacities could result from the cumulative effects on energy removal by successive 30MW rated arrays in areas with many adjacent square kilometres of good tidal resource. However, it is possible that long-

Quantification of Exploitable Tidal Energy Resources in UK Waters
R/3671/4 46 R.1349
term technology developments will produce turbines with power ratings of tens or even hundreds of megawatts and the deployments of such devices could potentially result in the larger installed capacities and energy yields being realised, without the requirement to deploy unfeasible numbers of devices in an unrealistic area tidal resource.
6.7 Exploitable Tidal Energy Resource (next 5-10 years) It has been shown that the potential exploitable tidal annual energy yield in UK waters is approximately 94TWh/y, however, the actual extent of tidal technology deployment over the next 5-10 years will depend on many technological, economic and political factors. These will include the establishment of a robust supply chain and appropriate legislation which is anticipated to be included as part of the forthcoming Marine Bill. In order to quantify the likely exploitable resource in the next 5-10 years, the fifty cells with the highest energy yield for an individual technology device have been summarised by geographic areas and presented in Table 13. The full list of these sites can be found in Appendix D. Table 13. Summary of best sites of UK tidal resource
Location Number of Cells
Area (km2)
No. of Devices
Deployed
Installed Capacity
(MW)
Annual Energy Yield
(GWh/y)
Potential No. of
Devices Deployed
Potential Capacity
(MW)
Potential AEY
(GWh/Y)
Alderney Race 22 63 204 660 1,937 1,483 5,201 15,145 West Islay 7 21 112 210 584 465 896 2,460 South Pentland Firth 6 16 61 180 555 335 1135 3,444 Anglesey 3 9 47 90 238 170 341 873 Ramsay Island 2 6 35 60 183 119 210 631 North Pentland Firth 2 5 17 60 181 103 377 1,150 SW Islay 2 6 30 60 179 131 261 773 Westray Firth 2 5 13 60 177 123 571 1,674 Pentland Skerries 2 5 20 60 162 104 312 843 South Isle of Wight 2 6 30 60 161 125 249 663 Total 50 143 569 1,500 4,356 3,157 9,553 27,656
From Table 13 it can be seen that the top 50 cells of tidal resource fall within 10 distinct geographic areas, as shown on GIS Figure 64. These results show that the deployment of 569 devices are arranged into 30MW farms, totalling an installed capacity of 1,500MW at these sites, has the potential to generate over 4.3TWh/y of energy. This prediction assumes a 100% uptime of all tidal deployed devices and will therefore be slightly reduced in true operating conditions due to turbine down-time for planned and unplanned maintenance It has also been calculated that if the 30MW limit on tidal farm size is removed from the analysis methodology these areas have the potential to produce over 27TWh/y of energy, through the deployment of over 3,000 devices creating a total installed capacity of around 9,500MW. This calculation still assumes a maximum turbine rating of between 1.5-5.0MW for each cell as shown in Appendix D. It is acknowledged that the cumulative effects on energy removal by successive 30MW rated arrays in areas

Quantification of Exploitable Tidal Energy Resources in UK Waters
R/3671/4 47 R.1349
confined areas of tidal resource may provide a potential barrier to the deployment of such large capacities. However, it is also possible that future technology developments, creating higher capacity turbines, may enable the predicted energy yields to being realised. These areas are generally located in the intermediate water depths and this is because these areas have a larger available vertical area of water column which allows the deployment of larger devices that capture more energy. This explains the absence of several areas including Portland and the Bristol Channel which experience high MSPC speeds, however have insufficient depths to achieve the highest predicted energy yields. These results have been calculated using the best available predictions of tidal currents for the UK study area. These provide a good level of information for wide-scale constraints analysis, calculation of potential deployed capacities and energy yields. However, these will still require a further resource validation to be undertaken in order to fully prove the available tidal resource in UK waters.
7. Other Considerations There are numerous other considerations that will require full investigation prior to the deployment of tidal technologies. Many of these are site specific, relating to local conditions requiring more detailed data and therefore fall outside of the scope of this study. However, the primary issues as documented in existing literature are discussed in the following sections.
7.1 Electricity Grid Connection The key challenges of grid connection for tidal technology developers are the distance to electrical infrastructure and grid access capacity. Information regarding potential grid connections from offshore generators draws from the experiences and studies completed for wind farms requirements. The UK electricity network comprises electrical circuits, switching and transforming stations, operated at voltage from around 400,000 volts (400kV) down to 230 volts, the latter for use in domestic premises. The circuits for connection of marine renewable generation plants from prototype arrays to significant projects are likely to be operated at the transmission voltages of 400kV and 275kV and the distribution voltages of 132kV, 66kV and 33kV. In general terms, the larger generation plants with relatively large power outputs will require connection at the higher distribution voltages or transmission voltages (GIS Figure 65). As a consequence connecting these larger generating plants to the grid will have a higher overall cost than for connecting the smaller generating plants to lower voltage systems.

Quantification of Exploitable Tidal Energy Resources in UK Waters
R/3671/4 48 R.1349
Any issues associated with access to the transmission network will be the most costly and technically demanding obstacle to overcome for marine renewable generation, and should be addressed first, whilst issues associated with the distribution network, and other less expensive or technically demanding considerations can then be addressed, on an individual or group basis within localised areas. The Path to Power study highlighted the importance of potential grid access, highlighting that many areas of tidal resource are located in more remote areas where grid capacity is extremely limited (ABPmer, 2006b, Bond Pearce, 2006, Climate Change Capital, 2006).
7.1.1 Distance to Electrical Grid Infrastructure Some of the strongest tidal currents around the UK are within estuaries and near coastal waters and these are potentially very good locations for tidal power generators because they are sheltered, close to shore, and often close to sites of very high power demand. However, these locations frequently have a limited water depth and are commonly subject to multiple constraints from other marine activities. This means that most tidal developments are likely to be located a reasonable distance from the electric grid infrastructure. In time, future prototype devices will transfer energy via the local distribution network however, as the UK tidal renewable industry develops and moves towards the grid connection of significant projects then there will be an increasing utilisation of (i.e. impact on, use of and/or connection to) the transmission network (GIS Figure 65) for this facility. High voltage direct current (HVDC) technology is generally adopted for longer distance cable based transmission as it does not suffer from excessive and wasteful capacitive current effects that would occur with the use of alternating currents (AC). For onshore transmission AC is preferred as it is more cost effective, but connection will be constrained by the capability of the local network, (particularly in the north of the UK), with AC connection likely to be the most cost-effective for small local groupings but with HVDC being more appropriate for larger more distant groupings, particularly when feeding into weak parts of the existing transmission grid. If significant amounts of generation are to connect around the periphery of the system, particularly in the north, reinforcement of the local onshore networks will also be necessary. Overhead cables are subject to complicated planning applications which can be avoided using HVDC cables, though these will also require planning approval. There are, in practice, no technical limitations to transmission lengths for HVDC cables, but 70km is the longest presently in use, and 100km is quoted as possible (Jones & Lars, 2006). HVDC Light is a new (2002) HVDC transmission system, based on VSC (voltage source converters) technology. It takes one year for VSC based HVDC systems to go from contract date to commissioning. The longest submarine VSC HVDC cable installation is presently the 270km long 450 kV HVDC link between

Quantification of Exploitable Tidal Energy Resources in UK Waters
R/3671/4 49 R.1349
Poland and Sweden and it is soon exceeded in length by the 580km long cable between Norway and the Netherlands. Both HDVC and VSC HDVC cable technologies are able to span sufficient distances to link all areas of UK tidal resource with the electricity network, however, cost combined with other economic, installation and maintenance factors will ultimately determine maximum cable lengths and potentially influence areas of exploitable resource.
7.1.2 Maximum Cable Depth The limitations on maximum cable depths are unlikely to affect the development of tidal farms as depths of up to 1,500m can presently be reached. As discussed in Section 3.2 the maximum deployment depths for the next 10 years are unlikely to exceed 100m. However, as with cable distances, other factors including installation and maintenance costs could limit the maximum cable depths that are feasible and potentially influence areas of exploitable resource.
7.1.3 Grid Access Capacity The problem of connecting new capacity onto the electricity networks can be considered in three parts; capturing the energy, then connection of the resource locally, and the subsequent transmission of the associated power flows to load centres elsewhere within the UK (DTi, 2002). Local grid access considerations will be required, as illustrated by CE Electric (northern England) who have introduced a requirement for the completion of stability studies before connection offers can be made for new generation projects. These studies define how the addition of new generation would affect the systems ability to recover after a network fault and, in certain cases, may prevent connection of generation where it may be found that the new generation would be detrimental to the secure operation of the existing distribution network. Studies into grid connection issues state that between 2006 and 2010 in general, connections of tidal stream projects will be possible to the distribution network, without the requirement for significant network reinforcements, throughout the local regions of England, Wales and Scotland as long as this does not adversely impact on existing or future network transfer capacity ‘bottle-necks’ or the secure operation of the network (Econnect, 2006). Assuming that they meet the above criteria these projects may still have to overcome the standard distribution network technical hurdles associated with circuit and transformer thermal limitations, switchgear fault level limits and distribution network voltage control issues such as voltage rise and step. These can be met through optimisation of the connection design and ultimately are challenges that can be managed and mitigated more easily by the generation project developer. In the north and west coasts of Scotland grid capacity is extremely limited today and is likely to remain so until beyond 2020. This implies that the large-scale deployment of tidal technologies in these areas will not be possible until this issue is resolved. The

Quantification of Exploitable Tidal Energy Resources in UK Waters
R/3671/4 50 R.1349
picture in the other areas of tidal resource is more positive, however it is noted that a large area of potential tidal energy resource is still subject to these constraints (Climate Change Capital, 2006). In Wales, to avoid distribution network ‘bottle-necks’ without significant reinforcement of the local distribution network, prototype devices to small arrays may need to seek direct connections to relatively key network nodes within the distribution network, such as the 33kV busbar of a local 33/132kV Bulk Supply Point (BSP) (Econnect, 2006). Research suggests that grid connection issues are likely to play an important role in whether tidal energy resources can fulfil their potential to meet wide scale UK energy needs.
7.2 Support Structure When installed, the devices must be held reliably in place taking into account the harsh marine environment. Currently there are four options under consideration, as shown on Figure 12: Gravity structures are massive steel or concrete attached to the base of the
units to achieve stability by their own inertia; Piled structures are pinned to the seabed by one or more steel or concrete
piles. The piles are fixed to the seabed by hammering if the ground conditions are sufficiently soft or by pre-drilling, positioning and grouting if the bedrock is more solid. In its simplest form, the fixed piled structure may be a mono-pile (single pile) penetrating the seabed with the turbine fixed to the pile at the desired depth of deployment;
Floating structures provide a more convincing solution for deep-water
locations. In this case the turbine unit is mounted on a downward pointing vertical column rigidly fixed to a barge. The barge is then moored to the seabed by chains or wire ropes which may be fixed to the seabed by drag, piled or gravity anchors, depending on the seabed condition;
Hydrodynamically secured structures use a combination of gravity and the
increasing current flows around the structure to generate a downward force via inverted hydrofoils, thus as flows increase the securing forces also increase.
Gravity structures provide a ‘simple’ solution to fixing a device in that the mounting is essentially placed on the seabed, with no other requirements to attach it. This has the added benefit of being removed with little disturbance to the seabed, and avoids piling into the sub-strata. Monopile installation is an already established technique, used by the windfarm industry, and seems to be the most favoured option. However, this is currently limited to depths less than 50m due to the capabilities of available jack-up barges. One developer stressed that future commercial tidal farms would not be deployed from

Quantification of Exploitable Tidal Energy Resources in UK Waters
R/3671/4 51 R.1349
highly visible twin piles that it’s test rig are mounted on, but that the future for their technology was on gravity based support structures below the sea surface.
(Source: University of Strathclyde Website, April 2007)
Figure 12. Support structure concepts Hydrodynamically secured structures provide a less conventional fixing concept (not shown in Figure 12 above), however, like gravity structures have minimal impacts on the seabed, with principal advantages of cost and speed of installation. They also lend themselves well to small scale installations, with low construction costs and short deployed times of as low as 4 hours. Such support structures would work best in regions where the currents are strongest and could be located very easily in deep or shallow water, which could potentially enable devices to be mounted in more locations. The installation of marine current devices will present their own unique difficulties. Constructing foundations and installing equipment when the currents are running will be challenging and in many places only a few minutes of slack water can be expected each day. In areas of mobile sediments scouring around the base of even temporary support structures, such as jack-up barges, can potentially be significant even over very short periods.
7.3 Engineering Challenges Cavitation and turbulence are other engineering and technological considerations that need to be overcome to ensure efficient and long-lived deployments. Cavitation is caused by relatively high velocities at the tips of the rotor blades leading to the formation of cavities along the blade. Even though design to avoid cavitation in hydraulic pumps and propellers is well understood a different approach may be necessary for marine current turbines because of their larger plane or rotor area. Cavitation is also sensitive to water depth and so some cavitation problems can be

Quantification of Exploitable Tidal Energy Resources in UK Waters
R/3671/4 52 R.1349
avoided by placing units in deeper water where cavitation issues are reduced. Further research is therefore required to understand the problems of cavitation and whether prudent choices of blade profiles and materials can be made to avoid cavitation efficiency loss and damage problems. The velocity of the flow at a given location can vary greatly across the active generating area because of turbulence. This could lead to significant variations in loading across the active area and result in associated vertical sheer fatigue and vibration problems. Understanding the turbulence levels is important not only to the siting of individual units (e.g. avoiding areas with strongly stratified flow) but can also inform the device design. The turbulent structure of the flow field is another important driver affecting the design of components to resist fatigue. Design codes for marine current devices will need to refer to the likely design turbulence levels and understanding what these levels are will be is important to setting realistic limits to design. Prototype testing will be necessary in determining the importance of these issues.
7.4 Wave Climate The wave climate at the location of a tidal farm site must be thoroughly assessed and quantified to provide essential design and performance information. In general, wave regimes (both sea and swell derived) can affect the tidal current flow, and understanding how this might impact on energy yields is very important. Additionally, the device needs to be mounted at a depth such that the driven components are not exposed to the air if a large wave trough passes over it. In the case of units which are moored to the seabed and have positive buoyancy, calculations must be made to ensure that the device will not be forced into the seabed. Other than these device specific impacts, the normal assessment of the capability of the device and associated moorings must be proven to be able to withstand the wave forces that are likely to act upon it.
7.5 Seabed Sediments and Geology The geophysical characteristics of the seabed of a tidal farm are of great significance to the development of a site. The mounting of the unit (particularly if piling is required) will require the seabed and sub-strata to be described so that the installation method can be selected and potential costs assessed. Seabed roughness will determine the hydraulic characteristics of the tidal streams, with a smooth seabed more likely to promote laminar flows with low turbulence effects, providing preferential conditions for more efficient turbine operation. Additionally, the dynamic properties of the seabed must be considered to evaluate accretion and erosion rates to predict future change and the possible impact on the structures. A less significant but non-the-less important consideration should be to gauge the

Quantification of Exploitable Tidal Energy Resources in UK Waters
R/3671/4 53 R.1349
potential of suspend sediments settling on the device structure and causing a reduction in operating efficiency.
7.6 Maintenance All mechanical devices such as electricity generators require maintenance to maximise the longevity of the component parts and to optimise the operating efficiency. A well planned maintenance programme adds considerable value to the development which is ultimately reflected in the unit cost of the electricity generated, known as the Operation and Maintenance (O&M) element of the lifetime cost. Maintenance directly affects the amount of non-operational time or ‘down-time’ for a device, and minimising this is clearly of great importance. Planned down-time for routine maintenance requirements will include lubrication, inspection, testing and cleaning. Some devices have the capability to be raised to the surface to facilitate routine maintenance, others will be fixed underwater and will require divers or remotely operated vehicles (ROVs) to complete the majority of maintenance. Unplanned maintenance will require a reactive response plan in the event of an unexpected downtime caused by general debris such as discarded fishing nets. Devices will need to be routinely cleaned further to reduce biological growth or ‘bio-fouling’, and possibly from drifting or settling sediment. Any structure installed in a marine environment will act as an artificial reef attracting a wide variety of marine organisms such as barnacles and seaweeds. This could cause significant fouling which might impair moving parts and affect the performance and efficiency of the device. Moving parts will to some extent be self-cleaning as their motion will deter organisms from settling on them. Several methods for preventing fouling have been proposed including the use of antifouling paints and sonic and ultra sonic systems. Both methods have their benefits and drawbacks which necessitate further research. Estimations of bio-fouling rates and the management of marine growth must be considered in the early stages of the development to prevent costly losses due to inefficiency, maintenance downtime and the lifting of devices (unless designed to be routinely lifted) for cleaning.
7.7 Markets/Economics Marine renewable energy resource development is not yet commercially profitable, and the lack of operating devices creates considerable uncertainty over the potential future viability. For tidal stream electricity to become economically viable it must provide electricity at a comparable price to other technologies in the energy marketplace, and if it is more expensive to produce then the premium must be offset against other social, economic and environmental benefits such as promoting non-polluting forms of energy and reducing carbon dioxide emissions. The public and political momentum and pressure gathering in favour of the increased use of clean renewable energy sources is

Quantification of Exploitable Tidal Energy Resources in UK Waters
R/3671/4 54 R.1349
expected to continue, which will support the growth of the tidal stream sector. Government targets of 10% of electricity produced from renewable sources by 2010, are promoting and supporting the growth of the tidal stream market. As for other offshore energy developments, increased costs are incurred, in comparison to terrestrial alternatives, due to the nature of installation (transmission cables and devices), operation, maintenance and decommissioning at sea. To illustrate this the present day cost per unit time (kWh) for non-renewable electricity producers is ~2.5p/kWh (Combined Cycle Gas Turbine, CCGT), onshore wind is ~4p/kWh and offshore wind is ~6p/kWh. The estimated cost per kilowatt-hour of electricity is between 12 and 15p. Figure 13 shows the cost of generating electricity from various energy sources (tidal stream devices are included in the ‘Wave and Marine’ sector).
(Source: Royal Academy of Engineering, 2004)
Figure 13. Cost of generating electricity (per kWh) with no cost of CO2 emissions included
An expanded analysis of tidal stream devices within this sector is shown in Figure 14 as published by the Carbon Trust in their ‘Future Marine Energy’ report (Carbon Trust, 2006).

Quantification of Exploitable Tidal Energy Resources in UK Waters
R/3671/4 55 R.1349
(Source: Carbon Trust, 2006)
Figure 14. Estimated costs of energy today Reductions in the cost of tidal stream energy will arise as the installed capacity increases (Figure 15), and as private sector interest increases.
(Source: Carbon Trust, 2006)
Figure 15. UK tidal stream cost-resource curves

Quantification of Exploitable Tidal Energy Resources in UK Waters
R/3671/4 56 R.1349
Future predictions of the unit cost evolution are shown in Figure 16 below, which indicate that tidal stream devices will be approximately twice as expensive as offshore wind in 2020 (cost in £/MWh equivalent annual cost, EAC) as opposed to the present estimate of being three times as expensive.
! ! !
!
!
!
!
!
!
!
!
!
!
!!
!!
!!
!!
(Source: Adapted from Office of Gas and Electricity Markets, 2005)
Figure 16. Summary of best estimates of unit cost evolution At present, tidal power is arguably one of the more expensive in capacity terms of the available technologies, certainly at this stage of its development. While commercial deployment of devices will help to drive down the capital and operating costs, tidal power will need additional support while the successful concepts become competitive renewable energy options. The Government is proposing ten support levels to different renewable technologies; such support will be necessary to enable marine renewable technologies achieve their potential (DTI, 2007). Two examples of measures in place are: Businesses are taxed under the Climate Change Levy for any gas and
electricity they use. They are exempt from this tax if they can show with Levy Exemption Certificates (LECs) that the electricity they purchased was from renewable sources.
The Renewables Obligation requires suppliers to prove that a proportion of the
electricity they sell comes from renewable sources. This proportion is being gradually increased to reach 10% by 2010. To prove they meet this percentage, suppliers are issued with Renewable Obligation Certificates (ROCs) when they buy energy from a renewable source.

Quantification of Exploitable Tidal Energy Resources in UK Waters
R/3671/4 57 R.1349
Another important aspect of realising the potential of tidal devices is that they are likely to be located well away from centres of population and the established transmission and distribution network. The availability of grid connections at a date and cost that does not prevent commercial deployment of tidal stream and other renewable energy devices has to be urgently addressed by the DTI and Ofgem (DTI, 2007). The Energy Act 2004 provides powers for the Secretary of State to put in place new regulatory arrangements for offshore electricity transmission. The development of offshore transmission is necessary to meet the requirements of new offshore wind farms and the next generation of renewables is recognised in the Energy White Paper 'Our energy future-creating a low carbon economy' (DTi, 2003). As with all new technology developments, it takes time for equipment and other technological costs to reduce once the suppliers’ market has been established and gained confidence. The evolution of the offshore wind farm industry and it’s associated technologies, particularly cable and power infrastructure related, will allow the tidal sector to capitalise on the experience and resultant technology.
8. Conclusions
8.1 Device Groups and Areas Physically Suitable for Technology Deployment Over tidal stream 35 devices were identified and of these 21 had an appropriate level of information to be included in this study. These technologies have been analysed using device groups identified in existing research, as below: Group A Horizontal axial-flow (single or bi-directional directional)
turbines (fixed turbine direction); Group B Horizontal axial-flow multiple direction (yawing) turbines. This
type of turbine can rotate according to the direction of the tidal flow direction;
Group C Vertical axis (cross-flow turbines). These turbines rotate regardless of the flow direction;
Group D Oscillating hydrofoil; and Group E Air Injection technology (hydraulic).
Mean Spring Peak Current speed was used as a primary resource parameter to interrogate a GIS database, based on the DTi Atlas, and map areas that are suitable for technology deployment. The tidal current resource has been determined as the key physical parameter that dictates potential deployment locations indeed, if the depth constraint is removed the total area suitable for tidal technology deployment is only

Quantification of Exploitable Tidal Energy Resources in UK Waters
R/3671/4 58 R.1349
increased by 1.5%. Maximum achievable cable depths will not affect the development of tidal farms as depths of up to 1,500m can presently be reached. All areas of suitable resource are located in areas that are less than 50km from land and therefore this physical constraint also provides no limit the location of potentially exploitable tidal resource. The elliptical form of the tidal flows was also investigated and discarded as a primary factor in determining the physical areas suitable for tidal technology deployment, as it was found that eccentricity has minimal variability in areas of good tidal resource located within UK waters. Research has indicated that bi-directional horizontal axial-flow (Group A) and vertical axial flow (Group C) technologies have the lowest required operating currents, with suitable deployment locations from 1.5m/s (MSPC) upwards. Research has also found that multi-directional horizontal axial-flow (Group B) and air injection technologies (Group E) have the potential to be deployed in sites with MSPC speeds from 2m/s and oscillating hydrofoil devices (Group D) can be sited at location with MPSC speeds of 2.2m/s and above. The overall potential area for deployment is similar between Groups A and C. These groups have much larger potential physical area for deployment than Groups B, D, and E, with both potentially covering over 3% of the UKCS. Based on Physical constraints alone, Group A has the greatest potential deployment area, and as this group has both the minimum and maximum depth values combined with the shared minimum MSPC, it encompasses all potential sea areas that are suitable for tidal technology deployment which is almost 28,000km² covering over 3.1% of UK waters. With the exception of Group A, all technology groups have the largest potential deployment areas in deep water (>40m) followed by intermediate (25-40m) and then shallow (<25m). Group A does not follow this trend as it includes devices that can operate in as little as 4m of water which results in increased potential deployment area in shallow water, less in the intermediate and the maximum potential deployment area in deep water. When all technology groups are considered, potential deployment areas are similar in shallow (7,754km²) and intermediate (7,167km²) waters while there is almost double the potential deployment area in deep (13,011km²) water. Due to the overlap between technology groups the total AOI suitable for any tidal technology deployment is the same as that for Group A, at 27,933km². Particular hotspots include the Channel Islands, south Isle of Wight, Portland, Ramsey Island, north of Bardsay Island, north-west Anglesey, North Channel, Pentland Firth and Orkney Islands which all have the potential to support 17 or more devices. Less than a third of the total AOI is suitable for the deployment of four or more device types.

Quantification of Exploitable Tidal Energy Resources in UK Waters
R/3671/4 59 R.1349
8.2 MSP Constraints The project has defined 12 existing activities that exclude the potential deployment of tidal technologies. When the exclusion zones are applied to the total AOI that has been identified for tidal technologies, the net loss is 12%. Existing marine cables, with a safety zone of 500m, account for over half of the excluded AOI while aggregate licence areas (18%) and pipelines (14%) also provide significant contributions to the total area of exclusion. All other exclusion constraints result in less than 1% of the AOI to be lost and no Fish Farms are located within the AOI. More areas of exclusion constraints are located in shallower areas with almost half of the excluded AOI located shallow depth zone. The remaining exclusion area is split with 27% of excluded in intermediate water depths and 25% in deep water. Several of the exclusion activities including aggregate extraction, offshore wind farms, anchorage areas, maintenance dredging, and fish farms are not present in the deep depth zone. Overall, the east region is the most widely effected by the exclusion constraints. Some activities have the potential to co-exist with tidal technologies, usually because they utilise different aspects of the marine resource. Six groups of potential co-existing activities have been investigated including biological, military, navigation, non-renewable energy resources, environmental, and recreation. Several of these activities are present in parts of the AOI and the precise circumstances where these activities may be able to co-exist will vary greatly between different local areas of tidal resource, and individual sites of interest will have to be fully investigated as part of the planning for technology deployment. Navigation is likely to offer the largest potential conflict resulting from the investigated co-existing constraints.
8.3 Potential Energy Yields Tidal technology is in its infancy and therefore precise specifications of devices that are required for detailed capacity and energy yield calculations presently rely on many assumptions. These issues have been further complicated in this project as a full range of potential technologies have been considered by averaging values into distinct technology groups. All assumptions and constants applied have been listed in Appendix B. A range of detailed parameters have been considered when calculating potential energy yields for each cell in the database, including:
Annual tidal currents; Usable potion of the water column; Size of device active area for devices in each technology group; Maximum and minimum device sizes; Gearbox transmission efficiency Generator efficiency;

Quantification of Exploitable Tidal Energy Resources in UK Waters
R/3671/4 60 R.1349
Lateral spacing of turbines arranged in rows; Longitudinal spacing between turbine rows; Power rating for deployed devices from each technology group; Minimum and minimum tidal farm power ratings; and Areas unsuitable for deployment due to other marine uses or users.
This is the first time that all of these parameters have been considered in a singe study to develop a detailed investigation of potential energy yields. The results show that potentially installed tidal energy generation capacities are estimated as almost 36GW for UK waters. This is split between 10.3GW in shallow waters and 25.6GW in intermediate depths. Due to uncertainties over long-term turbine designs potential installed capacity was not calculated in waters greater then 40m deep. The total predicted annual energy yield for UK waters is 94.4TWh/y and over two thirds of this is located in intermediate waters between 25 and 40m deep. The overall energy yields are quite similar between all technology groups. These values do not account for potential disruptions to energy capture resulting from down-time where devices are not operational due to planned or unplanned maintenance. The predicted installed capacities annual energy yields assume that all potentially suitable areas of UK waters up to 40m deep, that are free from existing exclusion constraints, are developed for tidal technology deployment. However, with present technologies this would require approximately 200,000 devices to be deployed in over 11,000km² tidal resource, and this is therefore presented as a reference to the theoretically technically achievable maximum energy yield, should political and economic factors allow all areas of good tidal resource to be developed for energy extraction. The actual extent of tidal technology deployment over the next 5-10 years will depend on many technological, economic and political factors. In order to quantify the likely exploitable resource in the next 5-10 years the fifty cells with the highest energy yield for an individual technology device, have been analysed. These fall into 10 distinct geographic locations and suggest that the deployment of fifty 30W tidal farms, totalling around 550 devices with the combined capacity of 1,500MW, has the potential to generate over 4.3 terawatt hours of energy per year.
Further to this it has been calculated that if the farm capacity were not capped to 30MW the potential installed capacity in these could reach over 10,000MW generating up to 28TWh/y of energy from over 3,000 installed devices. However it is noted that a potential barrier to the deployment of such large capacities will be the cumulative effects on energy removal by successive 30MW rated arrays in areas confined areas of tidal resource. However, it is possible that future technology developments will enable the deployment of turbines with power ratings of tens or even hundreds of megawatts and the deployments of such devices could potentially result in the predicted installed capacities being realised.

Quantification of Exploitable Tidal Energy Resources in UK Waters
Comparisons with existing research are complicated due to the many assumptions and methodologies that can be applied when attempting to calculate complex parameters for technologies that are at an early development stage. This process is also hampered as many studies do not provide detailed methodologies or include a full explanation of assumptions that have been made. The majority of existing research is focused on local areas or does not to consider the full range of detailed parameters required to make a suitable resource calculation. It is therefore believed that the present study offers a significant enhancement in tidal energy resource quantification and provides valuable results about the potential installed capacity and annual energy yields in UK waters.
8.4 Other Considerations There are many other issues that will influence the potential deployment of tidal technologies which merit further investigation but remain beyond the scope of this study. The design of device support structures will effect whether devices are presenting the upper reaches of the water column and potentially influence the viability deployments in deep water. In turn support structures will be influenced by seabed sediments and geology which could potentially add further constraints to areas of good tidal resource. The maintenance of and overall up-time of devices will directly effect energy production and will need to be carefully planned in accordance with other marine activities. Research also indicates that grid connection and capacity issues are likely to play an important role in whether tidal energy resources can fulfil their potential to meet wide scale UK energy needs. Further uncertainty is added by the energy markets and the overall economic viability of tidal energy converters. All of these issues will have to be carefully monitored as tidal technologies more from test installations to commercial deployment arrays.
9. Recommendations The methodology developed in this project provides good regional analyses of potential tidal energy resources and it is suggest that additional work on two specific enhancements would add considerable benefit to the results presented in this report.
9.1 Refine Results Using More Specific Technology Parameters The project has adopted an approach of generalising specific technology parameters into average technology groups. This has increased to the amount of assumptions and generalisations that have been incorporated into the analysis methodology. It is suggested that the application of the same methodology using individual technologies
R/3671/4 61 R.1349

Quantification of Exploitable Tidal Energy Resources in UK Waters
R/3671/4 62 R.1349
that have good specification data available, would result in a better prediction of the exploitable UK tidal resources resulting in the following benefits: Refined energy calculation; Precise turbine power ratings; Better information about device efficiencies; Includes longitudinal spacing between device deployment rows; Improved data regarding maximum and minimum device sizes; and Fewer assumption about tidal farm sizes and maximum device ratings.
9.2 Further Investigation into Specific Sites of Identified Tidal Resource
A consistent methodology has been applied across the UKCS using datasets that are suitable for regional scale analysis. It is suggested that constraints analysis and energy calculation methodology could provide enhanced results if applied at a local scale, to investigate specific sites of identified tidal resource. Further research at this scale would require high-resolution datasets and it is anticipated that this would result in the following benefits:
Enhanced description of the raw tidal resource; Quantify resources in constrained areas, such as narrow channels; Validation of the tidal resource using site-specific field measurements; Localised depth datasets; Detailed analysis of all potential MSP constraints present due to other marine
uses and users; Array planning to consider directions of local tidal currents; Further investigation into electricity grid connection and capacity issues; and Opportunity to assess the cumulative effects of multiple-farm deployments.
10. References ABPmer (2004). Atlas of UK Marine Renewable Resources, ABPmer. Department of Trade and Industry. ABPmer (2005). Potential Nature Conversation and Landscape Impacts of Marine Renewable Energy Development in Welsh Territorial Waters. Countryside Council for Wales. ABPmer (2006a). The Potential Nature Conservation Impacts of Wave and Tidal Energy Extraction by Marine Renewable Developments. Countryside Council for Wales.

Quantification of Exploitable Tidal Energy Resources in UK Waters
R/3671/4 63 R.1349
ABPmer (2006b). BWEA - npower juice ‘Path to Power’, Stage 2: The stakeholder/Statutory Bodies View on Deployment. ABPmer, Terence O’Rourke, Risk & Policy Analysts, Geotek, Hartley Anderson and Coastal Management for Sustainability (2006). Marine Spatial Planning Pilot. Bahaj, A. S. & Myers, L. (2004). Analytical estimates of energy yield potential from Alderney race (Channel Islands) using marine current energy converters. Renewable Energy, 29, 1931-1945 Binnie, Black & Veatch and IT Power (2001). The Commercial Prospects for Tidal Stream Power. Department of Trade and Industry. Black & Veatch (2005). Phase II UK Tidal Stream Energy Resource Assessment, Part of the Carbon Trust Marine Energy Challenge. Carbon Trust Black & Veatch (2004). Tidal Stream Energy Resource and Technology Summary Report, Part of the Carbon Trust Marine Energy Challenge. Carbon Trust Bond Pearce (2006). BWEA - npower juice ‘Path to Power’, Stage 1: Wave and Tidal Stream Energy Around the UK Legal and Regulatory Requirements Bryden, I. G. (2006). The marine energy resource, constraints and opportunities. Maritime Engineering, 159, MA2, 55-65 Canadian Hydraulics Centre (2006). Canada Ocean Energy Atlas (Phase 1) Potential Tidal Current Energy Resources Analysis Background. Carbon Trust (2006). Future Marine Energy. Results of the Marine Energy Challenge: Cost competitiveness and growth of wave and tidal stream energy. Centre for Renewable Energy Sources (2006). Ocean Energy Conservation in Europe - Recent advancements and prospects. European Comission. Climate Change Capital (2006). The Path to Power. The British Wind Energy Association and npower juice. DTi (2002). Concept Study: Western Offshore Transmission Grid. DTi Pub URN 02/680. ~Contractor PB Power DTi (2003). Energy White Paper. Our Energy Future - Creating a Low Carbon Economy DTi (2005). Developing, Installation and Testing of a Large Scale Tidal Current Turbine.

Quantification of Exploitable Tidal Energy Resources in UK Waters
R/3671/4 64 R.1349
DTi (2007). Economic Viability of a Simple Tidal Stream Energy Capture Device. URN Number: 07/575. Econnect (2006). BWEA - npower juice ‘Path to Power’, Stage 3 Discussion Document - BG Electricity Network Access. Electric Power Research Institute (2006). Methodology for Estimating Tidal Current Energy Resources and Power Production by Tidal In-Stream Energy Conversion (TISEC) Devices. Environmental Change Institute (2005). Variability of UK marine resources. Carbon Trust. Faber Munsell & Metoc (2007). Scottish Marine Renewable Strategic Environmental Assessment Environmental Report. Scottish Executive. Forum for renewable energy in Scotland (2004). Harnessing Scotlands Marine energy Potential. Garrad Hassan (2002). Western Isles Renewable Energy Stud - Part 1: Resource Investigations. Scottish Executive Jones, P. & Lars, S. (2006). The Challenges of Offshore Power Systems Construction - Troll A, Electrical Power Delivered successfully to an Oil and Gas Platform in the North Sea. European Wind Energy Conference 2006. MacKay, D. J. C. (2007). Under-estimation of the UK Tidal Resource. Draft 2.5 Metoc (2004). Seapower SW Review - Resources, Constraints and Development Scenarios for Wave & Tidal Stream power. South West of England Regional Development Agency. Metoc (2007). UK Tidal Resource Review. Sustainable Development Commission. Myers, L. & Bahaj, A. S. (2004). Simulated electrical power potential harnessed by marine current turbine arrays in the Alderney Race. Renewable Energy, 30, 1713-1731 Office of Gas and Electricity Markets (2005). Assessment of the Benefits from Large-Scale Deployment of Certain Renewable Technologies. PIANC, (1997) Approach Channels a Guidance For Design. Final Report of the joint working group PIANC and IAPH in cooperation with IMPA and IALA. Supplement to bulletin No 95. June 1997.

Quantification of Exploitable Tidal Energy Resources in UK Waters
R/3671/4 65 R.1349
Project Management Support Services (2006). Wales Marine Energy Site Selection. Welsh Development Agency. Royal Academy of Engineering (2004). The Cost of Generating Electricity. Royal Haskoning (2005). Strangford Lough Marine Current Turbine Environmental Statement. Marine Current Turbines. Royal Yachting Association (2005). The RYA’s Position on Offshore Energy Developments. Salter, S. H. (2007). DTi Energy Review Question 2. Possible Under-Estimation of the UK Tidal Resource.
10.1 Online References DTi Website (April 2007) http://www.dti.gov.uk/files/file31313.pdf Carbon Trust Website (April 2007) http://www.carbontrust.co.uk/technology/technologyaccelerator/performance.htm SuperGen Marine Energy Consortium Website (April 2007) http://www.supergen-marine.org.uk/news.php University of Southampton Website (April 2007) http://www.energy.soton.ac.uk/research/marine_07arrays.html University of Strathclyde Website (April, 2007) http://www.esru.strath.ac.uk/EandE/Web_sites/03-04/marine/tech_consider.htm

Appendices

Appendix A Devices Considered in the Study

Quantification of Exploitable Tidal Energy Resources in UK Waters
R/3671/4 A.1 R.1349
Appendix A. Devices Considered in the Study A1. Device Group A - Horizontal Axial-Flow Fixed Bi-Direction
Device Name Developer Weblink Image
Axial-flow Rotor Turbine Verdant Power http://www.verdantpower.com/
Compact Tidal Generator
University of Southampton
http://www.epsrc.ac.uk/pressreleases/compacttidalgenerator.htm
HXE Hydrohelix Energies http://www.hydrohelix.fr/
MORILD Statkraft (Norway) and Hydro Tidal
Energy Technology (HTET)
http://www.statkraft.com/pub/innovation/tidal_power/MORILD_demonstration_plant
/index.asp

Quantification of Exploitable Tidal Energy Resources in UK Waters
R/3671/4 A.2 R.1349
Device Name Developer Weblink Image
Open-Centre Turbine OpenHydro http://www.openhydro.com/
RTT Rotech Tidal Turbine Lunar Energy http://www.lunarenergy.co.uk/
SeaGen, SeaFlow Marine Current Turbines (MCT) http://www.marineturbines.com/home.htm
Swanturbines Swanturbines http://www.swanturbines.co.uk/
The Blue Concept (Hammerfest Strom
Turbine) Hammerfest Strom http://www.e-tidevannsenergi.com/

Quantification of Exploitable Tidal Energy Resources in UK Waters
R/3671/4 A.3 R.1349
Device Name Developer Weblink Image
The Sea Snail (mounting for
turbines) Aberdeen's Robert Gordon University
http://www.rgu.ac.uk/cree/general/page.cfm?pge=10769
Tidal Turbine Tidal Generation http://www.tidalgeneration.co.uk/
Tidal Turbine Generator (TTG)
Clean Current Power Systems http://www.cleancurrent.com/
TidEL Tidal Stream Generator SMD Hydrovision http://www.smdhydrovision.com/products/
?id=27

Quantification of Exploitable Tidal Energy Resources in UK Waters
R/3671/4 A.4 R.1349
A2. Device Group B - Horizontal Axial-Flow Fixed Multi-Direction
Device Name Developer Weblink Image
SST TidalStream Turbine
TidalStream, J.A. Consult http://www.tidalstream.co.uk/
Underwater Electric Kite UEK Systems http://uekus.com/

Quantification of Exploitable Tidal Energy Resources in UK Waters
R/3671/4 A.5 R.1349
A3. Device Group C - Vertical Axis Turbines
Device Name Developer Weblink Image
Blue Energy Ocean Turbine (Davis Hydro Turbine)
Blue Energy http://www.bluenergy.com/technology.html
GHT (Gorlov Helical Turbine) GCK Technology http://www.gcktechnology.com/GCK/articl
es_Memo_To_Tides.html
Kobold Turbine, ENEMAR Ponte di Archimede http://www.pontediarchimede.it/language
_us/
Waverotor Ecofys http://www.ecofys.nl/nl/expertisegebieden/product_systeemontwikkeling/waverotor.
htm

Quantification of Exploitable Tidal Energy Resources in UK Waters
R/3671/4 A.6 R.1349
A4. Device Group D - Oscillating Hydrofoil
Device Name Developer Weblink Image
Pulse Generator Pulse Generation http://www.pulsegeneration.co.uk/
A5. Device Group E - Air Injection Technology
Device Name Developer Weblink Image
HydroVenturi (Rochester) HydroVenturi http://www.hydroventuri.com/

Appendix B Assumptions and Constants Applied

Quantification of Exploitable Tidal Energy Resources in UK Waters
R/3671/4 B.1 R.1349
Appendix B. Assumptions and Constants Applied Value Assumption/Description
Device groups Predictions have been made using averaged values for each technology group, therefore it has been assumed that these values are representative for all technologies in each group.
Tidal currents Tidal flow speeds and MSPC values have been generated using the tidal constituents M2 and S2.
Water depth Water depth has been calculated at LAT and has been analysed at the same scale as the input numerical model data cells.
Operating current speeds
Site selections are primarily based on the minimum MSPC values which were supplied by technology developers. No maximum MSPC limitations are imposed.
Deployment depth The maximum exploitable depth is capped at 100m.
Eccentricity The mean eccentricity of the tidal resource within the area of interest (AOI) is 0.995, therefore it is assumed that there is no change in performance between bi-directional and multi-directional turbine deployments due to the eccentricity of tidal flows.
Distance from land The maximum distance for land for tidal deployments has assumed to be 50km, however all areas of potential resource were located within this limit.
MSP Exclusion Constraints Tidal devices cannot be deployed in an area with an existing exclusion constraint.
MSP co-existing constraints
Areas with existing uses or users that may be able to co-exist with tidal technologies have been included in the study.
Near-bed currents The active area of tidal devices will not be located in the lower 25% of the water column to avoid lower flows due to near- bed friction effects.
Small craft buffer A 3.5m buffer will be present at the top of the water column to ensure clearance for small craft.
Waves A buffer equal to the mean wave height has been excluded at the top of the water column.
Useable area of water column 0.75 x water depth, minus mean wave height, minus 3.5m for a small craft.
Active Area (Ao) Calculated individually for each device group based on useable area of water column. Capped to a maximum of 23.5m.
Device height Active area plus required support structure to place the device into the correct part of the water column.
Device Width Calculated individually for each device group, based on device height.
Lateral spacing Spacing between devices on deployment rows was assumed to be 1 device width.
Length of turbine rows This calculation has assumed that the deployment rows are aligned directly across the 1km2 areas and therefore row lengths cannot exceed 1,000m.
Longitudinal spacing between rows Calculated at 15 times turbine height, but limited to 1 row/km² for all calculations.
Device casing All devices are un-shrouded.
Device capacities Calculate into bands based on depth and current speeds in deployment cells. Limited to a minimum of 0.1MW and maximum of MW. Bandings 0.1, 0.15, 0.2, 0.25, 0.5, 0.75, 1.0, 1.5, 2.0, 2.5, 3.0, 4.0, 5.0MW.

Quantification of Exploitable Tidal Energy Resources in UK Waters
R/3671/4 B.2 R.1349
Value Assumption/Description
Deployment Capacities The maximum deployed capacity per tidal farm has been assumed to be 30MW. The minimum capacity has bee set as 5MW.
Depths for energy yield Energy yield calculation have only been calculated for cells up to 40m deep as device specifications in deep water remain unresolved ad it s unlikely that these areas will be exploited in the next 5-10 years.
Uptime All calculations have assumed a 100% uptime for devices.
Current speed velocity (V) Calculated at half hour intervals for 1-year for each cell.
Water density (ρ) 1,025kg/m3
Power coefficient (Cp) 0.45
Gearbox transmission efficiency (ŋ1) 0.94
Generator efficiency (ŋ2) 0.92

Appendix C Methodology for Estimating the Rated Device Speed and Power for a Site

Quantification of Exploitable Tidal Energy Resources in UK Waters
R/3671/4 C.1 R.1349
Appendix C. Methodology for Estimating the Rated Device Speed and Power for a Site
To estimate the rated speed and hence the rated capacity for a site the following methodology was applied. Half-hourly current speed data (for a 30 day period) for a range of MSPC speed and depth combinations (Table C1) was used to calculate the realistic maximum energy yields using the power equations and device size calculations as detailed in Section 6. This generated a series of energy yields (in Watts) which were then summated for the respective flow speed intervals in steps of 0.1m/s. The output of this in an energy-weighted histogram (Figure C2). Information on how to estimate the rated speed was provided by the Carbon Trust Website (April, 2007) as shown in Figure C1 below, which shows that “the power curve” is a good match to the histogram over most of the range of current speeds. This behaviour is key to the overall device design in enabling the device to generate the maximum energy over time. Also shown is the rated speed, which coincides with the rated power. The designer has chosen this to give the most economic energy capture over time. Finally, the device's energy capture as a proportion of the annual energy available is shown. It can be seen from this that the largest contribution is from currents at- and close to- the rated speed.”
(Source: Carbon Trust Website, April 2007)
Figure C1. Example Distribution of Tidal Stream Current Speeds as Proportion of
Total Annual Energy, with Example Tidal Stream Device Power Curve Overlaid

Quantification of Exploitable Tidal Energy Resources in UK Waters
R/3671/4 C.2 R.1349
In replicating this analysis approach, an upper and lower estimate of the rated capacity was made for each of MSPC speed and depth combinations. The average speed for these subjective estimates was then calculated (which is the average of 3.65 and 3.85 in the example below), giving a rated speed of 3.75m/s for this particular current speed and depth combination. This process was undertaken for all 63 depth and MSPC speed groups in Table C1, with a different current speed ratings produced for technology Groups A, B, and E, technology Group C and technology Group D. Figure C2 shows the results for Technology Groups A, B, and E at currents speeds between 4-4.5m/s and depths between 15-20m LAT.
Figure C2. Example of the Histogram Used to Estimate the Rated Speed for a Site Table C1 shows current speed rated capacity for each site depth and MSPC speed combination. This data allows the power rating to be calculated for each of these groups. The power rating was derived by calculating the device power output for the current speeds in Table C1. For each calculation the average wave height and average depth for the group were used i.e. to calculate the power for the ‘4-4.5m/s,15-20m LAT’ group, a current speed of 3.75m/s, depth of 17.5m LAT and wave height of 1.35m was used. This provided a result of 829,000W for Groups A, B, and E, 1,390,000 for Group C, and 3,860,000 for Group D. These were then rounded to the closest rating from the list below: 0.1, 0.15, 0.2, 0.25, 0.5, 0.75, 1.0, 1.5, 2.0, 2.5, 3.0, 4.0, 5.0MW

Quantification of Exploitable Tidal Energy Resources in UK Waters
R/3671/4 C.3 R.1349
Therefore, for the ‘4-4.5m/s,15-20m LAT’ group, devices in Groups A, B, and E were allocated a power rating of 0.75MW, devices in Group C were allocated a power rating of 1.5MW and devices Group D allocated 4MW. This process was undertaken for all MSPC speed and depth combinations and for each technology group and the results are shown in Table 9, in Section 6.3. Table C1. Rated speed based on the MSPC speed and depth
Mean Spring Peak Current (ms-1) Depth 1.5-2.0 2.0-2.5 2.5-3.0 3.0-3.5 3.5-4.0 4.0-4.5 4.5-5.0 5.0-5.5 > 5.5
<10 1.2 1.7 2.2 2.55 3.1 3.4 - - - 10-15 1.2 1.75 2.2 2.65 3.1 - 4.15 4.4 - 15-20 1.3 1.75 2.25 2.65 3.15 3.75 - - - 20-25 1.3 1.75 2.25 2.7 3.2 3.8 4.15 4.5 5.1 25-30 1.3 1.8 2.25 2.7 3.2 - 4.2 4.65 - 30-35 1.3 1.8 2.25 2.7 3.2 3.8 4.2 4.65 - 35-40 1.3 1.8 2.25 2.7 3.2 3.8 - - -

Appendix D Top Fifty Sites of Tidal Resource in the UK

Quantification of Exploitable Tidal Energy Resources in UK Waters
R/3671/4 D.1 R.1349
Appendix D. Top Fifty Sites of Tidal Resource in the UK
Location Ranking Cell Centre Lat
Cell Centre Long
Mean Depth (m LAT)
Available Water Column Height
(m LAT) Area (km2)
MSPC (m/s)
Device Rating (MW)
Device AEY (GWh/y)
No. Devices Deployed
Installed Capacity
(MW)
Annual Energy Yield
(GWh/y)
Potential No. of Devices in
Cell
Potential Capacity
(MW) Potential AEY
(GWh/Y) Notes
2 49.72517 -2.06873 29.0 16.5 1.68 5.29 5.00 16.41 6 30 98.47 39 193 634.6 Constrained to the East by edge of UKCS 3 49.70833 -2.08750 28.7 16.3 3.32 5.3 5.00 16.26 6 30 97.57 77 383 1246.7 Wreck exclusion present in north of site 4 49.69167 -2.08750 33.5 19.9 3.32 4.62 5.00 15.48 6 30 92.87 66 328 1016.5 Wreck exclusion present in south west of Site 5 49.72500 -2.08750 28.0 15.8 3.35 5.16 5.00 15.07 6 30 90.40 80 400 1205.4 Constrained to the east by edge of UKCS 6 49.70853 -2.06950 24.6 13.2 1.47 5.69 4.30 14.91 7 30 104.40 40 173 601.6
11 49.69167 -2.11250 29.5 16.9 3.35 4.71 4.30 13.66 7 30 95.61 76 325 1033.5 14 49.69189 -2.07027 29.4 16.8 1.27 4.58 4.30 12.56 7 30 87.90 28 120 351.6 Constrained to the east by edge of UKCS 15 49.67500 -2.11250 32.4 19.1 3.35 4.23 4.30 12.52 7 30 87.67 69 297 864.2 16 49.67500 -2.08750 32.4 19.1 3.35 4.25 4.30 12.42 7 30 86.92 69 297 856.8 17 49.74167 -2.08750 37.3 22.7 3.35 3.75 3.75 10.86 8 30 86.87 61 229 662.4 18 49.70833 -2.11250 22.8 11.8 3.35 5.15 3.75 10.76 8 30 86.07 102 384 1101.0 19 49.65833 -2.11250 32.3 19.1 3.35 3.88 3.00 9.50 10 30 95.00 69 207 655.5 20 49.67743 -2.07183 30.3 17.5 0.68 3.99 3.00 9.01 10 30 90.08 14 43 129.1 Over 75% of cell outside of UKCS 22 49.65894 -2.08939 31.2 18.3 2.80 3.82 3.00 8.62 10 30 86.19 59 178 511.4 Constrained to the east by edge of UKCS 27 49.64167 -2.11250 32.2 19.0 3.36 3.53 3.00 7.57 10 30 75.71 69 207 522.4 28 49.67500 -2.13750 28.4 16.1 3.35 3.88 2.50 7.54 12 30 90.53 79 197 593.5 30 49.65833 -2.13750 28.3 16.1 3.35 3.79 2.50 7.14 12 30 85.70 79 197 561.8 31 49.72500 -2.11250 20.1 9.8 3.35 4.68 3.00 6.89 10 30 68.86 119 357 819.4 32 49.69167 -2.13750 21.5 10.9 3.35 4.4 3.00 6.81 10 30 68.07 109 327 742.0 34 49.64223 -2.09295 32.1 19.0 1.87 3.36 2.00 6.12 15 30 91.73 38 77 234.4 Constrained to the east by edge of UKCS 36 49.64167 -2.13750 30.2 17.5 3.36 3.44 2.00 6.10 15 30 91.57 73 147 447.7
Alderney Race
44 49.62500 -2.11250 33.1 19.7 3.36 3.07 2.00 5.23 15 30 78.50 68 135 354.1 SubTotal 22 63.34 204 660 1936.70 1483 5201 15145.44
7 58.67500 -3.06250 39.6 24.9 2.70 4.21 5.00 14.79 6 30 88.76 47 235 695.3 8 58.69167 -3.13750 32.4 19.5 2.65 4.56 5.00 14.17 6 30 85.00 53 267 755.6 2 Wrecks present
12 58.65833 -3.03750 33.6 20.3 2.69 4.37 4.30 13.62 7 30 95.34 52 225 712.7 Wreck resent at south of site 21 58.64167 -3.01250 34.7 21.1 2.67 3.56 3.00 8.63 10 30 86.33 50 151 434.5 Wreck resent at east of site 26 58.67500 -3.08750 29.7 17.4 2.70 3.98 2.50 7.72 12 30 92.69 59 148 455.7
South Pentland Firth
43 58.65833 -3.06250 24.5 13.5 2.69 3.9 1.50 5.34 20 30 106.76 73 110 389.7 Wreck in south east corner SubTotal 6 16.10 61 180 554.87 335 1135 3443.51
9 58.72500 -2.96250 33.9 20.1 2.69 4.44 4.30 13.95 7 30 97.64 52 225 730.0 North Pentland Firth 24 58.72500 -2.93750 34.9 20.9 2.69 3.56 3.00 8.29 10 30 82.92 51 152 420.1 SubTotal 2 5.38 17 60 180.56 103 377 1150.08
23 58.69167 -2.91250 34.8 20.8 2.66 3.59 3.00 8.37 10 30 83.67 52 155 432.3 Wreck in north east, obstruction in south west Pentland Skerries 25 58.69167 -2.88750 33.9 20.1 2.68 3.57 3.00 7.85 10 30 78.53 52 157 411.0 Wreck in south SubTotal 2 5.34 20 60 162 104 312 843.29
13 59.15833 -2.86250 28.9 15.7 2.66 4.81 4.30 13.31 7 30 93.15 63 272 842.8 Westray Firth 10 59.17500 -2.86250 30.7 17.1 2.66 4.71 5.00 13.93 6 30 83.60 60 298 831.4 SubTotal 2 5.32 13 60 176.75 123 571 1674.18
35 55.65833 -6.61250 29.1 16.3 2.94 3.52 2.50 6.11 12 30 73.35 68 171 417.7 41 55.67500 -6.61250 27.0 14.7 2.94 3.56 2.00 5.53 15 30 82.92 74 149 410.9 42 55.67500 -6.63750 31.0 17.7 2.94 3.28 2.00 5.50 15 30 82.51 64 129 353.9 45 55.64167 -6.61250 33.1 19.3 2.94 3.05 2.00 5.17 15 30 77.62 59 119 307.0 47 55.69167 -6.63750 31.9 18.4 2.94 3.12 2.00 5.05 15 30 75.77 62 125 314.8 48 55.65833 -6.58750 29.1 16.3 2.94 3.41 1.50 4.94 20 30 98.84 68 103 337.7
West Islay
50 -4.7125 53.3417 29.02 16.2 2.94 3.34 1.50 4.67 20 30.00 93.36 68 102 317.4 Wreck in south west Corner SubTotal 7 20.60 112 210 584.38 465 896 2459.54
33 55.57500 -6.38750 34.4 20.3 2.95 3.25 2.00 6.29 15 30 94.39 57 115 360.8 SW Islay 39 55.57500 -6.36250 27.3 15.1 2.95 3.53 2.00 5.62 15 30 84.25 73 147 411.9 SubTotal 2 5.90 30 60 178.64 131 261 772.66
38 51.87500 -5.41250 34.7 20.5 3.22 3.12 2.00 5.69 15 30 85.36 63 126 358.5 Ramsay Island 50 51.89167 -5.41250 38.7 23.6 3.20 2.99 1.50 4.87 20 30 97.31 56 84 272.5 SubTotal 2 6.41 35 60 182.67 119 210 630.99
37 50.55833 -1.23750 26.0 14.5 2.24 3.71 2.00 5.77 15 30 86.52 57 114 328.8 North east quarter constrained by disposal site and a wreck South Isle of Wight
49 50.54167 -1.28750 32.1 19.0 3.29 3.1 2.00 4.93 15 30 74.02 68 135 333.9 SubTotal 2 5.54 30 60 160.54 125 249 662.69
40 53.44167 -4.63750 35.7 21.9 3.10 3.02 2.50 5.56 12 30 66.67 57 143 318.5 46 53.44167 -4.61250 34.7 21.1 3.10 3 2.00 5.14 15 30 77.07 58 117 299.7 Anglesey 49 53.34167 -4.71250 38.0 23.5 3.10 3.34 1.50 4.73 20 30.00 94.53 54 81 255.2
SubTotal 3 9.30 47 90 238.26 170 341 873.46 Total 50 148.60 586 1560 4536.14 3260 9930 28805.93

GIS Figures Vol. 2 (Bound Separately)
