quantification of gait features in patients with lumbar
TRANSCRIPT

133
I. Introduction Lumbar spinal stenosis (LSS) is a disease that presents with neurological symptoms due to compression of the cauda equina and nerve roots that pass through the spinal column and the intervertebral foramen, caused by spinal deformity and thickening of the soft tissue associated with age-related
changes 1). LSS leads to gait disorders due to neurological symptoms associated with lower limb pain. The cauda equina type in particular is characterized by intermittent claudication that induces numbness in both legs with continued walking, and the symptoms improve when walking is halted. Patients who present with intermittent claudication not only have reduced walking distance, but also reduced activity level, affecting their social, mental, and physical well-being. In Japan, the prevalence
Quantification of gait features in patients with lumbar spinal stenosis using an acceleration sensor
Yuichiro Abe 1), Hideki MurAkAMi 1), Hirooki endo 1), daisuke YAMAbe 1), Yusuke CHibA 1), daichi kinno 1), Yasushi CHidA 2) and Minoru doitA 1)
1) Department of Orthopedic Surgery, School of Medicine,
Iwate Medical University, Yahaba, Japan2) Bycen Inc., Kobe, Japan
(Received on January 17, 2020 & Accepted on February 14, 2020)
Key words: lumbar spinal stenosis, gait, acceleration, walking test
Original
Corresponding author: Yuichiro Abe [email protected]
JIMA Vol. 72, No. 4(Oct. 2020)pp. 133-144.
A simple method for detection and quantification of intermittent claudication in patients with lumbar spinal stenosis (LSS) is important to aid in diagnosis and serves as a good index for post-treatment evaluation decisions. A 6 -minute walk test was performed by patients with LSS and healthy volunteers using a 3 -axis acceleration sensor. The averaged acceleration values of the antero-posterior direction (AA) and the Lissajous index (LI), an index of left-right symmetry, were calculated for each minute from the measured acceleration data, and the healthy volunteers and patients with LSS were compared over time. No change in left-
right symmetry associated with continued walking was found in healthy volunteers, but the left-right symmetry gradually collapsed in patients with LSS. Change over time in antero-posterior movement associated with continued walking was not observed in healthy volunteers, but acceleration of the posterior direction increased as the walking time increased in patients with LSS. These results suggest that changes over time in LI and AA may serve as indices to capture intermittent claudication in patients with LSS. Our findings suggest that changes in LI and AA over time may aid in diagnosis and be useful for preoperative and postoperative evaluation.
Abstract
Yuichiro Abe, et al.134
of LSS is estimated to be 5.7–5.8%, and the number of patients with LSS is expected to increase with future growth in the elderly population, thus further highlighting the importance of treatment for this disease 2). Currently, no clear diagnostic criteria for LSS have been presented. The condition is comprehensively diagnosed based on clinical symptoms, physical findings, and imaging findings. Severity is determined based on a patient questionnaire, but no objectively quantified indices are available. Therefore, evaluation of walking ability is important for determining the severity of this condition and for se lect ing treatment methods . Quantification of walking ability would aid in diagnosis and serve as an indicator for post-
treatment evaluation decisions 3,4). Gait analysis is an established method that uses force plates and three-dimensional (3D) motion analysis systems. However, this method requires large-scale measuring equipment, and it is expensive and places a significant burden on patients, which makes clinical application difficult 5,6). Recently, gait analysis using a 3-axis acceleration sensor has become more widely used, and this method can use wireless technology, is simpler and cheaper than previous methods, and does not require large-scale test facilities 7-13). There are few space constraints; thus, it is considered suitable for ascerta in ing intermittent claudication associated with continued walking in patients with LSS. In a previous study using
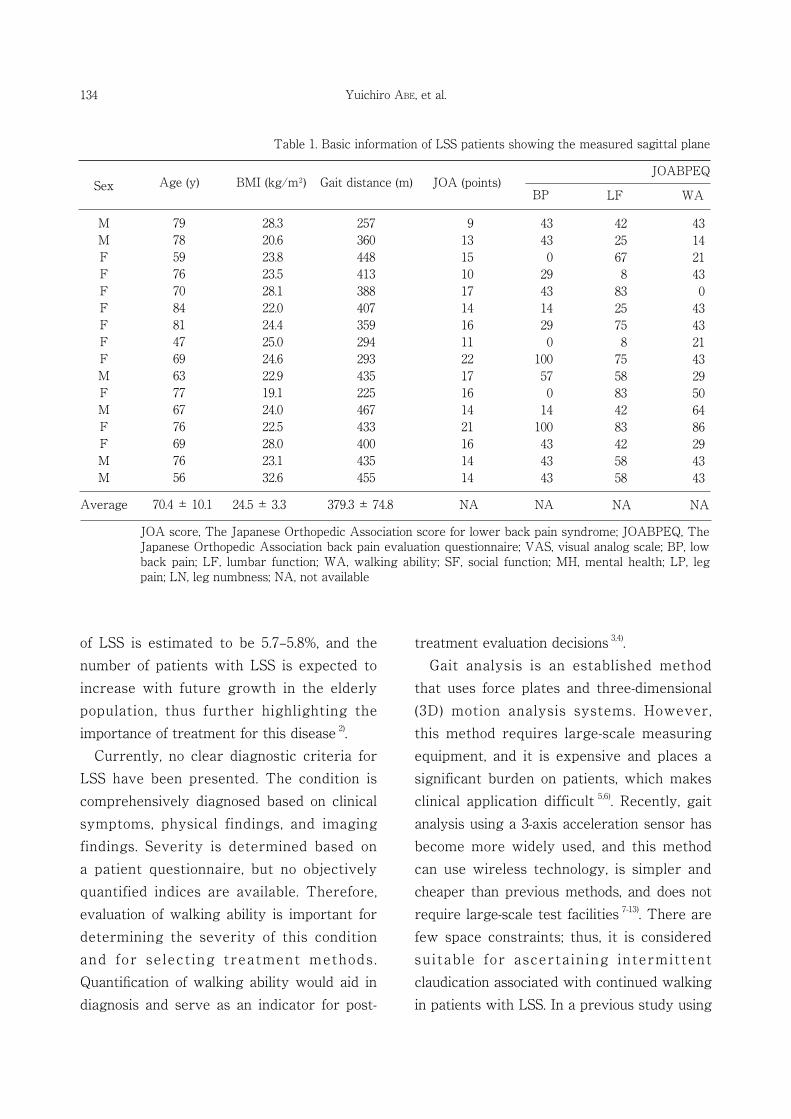
Table 1. Basic information of LSS patients showing the measured sagittal plane
MMFFFFFFFMFMFFMM
JOABPEQ
BPSex Age (y)
79785976708481476963776776697656
Average 70.4 ± 10.1
BMI (kg/m²)
28.320.623.823.528.122.024.425.024.622.919.124.022.528.023.132.6
24.5 ± 3.3
Gait distance (m)
257360448413388407359294293435225467433400435455
379.3 ± 74.8
JOA (points)
9131510171416112217161421161414
NA
43430
294314290
100570
14100434343
NA
LF
4225678
8325758
7558834283425858
WA
431421430
4343214329506486294343
NA NA
JOA score, The Japanese Orthopedic Association score for lower back pain syndrome; JOABPEQ, The Japanese Orthopedic Association back pain evaluation questionnaire; VAS, visual analog scale; BP, low back pain; LF, lumbar function; WA, walking ability; SF, social function; MH, mental health; LP, leg pain; LN, leg numbness; NA, not available

acceleration sensors for patients with LSS, Papadakis et al. 12) reported that patients with LSS have a more irregular gait than that of healthy volunteers; however, they were unable to objectively quantify the changes associated with gait. Furthermore, Nagai et al. 13) revealed that when patients with LSS continue to walk longer distances, lateral fluctuations increase, and that capturing the changes associated with continued walking is possible, but they did not examine vertical and anterior-posterior movement. In this study, it was hypothesized that patients with LSS lose their balance earlier than healthy subjects. Therefore, we aimed to conduct gait analysis using a 3-axis wireless acceleration sensor during a 6-minute walk
in healthy volunteers and patients with LSS. We also aimed to examine correlations among the gait analysis of the patients with LSS, questionnaire results of the patients, and various radiographic parameters.
II. Materials and methods 1. Participants This study was approved by the Ethical Committee of Iwate Medical University School of Medicine (IRB: MH2018-067), and written consent was obtained from all subjects after they received a written explanation. The participants included 16 patients with LSS (men, n = 6; women, n = 10; mean age = 70.4 ± 10.1 years) with gait disorders due to neurological symptoms, such as leg
135Original: Gait analysis using an acceleration sensor
pelvic image parameters and the clinical measurement response results.
706070
10050505080308050400
705050
Radiographic parameters
PL-LL
000
2020808060705030607080
100100
NA NA
100800
100305080507080505070809090
NA
40.516.830.09.79.6
23.8-2.713.223.442.730.634.412.918.224.0
-
NA
LL
3.151.031.228.768.437.230.151.535.216.627.55.1
39.327.022.126.6
SS PT PI
22.731.731.018.742.836.47.5
40.135.135.824.117.925.326.220.7
-
20.635.630.320.234.825.519.422.721.023.936.817.924.517.814.1
-
43.667.861.238.478.061.027.464.758.659.358.139.552.245.246.1
-
NA NA NA NA
VAS (mm)BP LP LNSF MH
694689209
3662637241384586454848
51462432326851467354515157385151
NANA
(points)

pain, who had been indicated for surgery (Table 1). These patients were diagnosed by experienced orthopedic surgeons at Iwate Medical University Hospital. The neurological symptoms and physical findings, such as leg pain and numbness, were confirmed to match the findings of magnetic resonance imaging of lumbar spinal canal stenosis. Exclusion criteria were patients with cerebral infarction, cardiopulmonary disease, neurological diseases such as cervical myelopathy, and diseases with gait disorders (e.g., Parkinson’s disease, severe osteoarthritis of the hip, osteoarthritis of the knee, and diabetic neuropathy). The healthy volunteer group had no diseases that can cause gait disorders and comprised 10 healthy volunteers (men, n = 4; women, n = 6; mean age = 64.6 ± 12.7 years) who satisfied less than 7 criteria on the LSS diagnostic support tool [14] advocated by the Japanese Society for Spine Surgery and Related Research (Table 2). 2. Protocol A 3-axis acceleration sensor (Q’z TAG Research: Sumitomo Electric Industries, Osaka, Japan; weight: 15 g, dimensions: 41
× 41 × 15 mm) was used to evaluate gait characteristics, and all data collected during walking were recorded in a computer. This sensor is very light (15 g), so measurements can be taken without affecting gait. The obtained walking data can be sent to a laptop wirelessly via Bluetooth (transmission distance of approximately 30 m). The acceleration sensor sampling rate was set to 200 Hz 12). After affixing the sensor with athletic tape directly to the skin on top of the spinous process of L3 9), the patient was asked to walk continuously for 6 minutes, referencing the method advocated by the American thoracic medical community 15). All subjects were instructed to walk along a 25-m horizontal walkway for 6 minutes at their maximum walking speed, and to return after reaching a cone indicating the end of the course. The subjects counted the number of times they completed a round trip of the walking path, and the 6-minute walking distance was measured at the same time and recorded on video. 3. Acceleration data analysis Microsoft Excel 2016 (Microsoft Corp., Redmond, WA, USA) was used for all data
136 Yuichiro Abe, et al.
Table 2. Basic information of healthy volunteers
BMI (kg/m²)
FFMFFMMFMF
Sex Age (y)
78775168534952836471
Gait distance (m) Diagnostic support tool (points)
26.229.423.819.323.626.224.123.327.720.2
475516691544560519580393457407
4444323534
Average 64.6 ± 12.7 24.4 ± 3.1 512.4 ± 87.9 NA
NA, not available

137
analysis. The stabilized 2048 points of data (excluding data involving deceleration and acceleration around the turning point, as identified in the captured video) were extracted for the measured 3-axis direction acceleration data (CSV format) for 1-minute increments of 0-1 minute, 1-2 minutes, 2-3 minutes, 3-4 minutes, 4-5 minutes, and 5-6 minutes. The averaged acceleration values of antero-posterior direction (AA) and the Lissajous index (LI), advocated by Yamaguchi et al. 10) as an index for gait symmetry, were calculated from the extracted data.The LI (%) calculation method is shown as follows: The area of the rectangle with a broken line in Fig. 1A was described as rectangle area right: Rr, and the area of the rectangle with a dotted line was described as rectangle area left: Rl. Rr and Rl were calculated using Excel.The methods for finding the area of Rr and Rl
are shown as follows: i) Vertical length of the rectangle: Maximum acceleration in a vertical direction. ii) Horizontal length of the rectangle: Absolute value of maximum acceleration in a left to right direction. iii) The area was determined by using the vertical height× horizontal length to calculate Rr and Rl. The formula for finding the LI (%) is as follows:
A positive AA indicates more anterior acceleration, and a negative AA indicates more posterior acceleration. The lower the numeric value of LI, the greater the symmetry of the frontal plane, while the higher the numeric value, the lower the symmetry.
Original: Gait analysis using an acceleration sensor
Fig. 1. Lissajous figure and X-ray parameter A: Method for calculating the Lissajous index (LI) based on the frontal plane Lissajous figure
[rectangle right (Rr): area within the broken line, rectangle left (Rl): area within the dotted line] B: Each parameter measured from the sagittal plane X-ray of the lumbar spine and pelvis in the
standing position (LL, lumbar lordosis; SS, sacral slope; PT, pelvic tilt; PI, pelvic incidence).
LI= 2 (Rr l )
Rr+Rl × 100
A B

Yuichiro Abe, et al.138
4. Patient questionnaire The Japanese Orthopedic Association (JOA) score for lower back pain syndrome, the Japanese Orthopedic Association Back Pain Evaluation Questionnaire (JOABPEQ), and the Visual Analog Scale (VAS) patient questionnaires were used for measurements 16-18). The JOA score evaluates pain based on a 29-point scale, consisting of 4 domains related to lower back pain: subjective symptoms, objective symptoms, activities of daily living, and bladder function. JOABPEQ is a disease-specific tool and contains 25 items tapping into five subscales: social function, mental health, lumbar function, walking ability, and low back pain. The score for each subscale ranges from 0 to 100, with higher scores indicating better conditions. The VAS is the most widely used tool for evaluating pain intensity. Patients were asked to indicate a point along a 100-mm scale bar depending on the strength of their pain, with “no pain at all” (0) at the left end of the scale and the worst pain (100) at the right end of the scale bar. The diagnostic support tool values are shown in Table 2 to demonstrate that the healthy volunteers did not have LSS disease. 5. Radiographic parameters Lumbar lordosis, sacral slope, pelvic tilt (PT), pelvic incidence, and pelvic incidence minus lumbar lordosis are the parameters for the sagittal plane of the lumbar spine and pelvis. These parameters were measured using a lateral X-ray image in the standing position (Fig. 1B). 6. Statistical analysis Student’s t-test was performed to compare the patients with LSS and the healthy volunteers, and the paired t-test was used
to compare changes over time. Pearson’s correlation coefficient was used to examine the correlation among the gait analysis of the patients with LSS, questionnaire results of the patients, and radiographic parameters. SPSS ver. 21.0 (IBM Corp., Armonk, NY, USA) was used for statistical analysis, with the level of significance set at p < 0.01.
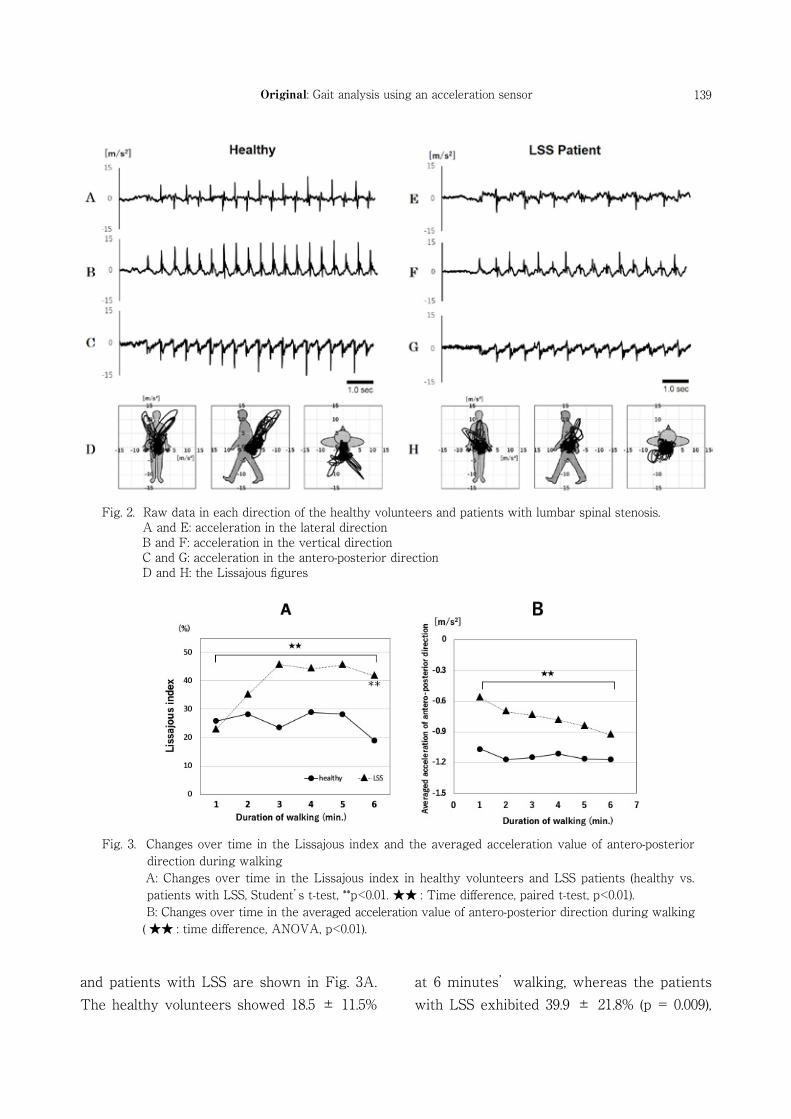
III. Results The clinical information and measurement results for the patients with LSS and healthy volunteers are shown in Tables 1 and 2. The mean age of the patients with LSS was 70.4 ±10.1 years and that of the healthy volunteers was 64.6 ± 12.7 years (p = 0.2). The mean body mass index (BMI) of the patients with LSS and healthy volunteers was 24.5 ± 3.3 kg/m2 and 24.4 ± 3.1 kg/m2 (p = 0.9), respectively; thus, no significant difference was found in either of these factors. The 6-minute walking distance of the patients with LSS was 379.3 ± 74.8 m and that of the healthy volunteers was 512.4 ± 87.9 m, indicating a significantly shorter distance for the patients with LSS (p = 0.0003). An example of an accelerogram measured for each direction and the Lissajous figure is shown in Fig. 2. In the raw accelerogram, the patients with LSS had smaller waveforms for all 3 axes compared with the healthy volunteers. In the vertical and horizontal direction waveforms, the patients with LSS had different waveforms for the right leg and left leg compared with those of the healthy volunteers. The patients with LSS had a smaller Lissajous figure than the healthy volunteers, and asymmetry was observed in the coronal plane. The changes over time in LI values in healthy volunteers
139Original: Gait analysis using an acceleration sensor
and patients with LSS are shown in Fig. 3A. The healthy volunteers showed 18.5 ± 11.5%
at 6 minutes’walking, whereas the patients with LSS exhibited 39.9 ± 21.8% (p = 0.009),
Fig. 2. Raw data in each direction of the healthy volunteers and patients with lumbar spinal stenosis. A and E: acceleration in the lateral direction B and F: acceleration in the vertical direction C and G: acceleration in the antero-posterior direction D and H: the Lissajous figures
Fig. 3. Changes over time in the Lissajous index and the averaged acceleration value of antero-posterior direction during walking
A: Changes over time in the Lissajous index in healthy volunteers and LSS patients (healthy vs. patients with LSS, Student’s t-test, **p<0.01. ★★ : Time difference, paired t-test, p<0.01).
B: Changes over time in the averaged acceleration value of antero-posterior direction during walking ( ★★ : time difference, ANOVA, p<0.01).

140 Yuichiro Abe, et al.
indicating a significant difference. The healthy volunteers had no significant differences associated with the passage of time, but the patients with LSS had a significant increase in the LI value with the passage of time, which plateaued from 3 minutes onwards. The AA changes over time in the healthy volunteers and the patients with LSS are shown in Fig. 3B. The healthy volunteers had no change in AA, even with long walking times, but the patients with LSS had a significant decline in AA over time. In the correlation between the radiographic parameters and AA, a negative correlation was found with PT (r = -0.78, p = 0.0007; Fig. 4).
IV. Discussion In this study, a 6-minute walking test was performed in healthy volunteers and patients with LSS. The intermittent claudication of patients with LSS was quantitatively detected from the difference between changes over
time using 3-axis direction acceleration data. The accelerogram showed uniform left and right waveforms in healthy volunteers, but different waveforms in patients with LSS (Fig. 2). These acceleration data demonstrate that the healthy volunteers and patients with LSS exhibited obvious differences while walking, suggesting that the differences reflected the pathology. Lissajous figure is a method of displaying acceleration data during walking in a visually easy-to-understand format, presenting the data as a planar figure obtained by combining two simple vibration movements that are at right angles to each other 19). In the Lissajous figure, the healthy volunteers were symmetrical in the frontal plane, whereas the patients with LSS had asymmetrical waveforms (Fig. 2). Yamaguchi et al. 10) and Terui et al. 11) suggested that the Lissajous index was a useful method for comparing left and right balance from acceleration data during walking. The LI value was calculated over time from 0 to 6 minutes to compare left and right differences in acceleration of patients with LSS; no changes over time were found in healthy volunteers, but the left-right symmetry gradually collapsed in patients with LSS (Fig. 3A). At the start of walking, the healthy volunteers and patients with LSS had equivalent LI values. This suggests that the symptoms are either absent or mild at the start of walking, but then intermittent claudication associated with asymmetrical left and right movements occurred, caused by neurological symptoms induced by continued walking. Furthermore, given that the LI value peaked at 3 minutes after starting walking and plateaued thereafter, the intermittent claudication symptoms are ongoing as
Fig. 4. Correlation between the averaged acceleration value of antero-posterior direction and radio- graphic parameters. Correlation between the averaged acceleration
value of antero-posterior direction in patients with LSS and pelvic tilt (PT: pelvic tilt, Pearson’s correlation coefficient, r = -0.78, p = 0.0007).
141Original: Gait analysis using an acceleration sensor
asymmetrical left and right movements 3 minutes after starting walking. This result indicates that the walking test time could be shortened to less than 6 minutes. The 6-minute walking test is considered to be a significant physical burden for patients with LSS with leg symptoms. Thus, if the walking time could be shortened to around 3 minutes, this would shorten future clinical test times and would lead to a reduced physical burden for patients with LSS. In general, patients with LSS were revealed to experience improvement in neurological symptoms, such as leg numbness, by adopting a forward-leaning posture, as this widens the spinal canal, thereby reducing the internal pressure of the spinal canal 20). Igawa et al. 6) reported that 3D motion analysis of patients with LSS shows that their hip joint is extended, and their trunk is inclined forward during walking. Goto et al. 21) suggested that forward bent posture increases as intermittent claudication occurs. As these postural changes in the sagittal plane are observed in patients with LSS, we considered a working hypothesis that some factors affect acceleration of the antero-posterior movement during walking. The changes in AA over time were not found in healthy volunteers, but a gradual decline was noted in patients with LSS. This finding suggests that acceleration of the antero-posterior movement may demonstrate intermittent claudication specific to patients with LSS. As patients with LSS walk, this movement appears almost normal, but Menz et al. 22) reported that the faster speed of the walking, the larger amplitude of the acceleration. Thus, the difference in AA at the start of walking could be due to the
differences in walking speed (6-minute walking distance) between the healthy volunteers and the patients with LSS. The decline in AA associated with continued walking is not a sign that walking approaches normal as walking speed increases; rather, it is speculated that there is onset of leg pain and numbness, which are symptoms of intermittent claudication. Thus, the individual adopts a forward-leaning posture to mitigate the symptoms, thereby increasing their swaying gait, which manifests in an inefficient gait. In the correlation between AA and spinal alignment based on X-ray imaging, a larger PT in patients with LSS indicates greater acceleration of posterior direction (Fig. 4). When an imbalance develops in the sagittal plane in patients with LSS, they often tend to develop a decompensated forward-leaning posture. The patients maintain their balance by reducing their thoracic kyphosis, adopting pelvic retroversion, extending the hip joint, and flexing the knee joint. Therefore, the pelvis tilts backwards, increasing the PT as compensation for the forward-leaning posture 23). A number of studies have reported that patients with LSS have a larger pelvic retroversion than do healthy volunteers and a bent posture not only at rest, but also while walking 24, 25). The results of this study also suggest that PT affects the gait characteristics of patients with LSS. This study has several limitations. First, a larger number of patients with LSS were excluded than expected, which meant that we were unable to include the target number of subjects. We aimed to perform a more detailed analysis of data specific to patients with LSS by increasing the number of subjects and

142 Yuichiro Abe, et al.
classifying the patients based on symptoms, caused by radicular type, cauda equina type, or a combination of both. Second, we measured the spinal alignment from plane X-ray imaging with the patient at rest and compared the resulting data with the acceleration data. However, spinal alignment at rest differs from that during movement. Thus, measuring and verifying this information in combination with 3D motion analysis systems are necessary. Finally, analysis of Lissajous figures based on LI may produce left-right differences
because comparisons are made based on the area ratio rather than trajectory. Even one abnormal waveform can be captured as a larger area than an actual area; thus, the calculation methods require improvement in the future.
Conflict of interest: The authors have no conflict of interest to declare.
1) Katz J N and Harris MB : Lumbar spinal stenosis. N Engl J Med 358, 818–825, 2008.
2) Yabuki S, Fukumori N, Takegami M, et al.: Prevalence of lumbar spinal stenosis, using the diagnostic support tool, and correlated factors in Japan: a population-based study. J Orthop Sci 18, 893–900, 2013.
3) Pratt R K, Fairbank JCT and Virr A: The reliability of the shuttle walking test, the Swiss Spinal Stenosis Questionnaire, the Oxford Spinal Stenosis Score, and the Oswestry Disability Index in the assessment of patients with lumbar spinal stenosis. Spine (Phila Pa 1976) 27, 84–91, 2002.
4) Tomkins CC, Battie MC, Roger T, et al. : A criterion measure of walking capacity in lumbar spinal stenosis and its comparison with a treadmill protocol. Spine (Phila Pa 1976) 34, 2444–2449, 2009.
5) Suda Y, Saitou M, Shibasaki K, et al.: Gait analysis of patients with neurogenic intermittent claudication. Spine (Phila Pa 1976) 27, 2509–2513, 2002.
6) Igawa T, Katsuhira J, Hosaka A, et al.: Kinetic and kinematic variables affecting trunk flexion during level walking in patients with lumbar spinal stenosis. PLoS One 13, e0197228, 2018.
7) Moe-Nilssen R and Helbostad JL: Estimation of gait cycle characteristics by trunk accelerometry. J Biomech 37, 121–126, 2004.
8) Henriksen M, Lund H and Moe-Nilssen R: Test–retest reliability of trunk accelerometric gait analysis. Gait Posture 19, 288–297, 2004.
9) Kavanagha J, Morrisona S and James D :
Reliability of segmental accelerations measured using a new wireless gait analysis system. J Biomech 39, 2863–2872, 2006.
10) Yamaguchi R, Hirata S, Doi T, et al.: The usefulness of a new gait symmetry parameter derived from Lissajous figures of tri-axial acceleration signals of the trunk. J Phys Ther Sci 24, 405–408, 2012.
11) Terui Y, Iwakura M, Suto E, et al. : New evaluation of trunk movement and balance during walking in COPD patients by a triaxial accelerometer. Int J Chron Obstruct Pulmon Dis 13, 3957–3962, 2018.
12) Papadakis NC, Christakis DG, Tzagarakis GN, et al.: Gait variability measurements in lumbar spinal stenosis patients: part A. Comparison with healthy subjects. Physiol Meas 30, 1171–1186, 2009.
13) Nagai K, Aoyama T, Yamada M, et al. : Quantification of changes in gait characteristics associated with intermittent claudication in patients with lumbar spinal stenosis. J Spinal Disord Tech 27, E136–E142, 2014.
14) Konno S, Hayashino Y, Kukuhara S, et al.: Development of a clinical diagnosis support tool to identify patients with lumbar spinal stenosis. Eur Spine J 16, 1951–1957, 2007.
15) ATS Committee on Proficiency Standards for Clinical Pulmonary Function Laboratories: ATS statement: guidelines for the six-minute walk test. Am J Respir Crit Care Med 166, 111–117, 2002.
16) Fukui M, Chiba K, Kawakami M, et al. : Japanese Orthopaedic Association Back Pain
References

143Original: Gait analysis using an acceleration sensor
Evaluation Questionnaire. Part 2. Verification of its reliability: The Subcommittee on low back pain and cervical myelopathy evaluation of the Clinical Outcome Committee of the Japanese Orthopaedic Association. J Orthop Sci 12, 526–532, 2007.
17) Izumida S and Inoue S: Assessment of treatment for low back pain. J Jpn Orthop Assoc 60, 391–394, 1986.
18) Huskisson EC: Measurement of pain. Lancet 2, 1127–1131, 1974.
19) Gard SA, Knox EH and Childress DS: Two-dimensional representation of three-dimensional pelvic motion during human walking: an example of how projections can be misleading. J Biomech 29, 1387–1391, 1996.
20) Takahashi K, Kagechika K, Takino T, et al.: Changes in epidural pressure during walking in patients with lumbar spinal stenosis. Spine (Phila Pa 1976) 20, 2746–2749, 1995.
21) Goto T, Sakai T, Enishi T, et al.: Changes of posture and muscle activities in the trunk and legs during walking in patients with lumbar
spinal stenosis after decompression surgery. A preliminary report. Gait Posture 51, 149–152, 2017.
22) Menz HB, Lord SR and Fitzpatrick RC : Acceleration patterns of the head and pelvis when walking on level and irregular surfaces. Gait Posture 18, 35–46, 2003.
23) Roussouly P and Nnadi C : Sagittal plane deformity: an overview of interpretation and management. Eur Spine J 19, 1824–1836, 2010.
24) Shin SS, Yu JS, Yoon JY, et al.: Strategy on navigating obstacle in patients with lumbar spinal stenosis: relationship among trunk and pelvic movement, swing toe clearance, and muscle coordination of the stance limb. J Back Musculoskelet Rehabil 31, 1131–1138, 2018.
25) Kang MH, Kim ER, Kim YG, et al.: The effects of lumbo-pelvic postural taping on gait parameters in patients with lumbar spinal stenosis. Clin Biomech (Bristol, Avon) 28, 956–960, 2013.

144
加速度センサを用いた腰部脊柱管狭窄症患者の歩行特徴量の定量化
安部悠一郎 1),村上秀樹 1),遠藤寛興 1),山部大輔 1),千葉佑介 1),金野大地 1),千田 廉 2),土井田稔 1)
1) 岩手医科大学医学部,整形外科学講座2) バイセン株式会社
(Received on January 17, 2020 & Accepted on February 14, 2020)
簡便な方法により,腰部脊柱管狭窄症(lumbar spinal stenosis, LSS)患者の間欠性跛行を検出及び定量化できれば,診断の一助や治療後評価判定の良い指標になる.本研究の目的は加速度センサを用いて,健常者と LSS 患者の歩行解析を比較し LSS 患者の歩行特徴量を明らかにすることである.LSS 患者 16 名と健常者 10 名に対し加速度センサを用いて 6 分間歩行試験を施行し,歩行中の加速度データを測定した.測定した加速度データから前後方向の平均加速度量(Averaged acceleration value of antero-posterior
direction, AA)と左右対称性の指標である Lissajous Index (LI)を経時的に健常者と LSS 患者を比較した.健常者では歩行継続に伴い左右対称性に経時的変化を認めなかったが,LSS 患者では徐々に左右対称性が崩れていった.前後動においても健常者では歩行継続に伴う経時的な変化は認めなかったが,LSS 患者では歩行時間が増すごとに後方の加速度が増加した.これらの結果から,LI と AA の経時的変化は,LSS 患者の間欠性跛行を捉える指標となりうる事が示唆された.
要旨
岩手医誌 72 巻,4 号(令和 2 年 10 月)133-144 頁.