quantification of muscular, postural, and upper limb
TRANSCRIPT
Quantification of Muscular, Postural, and Upper Limb Movement
Demands During Overhead Crane Operation to Evaluate the Potential Efficacy of a Camera Based System
by
Mark Munro
A Thesis Presented to
The University of Guelph
In partial fulfillment of requirements for the degree of
Master of Applied Science in
Engineering
Guelph Ontario, Canada
© Mark Munro, September 2014

ABSTRACT
Quantification of Muscular, Postural, and Upper Limb Movement Demands During Overhead Crane Operation to Evaluate the Potential Efficacy of a Camera Based System
Daniel Mark Munro Advisor:
University of Guelph, 2014 Dr. Michele Oliver
Crane operators work long hours in constrained workspaces requiring awkward postures.
Neck extension, trunk flexion and repetitive arm movement have been associated with an
increased risk of developing neck and shoulder pain. Biomechanical and physiological
loads of crane operators were quantified onsite and used as a guide to design a
laboratory experiment to test the efficacy of a camera based system to reduce the loads
on the operators. Electromyography revealed that muscle loads associated with trunk
flexion and a high number of joystick movements were well above the accepted levels.
The laboratory study revealed that changing the posture to an upright position by
implementing a camera-based intervention to a more neutral, upright position, had a
positive impact on reducing work-related muscle loading.

iii
ACKNOWLEDGEMENTS
Dr. Michele Oliver
Dr. Gord Hayward
Dr. Jim Sexsmith
Micha Walace
Lauren Bailey
Michele Edwards, university statistician
W. Gerald Punnett and Deborah A. Boudreau
Industrial ergonomist
All my friends, colleagues and staff at the University of Guelph.
Natural Sciences and Engineering Research Council

iv
TABLE OF CONTENTS
Chapter One: Introduction and Problem statement .................................................................... 1
1.1 Introduction ................................................................................................................... 1
1.2 Job Description ............................................................................................................. 2
1.3 Problem Statement ....................................................................................................... 3
1.4 Research Objectives ..................................................................................................... 4
1.4.1 Objectives: ............................................................................................................................................................. 4
1.5 Thesis structure ............................................................................................................ 4
Chapter Two: Background .......................................................................................................... 6
2.1 Introduction ................................................................................................................... 6
2.2 Musculoskeletal Disorder Definition .............................................................................. 6
2.3 Anatomy of Shoulder and Upper Limb .......................................................................... 6
2.4 Anatomy Related to Joystick Manipulation ................................................................. 12
2.5 Work-Related Musculoskeletal Disorders ................................................................... 13
2.6 Musculoskeletal disorder prevalence .......................................................................... 14
2.7 Musculoskeletal Disorder Mechanisms ....................................................................... 16
2.8 Observations and Questionnaire ................................................................................ 18
2.9 Physiological Assessment .......................................................................................... 20
2.9.1 Heart Rate ......................................................................................................................................................... 20
2.9.2 Energy Expenditure ....................................................................................................................................... 22
2.9.3 Indirect Calorimetry ..................................................................................................................................... 23
2.9.4 Direct Calorimetry ......................................................................................................................................... 25
2.9.5 Alternative Method ........................................................................................................................................ 25
2.10 Electromyography ..................................................................................................... 27

v
2.10.1 Description of Noise .................................................................................................................................... 27
2.10.2 Gain and Common Mode Rejection Ratio (CMRR) ........................................................................ 27
2.10.3 Crosstalk / Noise .......................................................................................................................................... 28
2.10.4 Normalization ............................................................................................................................................... 31
2.11 Current Engineering Solutions .................................................................................. 34
Chapter Three: Quantification of Muscular, Postural, and Upper-‐limb Movement Demands of
Overhead Crane Cab Operators. .............................................................................................. 36
3.1 Introduction ................................................................................................................. 36
3.2 Methods ...................................................................................................................... 36
3.3 Subjects ...................................................................................................................... 37
3.4 Instrumentation ........................................................................................................... 38
3.4.1 Electromyography ......................................................................................................................................... 39
3.4.2 Muscle Specific Reference Contraction ................................................................................................. 39
3.4.3 Localized Discomfort – Questionnaire .................................................................................................. 42
3.4.4 EMG analysis .................................................................................................................................................... 42
3.4.5 Video .................................................................................................................................................................... 43
3.4.6 Joystick Forces ................................................................................................................................................. 43
3.4.7 Effects of Vibration and EM interference ............................................................................................. 44
3.4.8 Trunk Angles .................................................................................................................................................... 45
3.4.9 Video Analysis .................................................................................................................................................. 45
3.4.10 Temperature and Humidity -‐ HOBO® U12-‐012 External Data Logger .............................. 46
3.4.11 Physiological Data – SenseWear® Armband -‐ Skin & Near Body Temperature, Energy
Expenditure and Galvanic Skin Response. ...................................................................................................... 47
3.4.12 Heart Rate – Polar S810i HR Monitor ................................................................................................ 47
3.5 Test Protocol ............................................................................................................... 48

vi
3.5.1 Instrumentation Synchronization ........................................................................................................... 48
3.6 Statistics ...................................................................................................................... 49
3.7 Results ........................................................................................................................ 49
3.7.1 EMG Results ...................................................................................................................................................... 50
3.7.2 Trunk Angles and Joystick Forces ............................................................................................................ 51
3.7.3 Physiological Responses .............................................................................................................................. 53
3.8 Discussion ................................................................................................................... 58
EMG ................................................................................................................................................................................ 58
3.8.1 ................................................................................................................................................................................. 58
3.8.2 Joystick Input Demands and Trunk Angles. ........................................................................................ 63
3.8.3 Physiological Demands ................................................................................................................................ 65
3.9 Synthesis and Conclusions ......................................................................................... 71
Chapter Four: Crane Joystick Laboratory Mock-‐up ................................................................... 73
4.1 Introduction ................................................................................................................. 73
4.2 Methods ...................................................................................................................... 73
4.3 Subjects: ..................................................................................................................... 75
4.3.1 Instrumentation .............................................................................................................................................. 76
4.3.2 Electrodes and Goniometer Placement ................................................................................................. 76
4.3.3 Muscle Specific Reference Contractions (mRVC) for EMG Normalization ............................ 78
4.4 EMG Analysis ............................................................................................................. 78
4.5 Test Protocol ............................................................................................................... 79
4.5.1 Subtasks and Randomization .................................................................................................................... 79
4.5.2 Apparatus Arrangement ............................................................................................................................. 80
4.6 Statistics ...................................................................................................................... 82
4.7 Results ........................................................................................................................ 82

vii
4.8 Discussion ................................................................................................................... 85
4.8.1 Introduction ...................................................................................................................................................... 85
4.8.2 EMG ...................................................................................................................................................................... 86
4.8.3 Physiological Responses .............................................................................................................................. 90
4.9 Conclusion .................................................................................................................. 90
Chapter Five: Discussion Contributions and Future Work ......................................................... 92
5.1 Summary ..................................................................................................................... 92
5.1.1 Biomechanical and Physiological Loads .............................................................................................. 92
5.2 Contributions ............................................................................................................... 95
5.3 Future work ................................................................................................................. 95
Chapter Six: References ............................................................................................................ 97

viii
TABLES OF TABLES Table 2-1: Joints of the shoulder girdle, bones, supporting ligaments and muscles
acting on the joint. ....................................................................................................... 9
Table 2-2: Muscles involved upper limb movements. (Luttgens 1996; Coury et al., 1998; Nordin et al. 2012). .......................................................................................... 12
Table 2-3: Comparison of logarithmic and linear scaling, which indicates the level of suppression of the signal components common to the bipolar leads input into the differential amplifier (Day, 2002). .............................................................................. 28
Table 2-4: Specifications of the Delsys System compared to those recommended by C.J. DeLuca ............................................................................................................... 31
Table 3-1: Subject Information .......................................................................................... 37
Table 3-3: Right hand joystick displacement (degrees) force (N) ..................................... 52
Table 3-4: Mean ± standard deviations of the physiological response variables (n=7 subjects) .................................................................................................................... 57
Table 3-5: Comparison of EMG normalized to % Reference Voluntary Contraction (%mRVC) .................................................................................................................. 61
Table 3-6: Prolonged workload and cardiovascular response (Astrand, Rodahl, Dahl, & Stromme, 2003) and energy expenditure (Brown and Growden 1963). ................ 65
Table 3-7: Job Task Comparison energy expenditure (Abdelhamid and Everett 2002, Wallace 2010). .......................................................................................................... 68
Table 3-8: Potential Energy Expenditure Rates of Various Activities (Astrand, Rodahl, Dahl, & Stromme, 2003) ............................................................................................ 69
Table 4-1: Subject biometric information (lab study). Age, weight, height, body mass index, water content, hand dominance and smoking status. .................................... 75
Table 4-2: Average Rectified Value (ARV) expresses as a %mRVC across the four subtasks separated by side) (mean±SD). ................................................................ 87

ix
TABLE OF EQUATIONS
Equation 1: The Weir Equation for Energy Expenditure ................................................... 23
Equation 2: Equation for Common Mode Rejection Ratio (CMRR). ................................. 28
Equation 3: Average Rectified Value EMG ....................................................................... 42
x
TABLE OF FIGURES
Figure 1-1 Position of the operator cab in relation to the steel mill floor. The forward flexed posture adopted by the operator. Elevated rails (A) on which the carriages travel (B), bridge beams (C), operator cab (D), hoist mechanism (E), movement of the hoist mechanism (F), hook (G). ......................................................................... 3
Figure 2-1The structure of a synovial joint, illustrating the articular bones, synovial cavity, articular cartilage, joint capsule and synovial lining…………………………………...…7
Figure 2-2 Bony structures of the shoulder and its articulations……………………………10
Figure 2-3: Musculature of the shoulder joint complex: (A) Anterior view illustrating superficial muscles (right shoulder) and deep muscles (left shoulder), and (B) posterior view superfical muscles (left shoulder) and deep muscles (right shoulder) (Munro, 2002 ............................................................................................. 13
Figure 2-4:Work related risk factors as concluded by NIOSH (1997). .............................. 14
Figure 2-5: Localized discomfort survey (Corlette et al., 1976). ....................................... 19
Figure 2-6: Polar heart monitor strap and placement on the chest ................................... 22
Figure 2-7: Body Composition & Metabolism Laboratory University of Guelph photographer: Scott Schau………………………………………………………………...23
Figure 2-8: MedGem (HealthTech Inc., Golden CO). ………………………………….……24
Figure 2-9: SenseWear Pro 2 Armband from Body Medi…………………………….……..25
Figure 2-10: Delsys DE-2.3 electrode construction details, showing the shielding, electronics and curved geometry. (Delsys Inc., Boston, MA)………………………….29
Figure 2-11: Delsys MyoMonitor IV System (Delsys Inc., Boston, MA, USA) .................. 29
Figure 2-12: 7.5cm round reference electrode……………………………………………….30
Figure 2-13: Four phases of the Valsalva Manoeuver……………………..………………..33
Figure 2-14: A) ErgoSeat/ErgoChair illustrating the forward flexed position with the operator supporting the weight of the upper body on the elbows and forearm. B) BalanSeat. ........................................................................................................................ 35
Figure 2-15: Merford’s optical device ................................................................................ 35
Figure 3-1: Crane operator posture during plate loading …………………………………...36
Figure 3-2: Health-o-Meter Bio-impedance scale… ………………………...……………..38

xi
Figure 3-3: Muscle specific reference contractions (mRVC). ............................................ 40
Figure 3-4: Muscle specific reference contractions (mRVC continued) ............................ 41
Figure 3-5: Magnetic Mount with attached Manfroto™………………………………………43
Figure 3-6: HOBO® U12-012 External Data Logger…………………………………………46
Figure 3-7: SenseWear Armband (BodyMedia, Inc, 2009)………………………………….47
Figure 3-8: Polar S810i reciever..………………………………………………………………47
Figure 3-9: Average force requirements for the right hand joystick displacements of 10, 20, 30 and 40 degrees ....................................................................................... 52
Figure 3-10: Means and standard deviations for heart rate (BPM) ………………………..
Figure 3-11: Galvanic Skin Response (µSiemens), averaging 0.69±0.10 over 10 cycles over 4 days. ................................................................................................................. 54
Figure 3-12: Average Energy Expenditure (EE) ............................................................... 55
Figure 3-13: Average Metabolic Equivalent of Task (METs) ............................................ 55
Figure 3-14: Skin and Near-body temperature over 10 cycles. The recorded ambient temperature during the collection period 24±4.87oC. ................................................ 56
Figure 3-15: Mean ±Standard Deviation of Heart Rate, Energy Expenditure, Galvanic Skin Response, Heat Flux, Skin and Near -body Temperature vs Number of Consecutive Plate-Moving Cycles (current study) and Standpipes Cleaned (Wallace et al., 2010) ................................................................................................ 66
Figure 3-16: Skin and near-body temperature comparisons between stand pipe cleaners and crane operation during steel plate-moving tasks (Wallace 2010). ....... 71
Figure 4-1: Experiment setup showing the position assumed for the test subjects at 30 degrees of trunk flexion with A: visual obstruction in place, requiring the subject to lean forward to view the B: projection. C: Visual reference sentence………………..74
Figure 4-2: EMG electrode setup using the (A) Delsys SE-2.1 (Delsys Inc., Boston, MA) Biceps Brachii, Triceps Brachii, Anterior Deltoid right side and Erector Spinae (bilaterally). (B)Ag-AgCl surface electrodes (Multi Biosensors Inc., pre-gelled, 0.4 mm diameter, El Paso, TX) Upper Trapezius (bilaterally) Anterior Deltoid (left side), Posterior Deltoid (bilaterally) and Flexor carpi Radialis (bilaterally)……………….…77
Figure 4-3: 7.5cm reference electrode placement over the right clavical………………….77
Figure 4-4: Simplified practice projection for joystick inputs showing the joystick input position and frequency and inputs required. Right side, 20 degrees, hard stop. Left side, neutral, hard stop. ...................................................................................... 80
xii
Figure 4-5: Projection for trials showing the joystick position and the number of times (2x = two times) required to move the joystick into position from the previous position. Joystick inputs from centre, 10, 20, 30, 40 degrees, hard stop for the right joystick, and 20 degrees and 30 degrees for the left Joystick ........................... 81
Figure 4-6: Force (N) required to move the right hand joystick through 10, 20, 30, 40 and 45o of displacement. ........................................................................................... 84
Figure 4-7: EMG comparisons between muscles, side and 30o trunk flexion and neutral upright posture. Upper Trapezius (UT), Anterior Deltoid (AD), Posterior Deltoid (PD), Biceps Brachii (BB), Triceps Brachii (TRI), Flexor Carpi Radialis (FCR) and Erector Spinae (ES), Left side (LS), right side (RS) ................................ 85
Figure 4-8: EMG comparisons between muscles, neutral upright posture (Posture 1), forward trunk flexion (posture 2) and lumbar supported forward trunk flexion (posture 3) (UT)upper trapezius, (C)cervical muscles, (ES)erector spinae, (BB)biceps brachii and (TB) triceps brachii (Pigini et al., 1998) ................................ 88

xiii
APPENDIX I A I-1: Electrode placement for studied muscles. ............................................................. 106
APPENDIX II - Questionnaires A II-1: Localized Discomfort Questionnaire adapted from (Occupational Health and
Safety Council of Ontario (OHSCO), 2008) ............................................................. 109
A II-2 Body-Party Discomfort Rating Scale…….……………………………………………111 APPENDIX III - Forms.……..………………………………..……………………..…………111 APPENDIX IV – Electronics A IV-1: Simplified schematic of a AD620 instrumentation amplifier. These
components are integrated into one 8 pin Dip. The input transistors Q1 and Q2 provide a single differential-pair bipolar input for high precision. ............................ 117
A IV -2: Circuit schematic incorporating the Analog Devices AD640 Instrumentation amplifier and Analog Devices LT1163 Butterworth filter. ........................................ 118
A IV -3: PCB signal amplifier silkscreen transfer image (9v input utilizing a power bridge). .................................................................................................................... 119
A IV -4: PCB (prototype) etching results. Copper traces and pads prior to drilling and component installation. ........................................................................................... 119
A IV -5: PCB layout prototype for the AD620 and LTC1063 Butterworth filter labeled with components (final design). ............................................................................... 120
A IV -6: Camera and external trigger schematic utilizing a IC555 timer to power on the 12F675 microcontroller and the Vishay VO14642 SSR (solid state relay). Circuit accepts 5V-100ms pulse and allows devices up to 2A to be switched on while simultaneously sending the camera start code. Circuit is powered by 3VLi CR2025 disk battery. ............................................................................................... 121
A IV -7: PCB design for the device relay. (9v power supply). ......................................... 122
APPENDIX V – Camera Mount
A V -1: Microsoft Excel spreadsheet with calculations for correct magnet requirements for the camera mount. ............................................................................................. 123
A V -2: Initial camera mount design. ............................................................................... 123
A V -3: Final camera mount design. ................................................................................ 124
APPENDIX V – Computer Code ……………………………………………………………124
APPENDIX VI – Take Home Information…………………………………………………..140

xiv
ABBREVIATIONS / ACRONYMS
AD ARV
Anterior Deltoid Average rectified EMG values %MRVC
BB Biceps Brachii BMI Body Mass Index BMR Basal Metabolic Rate BPM Beats Per Minute CI Confidence Interval Cm Centimeter CMRR Common Mode Rejection Ratio DLW Doubly Labelled Water EE Energy Expenditure ECG EM
Electrocardiogram Electromagnetic
EMG sEMG
Electromyography Surface Electromyography
ES Erector Spinae FCR Flexor Carpi Radialis FOS Factor of Safety GSR Galvanic Skin Response HAL Hand Activity Level HR Heart Rate kcal Kilocalorie kg Kilogram MET Metabolic Equivalent of Task rMVC / MVC Maximum Voluntary Contraction N Newton NIOSH National Institute for Occupational Safety
and Health PD Posterior Deltoid REBA Rapid Entire Body Assessment REE Resting Energy Expenditure RH Relative Humidity RMS Root Mean Square RSI Repetitive Strain Injury RULA Rapid Upper Limb Assessment MRVC Reference Voluntary Contraction SI Strain Index SR Sweat Rate TRI Triceps Brachii UT Upper Trapezius VCO2 Volume of Carbon Dioxide VO2 Volume of Oxygen

1
Chapter One: Introduction and Problem statement
1.1 Introduction
With the high prevalence of musculoskeletal complaints in operators of heavy
machines operated with joystick controls (Hagberg 1984, Ariëns et al., 2000), there is a
need examine and quantify the muscular demands while performing long periods of low
intensity, high-precision repetitive joystick activity while sitting in fixed, non-neutral body
postures (Huysmans et al., 2006, Milerand et al., 1991, Punnet and Wegman 2004,
Attebrant et al., 1997, Jensen et al., 1993). Golsse (1989) reported joystick inputs
exceeding 2000/hr/day for operators of heavy machinery with joystick controls. Axelsson
and Pontén (1990) reported that 89% of forest machine operators experience upper
extremity and neck pain resulting from control and seat design, high joystick throws
exceeding 10 to 20 degrees in all directions with input forces ranging between 7-10N
(Hanson, 1990). Crane operators are not well represented in the literature, however, it is
possible to draw reasonable parallels from the existing body of literature from the heavy
machinery and forest industries as a guidepost for this research where joystick controls
are in common use.
Subjective observations of work tasks and questionnaires are insufficient to
understand the workloads which can lead to the development of shoulder and neck pain,
therefore, clearly defined quantitative methods must be employed to measure and
quantify the muscular demands on the upper limb, shoulder and neck. It is unclear to
what extent deviated postures contribute to musculoskeletal complaints (Punnett and
Wegman, 2004). The interaction of potential risk factors associated with joystick
manipulation and posture is a complex problem, involving operator postural affects
resulting from joystick design, external and internal forces, workplace requirements, and

2
repetition of movements, as well as psychosocial concerns. Past research has indicated
that during joystick manipulation, muscle activation in the shoulder (upper trapezius) is at
a constant static load of 2% Maximum Isometric Voluntary Contraction (MVC) (Asikainen
& Harstela, 1993; Attebrant et al., 1997; Nakata et al., 1993; Lindbeck, 1982 (as reported
by (Attebrant et al., 1997)), which are considered inappropriate by some experts and
thought to lead to long term damage of muscles and the development of repetitive strain
injuries (Jonsson, 1978). Others feel that a more acceptable upper limit is 1% MVC
unless adequate rest periods are given (Aarås & Westgaard, 1987).
1.2 Job Description
A travelling bridge crane (Figure 1-‐1) is comprised of a set of elevated rails (A)
running the length of the mill which are positioned parallel to each other at a distance
roughly equal to the width of the mill floor. The mobile crane mechanism is made up of a
bridge beam (C) and two carriages (B) allowing the bridge to move laterally while
supporting the hoisting mechanism (E). It is arranged such that the hoisting mechanism
can traverse across the bridge in both directions (F). The operator is suspended in a cab
below the bridge beam (D), 20~30 meters above the mill floor. The hook or electro-
magnets remains in front and below the operator at all times. From this position and
under the guidance of floor personnel, the operator can lift, move and release steel from
any position on the mill floor within the travel ranges of the carriage and hoist mechanism.
The operator has two joysticks controls and a rheostat. The joystick on the right allows
for left-right travel of the bridge/carriage via lateral inputs on the joystick while
simultaneously providing control over the transverse movement of the hoist mechanism
(F) via anterior posterior joystick inputs. The left joystick allows for anterior/posterior
inputs only, activating the hoist to lower or lift the load respectively (G). The hook can be
attached to electromagnets (not shown), which are controlled by the rheostat. The

3
rheostat supplies varying levels of current to the electro-magnets giving the operator fine
control over the number of steel plates he/she can lift as well as allowing for precise
placement by sliding. The geometry and design of the crane forces the operator to adopt
awkward postures (Figure 1-‐1 inset) that are maintained for long periods of time,
averaging over 17±2.3 minutes with less than 15±1.8 seconds of rest.
Figure 1-1 Position of the operator cab in relation to the steel mill floor. The forward flexed posture adopted by the operator. Elevated rails (A) on which the carriages travel (B), bridge beams (C), operator cab (D), hoist mechanism (E), movement of the hoist mechanism (F), hook (G).
1.3 Problem Statement
As previously stated, the geometry and design of the crane forces the operator to
adopt awkward and static postures while performing highly repetitious hand and arm
movements over prolonged periods. This may contribute to operators reporting pain
experienced in the neck, shoulder and back. It is hypothesized that the implementation of
a technology/engineering solution such as a camera system might allow operators to

4
assume a more neutral upright posture, thus minimizing the risk of developing
musculoskeletal disorders (MSDs) from the forward flexed postures required to perform
the job.
1.4 Research Objectives
The primary objectives of this research are to quantify the biomechanical and
physiological demands of overhead crane operation, and to test a neutral or nearly
neutral posture, which is hypothesized to reduce the overall EMG activation levels in the
stabilizing muscles of the shoulder and neck. The ‘Optimal’ posture is assumed to be a
slightly reclined position (5º) from vertical with the upper arms in a vertical position and
the work task at elbow height (Winkel and Westgaard, 1992). The purpose of this study
was to fill gaps in the literature as first steps towards the ergonomic optimization of crane
cab design.
1.4.1 Objectives: 1. To determine muscular activation levels of skilled crane operators while
performing their normal work related tasks.
2. To create a mock-up of the field conditions in a controlled laboratory
environment to investigate the efficacy of a camera-based system on reducing
muscle loading of the neck and shoulder from a forward flexed posture.
1.5 Thesis structure
The thesis is comprised of 5 chapters. The relevance of each chapter is
discussed briefly in the follow paragraphs.
Chapter 2 provides background information regarding musculoskeletal disorders (MSD)
as well as the structure and anatomy of the shoulder complex and tools used to access
the occupational risk factors that might lead to developing MSD’s in crane operators.

5
Chapter 3 describes the field data collection techniques and quantifies the biomechanical
physiological loads on the operator while performing the job.
Chapter 4 describes the laboratory collection methods and compares the biomechanical
and physiological loads between the camera simulation and the non-camera simulation.
Chapter 5 provides a summary of the research and a synthesis of the main conclusions
and recommendations for future work.

6
Chapter Two: Background
2.1 Introduction
This chapter identifies the risk factors and mechanisms that can lead to
musculoskeletal disorders (MSD), as well as the prevalence of MSD’s seen in operators
of heavy machinery. This chapter also introduces the anatomy and biomechanics of the
upper limb with joystick use and the techniques to identify risk and quantify the muscular
loads associated with bridge crane operation. The chapter also describes what
interventions have been tried to help mitigate the development of MSD’s in bridge crane
operators.
2.2 Musculoskeletal Disorder Definition
The National Institute of Occupational Safety and Health (NIOSH, 1997) identifies
musculoskeletal disorders (MSDs) as a group of conditions that involve the nerves,
tendons, bones and muscles which result in mild to disabling symptoms which can
include disorders such as carpal tunnel syndrome (CTS), tenosynovitis, tension neck
syndrome and low back pain (LBP) resulting in loss or reduced function, strength, and
range of motion (ROM).
2.3 Anatomy of Shoulder and Upper Limb
When discussing the complexities of the shoulder complex, it’s useful to have
some understanding of the structures involved. The shoulder complex is consists of four
functional muscle groups in the shoulder and neck, including bones, joints, ligaments,
tendons and bursae (Nordin et al. 2012). It contains several different types of joints,
typically categorized as synovial and gliding (Marieb 2003; Nordin et al. 2012). Synovial
joints are comprised of a fluid filled capsule of dense ligamentous tissue surrounding the
7
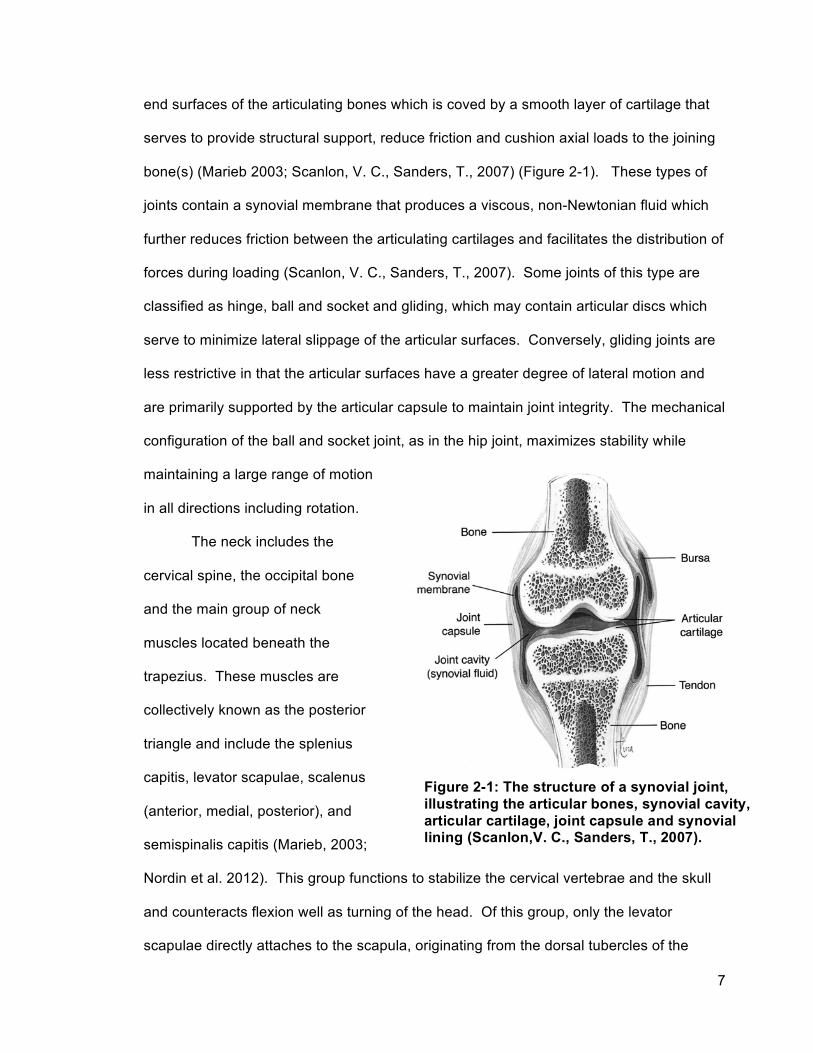
end surfaces of the articulating bones which is coved by a smooth layer of cartilage that
serves to provide structural support, reduce friction and cushion axial loads to the joining
bone(s) (Marieb 2003; Scanlon, V. C., Sanders, T., 2007) (Figure 2-1). These types of
joints contain a synovial membrane that produces a viscous, non-Newtonian fluid which
further reduces friction between the articulating cartilages and facilitates the distribution of
forces during loading (Scanlon, V. C., Sanders, T., 2007). Some joints of this type are
classified as hinge, ball and socket and gliding, which may contain articular discs which
serve to minimize lateral slippage of the articular surfaces. Conversely, gliding joints are
less restrictive in that the articular surfaces have a greater degree of lateral motion and
are primarily supported by the articular capsule to maintain joint integrity. The mechanical
configuration of the ball and socket joint, as in the hip joint, maximizes stability while
maintaining a large range of motion
in all directions including rotation.
The neck includes the
cervical spine, the occipital bone
and the main group of neck
muscles located beneath the
trapezius. These muscles are
collectively known as the posterior
triangle and include the splenius
capitis, levator scapulae, scalenus
(anterior, medial, posterior), and
semispinalis capitis (Marieb, 2003;
Nordin et al. 2012). This group functions to stabilize the cervical vertebrae and the skull
and counteracts flexion well as turning of the head. Of this group, only the levator
scapulae directly attaches to the scapula, originating from the dorsal tubercles of the
Figure 2-1: The structure of a synovial joint, illustrating the articular bones, synovial cavity, articular cartilage, joint capsule and synovial lining (Scanlon,V. C., Sanders, T., 2007).

8
transverse processes of the cervical vertebrae (1 - 4) and is the only muscle of this group
to directly involved in stabilizing the shoulder girdle. The shoulder girdle is comprised of
the scapula (shoulder blade), clavicle (collar bone) and the thoracic axial skeleton, in
particular the posterior ribs and the sternum. The clavicle is the only bony connection to
the axial skeleton and serves as a highly mobile, rigid support transmitting physical loads
directly to the axial skeleton. It also offers protection to the neurovascular bundle that
supplies the upper limb and is attached proximally to the sternum via a double plane
synovial joint with articular discs called the sternoclavicular articulation (Marieb 2003;
Nordin et al. 2012). Functionally, the sternoclavicular joint allows movement in three
planes, the anterior, posterior and vertical planes, although some rotation also occurs with
actions involving elevation (Nordin et al. 2012). The other joints in this system are the
acromioclavicular, glenohumeral and scapulothoracic, summarized in Table 2.1.

9
Table 2-1: Joints of the shoulder girdle, bones, supporting ligaments and muscles acting on the joint.
Joints Bones involved Supporting Ligaments Muscles acting across the Joint
(Synovial) Glenohumeral Humerus
Scapula Glenohumeral (superior, middle, and inferior)
Supraspinatus Infraspinatus Teres Minor Subscapularis
Acromioclavicular Scapula Clavicle
Inferior Acromioclavicular Superior Acromioclavicular
Deltoid
Sternoclavicular Sternum Clavicle
Anterior Sternoclavicular Posterior Sternoclavicular Interclavicular Costoclavicular
Pectoralis major
(Gliding) Muscles of scapular stabilization
Scapulothoracic
Scapula Posterior Thoracic rib cage
None, musculotendinous
Trapezius Levator Scapulae Rhomboid major Rhomboid minor Serratus Anterior Pectoralis major
The acromioclavicular joint (AC joint) is the junction between the distal end of the
clavicle and the acromion process (a bony projection of the scapula) and is technically a
gliding synovial joint (Marieb, 2003). Functionally, it enables one to raise the arm above
the head while transferring loads through the scapula to the axial skeleton via the
sternoclavicular articulation (Nordin et al. 2012).
The scapulothoracic joint (also known as the scapulocostal joint) is not a true
synovial joint. Rather, it is formed by the convex surface of the posterior thoracic cage
and the concave surface of the anterior scapula cushioned by bursae. The
scapulothoracic articulation allows for increased shoulder elevation (for every 2º of

10
glenohumeral elevation, there is 1º of scapulothoracic elevation) as well as protraction,
retraction, elevation, depression, and rotation in anterior posterior directions (Marieb,
2003).
The glenohumeral joint is the articulation between the head of the humerus and
the glenoid fossa (Figure 2-2). It is a shallow ball and socket (multi axial) synovial joint
further deepened by the glenoid labrum and further supported by the joint capsule. Much
of its stability comes from the surrounding muscles and ligaments rather than the
mechanical properties of the ball
and socket configuration compared
with other joints of this type. This
reduction mechanical stability
allows for greater range in motion
(Marieb, 2003; Nordin et al. 2012).
Functionally the glenohumeral joint
allows for adduction, abduction,
medial and lateral rotation, flexion
and extension of the arm. In
addition to the posterior triangle
and the levator scapulae previously
discussed, two additional groups of
muscles coordinate to control the arm. They include the trapezius, rhomboid major,
rhomboid minor and serratus anterior, which originate from the axial skeleton and insert
into the scapula (Marieb, 2003). As previously stated, the rotator muscles: teres minor,
infraspinatus, supraspinatus, subscapularis, stabilize the glenohumeral joint by pulling the
head of the humerus into the shallow glenoid fossa, thus acting as dynamic stabilizers as
Figure 2-2: Bony structures of the shoulder and its articulations. Insets are frontal schematics of the three synovial joints (sternoclavicular, acromioclavicular, and glenohumeral) as well as a lateral view of the bone-muscle-bone scapulothoracic articulation (Nordin et al. 2012).

11
the joint experiences increasing load (Nordin et al. 2012). Their origin is located at the
scapula and insert into the tuberculum (bony projections located laterally of the humeral
head (Figure 2-2).
It is not possible to use the arm without stabilizing the shoulder girdle and the
glenohumeral joint. Any arm movement requires continuous activation of the UT and the
erector spinae muscles (Winkel and Westgaard, 1992), and thus generates static load
components (Winkel and Westgaard, 1992, Aarås & Westgaard 1987, Winkel and
Oxenburgh 1991)). The UT acts as an anti-gravitational muscle of the arm carrying the
load that is transmitted though the glenohumeral joint. Assessment of the UT, anterior
deltoid (AD), medial deltoid (MD and posterior deltoid (PD) muscles by Lindbeck (1995),
Oliver (2000), and Northey (2004) while using joysticks of different stiffness concluded
that the UT is almost entirely dedicated to stabilizing the shoulder complex and is not
affected by joystick stiffness suggesting that a non neutral posture might task the UT
more strongly in performing this role.

12
Table 2-2: Muscles involved upper limb movements. (Luttgens 1996; Coury et al., 1998; Nordin et al. 2012).
2.4 Anatomy Related to Joystick Manipulation
Joystick manipulation involves complex movements of the upper limb, which
involve combinations of two or more motions. These movements are variable, both within
Movements Muscles involved
Flexion (150o-180o) • Anterior deltoid • Pectoralis major • Biceps brachii (long and short
heads) • Coracobrachialis
Extension (50o-60o) • Posterior deltoid • Latissimus dorsi • Teres major
Adduction • Pectoralis major • Latissimus dorsi • Teres Major • Teres Minor
Abduction (150o-180o) • Medial deltoid • Supraspinatus
Lateral Rotation (in abduction 90o ,in
adduction 70o)
• (Primary movers) • Posterior deltoid • (Secondary movers:
Musculotendinous cuff) • Infraspinatus • Teres minor
Medial Rotation (in adduction 70o-90o ,in
abduction 50o)
• (Primary movers) • Anterior deltoid • Latissimus dorsi • (Secondary movers:
Musculotendinous cuff) • Subscapularis • Teres Major
Retraction • Trapezius (Medial) • Rhomboid major • Rhomboid minor
Protraction • Serratus Anterior
Elevation • Trapezius (Upper)
Depression • Trapezius (lower)
Upward Rotation • Serratus Anterior • Trapezius (Upper)

13
and between subjects, and therefore many studies analyze only primary muscles that are
employed throughout the entire range of motion (Figure 2-3).
A B Figure 2-3: Musculature of the shoulder joint complex: (A) Anterior view illustrating superficial muscles (right shoulder) and deep muscles (left shoulder), and (B) posterior view superfical muscles (left shoulder) and deep muscles (right shoulder) (Munro, 2002).
2.5 Work-Related Musculoskeletal Disorders
Based on previous research, its clear that upper extremity movement results in
activation of the upper trapezius (Winkel and Westgaard, 1992). Postures such as neck
extension, trunk flexion and arm elevation are unavoidable in many occupations. Studies
with factory, clerical, and forestry workers demonstrate that awkward postures, static and
prolonged bending at the neck and trunk, are risk factors for the development of neck
pain (Ariëns, 2001, Nåbo 1986). A review conducted by The National Institute of
Occupational Safety and Health (NIOSH 1997) concluded that there was strong evidence
linking work-related musculoskeletal disorders and posture. Other risk factors identified:
repetition, force and vibration, however, the latter was not investigated in this thesis

14
(NIOSH, 1997). Figure 2-4 summarizes the conclusions made between work-relatedness
of musculoskeletal disorders and physical risk factors for the neck/shoulder and shoulder
regions in which workers were exposed daily or for entire shifts (NIOSH, 1997).
Figure 2-4:Work related risk factors as concluded by NIOSH (1997).
Buckle and Devereux (1999) and van der Windt (2000) included task duration as a
contributing risk factor associated with the development of work related musculoskeletal
disease (WMSD).
2.6 Musculoskeletal disorder prevalence
It has been reported that 42% of crane operators suffered from neck pain
(Zondervan 1989), whereas 50% suffered back pain (Burdorf et al. 1993). Another study
by Hellström and Lindell (1982) found that approximately 70% of crane operators
experience discomfort resulting from a bent forward sitting position, which is necessary to
keep the payloads in view while performing lifts close to or directly below the operator’s
cabin (Gustafson-Söderman, 1987). These numbers may be under estimated, as other
researchers have suggested that 80% of machine operators in the forestry industry

15
experience shoulder and neck pain (Axelsson & Pontén 1985). A later study by Axelsson
& Pontén (1990), indicated that 50-60% of machine operators experience symptoms of
neck and shoulder pain, bringing the numbers more inline with Zondervan (1989), but still
exceeding earlier reported values. It was found that flexion of the whole spine in the
sitting posture increases the EMG (electromyography) activity in the UT and thoracic
erector spine muscles (Schuldt et al., 1986) which collaborates with the conclusion that
the load on the neck is correlated to the trunk and head position (Winkle et al.,1992). As
previously stated, continuous arm movements generate load on the upper trapezius
(Winkel et al., 1990), resulting in a sustained static load ≥2% maximum isometric
voluntary contraction (MVC) (Asikainen & Harstela, 1993; Attebrant et al., 1997). This
level of sustained contraction can lead to the development of MSDs (Jonsson, 1982),
however, research by Aarås and Westgaard (1987) suggests that an upper limit of 1%
MVC is more appropriate since few studies have followed workers over longer time
frames. Lidén & Pontén (1985) studied 110 machine operators of whom 50% reported
current neck/shoulder complaints. They compared two groups of operators. The first
alternated between 3 hours machine operating time and 3 hours performing another non-
machine operating task. The second group shortened their work shift from eight to four
hours. They found that the complaint level between these two groups did not decrease,
indicating that shorter shifts and longer work breaks may not be a sufficient intervention.
They suggest that a combination of factors need to be implemented to reduce
neck/shoulder discomfort such as work place design, work technique and organizational
changes allowing for variation in job task. A later study by Pontén & Spahr (1991) tracked
39 machine operators from 1987 to 1990 to assess the effect of alternating work
environment, work tasks and work organization improvements, with no significant
reduction in the reporting of neck and shoulder complains. Löfroth & Pettersson (1982)
found an increase in complaints of neck and arm pain among Swedish forest machine

16
operators. An estimated 75% had at least some complaints over a 2-year period. 20-30%
experienced discomfort severe enough to either consult a physician or report an
incapacity preventing them from engaging in normal work activities. Hagen et al. (1998)
investigated 645 manual forest workers, 66 forest machine operators and 124
administrative workers. 35% of machine operators reported neck/shoulder complaints for
more than 30 days during the preceding 12 months, somewhat higher than the
prevalence in manual forest workers. Perkiö-Mäkelä and Riihimäki (1997) adjusted the
backrest to 105º for 18 machine operators and added a lumbar support resulting in a
significant reduction of neck/shoulder symptoms over a two-weeks period. This would
suggest that an ergonomic solution where the operator is in a neutral or near neutral
position has a positive effect (Winkel et al., 1992).
A similar review to the 1997 NIOSH one, reported a positive association between
decreases in mechanical load and the reduction in the prevalence of musculoskeletal
disorders (National Research Council: Committee on Human Factors, 1999). The report
also stated that there was less definitive evidence that low-level mechanical stimuli (or
small forces) produced musculoskeletal disorders. Although the review noted that there
has been quality research that suggests causal effects, it also stated that further research
is required to establish the exact relationship between musculoskeletal disorder and low-
level muscular contraction. Careful consideration of other contributing factors, such as
social and organizational factors, should also be included in situations where low levels of
biomechanical stress are experienced (Armstrong et al., 1993).
2.7 Musculoskeletal Disorder Mechanisms
As stated earlier, work related factors such as posture, repetition and force where
identified as contributing components to developing MSDs (NIOSH,1997), however, the
relationships are complex. MSDs are categorized by the involved structures that are

17
related, which include: muscle, tendon, nerve, circulation, joint and bursa (Hagberg,
1984). Muscle tenderness has been reported to be the most common finding in industrial
workers (Hagberg, 1984 as reported by (Bjelle et al., 1981); Maeda, 1977, Onishi et
al.,1976) and has been grouped into three areas: mechanical failure, energy metabolism
disturbance and local ischemia. The latter is widely accepted as being the predominant
mechanism associated with UT trauma from static loading (Järvholm, et al., 1991). Bjelle
et al. (1981) found that work consisting of high median contraction static contractions
above 10 to 20% MVC could lead to intermittent ischemia. It was hypothesized that, if
these contractions were frequent with little or no rest between them, the ischemia could
be cumulative thus depriving the muscles of oxygen and decreasing the removal of
metabolic by-products leading to the development of myalgia (Armstrong et al., 1993,
Henriksson et al., 1996). Onishi et al. (1976) reported that ischemia of the supraspinatus
did occur in workers who had neck and shoulder symptoms and was later supported by
research by Järvholm et al., (1991). Later research by Veiersted et al. (1993) showed
that problems resulting in myalgia could occur regardless of muscular contraction levels.
This has since led to the hypothesis that specific muscle fibers or motor units may be
selectively affected as a result of recruitment patterns (Kilbom 1994), or by one or more of
the following factors: vibration, cold temperatures, or direct pressure (Freivalds, 2004).
This leads to tingling, numbness and loss of fine control caused by contraction of small
arterioles causing a clumping action and reduction or complete loss of blood flow
consequently reduced inflow of oxygen and nutrients (Buckle & Devereux, 1999).
Hägg et al., (1990) proposed that the low-threshold motor units are working close to
their maximal capacity while helping to sustain static postures which lead to injury of
these units, despite the fact that the total workload is low. This hypothesis was supported
by a longitudinal study investigating machine paced packing work in which EMG was
recorded from the neck and shoulders (Veiersted et al. 1993). It was found that workers

18
who reported neck and shoulder symptoms took fewer rest pauses (0.9 versus 8.4 per
minute) and tended to have shorter pause durations compared to their asymptomatic co-
workers. The prolonged activation of these motor units near maximum capacity,
decreased blood flow, and increased metabolite concentration may explain the chronic
myofascial shoulder pain see in the trapezius muscles (Hagberg and Kvarnström 1984;
Larsson et al. 1988) and helps to explain the increase number of cases seen in workers
with increased level and duration exposure (Burt et al. 1990). By improving the
organization of the work space, and implementing equipment changes, Åaras (1994)
reported that he was able to significantly reduce the load on the trapezius (as measured
with EMG), thus reducing reports of neck pain and decreasing the number of sick days
taken.
2.8 Observations and Questionnaire
Obtaining subjective data from the worker by rating the level of perceived discomfort
experienced while performing their daily job tasks is a typical starting point for the
researcher (Niebel & Frelvalds, 2003). Surveys employed by NIOSH use body maps and
rating scales to assess discomfort in multiple regions of the body such as the neck,
shoulders, elbows, and wrists-hands, upper and lower back, hips/thighs, knees and
ankles/feet. Employing a diagram with a number scale assigned to each region allowing
the subject to assign a rating based on their perceived discomfort (Corlette et al. 1976).
The survey is administered before and after the shift as a means to discriminate between
task induced discomfort and non-job related sources. One of the problems associated
with this type of survey is that the term discomfort is not well defined and can mean
different things to different people varying results enormously.

19
Figure 2-5: Localized discomfort survey (Corlette et al., 1976). Adapted From (Occupational Health and Safety Council of Ontario (OHSCO), 2008)
Assessing work related musculoskeletal injuries (MSI) most commonly referred to
as MSD (musculoskeletal disorders) is a challenging and often-cumbersome undertaking.
It can cause costly disruptions to work flow and production, therefore, several
observational methods have been developed which are non-invasive, easy to employ by
ergonomists and researchers in the field, thus reducing resistance by industry to
participate in studies. The Rapid Upper Limb Assessment (RULA) and Rapid Entire Body
Assessment (REBA) provide a means to describe static postures (RULA) (McAtamney

20
and Corlett, 1993) and dynamic activity including movement frequency (REBA) (Hignett &
McAtamney, 2000). The Moore-Garg Strain Index (SI) is a job analysis tool used to
analyze jobs at risk of distal upper extremity disorders (hand wrist, elbow) (Moore & Garg,
1995). The index uses a rating similar to a Borg scale (Borg et al.,1960). The index uses
qualitative and quantitative ratings based on: intensity of exertion or the force required for
a single performance of the task, duration of exertion (average length of time associated
with each exertion including recovery time), efforts per minute, hand/wrist posture
(subjective measure), speed of work (subjective measure) and duration per day (which is
the total amount of time the job consumes) (Moore & Garg, 1995). The SI does not factor
in several key variables such as personal activities, medical history or body type and may
be inherently imprecise due to the subjective nature of the observations.
2.9 Physiological Assessment
2.9.1 Heart Rate
The relationship between heart rate (HR) and energy expenditure has been
extensively validated using indirect calorimetry, doubly labeled water and whole room
respirometry (Keytel, et al., 2005). It is one of the most useful and cost effective means to
estimate energy expenditure (EE) as well as providing useful insights about the type of
activity being measured. During moderate steady state physical activity, it has been
established that there is a linear relationship between heart rate and oxygen consumption
(McArdle et al., 2009). It is, however, subject to intra- and inter-individual variability from
such factors as chronic or acute illness, posture, emotional stress, hydration levels,
medication use and environmental factors, such as heat and humidity (Hebestreit & Bar-
Or, 1998). The linearity of this relationship is based on the assumption that resting HR is
equal to basal metabolic rate (BMR) (Rennie et al., 2001), however, it has been shown
that this is valid within a narrow range of 90-150 beats, therefore, more sophisticated non-

21
linear computer algorithms have been developed to give a more accurate estimation of
EE (Li, et al., 1993). These utilize factors, which have been shown to have a significant
interaction with EE such as age, weight and gender. HR can be measured by a number
of different technique. They include Doppler monitoring (using ultrasound), pulse
oximetry and electrocardiogram (ECG). All these methods are currently employed in
medicine as routine monitoring technique. Each of these methods are non-invasive,
however, doppler monitoring and pulse oximetry are impractical as the equipment is too
cumbersome or prone to read errors as the infrared probe can be easily removed from
the skin while working or may interfere with the job task. The electrocardiogram (ECG) is
the gold standard for monitoring HR. It detects the electrical signal from the heart as the
ventricles depolarize and measures the amount of variance between one waveform and
the next (Astrand et al., 2003). It is used in medicine to monitor the health of the heart,
detect and diagnose abnormalities by using 10 electrodes (12 lead ECG) to acquire a
detailed picture of the heart’s electrical activity during each beat. If one is only interested
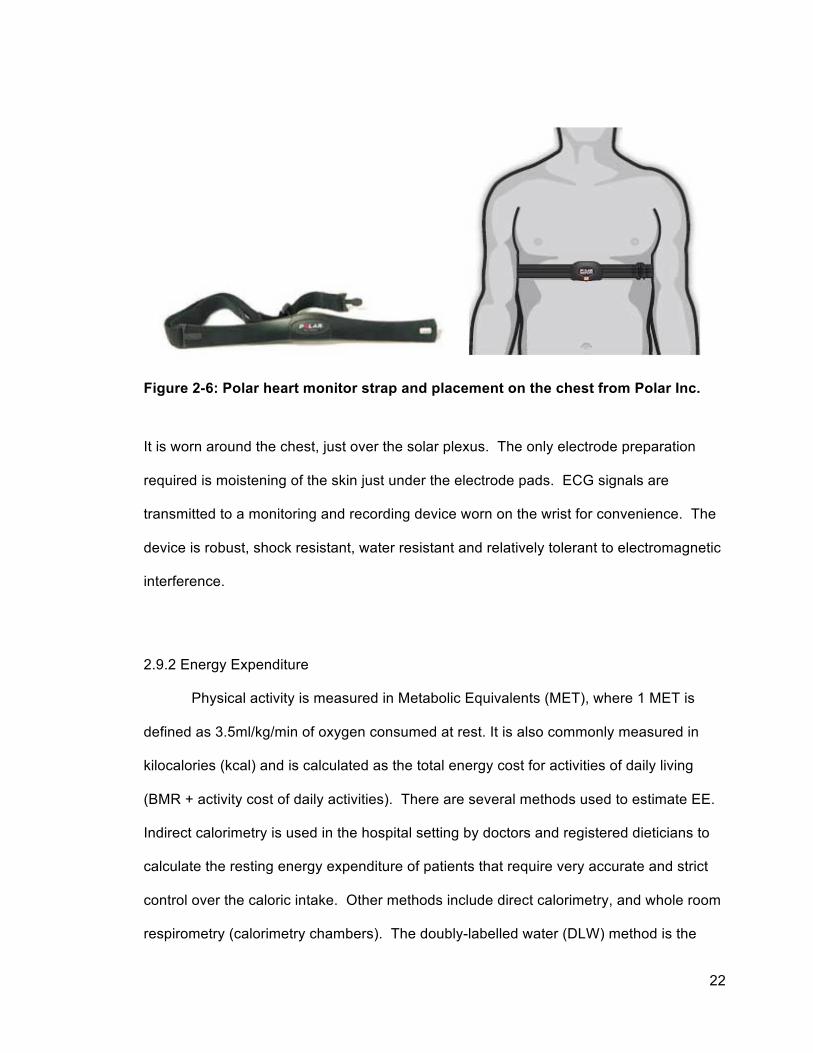
in heart rate rather than ECG waveform characteristics, Polar (http://www.polarusa.com/)
supplies a low cost and reliable monitoring device. The device consists of a watertight
moulded housing containing the electrodes, the sensing circuitry and a short-range
wireless transmitter (Figure 2-6).
22
Figure 2-6: Polar heart monitor strap and placement on the chest from Polar Inc.
It is worn around the chest, just over the solar plexus. The only electrode preparation
required is moistening of the skin just under the electrode pads. ECG signals are
transmitted to a monitoring and recording device worn on the wrist for convenience. The
device is robust, shock resistant, water resistant and relatively tolerant to electromagnetic
interference.
2.9.2 Energy Expenditure
Physical activity is measured in Metabolic Equivalents (MET), where 1 MET is
defined as 3.5ml/kg/min of oxygen consumed at rest. It is also commonly measured in
kilocalories (kcal) and is calculated as the total energy cost for activities of daily living
(BMR + activity cost of daily activities). There are several methods used to estimate EE.
Indirect calorimetry is used in the hospital setting by doctors and registered dieticians to
calculate the resting energy expenditure of patients that require very accurate and strict
control over the caloric intake. Other methods include direct calorimetry, and whole room
respirometry (calorimetry chambers). The doubly-labelled water (DLW) method is the

23
gold standard but requires the injection of radioisotopes, the extracting of blood and
collection of urine over an extended trial period lasting as two weeks or longer. The
invasive nature has the potential of putting the subjects health at risk and causing pain
and discomfort. This has legal and ethical consequences making it difficult to obtain
ethical approval needed to carry out the research.
2.9.3 Indirect Calorimetry
Indirect Calorimetry (IC) calculates EE by measuring the rate of respiratory gas
exchange between oxygen and carbon dioxide (Branson & Johannigman, 2004;
Murgatroyd, Shetty, & Prentice, 1993), and is expressed by the equation
EE(kcal/min) = (3.94 x VO2) +(1.1xVCO2)
Equation 1: The Weir Equation for Energy Expenditure where the volume of O2 and C02 is measured in (L/min) (Weir, 1949). It is widely used to
determine the caloric requirements of patients, modify nutritional regimens and predict
successful weaning from mechanical ventilation (Branson, R. D., 1990) by determining
the respiratory quotient (RQ) which is a modified form of the “Weir Equation”. From this
data, the number of calories burned per minute can be determined. Subjects lie quietly in
a bed while wearing a transparent,
lightweight plastic non-permeable
canopy over the head and neck (Figure
2-7). The procedure requires
establishing a resting metabolic rate for
45 minutes while breathing normally.
Falling asleep, or movement of any
kind can produce inaccurate results. Figure 2-7: Body Composition & Metabolism Laboratory University of Guelph photographer: Scott Schau.

24
2.9.3.1 Open-Circuit Systems
Open circuit metabolic carts (MC) are very useful in the clinical setting as they give
reliable results on O2 consumption and CO2 production and have been shown to be both
reliable and accurate compared with direct calorimetry methods (McClave, 1992). MCs
are not useful for field studies as they are cumbersome due to the inclusion of mask and
headgear and are cost prohibitive. A need for smaller, more robust devices such as the
MedGem® (Microlife Medical Home Solutions Inc,
Golden, CO) can measure O2 consumption to
estimate resting metabolic rate (RMR, REE or BMI).
This device is handheld and measures O2 in the
inspired and expired air by a dual channel fluorescent
quenching sensor. This is based on the deactivation
of ruthenium in the presence of O2. The ruthenium
cells are excited by an internal fluorescent light
source, and in the presence of O2 the reaction is
quenched which is proportional to the concentration of
O2. This reaction is sampled at 10Hz and the volume of air is measure using an ultra
sonic transducer at each end of the flow tube. The travel time of the sound pulse is
proportional to the flow rate of the gas in the flow tube. This device has been validated
against metabolic carts for resting (EE) (r=0.945) (Stewart, Goody, & Branson, 2005), but
the general design of the device makes it difficult to implement in a field study where
workers need complete or near complete freedom of movement.
Figure 2-8: MedGem (HealthTech Inc., Golden CO).

25
2.9.4 Direct Calorimetry
Direct calorimetry measures the rate of heat lost from the body to the environment,
primarily through evaporative heat loss, convection and radiation (Astrand et al, 2003,
Grucza, 1983, Murgatroyd et al., 1993).
2.9.4.1 Calorimeter Chamber
The calorimeter chamber is a tightly controlled sealed environment where the heat
flow is measured by monitoring all inputs and outputs from the room. This includes air,
water and waste products. The chambers are large, complex structures that are suitable
only in a laboratory setting (Murgatroyd, et al.1993).
2.9.5 Alternative Method
The SenseWear Pro 2 Armband
(SWA) (BodyMedia Inc., Pittsburgh PA.)
(Figure 2-9) combines various
physiological and movement parameters
such as accelerometry to increase the
accuracy in assessing physical activity. It
is worn over the triceps brachii of the
non-dominant arm, and combines data
from a variety of parameters including
heat flux, dual axis accelerometry,
galvanic skin response (GSR), skin
temperature, near-body temperature, and
demographic characteristics including
gender, age, height, and body mass (Teller, 2004).
Figure 2-9: SenseWear Pro 2 Armband from Body Media Inc.

26
The data collected by the SWA are converted into energy expenditure using
proprietary, activity-specific algorithms. The SWA also provides estimates of intensity
METs, frequency and duration of physical activity. An advantage with SWA is its design,
which allows individuals to wear the device without preventing them from participating in
everyday activities (Papazoglou et al., 2006). Previous studies in relatively young, normal-
weight adults reported that the SWA in combination with different software versions
accurately estimated the energy expenditure at rest. It was was less accurate when
compared with indirect calorimetry during various exercise protocols (Fruin and Rankin,
2004; Jakicic et al., 2004; Papazoglou et al., 2006; Welk et al., 2004). In a previous study,
SWA (with software version 4.0), was validated in obese individuals, showing that the
accuracy the SWA was poor in three exercise modes, cycle ergometry, stair stepping,
and treadmill walking (Papazoglou et al., 2006). However, with improvements in the
software, the SWA was found to be highly correlated with indirect gas exchange
calorimetry (r = 0.68; p = .001; 95% CI) in cancer patients experiencing malaise,
fluctuations in body weight, and levels of hydration due to chemotherapy (Cereda et al,
2007).

27
2.10 Electromyography
Electromyography is the measurement of the electrical activity of the muscles as
they contract allowing the researcher relate this activity to physical work. Electrical
impulses initiated by the brain are sent down the peripheral nerves to the motor neurons
initiating an action potential (DeLuca 1985). This activity is picked up by electrodes,
amplified, and stored on a recording device, which may be a portable data logger or
computer.
2.10.1 Description of Noise There is a significant amount of ambient noise generated by electromagnetic
devices such as large crane motors, power lines, radio, and the extremely powerful
electromagnets capable of lifting 20 tonnes of plate steel. Its suspected that this noise has
a wide range of frequency components, however, the dominant frequency component is
typically is 50 - 60Hz. Direct measurement of the EMI and RFI was not done, however,
considering the type of equipment in operation one has to take measures to shield or
remove the most significant amounts of noise prior to digital conversion, thus improving
the quality of processed signal.
2.10.2 Gain and Common Mode Rejection Ratio (CMRR)
Essentially, differential amplification subtracts the potential at one electrode from
that at the other electrode and then amplifies the difference. Correlated signals common
to both sites, such as from power sources and electromagnetic devices, but also EMG
signals from more distant muscles are suppressed. It is therefore desirable to have as
high of CMRR as possible to ensure a cleaner signal. The formula for calculating CMR
ratio is:

28
A(dB) = 20 log(10) (A0/A1)
Equation 2: Equation for Common Mode Rejection Ratio (CMRR). Subtraction of the potential at one electrode from that at the other electrode and then amplifies the difference Table 2-3: Comparison of logarithmic and linear scaling, which indicates the level of suppression of the signal components common to the bipolar leads input into the differential amplifier (Day, 2002).
dB Linear Scale
3 1.41
5
10 1.78
20
50 3.16
70 10
80 316
90
100 3160
2.10.3 Crosstalk / Noise Associated with EMG is a phenomenon known as crosstalk. This is where an
electrode can pick up more than one muscle’s electrical signal masking the muscle of
interest (Deluca 1997). The most common method for dealing with crosstalk is the proper
placement of the electrodes (Cram 1988). Cram (1998) has standardized electrode
placement over several muscles, which helps achieve a cleaner signal, however, there
are other factors that are important. They include, increasing electrode size,
(accomplished using a parallel bar geometry (Farina et al., 2002)), reducing inter-
electrode distance and maintaining the consistency of inter-electrode distance (Zipp
1992). The Delsys MyoMonitor IV System (Delsys, Boston MA) (Figures 2-11-2-12) is a
self-contained, integrated EMG system, which addresses these issues.

29
Figure 2-11: Delsys MyoMonitor IV System (Delsys Inc., Boston, MA, USA)
Figure 2-10: Delsys DE-2.3 electrode construction details, showing the shielding, electronics and curved geometry. (Delsys Inc., Boston, MA)
30
EMG electrodes connect into two 8-channel input modules, which are connect to the
MyoMonitor main unit, which transmits a wireless signal to a near-by laptop computer.
The electrode housings ensure the spacing between the 99.9% pure silver electrode bars
are consistent 1 cm apart; and contain pre-amplification at the collection site to improve
the signal-to-noise ratio as well as a curved geometry to ensure good skin contact, while
trying to minimize the effect of sweat and electrode movement on the skin (Figure 2-10).
Prior to the electrode placement, the skin is also prepared by shaving (if necessary),
abrasion with fine grit sandpaper and swabbing with a 70% isopropyl alcohol solution to
remove dead skin cells and oil on the surface of the skin to reduce the impedance. A
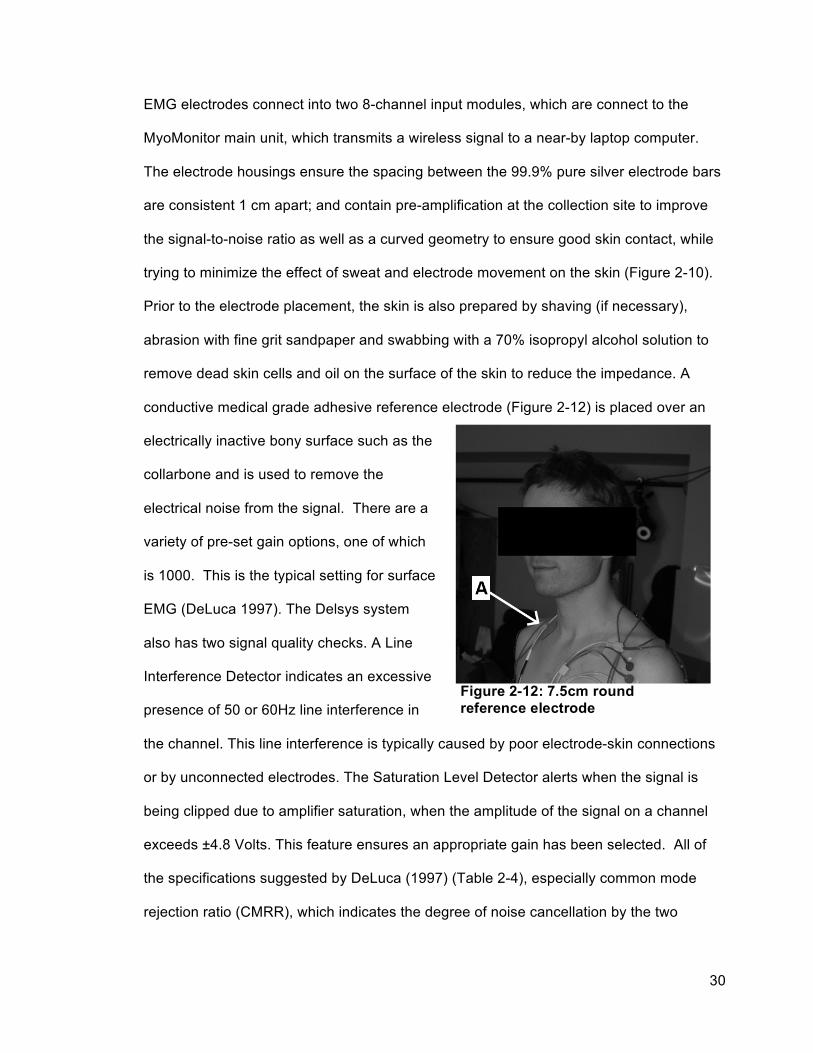
conductive medical grade adhesive reference electrode (Figure 2-12) is placed over an
electrically inactive bony surface such as the
collarbone and is used to remove the
electrical noise from the signal. There are a
variety of pre-set gain options, one of which
is 1000. This is the typical setting for surface
EMG (DeLuca 1997). The Delsys system
also has two signal quality checks. A Line
Interference Detector indicates an excessive
presence of 50 or 60Hz line interference in
the channel. This line interference is typically caused by poor electrode-skin connections
or by unconnected electrodes. The Saturation Level Detector alerts when the signal is
being clipped due to amplifier saturation, when the amplitude of the signal on a channel
exceeds ±4.8 Volts. This feature ensures an appropriate gain has been selected. All of
the specifications suggested by DeLuca (1997) (Table 2-4), especially common mode
rejection ratio (CMRR), which indicates the degree of noise cancellation by the two
Figure 2-12: 7.5cm round reference electrode

31
electrodes are surpassed in the Delsys MyoMonitor IV System, (Table 2-4) making it an
ideal system for EMG collection in this study.
Table 2-4: Specifications of the Delsys System compared to those recommended by C.J. DeLuca
DeLuca, 1997 Delsys System Bandwidth 20-500 Hz 20±5 to 450±50
Roll-off At least 12 dB/octave 12 dB/octave CMRR > 80dB Typically 92 dB, with a min. of 84 dB Noise < 2µV < 1.2µV
2.10.4 Normalization
EMG data varies between individuals and muscles over time, therefore, the
amplitude data, by itself is not useful unless a reference point, common to all
measurement occasions can be found. This allows for comparison between subjects,
muscles and discreet collection times (Burden A & Bartlett, R. 1999; McLean et al., 2003;
Yang & Winter, 1983; Yang & Winter, 1984) and is typically done by normalizing the
signal amplitude with respect to force by eliciting a maximum voluntary contraction (MVC)
against a static resistance for a prescribed period of time, or a submaximal contraction at
a known level (reference voluntary contraction mRVC) (Mathiassen et al., 1997; Attebrant
et al., 1995; and Merletti et al., 1995).
Enoka and Fuglevand (2001) and Ikai et al., (1967) found that untrained subjects,
could not reliably elicit an MVC. They demonstrated that repeated MVC showed a
greater decrease in the level of contraction over ES indicating that the decrease in the
force output was likely due to neural fatigue. Lawrence and Deluca (1993) later
suggested that MVCs are unreliable, finding that the average MVC of the knee extensor
varied substantially while the force remained constant, supporting the hypothesis that
training has an effect on neural motor recruitment and synchronization, not only by
allowing for greater force generation but also greater consistency between MVC trials
(Ikai et al., 1967; Howard & Enoka, 1991). Obtaining a maximal voluntary contraction can

32
only be accomplished with healthy subjects (Konrad, 2005), as “injury, pain or fatigue”
may impair the subjects’ ability or willingness to elicit a true maximal exertion, thus
negating the goal of MVC normalization discussed previously (Mirka, 1991, Mathiassen et
al., 1995). Some researchers agree that sub-maximal contractions also known as
reference voluntary contractions (mRVC) are more reliable (Yang and Winter, 1993) and
less strenuous on the subject (Hansson et al., 2000). This has the added benefit of
reducing fatigue, allowing for training prior to the trial, increasing the length of contraction,
and increasing the number of mRVC trials, thus improving reliability (Winter, 1983). The
subjects in the current field study were of varying age, health status, and fitness levels
and studies have shown that exertions above 80% 1-repetition maximum (1RM) causes
the subject to perform a Valsalva manoeuvre (MacDougall et al., 1985; MacDougall et al.,
1992). This could be a potentially hazardous manoeuver in persons whose cardiac status
and level of cardiovascular fitness is unknown. The Valsalva manoeuver is used to splint
the trunk and chest under heavy muscular exertions by filling the lungs, and forcefully
expiring against a closed glottis (the narrowest part of the larynx). This initiates a four
phase physiological response seen in Figure 2-13. (McArdle et al., 2009).

33
Figure 2-13: Four phases of the Valsalva Manoeuver. Phase I : Initial Pressures rise Phase II: Typical normal response of aortic pulse pressure with Valsalva Manoeuvre. b ii: acute drop in aortic pulse pressure followed by b ii: reflexive blood vessel constriction with some rise in pressure. Phase III: Pressure release. Phase IV: Return of cardiac output (Adapted from McArdle et al., 2009).
Phase I is characterized by an initial aortic pulse pressure rise forcing blood into the aorta
and left atrium, and out of pulmonary circulation due to the mechanical effects of elevated
intra-thoracic pressure followed by Phase II (a ii) an acute drop in aortic pulse pressure
(ABP), and a marked rise in HR. Phase II (b ii) is characterized by a gradual rise in ABP
resulting from baroreceptor and cardiopulmonary reflexes cause blood vessel
constriction. With continued strain, ABP once again decreases (phase III) as the
pressure in the chest is released, thus allowing for pulmonary vesicles and the aorta to re-
expand allowing cardiac output to increase. Phase IV represents the cessation of the
valsalva manoeuver and is characterized by a rapid rise in ABP, which over-shoots the
pre-strain levels. A drop in HR also occurs while increased peripheral vascular resistance
form high intensity exertions increases the arterial blood pressure and workload of the
34
heart through out exercise (Luster et al., 1996; Looga, 2005; McArdle et al., 2009). The
valsalva manoeuver and the associated ABP spike seen in phase IV may precipitate the
detachment of previously undetected arterial plaques or blood clots, initiate bleeding, and
induce irregular heart rhythms leading to cardiac arrest (Nagappan et al., 2002).
As stated previously, the cardiovascular heath and cardiac status of the subjects
in this study combined with unlikelihood of achieving a ‘true’ maximal contraction made
MVC normalization an unacceptable risk, thus mRVC normalization was chosen as a
more acceptable method.
2.11 Current Engineering Solutions
Merford, a Hungarian company (http://www.merford.com) has developed several
engineering interventions specifically seeking to improve operator’s posture and
preventing injury. These include the ErgoChair/ErgoSeat, Balan Seat (Figure 2-14) and
the Merford’s optical device (Figure 2-15) The MerfordSeat supports the upper body on
the elbows and forearms, encouraging more trunk flexion from the hips thus reducing a
slumping posture, whereas the BalanSeat supports the upper body in a harness allowing
forward rotation of the operator’s body improving vision of the work area while
simultaneously supporting the shoulder girdle allowing posture variation.

35
Figure 2-14: A) ErgoSeat/ErgoChair illustrating the forward flexed position with the operator supporting the weight of the upper body on the elbows and forearm. B) BalanSeat.
The Medford optical device (Figure 2-15) changes the angle of light coming into the eye
though a set of prisms allowing the operator to sit in a more neutral position while keeping
the work area in view. However, at the time of this writing, little evidence could be found
substantiating that these devices reduce the prevalence of MSD in the shoulder and neck.
Figure 2-15: Merford’s optical device
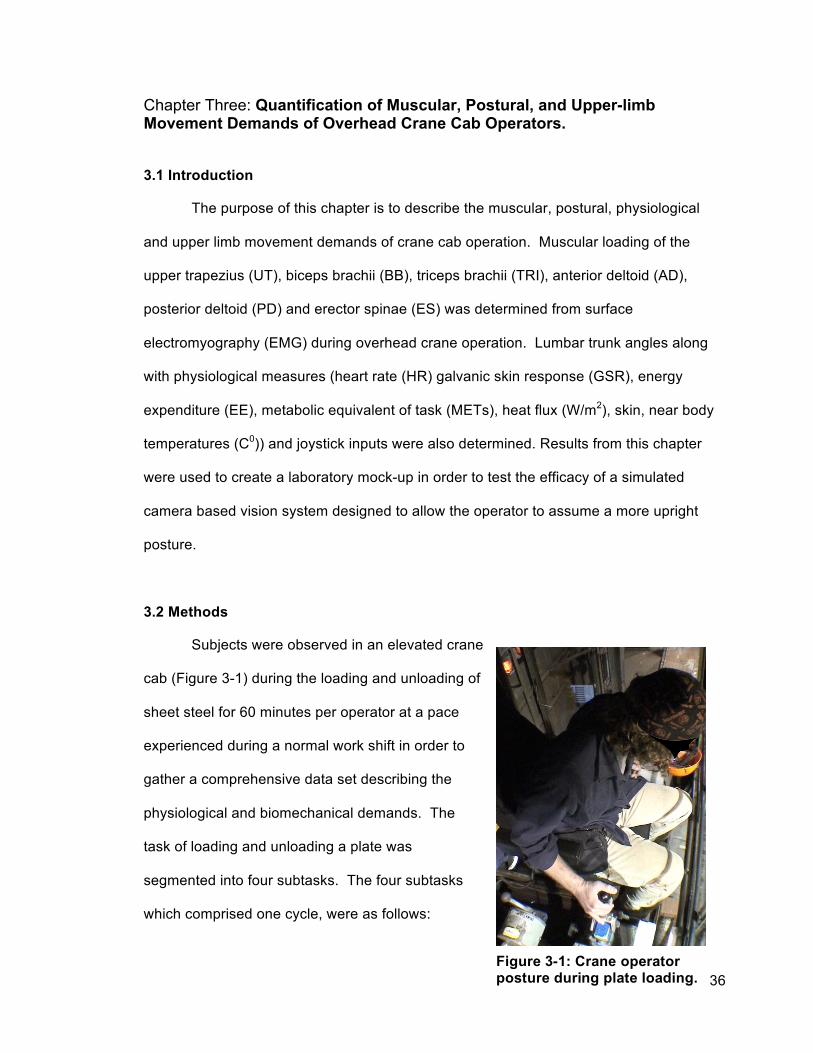
36
Chapter Three: Quantification of Muscular, Postural, and Upper-limb Movement Demands of Overhead Crane Cab Operators.
3.1 Introduction
The purpose of this chapter is to describe the muscular, postural, physiological
and upper limb movement demands of crane cab operation. Muscular loading of the
upper trapezius (UT), biceps brachii (BB), triceps brachii (TRI), anterior deltoid (AD),
posterior deltoid (PD) and erector spinae (ES) was determined from surface
electromyography (EMG) during overhead crane operation. Lumbar trunk angles along
with physiological measures (heart rate (HR) galvanic skin response (GSR), energy
expenditure (EE), metabolic equivalent of task (METs), heat flux (W/m2), skin, near body
temperatures (C0)) and joystick inputs were also determined. Results from this chapter
were used to create a laboratory mock-up in order to test the efficacy of a simulated
camera based vision system designed to allow the operator to assume a more upright
posture.
3.2 Methods
Subjects were observed in an elevated crane
cab (Figure 3-1) during the loading and unloading of
sheet steel for 60 minutes per operator at a pace
experienced during a normal work shift in order to
gather a comprehensive data set describing the
physiological and biomechanical demands. The
task of loading and unloading a plate was
segmented into four subtasks. The four subtasks
which comprised one cycle, were as follows:
Figure 3-1: Crane operator posture during plate loading.

37
1) Manoeuvring the cab into position over the work area;
2) Positioning the electromagnets onto the plate steel;
3) Lifting and travelling to the unload area and,
4) Positioning and release of the plate steel.
Approval from the University of Guelph Ethics Committee to conduct the study was
obtained prior to testing, and each subject provided informed consent prior to study
participation (Appendix III).
3.3 Subjects
Seven male crane operators aged 25-54 years (42.4±9.4 yrs.) (Table 3-1)
consented to being observed performing their job.
Table 3-1: Subject Information
Subject Age Weight (kg)
Height (cm) BMI
Water Content
(%)
Injury / Complaints
Experience (months/yrs)
Dominant Hand Smoker
1 25 86.3 177.8 27.2 52.4 Shoulder stiffness 6 months Right Yes
2 43 70.4 167.6 25.0 56.9 Shoulder/
Neck / Elbow
6 months Right Yes
3 54 104.5 167.6 37.3 49.8 Lower Back / Sore Neck 20 years Right No
4 47 94.3 170.2 32.6 51.5 Elbow/ Shoulders 8 months Right No
5 47 110.1 180.3 33.2 56.8 Upper back/
Right Shoulder
20 years Right Yes
6 36 83.1 172.7 27.8 54.1 Sore Neck 6 months Right No
7 45 105.8 165.1 35.3 60.4
Lower Back / Knees / Shoulder stiffness
7 years Right Yes
Average
42.4± 9.4
86.2± 14.4
145.8± 5.9
31.2± 4.6
54.5± 3.7

38
Each subject had a minimum of 6 months job
experience and reported some history of shoulder
pain. Body mass (kg), Height (cm), Body Mass Index
(BMI) and Water Content (%) were measured using
the Health-o-Meter® Bio-impedance scale (model
BFM681DAKH-63, Jarden Corp., Boca Raton, FL)
with shoes and socks removed.
3.4 Instrumentation
EMG was recorded using a 16 channel Delsys MyoMonitor IV System (Delsys
Inc., Boston, MA, USA), bandwidth 20 - 450±5 Hz, common mode rejection ratio 92db,
impedance < 2 MΩ, fixed gain 1000) (Figure 2-11-2-12). Heart rate data were recorded
with a Polar S810i HR Monitor (Polar Electro, Kempele, Finland)(Figure 2-6), galvanic
skin response, skin and near body temperature data were recorded for 10 cycles using a
SenseWear Armband Pro 2 (SWA, BodyMedia Inc., Pittsburgh PA). Data from the SWA
were recorded on the device once per minute, at 32 Hz (Teller, 2004) to conserve storage
memory. Variables recorded by the SWA included: metabolic equivalent of task (MET),
Galvanic Skin Response (Siemens), heat flux (W/m2), energy expenditure (EE) and skin
and near body temperature (0C) and was averaged for the data collection Period.
Ambient temperature, and relative Humidity were collected with a HOBO® U12-012
external data logger (Onset Computer Corporation, Pocasset, MA) at 4Hz.
Figure 3-2: Health-o-Meter Bio-impedance scale (Model BFM681DAKH-63, Jarden Corp., boca Raton, FL).

39
3.4.1 Electromyography
EMG was recorded bilaterally from the upper trapezius (UT), anterior deltoid (AD),
posterior deltoid (PD), biceps brachii (BB), lateral triceps brachii (TRI), flexor carpi radialis
(FCR), and erector spinae (ES) using a Delsys MyoMonitor IV System (previously
described) and a Toshiba Toughbook running EMGworks V3.6.0.0 data acquisition
software package (Delsys Inc., Boston, MA, USA) and post processed with MatLAB
(Version R2006b, Mathworks Inc., Natick, MA.). Skin was cleansed with alcohol and
lightly abraded prior to electrode placement in order to reduce electrode resistance.
Electrodes were placed centrally over the centre of the muscle belly, as described by
Cram (1998) and summarized in Appendix I. The reference electrode was placed over the
clavicle 2cm from the sternoclavicular joint. Electrode placement for each muscle was
verified by instructing the subject to perform a muscle specific contraction designed to
maximally activate that particular muscle.
3.4.2 Muscle Specific Reference Contraction
Separate mRVCs were performed (bilaterally and repeated for three trials) for
each muscle investigated (UT, PD, AD, BB, FCR, TRI, ES), by holding a defined mass
(Figure 3-3 and 3-4) in reference position. Each mRVC position was designed to elicit
maximal muscle activation for a prescribed load, as described by Bao et al. (1995) and
Mathiassen et al. (1995). mRVC trials began when the subject had achieved the proper
posture and continued for 15 seconds. Standing mRVC’s (UT, AD, PD, BB, FCR) were
randomized with each subject to minimize order effects.

40
I. Arms abducted to shoulder height palms facing down while holding a 1kg weight.
II. Arms abducted to shoulder height palms facing anterior while holding a 1kg weight.
III. Arms abducted to shoulder height palms facing down, elbows flexed 90 degrees, hands at solar plexus height while holding a 1kg weight.
IV. Arms at side, flex arm 90 degrees, palm facing up while holding 3.2kg weight.
Figure 3-3: Muscle specific reference contractions (mRVC) (Munro 2006).

41
V. Arms at side with palms medially rotated. Wrist flexing while holding 3.2kg weight
VI. Kneeling on knees supporting upper body with one hand. Start position: arm flexed 90 degrees. Finish position: extend arm so that hand, wrist and shoulder are in line while holding 2.5 kg weight, palm medially rotated.
VII. Feet supported in fixed position, hips and upper thigh supported on elevated platform. Edge of platform and hip joint lines up. Extend back until shoulders, hips and knees are inline while holding 2.5 kg weight with both hands mid sternum.
Figure 3-4: Muscle specific reference contractions (mRVC continued) (Munro 2006).
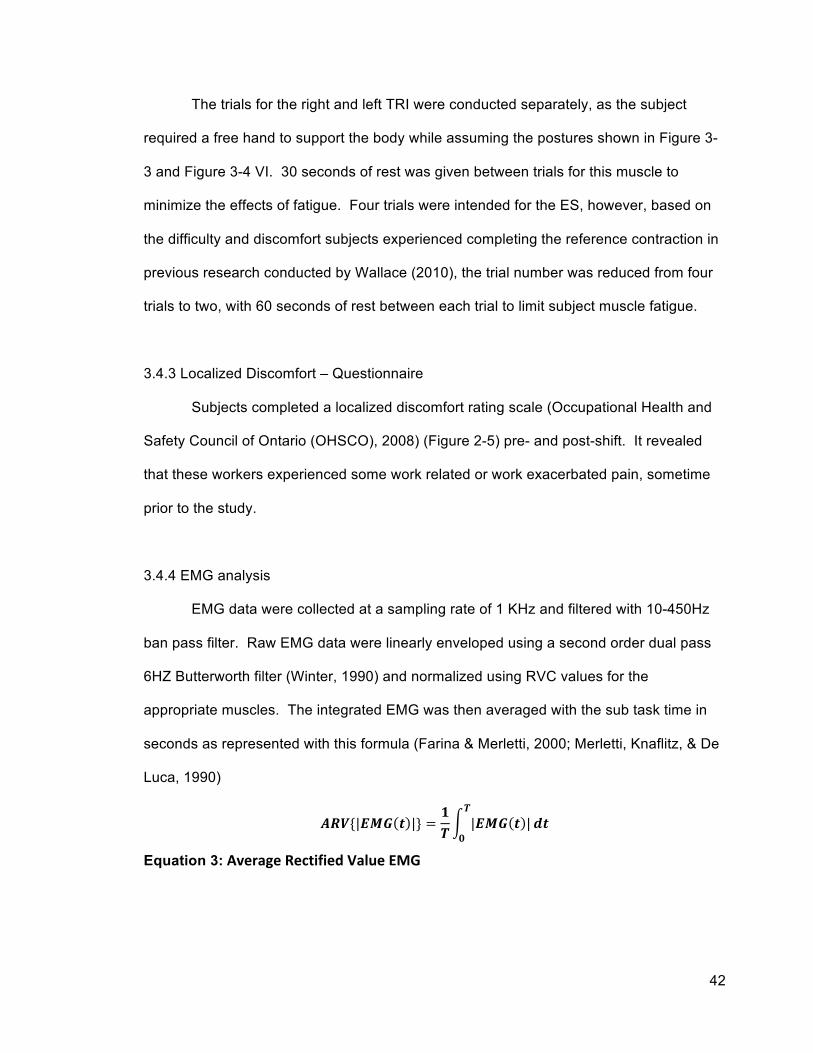
42
The trials for the right and left TRI were conducted separately, as the subject
required a free hand to support the body while assuming the postures shown in Figure 3-
3 and Figure 3-4 VI. 30 seconds of rest was given between trials for this muscle to
minimize the effects of fatigue. Four trials were intended for the ES, however, based on
the difficulty and discomfort subjects experienced completing the reference contraction in
previous research conducted by Wallace (2010), the trial number was reduced from four
trials to two, with 60 seconds of rest between each trial to limit subject muscle fatigue.
3.4.3 Localized Discomfort – Questionnaire
Subjects completed a localized discomfort rating scale (Occupational Health and
Safety Council of Ontario (OHSCO), 2008) (Figure 2-5) pre- and post-shift. It revealed
that these workers experienced some work related or work exacerbated pain, sometime
prior to the study.
3.4.4 EMG analysis
EMG data were collected at a sampling rate of 1 KHz and filtered with 10-450Hz
ban pass filter. Raw EMG data were linearly enveloped using a second order dual pass
6HZ Butterworth filter (Winter, 1990) and normalized using RVC values for the
appropriate muscles. The integrated EMG was then averaged with the sub task time in
seconds as represented with this formula (Farina & Merletti, 2000; Merletti, Knaflitz, & De
Luca, 1990)
𝑨𝑹𝑽{|𝑬𝑴𝑮 𝒕 |} =𝟏𝑻
|𝑬𝑴𝑮 𝒕 |𝒅𝒕𝑻
𝟎
Equation 3: Average Rectified Value EMG

43
providing an average rectified EMG value (ARV) using custom MatLabTM code
(MathWorks, Natick, MA) (Appendix VIII).
3.4.5 Video Posture and hand movements were recorded using a video compact digital
camera (Sony HDR-SR5, Tokyo, Japan) at 30 frames per second (fps). A video camera
(Sony HDR-SR5, Tokyo, Japan) was mounted in the top front corner of the cab capturing
posture and hand movements. Depending on the individual crane cab geometry, the
camera was positioned either to the left or to the right of the operator, giving the best
viewing angle while avoiding installed obstructions such as electrical panels or fans. It
was positioned to have a clear view of the foot and knee closest to the camera at all times
during the trial while a background reference object remained in view, allowing trunk
angles to be estimated.
The camera was attached magnetically via a custom-built Magnetic camera mount
with attached Manfroto™ mini ball head. The mount (Figure 3-5) consisted of neodymium
magnets, a Manfroto™ mini ball head, and shielding using
MuMetal™, a nickel-iron alloy composed of 77% nickel, 15%
iron, plus copper and molybdenum. This alloy has a very high
magnetic permeability, effectively protecting the camera and its
electronics from damage. The magnets were rated at a
combined holding power of 54kg and were rubber coated to
reduce slip during abrupt movement.
3.4.6 Joystick Forces
Forces on the joysticks were measured using an Ohaus Spring Scale (50 x 0.5N)
(Ohaus Inc., Parsippany, NJ), with the right hand joystick measured in four directions
Figure 3-5: Magnetic Mount with attached Manfroto™ mini ball head, and shielded using MuMetal™.

44
(Forward, backwards, left and right) at 10, 20, 30,40 and 45 degrees displacement. The
left hand joystick was restricted to forward and backwards movements. Forces for this
joystick were not recorded because the experimental setup exceeded the allocated time
impacting the production schedule.
3.4.7 Effects of Vibration and EM interference
The Myomonitor ® IV Wireless Transmission & Data logging Surface EMG System
was designed to operate within levels of EM interference that would typically be expected
in a laboratory setting. The system has a rated wireless range of 25~250m depending on
obstructions, however, in anticipation of EM interference in the testing environment, the
Myomonitor ® data logger and transmitter were kept within 1.5 m at all times (line of sight).
The system tolerated the EM fields produced by control systems and the electric motors
used to drive the crane, however, interference from 2-way radios when the operator
transmitted, prevented the EMG receiver from receiving data. Consequently, the
EMGworks software would crash as a result of corrupt data and would need to be
restarted. The video camera stored its video data in a 256MB solid-state buffer then
transferred the data to an internal hard drive, which was exposed to shock and vibration
as a result of crane cab movement. This vibration was anticipated and the camera and
mount was tested by attaching the camera to the frame of a Harley Davidson motorcycle
then driven for 30 minutes while recording. Video was recorded successfully on 3
separate occasions. The camera was then mounted in the cab of an excavator to
simulate the expected conditions in a crane cab, as its size and geometry were similar to
the smallest of the crane cabs used. The performance was verified over 3 hours of
recording including low light conditions. When a hard drive experiences shock or
vibration beyond its tolerances, it is designed to enter a mode referred to as “parking”
where the read/write heads are moved off the spinning platter into a position that attempts

45
to prevent permanent damage to the hardware resulting in potential loss of data. The
vibration experienced during long travel on the rails (Figure 1-1) caused the hard drives of
both the laptop and the camera to enter this mode. EMGworks would experience an
unintended shutdown when this occurred. To combat this, the laptop was held by its built
in handle for the duration of the data collection cycle, isolating the laptop from vibration by
using the experimenter’s body as a shock dampener, therefore minimizing the number of
software crashes experienced. Once the crane approached the end of its travel, the
equipment could be resynchronized. For these reasons, continuous data collection for
the entire 60-minute period was not possible.
3.4.8 Trunk Angles
Due to the time constraints in the production setting, the use of a goniometer to
measure trunk angles was not possible. Subjects instructed to sit in an upright position in
the crane cab prior to the trials at 90o hip flexion with a protractor. This was used as a
reference point from which trunk angles were measured from the video by a series of
reference markers on the far wall of the crane cab at known increments.
3.4.9 Video Analysis
Joystick movements characteristics including direction, displacement, frequency
and side were captured with a custom computer program written in FileMaker Pro 9.0
(FileMaker, Inc., Santa Clara, CA), using Apple QuickTime 7 (Apple Inc., Cupertino, CA)
video playback software which allowed camera footage to be loaded and controlled with a
custom written user interface and database storage system (FileMaker Pro, FileMaker
Inc., Santa Clara, CA). During processing, video was stepped forward and backwards at
1/8, 1/4, 1/2, 3/4, normal, 2x and 4x speeds with additional settings to step through the
video timeline with user defined frame blocks. The video was recorded at 30 fps to more

46
accurately record the start and end of each hand movement, the video needed to be
slowed down, stepped forward or backwards to decide when these events occurred.
Trunk angles were estimated using the same program and a time stamp was logged in its
internal database that corresponded with the joystick direction and displacement, thus
allowing for extraction of temporal information. The temporal variables included: amount
of time the joystick remained in a deflected position from neutral, time spent in the neutral
position and time between discrete positions not in neutral. This was recorded in terms of
video frames (30fps) and then output as seconds. Posture and joystick data (left and
right hand) were recorded separately, then exported as a tab delimited file allowing it to
be imported into Microsoft Excel where it was later aligned, based on timestamp within
the video.
3.4.10 Temperature and Humidity - HOBO® U12-012 External Data Logger A HOBO® U12-012 External Data Logger (Onset Computer Corporation,
Pocasset, MA) (Figure 3-6); was pinned to the operator’s seat back and synchronized to
the Toshiba Toughbook laptop.
Figure 3-6: HOBO® U12-012 External Data Logger (Onset Computer Corporation, 2009)

47
3.4.11 Physiological Data – SenseWear® Armband - Skin & Near Body Temperature, Energy Expenditure and Galvanic Skin Response.
The BodyMedia® SenseWear® Pro 2 Body Monitoring System BMS™ Armband
(SWA)(BodyMedia Inc., Pittsburgh, PA) (Figure 3-7) was worn over the triceps of the non-
dominant arm for 24 hours to predict their energy expenditure (EE) throughout their sleep
cycle which was used to approximate their basal
metabolic rate (BMR). An information sheet
(Appendix IX) was given to subjects with handling and
usage instructions as a supplement to the instructions
given by the researcher at the beginning of the data
collection period. The instructions were reviewed with
the subjects after the data collection period as re-
enforcement teaching to ensure that they understood
key handling precautions in circumstances such as swimming, bathing or showering. The
internal chronometer was synchronized to the Toshiba Toughbook laptop.
3.4.12 Heart Rate – Polar S810i HR Monitor Subjects were fitted with the Polar sensor strap (Polar
S810i HR Monitor, Polar Electro, Kempele, Finland) (Figure 2-6),
containing the electrodes, sensing circuitry and short-range
wireless transmitter over the solar plexus shown in Figure 2-6. The
wristwatch receiver (Figure 3-8) was worn on the operator’s non-
dominant hand.
Figure 3-7 :SenseWear Armband (BodyMedia, Inc, 2009).
Figure 3-8: Polar S810i HR receiver.

48
3.5 Test Protocol
Subjects were instructed to arrive 60 minutes prior to the start of their work shift for
instructions, setup of the EMG equipment and mRVC trials. 30 minutes prior to the
subject’s arrival, preparation work was initiated onsite for instrumenting the subjects in the
work area allocated by management. The preparation time was utilized to arrange the
provided space by moving unnecessary items from the room and to notify key personnel
so that the subject’s privacy could be maintained while they were fitted with the
instrumentation and while performing mRVC’s. This allowed for an opportunity to address
unanticipated issues that might have interfered with equipment setup, or to adjust for
changes to the company’s schedules. Following this, the experimenter, subject and
equipment were moved to the crane where the camera and computer was setup and
synchronized. The subject filled out the pre-work Localized Discomfort Rating Scale
during this time. Unanticipated issues with collection equipment due to vibration and
extensive electromagnetic interference (EM) required re-starting and resynchronizing the
equipment on several occasion during the collection period. Removal of the
instrumentation (except the SWA) was done during the subject’s lunch break taking
approximately 10 minutes at which time the subject filled out the post-work Localized
Discomfort Rating Scale. Joystick forces were measured during the first scheduled 15-
minute break period.
3.5.1 Instrumentation Synchronization
The initiation of the EMG collection automatically triggered the recording of the
camera via a connected infrared remote with a camera startup delay of 0.6 seconds. HR
and SWA were synchronized by pressing the start buttons (Figure 3-7, Figure 3-8) in view
of the video camera and then aligned to the other signals using the time stamp from the
video. A noted source of error was the delay between the pushing of the timestamp

49
button and the actual time stamp in the data file, which is could not be quantified but was
estimated to be < 0.5 seconds.
3.6 Statistics
Multi factorial ANOVAs analyses were performed on the right and left sides and
subtasks along with EMG as factors using the GLM procedure in Minitab (Minitab Inc.
Version 16, State College, PA, USA). The statistical model used in the analysis was
%mRVC = subject + muscle + subtask + side + three-way interactions + two-way
interactions + error. Subject was included in the statistical model as a random effect.
The subtasks as previously defined as:
1) Manoeuvring the cab into position over the work area,
2) Positioning the electromagnets onto the plate steel,
3) Lifting and travelling to the unload area and,
4) Positioning and release of the plate steel.
Since many separate ANOVAs were run, the level required to declare a significant
difference between means was set at p≤0.01. When appropriate, significant differences
between means were assessed using Tukey post-hoc analyses. Means and standard
deviations were calculated for the physiological variables as well as separate ANOVAs
using Minitab (Minitab Inc. Version 16, State College, PA, USA) for the heart rate (HR),
galvanic skin response (GSR), energy expenditure (EE), average metabolic equivalent of
task (METs) and skin and near body temperatures (Co) The statistical model used was:
physiological variables = subject + cycle + error.
3.7 Results
All seven subjects were observed in four separate cranes with three of the cranes
having identical controls and cab layout. The fourth crane was fitted with controls of the

50
equivalent geometry and design from the same manufacturer albeit a newer model.
Subjects were monitored during the first hour of their work shift over a total of four days.
3.7.1 EMG Results Factorial analysis of variance (ANOVA) on these variables revealed that %mRVC
was significantly different between muscles. They revealed that on the left side, the
%mRVC for the upper trapezius was significantly larger than anterior deltoid, posterior
deltoid, flexor carpi radialis and erector spinae. Completion of each cycle (comprised of 4
subtasks) took approximately 2 minutes. There was no statistical difference between
subtasks in terms of muscle activation; thus, all subtasks were collapsed into one
measure of activation. The left trapezius was 28.23% of mRVC compared to 30.51% of
mRVC (Table 3-2) for the right and remained relatively constant across the four subtasks.

51
Table 3-2: EMG and expressed as mean and standard deviation of average rectified value (ARV) normalized to % Reference Voluntary Contraction (%mRVC).
Position Muscles UT AD PD BB TRI FCR ES Left Side 28.24
±19.47 51.60 ±24.62
53.26 ±18.55
27.48 ±18.18
26.56 ±7.45
37.90 ±22.80
49.32 ±23.09
Right Side
30.51 ±21.19
28.14 ±14.41
42.11 ±25.45
28.24 ±19.47
31.11 ±23.05
37.17 ±09.32
42.24 ±19.28
UT: Upper Trapezius; AD: Anterior Deltoid; PD: Posterior Deltoid; BB: Biceps Brachii; TRI: Triceps Brachii; FCR Flexor Carpi Radialis ; ES: Erector Spinae
The UT was found to be significantly larger over other muscles for the right side. A
statistical difference between the right and left sides was found for the PD and ES.
3.7.2 Trunk Angles and Joystick Forces The trunk flexion angles adopted within and between subjects were relatively constant
throughout each subtask ranging between 19˚ and 30˚ (22.8±0.8˚). The average total
joystick inputs were 2234±748.3/hour, which corresponds to Golsse’s (1989) findings,
where operators were reported to exert as many as 2250 inputs per hour. 89.3% of the
inputs made with the right hand and 10.7% made with the left. Most movements were
made during subtasks 2 (Positioning the electromagnets onto the plate steel) and 4
(Positioning and release of the plate steel), averaging 39.4% and 42.4% respectively of
the total. Right hand joystick forces were measured in the anterior, posterior and lateral
directions, averaging between 9-31 N (anterior), 15.5-30.5 N (posterior), 14-30 N (lateral
left) and 9.5-24.5 N (lateral right). Increased force was measured with increasing
displacement with a marked rise in force at the hard stop, which was at 45o (
Figure 3-9).
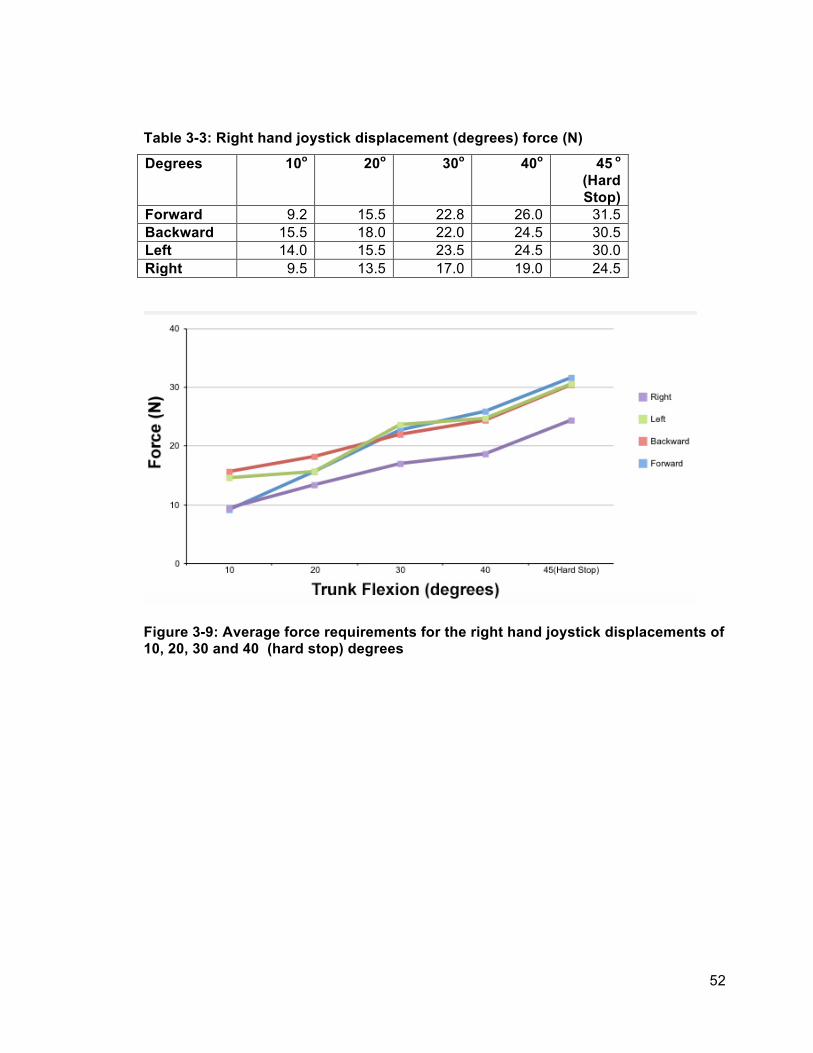
52
Table 3-3: Right hand joystick displacement (degrees) force (N)
Degrees 10o 20o 30o 40o 45 o (Hard Stop)
Forward 9.2 15.5 22.8 26.0 31.5 Backward 15.5 18.0 22.0 24.5 30.5 Left 14.0 15.5 23.5 24.5 30.0 Right 9.5 13.5 17.0 19.0 24.5
Figure 3-9: Average force requirements for the right hand joystick displacements of 10, 20, 30 and 40 (hard stop) degrees

53
3.7.3 Physiological Responses 3.7.3.1 Heart Rate
During crane operation, heart rate (HR) remained relatively constant, averaging
78.6±9.4 bpm over 10 cycles peaking at 90.3±6.4 bpm. The loading and unloading of
steel plates were repetitive with workers taking rest breaks from 30 seconds to 2 minutes
while waiting for instructions from the mill floor. ANOVA procedures found HR to be
significant ((p=0.002) and was elevated above resting. Cycle nine showed a moderate
increase over the other values. This may be a result of a near accident with one of the
operators at that time causing a rise in HR.
Figure 3-10: Means and standard deviations for heart rate (BPM).
3.7.3.2 Galvanic Skin Response
Galvanic skin response (GSR) is the sweat rate experience by the subject during
the work task. Average GSR over the 10 cycles was 0.69±0.10 µSiemens, with a peak of
0.8±1.13 µSiemens with large standard deviations for each (Figure 3-11). ANOVA
analysis found that GSR was significant (p=0.010). This measure was also elevated
above resting values over the 10 cycles measured.

54
Figure 3-11: Galvanic Skin Response (µSiemens), averaging 0.69±0.10 over 10 cycles over 4 days.
3.7.3.3 Energy Expenditure and METs
Energy Expenditure (EE) and METs were found not to be significant (p=0.080 and
p=0.080) respectively. Average EE during crane operation was 2.65±0.3 peaking at
3.2±1.9 placing it in the light Grade of Work (Astrand et al., 2003) and remained relatively
consistent over all the cycles (Figure 3-12 and Figure 3-13). The daily EE for all subjects
was 2552±295 kcal averaging 1.77kcal/min for the entire 24-hour period. METs also
remained relatively consistent over the 10 work cycles, which supports the findings for
EE.

55
Figure 3-12: Average Energy Expenditure (EE)
Figure 3-13: Average Metabolic Equivalent of Task (METs) 3.7.3.4 Skin and Near-Body and External Temperatures
During crane operations, the average ambient temperature as measured by the
HOBO® U12-012 was 24±4.87°C, with a peak of 27.2°C and average relative humidity
(RH) of 62±3.7%, Skin and near body temperatures averaged 31.4±0.4°C and
31.6±0.42°C, respectively with an increase with each successive cycle up to cycle 8
whereas cycles 8, 9 and 10 remained relatively consistent, suggesting a plateau. Heat

56
flux remained constant between 49.1 and 54.4 W/m2 (Figure 3-16). Near body
temperature was found to be statistically significant (p=0.010).
Figure 3-14: Skin and Near-body temperature over 10 cycles. The recorded ambient temperature during the collection period 24±4.87oC.

57
Table 3-4: Mean ± standard deviations of the physiological response variables (n=7 subjects) Cycle #
Time/ Cycle (s)
Heart Rate (bpm)
Heat Flux (W/m2)
Near Body Temperature (⁰C)
Skin Temp (⁰C)
Galvanic Skin Response (µSiemens)
Energy Expenditure (kcal/min)
METs
Rest 74.6±6.7 54.4±21.08 30.7±1.04 30.9±1.01
0.6±0.93 2.0±0.33 1.4±0.25
1 139±61.4 78.0±6.5 51.2±23.68 31.1±0.93 31.2±0.91
0.6±0.79 2.7±1.08 1.7±0.68
2 217±23.8 78.4±6.8 53.2±25.13 31.2±0.94 31.3±0.91
0.5±0.76 3.2±1.91 2.1±1.18
3 124±17.9 79.0±8.9 54.2±26.41 31.3±1.01 31.4±0.97
0.6±0.75 2.8±1.65 1.9±1.04
4 132±25.2 79.2±9.0 52.0±23.63 31.3±1.04 31.5±1.01
0.8±1.10 2.7±2.08 1.8±1.27
5 165±29.2 77.0±5.9 51.0±54.14 31.4±1.08 31.5±1.07
0.8±1.09 2.8±2.12 1.8±1.27
6 110±20.1 77.3±6.1 49.8±22.33 31.5±1.16 31.6±1.14
0.8±1.13 2.7±1.98 1.9±1.18
7 171±13.6 77.4±5.9 45.8±20.35 31.6±1.14 31.8±1.12
0.8±1.12 2.4±1.34 1.6±0.78
8 184±17.1 77.6±6.5 52.3±29.21 31.9±1.30 32.1±1.27
0.7±0.94 2.8±1.58 1.9±0.83
9 159±22.4 90.3±34.9 49.1±38.21 32.0±1.41 32.2±1.39
0.7±1.00 2.2±1.03 1.5±0.54
10 197±18.9 76.0±6.4 52.3±29.21 31.9±1.30 32.1±1.27
0.7±0.94 2.8±1.58 1.9±0.83

58
3.8 Discussion
Muscular, postural, physiological and upper limb movement demands of crane cab
operation were quantified for 7 overhead crane operators. The subjects studied revealed
surprisingly high upper limb and trunk muscle loading during overhead crane operation
and were required to maintain a forward, trunk-flexed position to adequately view the
workspace. It was found that operators were required to maintain greater than 20 degrees
of forward trunk flexion for 70% of their workday. While many of the physiological
measures were elevated over resting values, they were, for the most part quite low.
3.8.1 EMG “In biomechanics there are three applications which dominate the use of the surface EMG signal: its use as an indicator for the initiation of muscle activation, its relationship to the force produced by a muscle, and its use as an index of the fatigue processes occurring within a muscle.” (DeLuca, 1997)
The majority of the literature uses %Maximum Voluntary Contraction (MVC), which
is a more intuitive range and the most common normalization EMG method because it
assumes that subjects can elicit a true maximum exertion increasing validity of
comparison between subjects (Marras & Davis, 2001; Mathiassen, Winkel, & Hagg, 1995;
Milerad & Ericson, 1994; Mirka, 1991). Any pre-existing condition or injury may likely
prevent maximal exertion, as the subject being tested will be less motivated to exert
maximal exertion caused from pain, or compensate to minimize or further exasperate an
injury (Harms-Ringdahl, et al., 1996).
The mRVC method was chosen because the cardiovascular risk status of the
subjects was not known. Ethics required that the procedures be as safe as possible,
minimizing the potential for injury that MVC procedures can produce. It must be further
noted that MVC studies typically involved young, fit and athletic university students. In

59
contrast, subjects in this study were of varying age, health status, and fitness levels.
Studies have shown that exertions above 80% 1-repetition maximum (1RM) can cause
the subject to perform a valsalva manoeuvre (MacDougall et al., 1985; MacDougall et al.,
1992). This could be a potentially hazardous manoeuver in persons whose cardiac status
and level of cardiovascular fitness is unknown. Given these concerns, sub-maximal
contractions also known as reference voluntary contractions (mRVC), were deemed as
reliable (Yang and Winter, 1993), and less strenuous on the subject (Hansson et al.,
2000). The valsalva manoeuvre is used to splint the trunk and chest under heavy
muscular exertions by filling the lungs, and forcefully expiring against a closed glottis (the
narrowest part of the larynx). Phase IV as seen in Figure 2-13 (McArdle et al., 2009) the
possibility of this inducing a cardiac even was seen as the primary driver for mRVC
method being selected.
Surface EMG was used to provide a comparison of muscle activation and an
indication of muscle loading during overhead crane operation and the comparison of
relative amplitudes of EMG indicating muscle activation and relative intensity.
3.8.1.1 EMG Comparison
As has been mentioned previously, %MVC is the most common EMG
normalization method used to compare results between occupational tasks. It is therefore
necessary to use a conversion factor to gain meaningful comparisons between the
current study and previous work. A study by Balogh et al. (1999), found that the mRVC to
MVC ratio was 20% for industrial workers. Other studies have reported lower values
ranging from 17% to 18% for dentists (Milerad, et al., 1991) and hospital workers
respectively (Akesson, et al., 1997; Hansson, et al., 2000). Considering the population
studied in this thesis, the 20% ratio was chosen. Using the 20% ratio, the LUT
(28.23%mRVC) would correspond to 5.64%MVC and RUT (30.51%mRVC) would yield a

60
6.10%MVC respectively. This is above the accepted 2% upper limit, which is thought to
potentially lead to long-term damage of muscles and the development of repetitive strain
injuries (Jonsson, 1978). Field data collection was limited to an hour to reduce the
potential impact on productivity.
Studies with similar normalization procedures are compared in Table 3-5. All of
the studies except Wallace et al. (2010) used different hand and arm positions and
reference masses, which probably resulted in different %mRVC values than the current
study. However, these differences are probably small given that the reference masses in
all of the studies including the current one only ranged between 2.5 and 3 kg. Similarly,
differences between hand and arm positions in the various studies were slight and
expected to have a minimal effect on the results. The hand and arm positions were
selected to isolate and maximally activate the individual muscles while not exposing the
worker to undue cardiovascular strain, as their cardiovascular risk status was not known.
The motions required during dental tool use were quite small and required precise
motions with the arms being supported by armrests. Precision movements generally
require a greater effort, however, Milerad & Ericson (1994) measured smaller forces than
the joystick inputs, thus they were understandably smaller. Even light precision work has
been shown to increase shoulder musculature EMG levels (Milerad & Ericson, 1994). As
stated previously, joystick and work task demands seen in the current study revealed
greater upper trapezius forces compared to the study conducted by Murphy (2006) and
Milerad & Ericson (1994) likely resulting from smaller joystick forces and forward leaning
postures since the UT is required to support the head (Table 3-5).

61
Table 3-5: Comparison of EMG normalized to % Reference Voluntary Contraction (%mRVC)
Study Tasks Muscles
UT AD PD BB TRI FCR ES
Current Study Overhead Crane Joystick Manipulation (Steel Industry)
LS 28.24 ±19.47
RS 30.51 ±21.19
LS 51.60 ±24.62
RS 28.14 ±14.41
LS 53.26 ±18.55
RS 42.11 ±25.45
LS 27.48 ±18.18
RS 28.24 ±19.47
LS 26.56 ±7.45
RS 31.11 ±23.05
LS 37.90 ±22.80
RS 37.17 ±09.32
LS 49.32 ±23.09
RS 42.24 ±19.28
(Wallace,2010) Standpipe Cleaning
LS 177-‐240
RS 35-‐46
LS 442-‐596
RS 133-‐147
LS 785-‐843
RS 409-‐432
LS 470-‐517
RS 192-‐203
LS 313-‐368
RS 136-‐142
LS 301-‐305
RS 265-‐280
(Attebrant, Winkel, Mathiassen, & Kjellberg, 1997)
Crane joystick Manipulation (forestry)
24
(Murphy, 2006)
Joystick Manipulation
6.22±4.47 5.70±2.83 6.30±3.34
(Dumas, et al., 2008)
Keyboarding 21±3 8±2
Milerad & Ericson, 1994)
Manual Dental tool
6.4 (estimated from graph)
6.1 (estimated from graph)
Key: Left Side (LS) Right Side (RS) UT: Upper Trapezius; AD: Anterior Deltoid; PD: Posterior Deltoid; BB: Biceps Brachii; TRI: Triceps Brachii; FCR Flexor Carpi Radialis ; ES: Erector Spinae

62
In contrast, EMG magnitude for standpipe cleaners were greater, especially for the
left side upper trapezius due to left hand being used to chip the carbon from the standpipe
lid (Wallace, 2010). Right upper trapezius activation in the current study was more
comparable with the right upper trapezius for standpipe cleaners, including forestry
joystick use and keyboarding. Wallace (2010) concluded that the right UT was not
recruited because the right arm was not a primary force producer and was primarily used
to guide the scrapper tool. This was interesting considering the extreme demands of the
standpipe cleaner’s job in contrast to the crane operators.
3.8.1.2 Effects of Electromagnetic and Radio Interference
The Myomonitor® IV Wireless Transmission & Data logging Surface EMG System
was designed to work in a laboratory setting, with little radio interference and
temperatures ranging between 0-40°C (Delsys Inc., 2009). During data collection in the
current study, the effects of radio interference were seen during 2-way radio
communication between personnel on the factory floor and the crane operator between
loading cycles. This interference disrupted recording of EMG intermittently but was easily
seen in the EMG data and removed during processing.
3.8.1.3 Effects of Vibration
The bridge and its wheel assembly moved along bridge beams spanning the
length off the factory floor constructed of structural steel. Impact vibrations resulting from
the crane cab travelling over imperfections in the beam and expansion joints as well as
constant low impact vibrations activated a protective feature in the hard drives of both the
recording laptop and the camera, thus causing unavoidable interruption in data collection.
The interruption occurred during the extended travel from one area of the factory floor
when the operator was required to move the crane to a new work location. Fortunately

63
these interruptions occurred when the operator was not engaged in the defined loading
and unloading tasks being observed and therefore did not result in data being lost.
Recent advances in solid-state hard drives would minimize or eliminate this particular
issue.
3.8.2 Joystick Input Demands and Trunk Angles.
In the current study, crane operators were found to require joystick input forces
ranging from 7-30N. Resistance increased as the joystick angle increased from the center
start position as the return springs designed into the joystick mechanism increased
compression. The operator not only was required to move the joystick from the center
position but also was required to sustain a fixed static trunk position during crane
operation. Although, these joysticks were not hydraulically-actuated they exceeded
typical hydraulic-actuated joysticks used in the construction industry with an input range
of approximately 20o and input forces ranging from 7-10 N as reported by Hansson
(1990). Previous findings by Murphy (2006) measured average forces on more modern
hydraulic joysticks at 20.15 N and 18.87 N for forward and backward motions
respectively. These values were above the reported values by Hansson (1990), but were
still lower than the forces measured in the current study.
3.8.2.1 Joystick Displacement Ranges
The displacement ranges measured above 20 degrees in all directions, which
translates into movement distances from the starting point and ranging from 25 to 30cm
from neutral. The variation of the distances from neutral was the result of differing lever
lengths on the joystick. In contrast, modern mini joystick reduce the required joystick
inputs to less than 3cm, allowing for more consistent support of the forearm reducing
range of motion (ROM) (Attebrant et al., 1997), however, this increases precision

64
requirements, thereby increasing muscle loading (Milerad, et al., 1991). Operators in the
current study discarded armrests as a result of the long joystick throw, which necessitated
excess UT activation as a result of increased stabilization requirements particularly at the
end of lever throw. (Lindbeck, 1982; Attebrant et al.; 1997, Northey, 2004). Previous
research has demonstrated that continuous arm movements with a large ROM generate
loads on the upper trapezius (Winkel et al., 1990), resulting in a sustained static load ≥2%
maximum isometric voluntary contraction (MVC) (Asikainen & Harstela, 1993; Attebrant et
al., 1997). These levels have been suggested to increase the risk of developing repetitive
strain injury. This suggests that type and configuration of the joystick may play an
important role in reducing loading inputs, along with the repeated nature of the work task.
The left hand joystick required a full range of movement of 80 degrees from the neutral
position in the fore and aft movement directions.
3.8.2.2 Trunk Angles
The operators were required to maintain a forward, trunk-flexed position (23.9 ±
2.9 degrees) of forward flexion to adequately view the workspace for 70% of their
workday excluding two 15-minute work breaks. Trunk angles during the manoeuvring
tasks averaged 30.7± 0.4 degrees and the highest workload experienced by the operators
was seen at this time. The forward trunk flexion required that the UT remain in a constant
state of contraction to support the head. The EMG loading was 4.5 times higher than
loading reported by Murphy (2006) during joystick use. Considering that the study by
Murphy (2006) tested modern hydraulically activated joysticks and analysed the data
using different variables, the overall forces involved were so large in comparison, that it
would seem reasonable that crane operators would experience greater muscle loading,
even if tested with identical joysticks. This suggests that the larger loading seen in the
current study maybe the result of the increased demands placed on the operator from the

65
awkward posture adopted by the crane operators.
3.8.3 Physiological Demands
On the basis of HR and EE, the physiological demands for crane operators fell into
the light work category as classified by Astrand et al., (2003) and Brown and Growden,
(1963) (Table 3-6).
Table 3-6: Prolonged workload and cardiovascular response (Astrand, Rodahl, Dahl, & Stromme, 2003) and energy expenditure (Brown and Growden 1963). Workload Heart Rate (BPM) Energy Expenditure
(EE kcal/min)
Light work Up to 90 60-120 Moderate work 90-100 120-240 Heavy work 110-130 240-420 Very heavy work 130-150 Over 420 Extremely Heavy work 150-170
The occupational jobs such as standpipe cleaners (Wallace, 2010), place large
demands on the physiological systems in the body compared to crane operation.
Measuring these demands employs the use of Heart Rate (beats per minute BPM),
energy expenditure (EE) and metabolic equivalent of tasks (METs). They provide a good
measure independently, but as a collection, these measures reveal a clearer picture of
the occupational demands placed on the body.

66
Figure 3-15: Mean ±Standard Deviation of Heart Rate, Energy Expenditure, Galvanic Skin Response, Heat Flux, Skin and Near -body Temperature vs Number of Consecutive Plate-Moving Cycles (current study) and Standpipes Cleaned (Wallace et al., 2010)

67
3.8.3.1 Heart Rate
The overhead crane operators were mostly sedentary throughout their shift except
for rapid forearm movements for precise control of the joysticks and constant low level
contractions of the upper trapezius (UT) studied. HR was elevated over resting values by
6% and was very consistent between cycles. As previously stated, this was classified as
“light work” (Astrand et,al., 2003), therefore, HR may not accurately estimate the workload
experienced crane operators over longer periods. Joysticks and the voltage joystick
rheostat used in controlling the electric current to the electro-magnets required repeated
effort over the work cycle. Impacts transmitted to the cabin through via the steel bridge
beams as steel wheels fell into gaps in the rails and/or while rolling on uneven or rough
surfaces required additional operator stabilization using a variety of muscles. These
conditions resulted in abrupt perturbations in the cab while the operator was in a forward
hip flexed posture. The magnitude of these perturbations weren’t measured but seemed
to be considerable based upon observations by the researcher. The crane operators were
able to take frequent rests between the primary tasks of operation as the crane traveled
from one part of the factory floor to another area when the crane had to wait for other
workers on the factory floor to conduct work tasks before crane operations could
continue. Though significantly elevated over rest values, HR was quite constant over the
10 cycles. In contrast, standpipe cleaners manipulate long steel poles with hardened
scraper tip used to remove sediment from the lids of standpipes while dressed in fire
retardant equipment in high heat. The physical effort to accomplish this job is job is very
high (Wallace, 2010). HR was consistently high throughout the stand pipe cleaner’s shift
141±11.2BPM with a 192BPM peak, which demonstrates the extreme difference in the in
work performed between these jobs (Wallace, 2010). For subjects in the current study,
rest breaks were not self-directed but it seems that the low physiological demands did not

68
require recovery times as compared to standpipe cleaning (Wallace, 2010) or heavy
construction work (Abdelhamid & Everett, 2002).
3.8.3.2 Energy Expenditure
Crane operators had an average EE of 0.031 kcal/kg/min (2.6±0.33 kcal/min)
peaking at 0.039 kcal/kg/min (3.2±1.91kcal/min), and was found to not be significant in
ANOVAs (p=0.000). The average for workers in this study fell below the ranges of other
occupational tasks, such as carpentry (0.031-0.081kcal/kg/min) and cement finisher
(0.027-0.073kcal/kg/min) (Abdelhamid and Everett 2002) (Table 3-8). Standpipe cleaning
resulted in EEs of more than 3 times higher than the crane operators monitored in the
current study (0.056-0.095kcal/kg/min; 8.8±1.2 kcal/min) (Wallace, 2010) (Table 3-8).
Passmore & Durnin (1955) set 0.061 kcal/kg/min (5kcal/min) as an EE limit but the
newest NIOSH equation (NIOSH, 1997; Waters, Putz-Anderson, Garg, & Fine, 1993)
uses 0.027-0.057kcal/kg/min (2.2-4.7kcal/min) as a physiological cut-off criterion for an 8-
hour shift. These job task comparisons demonstrate that the crane operation is a less
physiologically demanding occupation overall.
Table 3-7: Job Task Comparison energy expenditure (Abdelhamid and Everett 2002, Wallace 2010). Activity Energy Expenditure (EE) (kcal/kg/min) Crane operator 0.023~0.039kcal/kg/min (Present Study) Standpipe cleaners 0.056-0.095kcal/kg/min Wallace, 2010 Carpenter 0.031-0.081kcal/kg/min Pipe fitter 0.022-0.064kcal/kg/min Cement finisher 0.027-0.073kcal/kg/min Iron worker 0.019-0.071kcal/kg/min Bricklayer 0.028- 0.055kcal/kg/min

69
3.8.3.3 METs
METs are multiples of an individual’s resting oxygen uptakes, defined as the rate
of oxygen (O2) consumption of 3.5 mL of O2/min/kg body weight in adults. The peak
METs measured was 2.1±1.18 and was in the light work classification (Table 3-8)
(0.69±0.10) but remained relatively constant throughout. Compared to common tasks
(Table 3-8), walking to a car or watering plants have higher values, however, crane
operators have higher values compared to light activity while sitting (Table 3-10).
Table 3-8: Potential Energy Expenditure Rates of Various Activities (Astrand, Rodahl, Dahl, & Stromme, 2003)
Activity Metabolic Equivalents (METs)
Gardening (no lifting) 4.4 Household tasks, moderate effort 3.5
Lifting items continuously 4 Light activity while sitting 1.5 Loading/unloading car 3 Lying quietly 1 Mopping 3.5 Mowing lawn (power mower) 4.5 Raking lawn 4 Riding in a vehicle 1 Sitting 0 Taking out trash 3 Vacuuming 3.5 Walking the dog 3 Walking from house to car or bus 2.5
Watering plants 2.5

70
3.8.3.4 Galvanic Skin Response
Galvanic skin response is intended to provide an indication of sweat rate. As the
crane cabs were climate controlled to approximate 24 °C in July 2008, the GSR was fairly
steady (0.69±0.10 µSiemens) over 10 cycles of steel plate loading compared to the
increase which occurred for each subsequent stand pipe cleaned by the standpipe
cleaners (Wallace, 2010). Not surprisingly, the mean GSR for standpipe cleaners was up
to 7.5 times that of crane operators (Wallace et al., 2011) as the stand pipe cleaners were
in a high temperature environment wearing heavy safety equipment which did not allow
for evaporative cooling thus promoting sweating in an unsuccessful effort to cool the
body. ANOVA analysis revealed that GSR was significant (p=0.000) for this measure.
3.8.3.5 Heat Flux skin and near body temperature
Heat flux remained relatively constant between 49 and 54.4 W/m2 indicating that
heat was being transferred from the subject to the environment allowing for adequate
cooling during work. Research conducted at the same facility on standpipe workers
recorded levels 20W/m2 higher on average (Wallace, 2010). Where the crane operators
consistently lost heat to their environment, standpipe cleaners gained heat (Figure 3-19)
from their environment, likely as a result of their close proximity to extremely high heat,
from cleaning standpipes that were in full operation. Skin and near body temperature
showed an increase with every successive cycle up to cycle 8, however cycles 8-10
remained relatively constant, suggesting that the workers reached a plateau. Video
revealed that workers took measures to cool themselves by opening windows, turning on
fans or removing clothing after cycle 7.

71
Figure 3-16: Skin and near-body temperature comparisons between stand pipe cleaners and crane operation during steel plate-moving tasks (Wallace 2010).
3.9 Synthesis and Conclusions
ANOVA procedures performed on physiological data revealed that most variables
expressed by loading and unloading cycles were significantly elevated over rest values,
however, variable values were for the most part quite low (Table 3-9), suggesting that the
overall physiological load was relatively low.
Subtasks contained a number of joystick movements such as lifting and travelling
to the unload area (subtask 4) but which maintained the forward trunk flexion described
previously, would seem to suggest that trunk posture might play a greater role in
sustained muscle activation than arm movements alone. Despite the higher movement
frequency seen on the right hand side over the four subtasks, the upper trapezius muscle
activity remained relatively high but constant during most of the work cycle.

72
Tukey post hoc procedures showed that different combinations of muscle,
subtask and side, required different levels of muscle activation to complete the task;
however, the upper trapezius was observed to remain at a higher level throughout.
These results indicate that operators might be at increased risk of developing neck and
shoulder pain due to the forward neck and trunk flexion. Suggestions to address the
concerns that have been shown to increase the risk of MSDs include alterations to the
joysticks that minimize the large arm movements observed in the current joysticks in use.
In addition to adjustable joystick placement such as pronation of the hands, active arm
supports and computerized posture monitoring, which subtly changes the operator’s
working position at timed intervals. Active armrests are envisioned as supporting the
weight of the arm but allow full freedom of movement by sensing arms as they shift and
adjusting position to maintain support in real time. These field data were used to
development a laboratory mock-up, which approximated the crane cab geometry and
movement demands. The mock-up was used to determine if a camera vision system
would allow operators to sit in a more neutral trunk posture in order to reduce muscular
demands.
By collecting field data, a more precise engineering intervention could be targeted
to address problem(s) experienced performing the occupation. The opportunity to collect
biomechanical, physiological and metabolic data in the field was rare and was essential in
creating a laboratory mock-up that allowed for a separate biomechanical condition to be
tested that would not be feasible or possible in a normal industrial setting.
These results suggest that the primary issue with overhead crane cab operation is
upper limb and trunk muscle loading. Results confirm the need to investigate a muscle
load reduction intervention such as camera systems to reduce awkward postures.
73
Chapter Four: Crane Joystick Laboratory Mock-up
4.1 Introduction
The field study data reported in chapter 3, revealed surprisingly high upper limb
and trunk muscle loading during overhead crane operation. The operators were required
to maintain a forward, trunk-flexed position (23.9 ± 2.9 degrees) of forward flexion to
adequately view the workspace for 70% of their workday. Trunk angles during the
manoeuvring task averaged 30.7± 0.4 degrees and the highest measured workload. The
objective of the study outlined in this chapter was to measure the loading experienced
when operators assumed a more neutral upright posture while using the same joysticks
and seat configuration as was used in the field. This posture and the experimental set-up
was designed to simulate a camera based system. The upright posture was then
compared with a forward flexed posture, which was designed to simulate the trunk angles
experienced in the field during the manoeuvring task. The purpose of this was to
determine if a camera-based system could reduce muscular loading requirements.
4.2 Methods
Subjects were seated in a laboratory mock-up of an overhead crane cab (Figure
4-1) with the feet flat on the floor and their knees at a neutral position of 90o flexion.

74
Figure 4-1: Experiment setup showing the position assumed for the test subjects at 30 degrees of trunk flexion with A: visual obstruction in place, requiring the subject to lean forward to view the B: projection. C: Visual reference sentence.
They were then instructed to perform joystick movements representative of movements
and postures observed and quantified from the field data collected. The joystick
movements previously presented in chapter 3 were: right side, anterior, posterior, and
lateral joystick movements though deflections of 10o, 20o, 30o, and 40o and left side,
anterior posterior, deflections 30o to full stop (40o) at trunk angle of 30o, then repeated in a
neutral, upright sitting position, 15o from vertical without arm rest support. The lab
simulation included the simulated tasks of:

75
1) Manoeuvring the cab into position over the work area; 2) Positioning the
electromagnets onto the plate steel; 3) Lifting and travelling to the unload area and, 4)
Positioning and release of the plate steel. These four subtasks are defined in this study
as one work cycle.
4.3 Subjects:
Eleven right-handed male subjects who ranged between 22 and 47 years old
(age 29.7±8.6 years; height 177±9 cm, mass 86.6±26.2 kg) completed the study. They
had no previous experience with joystick and lever operation and had no history of
musculoskeletal disorders or shoulder pain. Weight (kg), Height (cm), Body Mass Index
(BMI) and Water Content (%) were measured using the Health-o-Meter® Bio-impedance
scale (Model BFM681DAKH-63,Inc., Largo, Florida) with shoes and socks removed.
Approval from the University of Guelph Ethics Committee to conduct the study was
obtained prior to testing and each subject provided informed consent (Appendix III).
Table 4-1: Subject biometric information (lab study). Age, weight, height, body mass index, water content, hand dominance and smoking status.
Subject Age Weight (kg)
Height (cm) BMI
Water Content
(%)
Dominant Hand Smoker
1 47 79 168 28.1 52.4 Right Yes 2 27 82 184 24.2 56.9 Right No 3 25 59 165 21.7 49.8 Right No 4 40 73 171 25.0 51.5 Right No 5 23 77 168 27.3 56.8 Right No 6 24 86 180 26.5 54.1 Right No 7 27 95 185 27.8 57.4 Right Yes 8 25 74 178 23.4 51.2 Right No 9 24 80 180 24.7 53.2 Right No
10 43 83 180 24.6 55.1 Right No 11 22 75 170 26.0 56.8 Right No
Average
29.7±8.6 86.7±26.2 175.3±6.8 25.4±2.0
54.1±2.7
76
4.3.1 Instrumentation
Surface EMG data were collected using a Noraxon Telemyo (model 500, Noraxon
USA Inc.) telemetered EMG system and a Delsys Bagnoli-8 tethered system (Delsys Inc.,
Boston MA) at a fixed gain of 2000, bandwidth of 10-500Hz, common mode rejection ratio
of >100dB at 60Hz, input impedance <2 mega ohms).
Trunk angles were monitored with a Biometrics SG150 goniometer (Biometrics
Ltd, Ladysmith,VA). Electromyography and goniometer signals were 16 bit A/D converted
at a sampling rate of 2000 Hz using WorkStation™ software (v4.6, Vicon Peak, Oxford,
UK). Forces on the joystick were measured prior to the study using a Chatillon® DFE
series force gauge (AMTEK Inc., Largo, Florida) in four directions (forward, backwards,
left and right) at 10, 20, 30, 40 and 45 degrees displacement.
4.3.2 Electrodes and Goniometer Placement
Skin was cleansed with alcohol and lightly abraded prior to electrode placement in
order to reduce electrode resistance. If necessary body hair was removed by shaving to
ensure that electrodes could be attached securely. Surface EMG signals were collected
using bipolar Ag-AgCl surface electrodes (Multi Biosensors Inc., pre-gelled, 0.4 mm
diameter, El Paso, TX) and Delsys SE-2.1 (Delsys Inc., Boston, MA) attached centrally
over the centre of the muscle belly, located at a centre to centre distance of 2.5 cm as
described in Cram (1998). The reference electrode (Figure 4-2) was placed over the
clavicle 2cm from the sternoclavicular joint. The goniometer was placed across the right
hip joint, attached to the skin with carpet tape and worn under the subject’s clothing.

77
Figure 4-2: EMG electrode setup using the (A) Delsys SE-2.1 (Delsys Inc., Boston, MA) Biceps Brachii, Triceps Brachii, Anterior Deltoid right side and Erector Spinae (bilaterally). (B)Ag-AgCl surface electrodes (Multi Biosensors Inc., pre-gelled, 0.4 mm diameter, El Paso, TX) Upper Trapezius (bilaterally) Anterior Deltoid (left side), Posterior Deltoid (bilaterally) and Flexor carpi Radialis (bilaterally).
Figure 4-3: 7.5cm reference electrode placement over the right clavical.

78
4.3.3 Muscle Specific Reference Contractions (mRVC) for EMG Normalization
To provide EMG normalization data, separate mRVCs were performed (bilaterally
and repeated for three trials) for each muscle investigated (UT, PD, AD, BB, FCR, TRI,
ES), by holding a weight (Figures 3.3 – 3.4) in the prescribed reference postures. Each
mRVC position was designed to elicit maximal muscle activation for a prescribed load, as
described by Bao et al. (1995) and Mathiassen et al. (1995). mRVC trials began when the
subject had achieved the proper posture and continued for 15 seconds. mRVCs were
performed such that each subject performed the mRVCs in a different sequence, (by
muscle) to minimize order effects. The trials for the right and left TRI were conducted
separately, as the subject required a free hand to support the body while assuming the
postures shown in Figures 3-3 and 3-4. 30 seconds of rest were given between trials for
this muscle. Four trials were originally intended for the ES in the field study design, but
based on the difficulty and discomfort subjects experienced completing the ES reference
contraction in the field study, the procedure was replicated so that more direct and
meaningful comparisons could be made.
4.4 EMG Analysis
EMG data were collected at a sampling rate of 1 KHz and filtered with a 10-450Hz
band pass filter. Raw EMG data were linearly enveloped using a second order dual pass
6Hz Butterworth filter (Winter, 1990), normalized using the RVC values for the appropriate
muscles. The integrated EMG was then averaged with the sub task time in seconds
(Farina & Merletti, 2000; Merletti, Knaflitz, & De Luca, 1990) providing an average
rectified EMG value (ARV) using custom MatLabTM code (MathWorks, Natick, MA)
(Appendix VIII).

79
4.5 Test Protocol
After receiving instructions, the subjects were given time to familiarize themselves
with the experiment setup. Two practice sessions in the two postures studied were
conducted allowing the subjects to practice with the controls. Following the practice, the
reference voluntary contractions (mRVC) outlined in 4.3.3 were performed followed by 15
minutes of rest to reduce the possibility of muscle fatigue affecting the study results.
Following the mRVC procedures, two 12-minute trials comprised of repetitions of the four
subtasks (Section 4.5.1) were conducted for each experiment condition. One condition
used an upright posture, while the second trial used a 300 forward flexed posture (Figure
4-1). Trials alternated between upright or forward flexed posture between subjects to
minimize order effects. An adjustable obstruction was placed in front of the subjects
requiring them to maintain a fixed forward flexed posture of approximately 30○during this
portion of the study (Figure 4-1).
4.5.1 Subtasks and Randomization
The task was subdivided in subtasks comprised of: 1) Manoeuvring the cab into
position over the work area; 2) Positioning the electromagnets onto the plate steel; 3)
Lifting and travelling to the unload area and, 4) Positioning and release of the plate steel.
The subtasks and their associated joystick movements were chosen based upon actual
crane operation requirements observed in the field (Chapter 3). In the lab, the subtasks
were projected on a screen in a position approximating the conditions associated with a
lift close to the crane thus requiring the highest forward flexed trunk angle. Subtasks
were performed in the same order for all trials for all subjects in both the flexed and
upright posture, since this was the order in which they occurred in the field study. As
stated previously, each 12-minute data collection segment consisted of six continuous,
two-minute tasks with each, consisting of different average representative joystick inputs
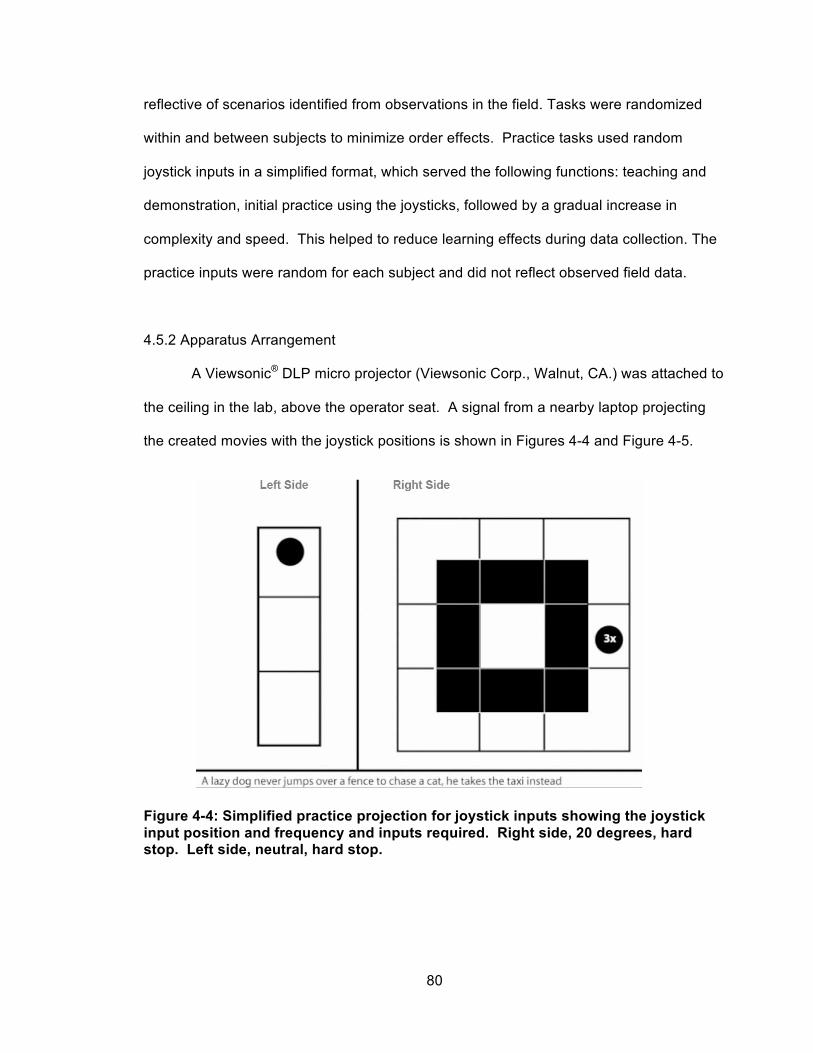
80
reflective of scenarios identified from observations in the field. Tasks were randomized
within and between subjects to minimize order effects. Practice tasks used random
joystick inputs in a simplified format, which served the following functions: teaching and
demonstration, initial practice using the joysticks, followed by a gradual increase in
complexity and speed. This helped to reduce learning effects during data collection. The
practice inputs were random for each subject and did not reflect observed field data.
4.5.2 Apparatus Arrangement
A Viewsonic® DLP micro projector (Viewsonic Corp., Walnut, CA.) was attached to
the ceiling in the lab, above the operator seat. A signal from a nearby laptop projecting
the created movies with the joystick positions is shown in Figures 4-4 and Figure 4-5.
Figure 4-4: Simplified practice projection for joystick inputs showing the joystick input position and frequency and inputs required. Right side, 20 degrees, hard stop. Left side, neutral, hard stop.

81
Figure 4-5: Projection for trials showing the joystick position and the number of times (2x = two times) required to move the joystick into position from the previous position. Joystick inputs from centre, 10, 20, 30, 40 degrees, hard stop for the right joystick, and 20 degrees and 30 degrees for the left Joystick
The trunk angle was set using a protractor and maintained by placing a visor in
front of the subject requiring them to maintain the trunk angle in order to view the
simulation. The subjects were required to read a reference sentence that appeared at
intervals throughout the simulation as an additional level of feedback. If they were able to
keep this reference sentence in view, the 30o trunk angle could be easily maintained.
Figure 4-4 illustrated the practice setup where the center square in both left and right side
set of boxes represented the joystick start positions. Moving dots within the grid indicated
the joystick position. The subjects were required to mirror the dots seen on screen with
the joystick inputs. Displaying a numbered dot represented fine joystick inputs. The
subjects were then instructed to quickly move to that position from the previous position
before proceeding to the next movement as directed by the simulation. Using these rules,
the simulation was increased in difficulty, (Figure 4-5) where the first boxes from centre
82
equalled 10 degrees of joystick displacement, the red boxes equalled 20 degrees
displacement and so forth. The Joysticks produced an audible “click” with tactile feedback
for the subject at each interval.
4.6 Statistics
Multi factorial ANOVAs analyses were performed on the right and left sides and
subtasks along with EMG as factors using the GLM procedure in Minitab (Minitab Inc.
Version 16, State College, PA, USA). The statistical model used in the analysis was
%mRVC = subject + muscle + subtask + side + three-way interactions + two-way
interactions + error. The level required to declare a significant difference between means
was set at p≤0.01. When appropriate, significant differences between means were
assessed using Tukey post-hoc analyses.
4.7 Results
Forces on the joystick measured using a Chatillon® DFE series force gauge in
four directions (Forward, backwards, left and right) at 10, 20, 30, 40 and 45 degrees
displacement ranged between 14.3-30.7N (23.4±7.3) for forwards motions. For
backwards movements they ranged between16.3-29.0N (23.3±5.7), whereas for left
movements they ranged between 13.7-26.0N (21.3±5.3) and for right movements they
were from 13.3-23.7N (19.7±4.40). For all directions, the force was found to increase with
increasing displacement as a result of the return spring design. The 45o displacement
was the hard stop with resulted in a larger rise in forces because of the sudden
deceleration. Laboratory measurements closely reflected data collected in the field, which
indicated that the laboratory mockup was an accurate simulation. Forces measured in
the lab increased sharply from 19N to 23N on average at 20 degrees of defection then
plateaued after the 30 degree position and rose by an additional 2N on average. The

83
field data also had a similar force profile, however the increase in force between the 10
degrees of deflection to the 40-degree position was more gradual across this range. The
laboratory peaked at 27.5N compared to 31N for the field data. Forces at the beginning
of the joystick movement were similar in both cases. This suggests that the joystick
arrangement and use accurately reflected real world use. The higher forces seen in the
field data could be attributed to the averaging of several different crane cabs whereas the
laboratory measured a single controller. The sharp rise at the 20-degree position in the
lab study could be the result of operator inexperience and an effort to keep pace with the
simulation. The left and right joysticks had different force profiles between the directions
for a given displacement. The left hand joystick was of a lever ratchet design with 13.97N
required to increment the lever to each successive point within its range, with 80 degrees
of displacement from vertical in the anterior and posterior directions. This lever did not
have return springs, therefore, once moved to each point, no further force was required to
maintain the position.
Results showed that subjects were able to maintain a trunk flexion of 27.9±1.8
degrees as measured by the Biometrics SG150 goniometer (Biometrics Ltd, Newport.
UK).
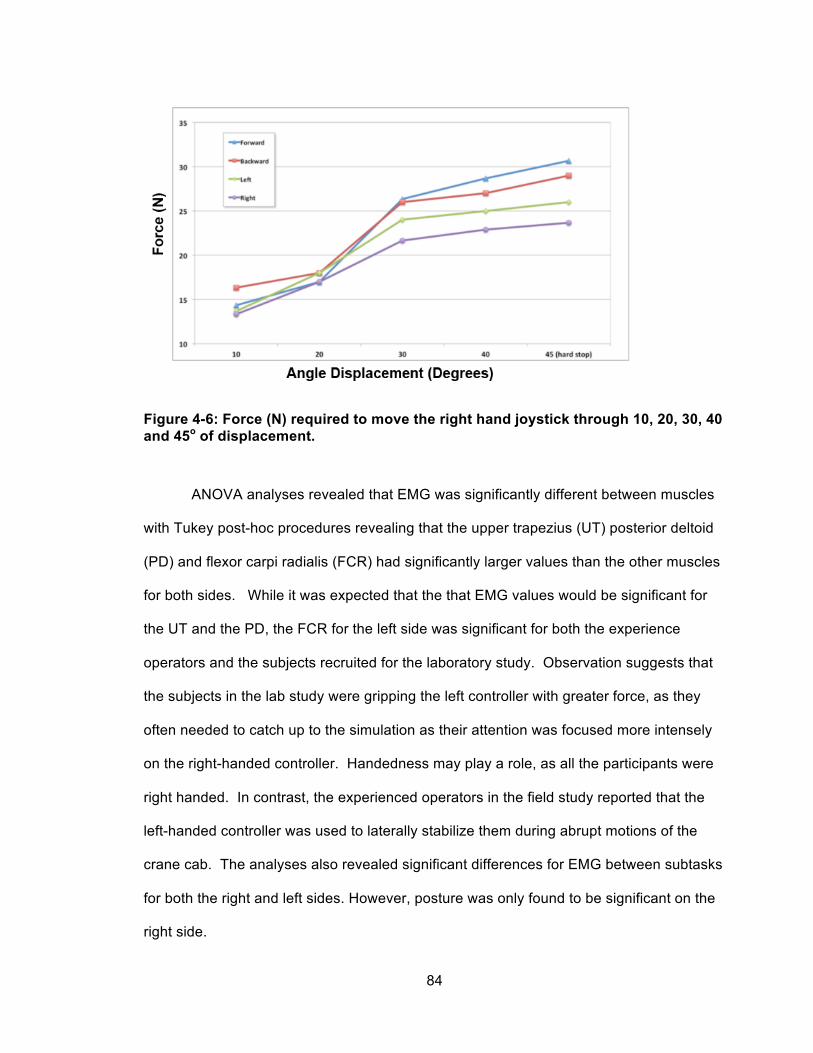
84
Figure 4-6: Force (N) required to move the right hand joystick through 10, 20, 30, 40 and 45o of displacement.
ANOVA analyses revealed that EMG was significantly different between muscles
with Tukey post-hoc procedures revealing that the upper trapezius (UT) posterior deltoid
(PD) and flexor carpi radialis (FCR) had significantly larger values than the other muscles
for both sides. While it was expected that the that EMG values would be significant for
the UT and the PD, the FCR for the left side was significant for both the experience
operators and the subjects recruited for the laboratory study. Observation suggests that
the subjects in the lab study were gripping the left controller with greater force, as they
often needed to catch up to the simulation as their attention was focused more intensely
on the right-handed controller. Handedness may play a role, as all the participants were
right handed. In contrast, the experienced operators in the field study reported that the
left-handed controller was used to laterally stabilize them during abrupt motions of the
crane cab. The analyses also revealed significant differences for EMG between subtasks
for both the right and left sides. However, posture was only found to be significant on the
right side.

85
Figure 4-7: EMG comparisons between muscles, side and 30o trunk flexion and neutral upright posture. Upper Trapezius (UT), Anterior Deltoid (AD), Posterior Deltoid (PD), Biceps Brachii (BB), Triceps Brachii (TRI), Flexor Carpi Radialis (FCR) and Erector Spinae (ES).
4.8 Discussion
4.8.1 Introduction
A laboratory simulation was created to compare an upright posture compared to
the forward leaning posture currently adopted in industry with the same seating and
joysticks as were assessed in the field study. The upright posture would typically be seen
while using a camera system to view the work area.

86
4.8.2 EMG
To convert %MVC to %mRVC it is necessary to use a conversion factor to gain
meaningful (Section 3.8.1.1). A study by Balogh et al. (1999), found that the mRVC to
MVC ratio was 20% for industrial workers therefore a 20% ratio was chosen. EMG data
for the upper trapezius in the forward posture was %mRVC 46.92±32.69(converted to
%MVC 9.38) for the lab test subjects compared to the field results: %mRVC 30.51±21.19
for skilled operators (converted to %MVC 6.10) which may be the result of experienced
operators being more accustomed to the joysticks and the type of motions required to
compete the tasks. In another study (Murphy, 2006) measured the highest mean values
for the upper trapezius at 6.22±4.47 %mRVC compared the highest mean mRVC values
recorded in the current study at 31.24±8.19 %mRVC for the same muscle using similar
data collection and normalization techniques. The study by Murphy (2006) tested forward
and backward motions only compared to the current study where the right hand required
motions in all directions. The left hand was restricted to fore/aft motions as it was in the
study by Murphy (2006), however, the crane operators did not use armrests to support
the arm during operation in the current study. This could account for the higher %mRVC
measured in both the forward and upright postures. Studies in the forestry industry
(Attebrant, Winkel, Mathiassen, & Kjellberg, 1997) and in office work performing
keyboarding (Dumas, et al., 2008) reported findings of %mRVC of 24 and 21±3
respectively which is closer to the upper muscle loading measured in both the field and
the laboratory results. With machine operation, it is unclear to what extent the movement
of the crane cab during normal operation played a role in muscle loading when the
operator is required to stabilize shoulder and arms from abrupt motions of the cab. Since
the laboratory study did not have any operator movements generally associated with
machines operating in the field, it is interesting to note that for the UT, %mRVC (right
side), and %mRVC (left side) was higher for the laboratory subjects tested compared to

87
the %mRVC measured in the field. The right UT forward position 46.92±32.69%mRVC
and left UT forward posture 36.35±26.14%mRVC compared to 28±19.47%mRVC and
30±21.19%mRVC in the laboratory subjects respectively. It could be suggested that to
complexity of the right joystick movements, combined with limited training and experience
in the laboratory subjects resulted in more conscience effort to achieve the task leading to
higher of muscle activation levels.
It was expected that a reduction in muscle activation would be seen when a
neutral upright posture was adopted during the work tasks described here therein. Table
4-2 shows the %mRVC for the right joystick, %mRVC was reduced by 42.18% when an
upright posture was assumed.
Table 4-2: Average Rectified Value (ARV) expresses as a %mRVC across the four subtasks separated by side) (mean±SD).
Position Muscles UT AD PD BB TRI FCR ES Forward 46.92
±32.69 3.26 ±3.83
15.72 ±37.53
7.84 ±3.66
4.70± 2.66
3.64 ±2.22
9.42 ±8.04
Upright 27.13 ±28.26
3.51 ±1.60
31.70 ±26.00
8.05 ±4.09
3.98 ±2.42
4.23 ±3.25
4.44 ±3.63
Forward 36.35
±26.14 8.97 ±5.71
95.46 ±49.93
4.60 ±2.78
10.09 ±5.92
30.89 ±16.05
9.57 ±7.61
Upright 31.24 ±8.19
15.11 ±14.81
66.63 ±64.86
6.76 ±3.87
8.11 ±4.55
24.36 ±13.37
4.91 ±2.68
UT: Upper Trapezius, AD: Anterior Deltoid, PD: Posterior Deltoid, BB: Biceps Brachii, TRI: Triceps, FCR: Flexor Carpi Radialis, ES: Erector Spinae
A 14.05% reduction in muscle activation was also seen in the left side for the
same condition. These conditions were also seen in a laboratory study conducted by
Pigini et al., 2006, where the researchers measured the EMG of the upper trapezius,
cervical muscles, erector spinae, biceps brachii and triceps brachii in dock crane
operators. The reduction in muscle activation is substantial which strongly suggests that
a change in posture is an important intervention. The measured %mRVC seen in the
Right S
ide Left S
ide

88
laboratory study for the right UT in the upright position measured 27.13±28.26 %mRVC,
which when converted to %MVC (5.43%), was above the minimum accepted threshold of
2% Maximum Isometric Voluntary Contraction (MVC) (Asikainen & Harstela, 1993;
Attebrant et al., 1997; Nakata et al., 1993; Lindbeck, 1982 (as reported by (Attebrant et
al., 1997)).
Figure 4-8: EMG comparisons between muscles, neutral upright posture (Posture 1), forward trunk flexion (posture 2) and lumbar supported forward trunk flexion (posture 3) (UT)upper trapezius, (C)cervical muscles, (ES)erector spinae, (BB)biceps brachii and (TB) triceps brachii (Pigini et al., 1998)
89
Corresponding %mMVC to %mRVC for the upper trapezius were %mRVC 17.5
(posture 0), % mRVC 71.5 (posture1) and %mRVC 67 (posture2). The experimental
setup in both studies were similar, with the operator assuming an upright and forward
flexed posture with the exception in posture 2 supporting the shoulder and upper torso via
a shoulder harness. This study found that a neutral upright posture reduced UT loading
by 76% (3.5% to 14% of MCV). This was higher than the 42.18% reduction found in the
current study, however, the trunk angles and length of static contractions were not
reported so it is difficult to determine why the results between the studies are different.
On the left side, subtasks 1&4 had higher muscle activations than subtasks 2&3
whereas on the right side, the subtask of positioning the electromagnets onto the plate
steel (subtask 1) required higher activation than all other subtasks because there are
higher precision requirements for this subtask (Sporrong H., et al., 1998). Table 4.2
shows that the %mRVC for both sides were reduced for the UT and PD in the upright
over the forward flexed posture while the other muscles studied remained relatively
unchanged. The posterior deltoid (PD) had significantly larger %mRVC values than the
other muscles. It was therefore observed that the greatest reduction in EMG activity
between the upright and forward flexed postures occurred in left side posterior deltoid.
This makes sense, as the muscle would not be activated as intensely to support the
weight of the arm in the upright position. In contrast, the PD was less active on the right
side for both the upright and forward flexed postures comparatively. The increased left PD
activity could be attributed to the restricted fore-aft movements of the left joystick where
as the right joystick was used to make fore/aft and side to side or a combination of these
movements. The left PD activity was reduced in the upright posture which is possibly the
result of reduced arm extension from the relative position of the shoulder in relation to the
joystick, and the operator not having to overcome as much of the gravitational force
associated with the mass of the arm, as the joystick is pulled back to the hard stop at the

90
end of the range motion. Upright posture resulted in a (UT) reduction of 5.42%mRVC
42.2% reduction but was still over the accepted risk threshold of 2%.
4.8.2.1 Joystick Input Force and Displacement Requirements
The current study had high joystick input loads measured. Forward input loads
averaged between 14.3-30.7N (23.4±7.3), backward, 16.3-29.0N (23.3±5.7), left 13.7-
26.0N (21.3±5.3) and right 13.3-23.7N (19.7±4.40) which exceeded peak forces of
5.36±1.75 N and 5.02±2.3 N for forward and backward motions respectively obtained in a
study by Murphy (2006). This is possibly due to the fact that Murphy used newer
hydraulic activation joysticks than were used in the field in the current study.
4.8.3 Physiological Responses
Since the data collected in the field revealed that the operators fell into the light
work category, it was determined that these factors did not impact of the job task(s). It
was therefore decided that under the controlled conditions of the laboratory, monitoring
GSR, EE, METs, HR and temperature and near body temperature was not required.
4.9 Conclusion
Constant low level muscle activation increases the risk of developing repetitive
strain injuries (RSI) (Buckle P & Devereux J, 1999; Hagberg & Wegman, 1987; Kilbom A,
1994; Winkle J, & Westgaard R, 1992; van der Windt DA, 2000) which is particularly true
for the UT as it is constantly working to stabilize the shoulder complex (Hansson, 1990),
during precision joystick movements (Sporrong H., et al., 1998). Research has shown
that low level muscle activity involving gripping and basic tool use pose a greater risk of
developing RSI compared to larger forces (Mogk J, & Keir P, 2005). This combined with
reports that as many as 80% of machine operators in the forest industry have
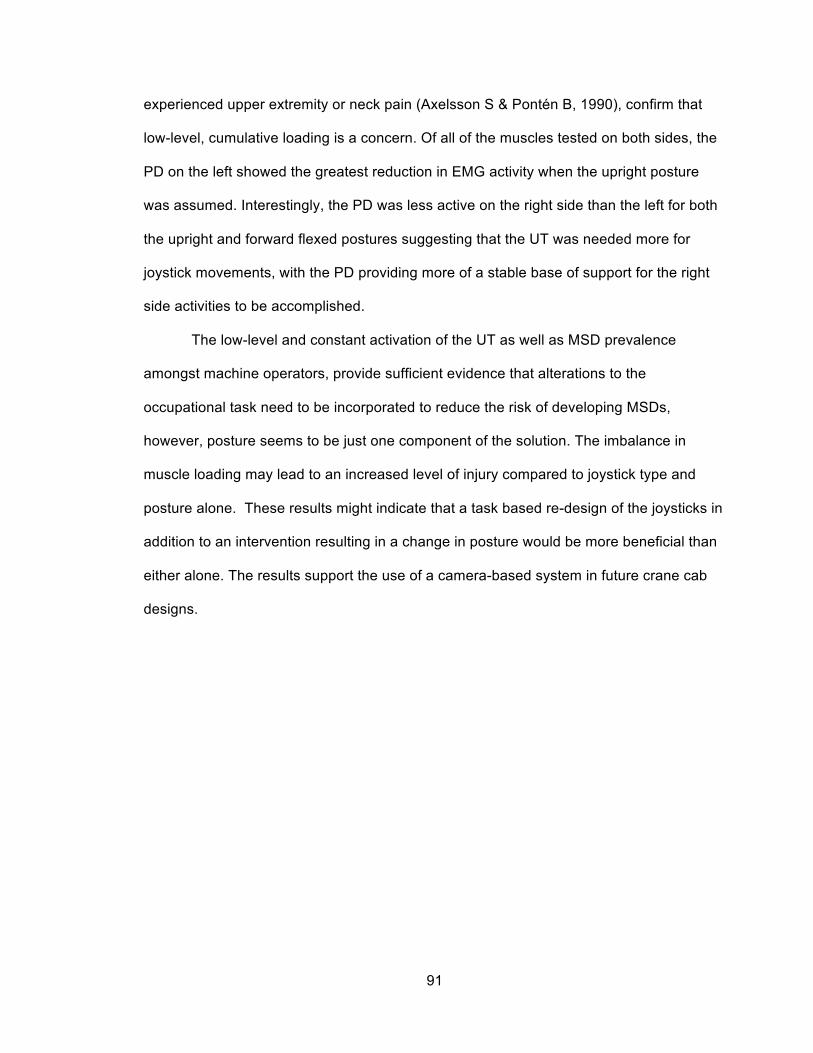
91
experienced upper extremity or neck pain (Axelsson S & Pontén B, 1990), confirm that
low-level, cumulative loading is a concern. Of all of the muscles tested on both sides, the
PD on the left showed the greatest reduction in EMG activity when the upright posture
was assumed. Interestingly, the PD was less active on the right side than the left for both
the upright and forward flexed postures suggesting that the UT was needed more for
joystick movements, with the PD providing more of a stable base of support for the right
side activities to be accomplished.
The low-level and constant activation of the UT as well as MSD prevalence
amongst machine operators, provide sufficient evidence that alterations to the
occupational task need to be incorporated to reduce the risk of developing MSDs,
however, posture seems to be just one component of the solution. The imbalance in
muscle loading may lead to an increased level of injury compared to joystick type and
posture alone. These results might indicate that a task based re-design of the joysticks in
addition to an intervention resulting in a change in posture would be more beneficial than
either alone. The results support the use of a camera-based system in future crane cab
designs.

92
Chapter Five: Discussion Contributions and Future Work
The following chapter briefly summarizes the findings of this thesis. The
conclusions are outlined, followed by contributions to the field and suggestions for future
work.
5.1 Summary
By collecting field data, a more precise engineering intervention could be targeted
to address problem(s) experienced performing the occupation. The opportunity to collect
biomechanical, physiological and metabolic data in the field was rare and was essential in
creating a laboratory mock-up to determine the effect of posture on muscle loading during
simulated overhead crane cab operation. This allowed the researcher to measure the
efficacy of implementing a camera system, which would allow the operator to assume an
upright posture while performing the tasks outlined in this thesis. The upright posture was
evaluated with the same crane cab geometry as tested in the field to assess if the posture
change alone could reduce muscular loading, therefore, reducing potential injury from an
awkward forward leaning posture.
5.1.1 Biomechanical and Physiological Loads
While ANOVA procedures revealed that many of the physiological variables were
elevated over rest values, the values were for the most part quite low suggesting that the
overall physiological demands were relatively low, thus were not required in the laboratory
testing procedures.
Constant low level muscle activation is thought to increases the risk of repetitive

93
strain injuries (RSI) (Buckle P & Devereux J, 1999; Hagberg & Wegman, 1987; Kilbom A,
1994; Winkle J, & Westgaard R, 1992; van der Windt DA, 2000) and is particularly true for
the UT as it is constantly working to stabilize the shoulder complex (Hansson, 1990)
during precision joystick movements (Sporrong H., et al., 1998). Research has shown
that low level muscle activity involving gripping and basic tool use pose a greater risk of
developing RSI compared to larger forces (Mogk J, & Keir P, 2005). Combined with
reports that as many as 80% of machine operators in the forest industry have
experienced upper extremity or neck pain (Axelsson S & Pontén B, 1990), confirms that
low-level, cumulative loading is a concern. As previously stated, the average total joystick
inputs recorded from our field based research revealed joystick inputs averaged
2234±748.3/hour, with 89.3% of the inputs made with the right hand and 10.7% made
with the left, which was corresponds to Golsse’s, (1989) findings, where operators were
reported to exert as many as 2250 inputs per hour.
Despite the higher larger number of joystick movements seen on the right hand
side, the upper trapezius muscle activity remained relatively constant during the work
cycle. This would seem to suggest that trunk posture plays a greater role in sustained
muscle activation than arm movements alone as postural angles of the head and neck
have an effect on cervical spine flexion moments. The brain, skull, facial muscles and
associated structures have a combined mass between 4.5 to 5 kg on average (Astrand et
al., 2003). As flexion angles increase the supporting muscles must work harder to
maintain the flexed position as demonstrated in the chapters 3 and 4. Tukey post hoc
procedures revealed that different combinations of muscle, subtask and side, required
different levels of muscle activation to complete the task, however, the upper trapezius
was observed to remain at a constant level throughout. These results indicate that
operators might be at increased risk of developing neck and shoulder pain due to the
forward neck and trunk flexion.

94
On the left side, manoeuvring the cab into position over the work area and
positioning and releasing the plate steel (subtasks 1&4) had higher muscle activations
than positioning the electromagnets onto the plate steel, and lifting and travelling to the
unload area (subtasks 2&3). On the right side, manoeuvring the cab into position over
the work area required higher activation than all other subtasks. EMG for both sides were
reduced for the UT and PD in the upright over the forward flexed posture while the other
muscles studied remained relatively unchanged
EMG for both sides were reduced for the UT and PD in the upright over the
forward flexed posture while the other muscles studied remained relatively unchanged
(Table 4.2). The greatest reduction in EMG activity between the upright and forward
flexed postures occurred in left side PD. In contrast, the PD was less active on the right
side for both the upright and forward flexed postures.
The increased left PD activity could be attributed to the restricted fore-aft movements of
the left joystick where as the right joystick was used to make fore/aft, side to side or a
combination of these movements. The left PD activity was reduced in the upright posture
which is possibly the result of reduced arm extension from the relative position of the
shoulder in relation to the joystick, and the operator not having to overcome as much of
the gravitational force associated with the mass of the arm, as the joystick is pulled back
to the hard stop, the point where the joystick reached the design limits at the end of the
range motion.
Conclusions
The objectives of this thesis were to determine of muscular activation levels of
skilled crane operators while performing their normal work related tasks and to create a
mock-up of the field conditions in a controlled laboratory environment to investigate the
efficacy of a camera-based system on reducing muscle loading of the neck and shoulder

95
from a forward flexed posture. This study clearly demonstrates that posture contributes
significantly to the muscular loading experienced by these operators. A camera-based
system allows for substantial unloading of the upper trapezius, however, it is the opinion
of this author that posture is a important component of the solution, if not the most
important. Future interventions or solutions would find greater success and improved
efficacy when built around upright postures as a foundation.
5.2 Contributions
This project provided a number of previously unavailable contributions to the
literature:
1. Biomechanical, physiological and metabolic loads were quantified for overhead crane
operation during actual work performances.
2. Biomechanical, physiological and metabolic loads were quantified in this population for
comparisons to future field and laboratory comparisons.
3. A versatile and flexible camera mounting method was developed and tested in crane
cabs. In combination with solid-state recording equipment, this method would prove
useful for other machine cab studies where welded mounts are challenging to place and
camera placement may need to be adjusted to account for different cab geometries.
5.3 Future work
Several questions and ideas arose with the completion of this work that could
further improve the safety of this and other occupational studies.
1. Implementation of a refined camera based system to minimize awkward and static
postures by varying the work tasks during the job.

96
2. Combine the measurement and analysis tools in this thesis into a standard, simple to
deploy package for ergonomists in industry to quantify, and verify job ergonomics and
validate the interventions for overhead crane operators.
3. Further validate the laboratory-reproduction to accurately replicate the overhead crane
operator’s job. This would allow better control of factors such as exertions, joystick loads
and awkward postures.
4. Examine the effects of a balanced joystick arrangement in combination with bilateral
task loads and the postural intervention on EMG reduction.

97
97
Chapter Six: References
Aarås, A., & Westgaard, R. H. (1987). Further studies of postural load and musculoskeletal injuries of workers at an electro-mechanical assembly plant. Applied Ergonomics, 18(3), 212-219.
Ariëns, G., Mechelen, W., Bongers, P., M., Bouter, M., & van der Wal, G., (2000). Scandinavian Journal of Work, Environment & Health, 26(1), 7-19.
Armstrong, T. J., Buckle, P., Fine, L. J., Hagberg, M., Jonsson, B., & Kilbom, A. et al. (1993). A conceptual model for work-related neck and upper-limb musculoskeletal disorders. Scandinavian journal of work, environment and health, 19(2), 73-84.
Asikainen, A., & Harstela, P. (1993). Influence of small control levers of grapple loader on muscle strain, productivity and control Errors. International Journal of Forest Engineering, 5(1), 23-28.
Astrand, P., O., Rodahl, K., Dahl, H. A., & Stromme, S. B. (2003). Textbook of Work Physiology: Physiological Bases of Exercise (4th ed.). Windsor, ON, Canada: Human Kinetics.
Attebrant, M., Mathiassen, S. E., & Winkel, J. (1995). Normalizing upper trapezius EMG amplitude: comparison of ramp and constant force procedures. Journal of Electromyography & Kinesiology, 5(4), 245-250.
Attebrant, M., Winkel J, Mathiassen S.E, & Kjellberg, A. (1997). Shoulder-arm muscle load and performance during control operation in forestry machines: Effects of changing to a new arm rest, lever and boom control system. Applied Ergonomics, 28(2), 85-97.
Axelsson, S., & Pontén, B. (1990). New ergonomic problems in mechanized logging operations. International Journal of Industrial Ergonomics, 5, 267-273.
Bao, S., Mathiassen, S. E., & Winkel, J. (1995). Normalizing upper trapezius EMG amplitude: comparison of different procedures. Journal of Electromyography & Kinesiology, 5(4), 251-257.
Brown, J. R., & Growden, G. P. (1963). Energy expenditure ranges and muscular work grades, 20(4), Br J Ind Med., 277-283.
Branson, R. D. (1990) The measurement of energy expenditure: instrumentation, practical considerations, and clinical application. Resp Care. 35: 640–656.

98
98
Burdorf A, Zondervan H. (1990), An epidemiological study of low-back pain in crane operators. Ergonomics, 33(8), 981-987.
Buckle, P., Devereux, J. (1999). Work related upper limb and musculoskeletal disorders. Retrieved 05/05, 2005.
Burden, A., & Bartlett, R. (1999). Normalisation of EMG amplitude: an evaluation and comparison of old and new methods. Medical engineering and physics, 21(4), 247-257.
Cram, J. R. (1998). Introduction to surface electromyography. Gaithersburg, Md. Aspen Publishers.
Cereda, E., Turrini, M., Ciapanna, D., Marbello, L., Pietrobelli, A., & Corradi, E. (2007). Assessing Energy Expenditure in Cancer Patients: A Pilot Validation of a New Wearable Device. Journal of Parental and Enteral Nutrition , 31 (6), 502-507.
Corlett, E. N., & Bishop, R. P. (1976). A Technique for Assessing Postural Discomfort. Ergonomics , 19 (2), 175-182.
Day, S. (2002). Important Factors in Surface EMG Measurement, Bortec BioMedical Ltd. Retrieved from http://www.bortec.ca
Delsys Inc. (2009, March). Delsys Myomonitor IV EMG System User's Guide. Retrieved from http://www.delsys.com/Products/Wireless.html
DeLuca, C. J. (1997). The use of surface electromyography in biomechanics. Journal of Applied Biomechanics , 13, 135-163.
DeLuca, C. J. (1985). Control Properties of Motor Units. Journal of Experimental Biology, 115, 125-136.
Dumas, G. A., Upjohn, T. R., Leger, A., Delisle, A., Charpentier, K., Plamondon, A., et al. (2008). Effect of a desk attachment board on posture and muscle activity in women during computer work. Ergonomics , 51 (11), 1735-1756.
Enoka, R.M. & Fuglevand, A.J. (2001). Motor unit physiology: Some unresolved issues, Muscle & Nerve, 24(1), 4-17.
Farina, D., & Merletti, R. (2000). Comparison of algorithms for estimation of EMG variables during voluntary isometric contractions. Journal of Electromyography and Kinesiology, 10, 337-349.
Freivalds, A. (2004). Biomechanics of the upper limbs : mechanics, modeling, and musculoskeletal injuries. (1st ed.). Boca Raton, FL: CRC Press.

99
99
Golsse, J.E. (1989). Ergonomic evaluation of feller-buncher cabs and controls - Technical Note TN-134 (Pointe Claire, Quebec, Canada: Forest Engineering Research Institute of Canada.
Grucza, R. (1983). Body heat balance in man subjected to endogenous and exogenous heat load. European Journal o f Applied Physiology and Occupational Physiology, 51, 419-433.
Gustafson-Söderman U. (1987). The effect of an adjustable sitting angle on the perceived discomfort from the back and neck-shoulder regions in building crane operators. Applied Ergonomics 18(4), 297-304.
Hagen K. B., Magnus P, & Vetlesen K. (1998) Neck/shoulder and low-back disorders in the forestry industry: relationship to work tasks and perceived psychosocial job stress. Ergonomics. 41(10). 1510-8.
Hagberg, M., & Wegman, D. H. (1987). Prevalence rates and odds ratios of shoulder-neck diseases in different occupational groups. British journal of industrial medicine, 44, 602-610.
Hansson, G. Å., Nordander, C., Asterland, P., Ohlsson, K., Strömberg, U., Skerfving, S., et al. (2000). Sensitivity of trapezius electromyography to differences between work tasks — influence of gap definition and normalisation methods. Journal of Electromyography and Kinesiology , 10, 103-115.
Hansson, J. (1990). Ergonomic design of large forestry machines. International Journal of Industrial Ergonomics, 5, 255-266.
Harms-Ringdahl, K., Ekholm, J., Schuldtl, K., Linder, J., & Ericson, M. O. (1996). Assessment of Jet Pilots’ Upper Trapezius Load Calibrated to Maximal Voluntary Contraction and a Standardized Load. Journal of Electromyography and Kinesiology , 6 (1), 67-72.
Hebestreit, H., & Bar-Or, O. 1998. Influence of climate on heart rate in children: Comparison between intermittent and continuous exercise. European Journal of Applied Physiology and Occupational Physiology, 78, 7-12.
Hellström, L.-O,. Lindell, S.-O. (1982). Building crane operators - a working environment study (in Swedish). Byggförlaget, Stockholm.
Henriksson KG, Bäckman E, Henriksson C, de Laval JH. (1996). Chronic regional muscular pain in women with precise manipulation work. A study of pain characteristics, muscle function, and impact on daily activities. Scand J Rheumatol. 25(4). 213-23.

100
100
Howard J. D, Enoka RM (1991). Maximum bilateral contractions are modified by neutrally mediated inter limb effects. J Appl Physiol 70, 306–316.
Huysmans, Maaike A. , de Looze, Michiel P. , Hoozemans, Marco J. M. , van der Beek, Allard J. and van Dieën, Jaap H.(2006) The effect of joystick handle size and gain at two levels of required precision on performance and physical load on crane operators, Ergonomics, 49(11), 1021-1035.
Ikai, M., Yabe, K., & Iischii, K (1967). Muskelk-raft und muskulare ermudung bei wilkorficher anspannungelektrischer reizung des muskels. Sportarzt und Sportmed, 5, 197–204.
Järvholm, U., Palmerud, G., Karlsson, D., Herberts, P., & Kadefors, R. (1991). Intramuscular pressure and electromyography in four shoulder muscles. Journal of Orthopedic Research, 1, 379-386.
Jensen, C., Nilsen, K., Hansen, K., & Westgaard, R. H. (1993). Trapezius muscle load as a risk indicator for occupational shoulder-neck complaints. International archives of occupational and environmental health, 64(6), 415-423.
Jonsson, B. (1978). Kinesiology -With special reference to electromyographic kinesiology, in W. A. Cobb and H. Van Duijn (eds), Contemporary Clinical Neurophysiology (EEG Suppl. #34). Amsterdam: Elsevier Scientific Publishing Co.
Keytel, L.R., Goedecke, J.H., Noakes, T.D., Hiiloskorpi, H., Laukkanen, R., van der Merwe, L., Lambert, E.V. (2005). Prediction of energy expenditure from heart rate monitoring during submaximal exercise. Journal of Sports Sciences, 23(3), 289-287.
Kilbom, A. (1994). Repetitive work of the upper extremity: Part II - The scientific basis (knowledge base) for the guide. International Journal of Industrial Ergonomics, 14, 59-86.
Konrad, P. (2005). The ABC of EMG: A Practical Introduction to Kinesiological Electromyography. Retrieved from http://www.noraxon.com/downloads/educational.php3

101
101
Knutson, L. M., Clarke, W. R., & Sodberg, G. (1994). A study of various normalization procedures for within day electromyographic data. Journal of Electromyography and Kinesiology, 4, 47-59.
Lawrence, J. H., & De Luca, C. J. (1983). Myoelectric signal versus force relationship in different human muscles. Journal of Applied Physiology, 54, 1653-1659.
Li, R., Deurenberg, P., & Hautvast, J. G. (1993). A critical evaluation of heart rate monitoring to assess energy expenditure in individuals. American Journal of Clinical Nutrition, 58, 602-607.
Lindbeck L, (1985). Skulderbelastning vid reglagearbete med tre olika spakmotstånd. Undersökningsrapport. 12. Arbetarskyddsstyrelsen.
Looga, R. (2005). The Valsalva manoeuvre—cardiovascular effects and performance technique: a critical review. Respiratory Physiology & Neurobiology 147, 39–49.
Löfroth C, and Pettersson B. (1982). Neck, arm and upper-back disorders in logging machine drivers – Description of problem and proposals for preventive measures. Stockholm: Logging Research Foundation.
Luster, EA; Baumgartner, N; Adams, WC; Convertino, VA (1996). "Effects of
hypovolemia and posture on responses to the Valsalva maneuver". Aviation, space, and environmental medicine 67 (4): 308–13.
MacDougall, McKelvie, Moroz, Sale, McCartney, & Buick, 1992; MacDougall, J. D., McKelvie, R. S., Moroz, D. E., Sale, D. G., McCartney, N., & Buick, F. (1992). Factors affecting blood pressure during heavy weight lifting and static contractions. Journal of Applied Physiology , 73, 1590-1597.
MacDougall, J. D., Tuxen D., Sale D. G., Moroz, J. R. and Sutton J. R. (1985). Arterial blook pressure response to heavy resistance exercise. Journal of Applied Physiology , 58(3), 785-790.
Marras, W. S., & Davis, K. G. (2001). A non-MVC EMG normalization technique for the trunk musculature: Part 1. Method development. Journal of Electromyography and Kinesiology, 11, 1- 9.
Marieb, E. N. (2003). Human anatomy & physiology. (6th ed.). San Francisco: Benjamin Cummings.
Mathiassen, S. E., Moller, T., & Forsman, M. (2003). Variability in mechanical exposure within and between individuals performing a highly constrained industrial work task. Ergonomics, 46(8), 800-824.

102
102
Mathiassen, S. E., Winkel, J., & Hägg, G. M. (1995). Normalization of surface EMG amplitude from the upper trapezius muscle in ergonomic studies - A review. Journal of Electromyography and Kinesiology, 5(4), 197-226.
Mathiassen S. E. (1997). A checklist for normalisation of surface EMG amplitude.
Proceedings of the Second General SENIAM Workshop Chapter 2. Eds: Hermens H, Hagg G, Freriks B. Stockholm, Sweden.
McArdle, W. D., Katch, F. I., Katch, V. L., (2009). Exercise Physiology: Nutrition, Energy, and Human Performance. . (7th ed.). Lippincott Williams & Wilkins.
McClave, S. A., Snider, H. L. (1992). Use of indirect calorimetry in clinical nutrition. Nutr Clin Pract. 7: 207–22
McLean, L., Chislett, M., Keith, M., Murphy, M., & Walton, P. (2003). The effect of head position, electrode site, movement and smoothing window in the determination of a reliable maximum voluntary activation of the upper trapezius muscle. Journal of Electromyography and Kinesiology, 13(2), 169-180.
Merletti, R. (1999). Standards for Reporting EMG data. Journal of Electromyography and
Kinesiology , 9 (1), III-IV. Merletti R, Gulisashvili A, & Lo Conte LR (1995) Estimation of shape characteristics of
surface muscle signal spectra from time domain data. IEEE Trans Biomed Eng 42: 769–776.
Merletti, R., Knaflitz, M., & De Luca, C. J. (1990). Myoelectric manifestations of fatigue in voluntary and electrically elicited contractions. Journal of Applied Physiology , 69, 1810-1820.
Milerad, E., Ericson, M. O., Nisell, R., & Kilbom, A. (1991). An electromyographic study of dental work. Ergonomics, 34(7), 953-962.
Mirka, G.A. (1991). The quantification of EMG normalization error. Ergonomics, 34(3), 343-352.
Mogk J, and Keir P. The effects of posture on forearm muscle loading during gripping. Ergonomics, (2003) 46(9), 956-975.
Moore, J. S., & Garg, A. (1995). The Strain Index: A proposed method to analyze jobs for risk of distal upper extremity disorders. American Industrial Hygiene Association Journal , 56 (5), 443-459.
Murgatroyd, P. R., Shetty, P. S., & Prentice, A. M. (1993). Techniques for the measurement of human energy expenditure: a practical guide. International Journal of Obesity , 17 (7-12), 549-568.

103
103
Nåbo, A. (1986). Arbetsställningar och maskinanvändande i gallringsmaskin Lillebror.
Uppsatser och resultat 115. Sveriges lantbruksuniversitet, Institutionen för skogsteknik: Garpenberg.
Nagappan, R; Arora, S; Winter, C. (2002). "Potential dangers of the Valsalva maneuver and adenosine in paroxysmal supraventricular tachycardia--beware preexcitation". Critical care and resuscitation 4 (2): 107–11.
Nakata, M., Hagner, I., & Jonsson, B. (1993). Trapezius muscle pressure pain threshold and strain in the neck and shoulder regions during repetitive light work. Scandinavian Journal of Rehabilitation Medicine, 25, 131-137.
NIOSH, (1997). Musculoskeletal disorders and workplace factors: a critical review of
epidemiologic evidence for work-related musculoskeletal disorders of the neck, upper extremity, and low back. (Rep. No. 97-141). Cincinnati: DHHS (NIOSH).
Nordin, M., Frankel, V. H., & Leger, D. (2012). Basic biomechanics of the
musculoskeletal system.(4nd ed.). Philadelphia: Wolters Kluwer/Lippincott Williams & Wilkins Health.
Niebel, B. W., & Frelvalds, A. (2003). Methods, standards and work design. New York: McGraw-Hill Companies Inc.
Northey, G. W. (2004). The effects of stiffness and speed on upper limb electromyography during joystick use. Masters Thesis (MSc (Eng)) School of Engineering, University of Guelph, Ontario, Guelph.
Onishi N., Nombra H, Sakai K., Yamamoto T., Hirayama K., Itani T. (1976). Shoulder muscle tenderness and physical features of fecal industrial workers. J Hum Ergol. 5:87-102.
Passmore, R., & Durnin, J. G. (1955). Human Energy Expenditure. Physiological
Reviews ,35, 801-840.
Palmerud, G., Kadefors, R., Sporrong, H., Jarvholm, U., Herberts, P., & Hogfors, C. (1995). Voluntary redistribution of muscle activity in human shoulder muscles. Ergonomics, 38(4), 806-815.
Perkiö-Mäkelä, M. & Riihimäki, H. (1997). Intervention on seat adjustment among drivers of forest tractors. International Journal of Industrial Ergonomics 19, 231-237.
Pigini, L., Colombini, D., Brieda, S., & Fanti, M. (2006). Ergonomic solutions in designing workstations for operators of cranes on harbours. In Eds, Meeting Diversity in Ergonomics-Proceedings of the IEA 2006 Congress (Maastricht-NL), Elsevier Ltd, Amsterdam.

104
104
Punnett, L. & Wegman, D., H., (2004). Work-related musculoskeletal disorders: the epidemiologic evidence and the debate. Journal of Electromyography and Kinesiology, 14(1), 13-23.
Rennie, K. L., Hennings, S. J., Mitchell, J., & Wareham, N. J., (2001). Estimating energy expenditure by heart-rate monitoring without individual calibration. Medicine and Science in Sports and Exercise, 33, 939-945
Scanlon,V. C., Sanders, T., (2007) Essentials of Anatomy and Physiology. (5th ed.). F.A Davis Company.
Schuldt, K., Ekholm, J., Harms-Ringdahl, K., Nemeth, G., & Arborelius, U. (1987). Effects of arm support or suspension on neck and shoulder muscle activity during sedentary work. Scandinavian journal of rehabilitation medicine, 19(2), 77-84.
van der Windt D.A., Thomas E, Pope, DP, de Winter, A F, Macfarlane G. J, and Bouter L. M. (2000). Occupational risk factors for shoulder pain: a systematic review. Occupational and environmental medicine, 57(7), 433-442.
Veiersted, K.B., Westgaard, R.H. and Andersen, P., 1993, Electromyographic evaluation of muscular work pattern as a predictor of trapezius myalgia. Scandinavian Journal of Work, Environment and Health, 19, 284–290.
Waters, T. R., Putz-Anderson, V., Garg, A., & Fine, L. J. (1993). Revised NIOSH equation for the design and evaluation of manual lifting tasks. Ergonomics , 36 (7), 749-776.
Wallace M.L (2010). A Biomechanical, Physiological and metabolic job task analysis, engineering intervention and validation for cokeoven standpipe cleaning. Unpublished master’s thesis, University of Guelph, Guelph Ontario, Canada.
Wallace M.L., Oliver, M., Munro, D.M., and Sexsmith, J. Physiological responses to cokeoven standpipe cleaning. Proceedings of the Canadian Society for Exercise Physiology Annual Conference, Toronto, Ontario, November, 2010.
Westgaard, R. H. (1988). Measurements and evaluation of postural load in occupational work situations. European journal of applied physiology, 57, 291-304.
Winkel, J. and Oxenburgh, M. (1991). Towards optimizing physical activity in VDT/office work, in S. Sauter, M. Dainoff and M. Smith (eds) Promoting Health and Productivity in the Computerized Office; Taylor & Francis, London.
Winkel, J. and Westgard, R. (1992). Occupational and individual risk factors for shoulder-neck complaints: Part II – The scientific basis (literature review) for the guide.International Journal of Industrial Ergonomics. 10, 85-104.

105
105
Winter, D.A Biomechanics and Motor Control of Human Movement, 3rd ed. Wiley, 1990.Woolson, R. F., & Clarke, W. R. (2002). Statistical methods for the analysis of biomedical data. (2nd ed.). New York: Wiley-Interscience.
Yang, J., & Winter, D. (1983). Electromyographic Reliability in Maximal and Submaximal Isometric Contractions. Archives of Physical Medicine and Rehabilitation, 64, 417-420.
Yang, J., & Winter, D. (1984). Electromyographic amplitude normalization methods: improving their sensitivity as diagnostic tools in gait analysis. Archives of Physical Medicine and Rehabilitation, 65, 517-521.
Zondervan H, Burdorf A, Wingerden S van, Duuren L van. (1989). Aandoeningen van het bewegingsapparaat bij kraanmachinisten, Tijdschrift voor toegepaste Arbowetenschap, 2(2):17-2

106
106
Appendix I: Electrode placement on the muscles.
A1- 1: Electrode placement for studied muscles.

107
107
1. Anterior Deltoid Electrode placement for anterior deltoid. The center of the electrode or electrode pair (depending on equipment used) is placed (A1- 1: Electrode placement for studied muscles.) approximately 3 cm below the anterior margin of the acromion process. This point should intersect with a line drawn from the lateral border of the spine of the scapula and the lateral epicondyle (D). Electrode(s) placed parallel to the muscle fibers. (Cram, 1998; The SENIAM Group, 1999). Function Check: Slight shoulder flexion and abduction while the hand is slightly medially rotated. 4. Biceps Brachii Electrode placement for biceps brachii. The center of the electrode or electrode pair (depending on equipment used) is placed (A1- 1: Electrode placement for studied muscles.) approximately 2/3 the distance from the acromion process (A) and the fossa cubit (F) parallel to the muscle fibers (Cram, 1998; The SENIAM Group, 1999). Function Check: Elbow flexion against resistance to 90O. 3. Flexor Carpi Radialis Electrode placement for flexor carpi radialis. The center of the electrode or electrode pair (depending on equipment used) is placed (A1- 1: Electrode placement for studied muscles.) on the anterior surface of the forearm, approximately 6cm from the medial epicondyle on a line joined by the distal end of the radius (G) and the medial epicondyle (E) (Cram, 1998; The SENIAM Group, 1999). Function Check: flexing the wrist with a light lateral rotation of the hand. 4. Upper Trapezius Electrode placement for left and right upper trapezius (A1- 1: Electrode placement for studied muscles.). The center of the electrode or electrode pair (depending on equipment used) is placed 2.5cm medially from the midpoint between the 7th cervical process (H) and acromion process (A), in the direction parallel to the muscle fibers (Cram, 1998). Function Check: Lifting the shoulders. 5. Posterior Deltoid Electrode placement for posterior deltoid (A1-‐ 1: Electrode placement for studied muscles.). The center of the electrode or electrode pair (depending on equipment used) is placed approximately 2~3 cm below the posterior margin of the acromion process (A), parallel to the muscle fibers (Cram, 1998; The SENIAM Group, 1999). Additional landmark information: trace a line from the posterior margin of the acromion process (A) to the olecranon fossa (J), electrode site is located on the line approximately 3cm from the posterior margin of the acromion process (Cram, 1998; The SENIAM Group, 1999). Function Check: Extend the arm while simultaneously adducting and arm medially rotating the hand slightly. 6. Triceps Brachii Electrode placement for triceps brachii. The center of the electrode or electrode pair (depending on equipment used) is placed (A1- 1: Electrode placement for studied muscles.) on the posterior arm, approximately 2/3 the distance from the acromion process (A) to the olecranon fossa (H), 2cm lateral of the drawn line (Cram, 1998; The SENIAM Group, 1999). Function Check: Elbow extension.

108
108
7. Erector Spinae Electrode placement for erector spinae. The center of the electrode or electrode pair (depending on equipment used) is placed (A1- 1: Electrode placement for studied muscles.) 2cm lateral from spinus process L1 (I) (Cram, 1998; The SENIAM Group, 1999). Function check: Raising the trunk from a prone position.
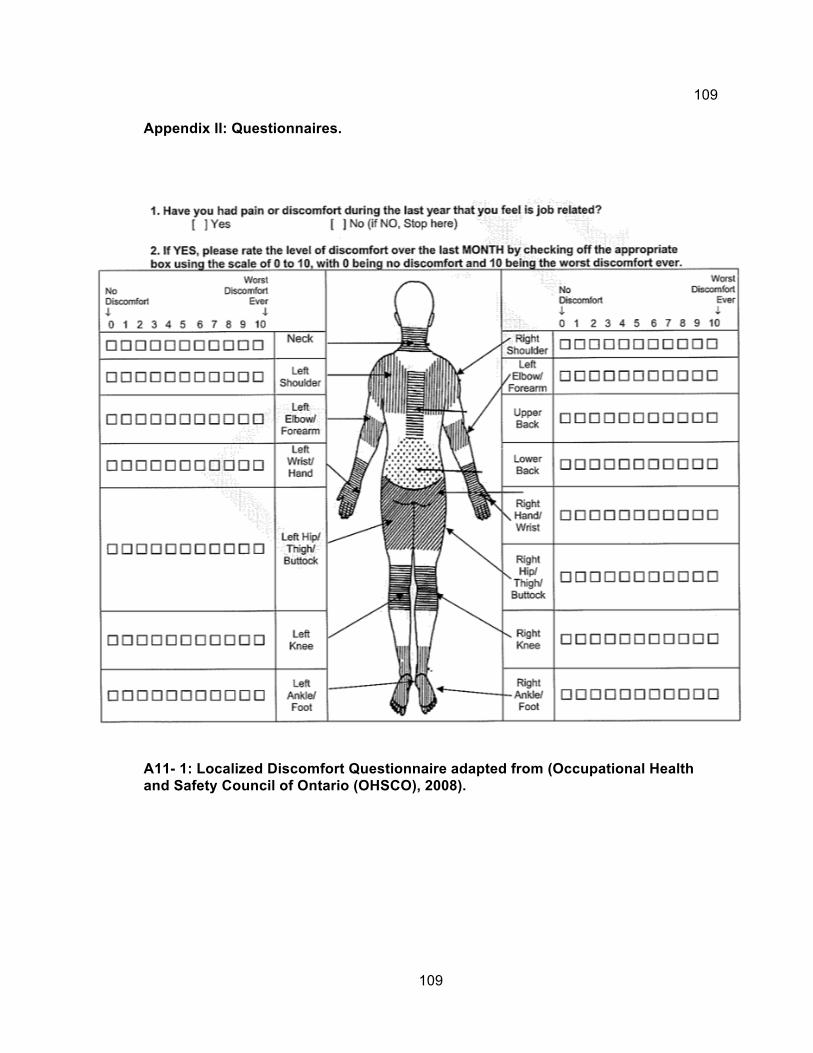
109
109
Appendix II: Questionnaires.
A11- 1: Localized Discomfort Questionnaire adapted from (Occupational Health and Safety Council of Ontario (OHSCO), 2008).

110
110
Place the numerical descriptor beside the alphabetical muscle area where you feel discomfort.
FRONT
Right Left
A11- 2: Localized Discomfort Questionnaire adapted from (Occupational Health and Safety Council of Ontario (OHSCO), 2008)

111
111
BACK
Right Left
Adapted from Corlett and Bishop, 1976 and Niebel, B.W. Methods, Standards and Work
Design 11th ed. McGraw-Hill: New York, 2003.
BODY-PART DISCOMFORT RATING SCALE
SUBJECT:___________________________________
A11- 3: Body-Part Discomfort Rating Scale adapted from (Occupational Health and Safety Council of Ontario (OHSCO), 2008)

112
112
Appendix III: Consent Forms
EMG (Electromyography) Study of Gantry Crane Operators I______________________________ am interested in participating in the study ‘EMG (Electromyography) study of gantry crane operators at Company Name’ conducted by Principal Investigator Dr. Michele Oliver (University of Guelph) together with the Company Ergonomist, Mark Munro (University of Guelph) and Dr. Jim Sexsmith (University of New Brunswick). The purpose of this research is to measure the strain and stress on the body during the normal operation of a gantry crane at Company Name. The strain and stress will be measured using surface electromyography (EMG) which uses small devices stuck the skin to measure the small electrical currents produced by the muscles when they move. The Body Media SenseWear system measures calories burned and a heart rate monitor to record how fast the heart is pumping which attaches with a strap around the chest. A body-part discomfort rating scale and standard paper-and-pen questionnaire (Rapid Upper Limb Assessment, American Conference of Governmental Industrial Hygienists Threshold Limit Value, and the Moore-Garg Strain Index, which are attached) that help identify the stress of various job factors such as sitting position. Digital video will also be taken to observe the posture details during completion of the job. Results from this study will help guide the future changes to the job to stress and strain on the workers, reducing their potential for injury and lost time claim days.
If I agree to participate, I may be observed and videotaped while doing my job so that measurements can be taken for the ergonomic analysis tools. Before and after my shift on the day of data collection, I will be asked to fill out a discomfort rating scale sheet. To sense muscle activity during crane operation, EMG electrodes, (small devices stuck to the skin to measure tiny electrical currents made by the muscle during movement) will be taped on my skin after the sites are cleaned with alcohol swabs. There is a minor chance that the tape may cause a rash on the skin, in which case withdrawal from the study would be up to me. A hypoallergenic (will not cause an allergic reaction) makeup pencil may be used to temporarily mark my skin where the electrodes were placed to reduce set up time for later data recording sessions, but these marks will be easily removed with cold cream or soap and water. I will be asked to wear reasonably loose fitting shirt or sweatshirt as well as loose fitting sweat pants during the day of data collection as the electrodes will be placed on my shoulders, neck and arm, and lower back. All other protective devices will be worn as required for the job. I will wear a heart rate monitor strapped to my chest above my heart. I will be asked to wear a Body Media SenseWear Armband for the entire day, including one night’s sleep, putting it on before data collection begins, then wearing it until the beginning of the shift the next day. The Armband estimates the calories burned used during the job, and when sleeping, the actual energy used to do the do the job can be calculated. I understand that all equipment setup and measurements will be taken during regular work hours and normal operation of my job. Data will be collected for approximately 1

113
113
hour at a time, and only require an extra half hour during regular working hours for applying electrodes, the SenseWear armband and filling out the discomfort rating sheet. General Procedure: * I (you) will be asked to remove your shirt and pants in a private change area so that landmarks will be located on the skin. Examples of these would be the funny bone (medial epicondyle) and collar bone (clavicle). This will involve the researcher touching the skin with a little pressure to locate these bumps (palpation). It’s very similar to what a Dr. may do upon examination. • The area will be shaved of any body hair and cleaned with alcohol (approximately 1.5 inches X 1.5 inches per electrode) • A heart rate monitor will be strapped to the chest just below the chest over the lower breast bone. It’s a single elastic strap that is about 1 inch in width and circles the entire chest. • The electrodes will be stuck to the skin with double sided tape at the shaved spots. • The wires from the electrodes will be attached to the heart rate monitor strap with tape and a safety pin as well as safety pinned to the top of the pants. • A fanny pack will be worn around the waist to hold the recording equipment. • Once the equipment has been put on, I understand that I will be asked to move my arms, shrug my shoulders, bend over and straighten up several times (2~4). • I understand that I will then dress and begin my shift as usual. • After the hour of data collection, I will take a 10 minute break so that the equipment can be removed in a private change area.
I may be asked to repeat the recordings multiple times (max 4), in the event of poor data collection or equipment failure. I also understand that only members of the research team will have access to the data collected. I have received assurance from the researcher that all data collected will remain strictly confidential. My individual results will not be reported. I understand that individual results of this research will not be released to Company Name– but the results of all workers will be combined to observe a general trend. It cannot be used as a measurement of job efficiency or aptitude, but as an analysis of the task itself. Individual results will be removed can never be recovered by the company. I understand that I may also be invited to participate in the second part of the investigation, verifying the intervention(s) that will be developed with information from this study. This is completely voluntary and I can decline without any penalty. I understand that this study has received clearance and approval from the research ethics board (REB) at the University of Guelph.

114
114
Benefits to the Employee:
I understand that the engineering solution could decrease the physical load (stress and strain) on the body, decreasing tiredness and the risk of injury associated with the job. This has the potential to increase the employees’ quality of life and job satisfaction.
My participation is strictly voluntary and I am free to withdraw from the study at any
moment or refuse to participate without any penalty.
There are two copies of this consent form; one which the researcher keeps and
one that I keep.
If I have any questions or concerns about the study or about being a subject, I may call or email Michele Oliver – 519-824-4120 ext. 52117, [email protected] Mark Munro – 519-546-4000, [email protected] Sandy Auld, University of Guelph Research Ethics Coordinator – 519-824-4120 ext. 56606, [email protected] I wish to receive a summary of the results of this study that will be available in May of 2009 � No Yes If yes, provide mailing address or email address ________________________________ I have read the accompanying information letter and had all my questions answered. I agree to participate in this study. Participants Signature: _________________________ Date: ______________________ Researcher’s Signature: _________________________ Date: ______________________

115
115
Project Title:
EMG (Electromyography) Study of Gantry Crane Operators
Research Team:
Dr. Michele Oliver, University of Guelph Mr. Mark Munro, University of Guelph Dr. Jim Sexsmith, University of New Brunswick Research Project Objectives: The first purpose of this research is to measure physical loads on the body during normal gantry crane operations. Loads will be measured using surface electromyography (EMG), a heart rate monitor, the Body Media SenseWear Armband, a body discomfort rating scale are job analysis used to assess risk of developing pain or injuries in the upper body. Digital video will also be used to observe the posture details the job. Based upon these measures, the highest load-contributing job components will be selected for further study and used to guide the design of an engineering intervention to reduce loads on the workers. This information will be used for the second purpose, which is to assess how well the engineering solution reduces stresses and strains on the body. Subjects will complete the job using both the current method and the intervention method. Results from this study will provide the steel industry with information which will allow them to more efficiently retrofit the existing crane cab seat and controls which has been identified as contributing to ailments associated with long term exposure to this job. The objectives of this research include: 1) documentation of physical loads associated with gantry crane operation, 2) propose a solution, be it new equipment, or modified methods of performing the job 3) comparative lab mock-up to determine if the intervention is really helping alleviate loads. The proposed studies have direct implications for worker health and injury, and at the conclusion of the study, feedback on the task and a suggested retrofit will be provided to Company Name and the steel-making industry as a whole. Requested Involvement: In order to determine loads on the workers, they will need to be measured in the field. Disruption to production will be minimized. Equipment set-up will be less than 30 minutes and then the worker will be asked to complete their assigned tasks for the day as normal. Data would be collected throughout the shift and then the equipment would be removed from the worker which would require approximately 5 minutes, except for

116
116
the Body Media SenseWear armband, which is only minimally noticeable and should be worn for one night’s sleep and returned at the beginning of the shift the next day. Benefits to the Company: At the conclusion of the testing session, the data will be analyzed and a report will be provided to Company Name (written and oral if requested) as well as to subjects if requested. The report will provide feedback on loading exposure levels experienced during a typical work cycle and will indicate if the operator was overloaded, outside the health guidance caution zone. The company will also be given a copy of the report, which will outline suggested engineering interventions. Benefits to the Employee: The engineering intervention should decrease the physical load (stress and strain) on the body, decreasing tiredness and the risk of injury associated with the job. This has the potential to increase the employees’ quality of life and job satisfaction. Project Timeline: Field testing will be done in June-July 2008. The data analysis phase of this project would occur in Summer and Fall 2008 through Winter 2009. A preliminary report would be available to Company Name by June 2009, before the second phase of the investigation is undertaken. Questions: If you have questions regarding participation in the project please feel free to contact us at your convenience: Michele Oliver – 519-824-4120 ext. 52117, [email protected] Mark Munro – 519-824-4120 ext. 53583, [email protected]

117
117
Appendix IV: Electronics
A IV- 1: Simplified schematic of a AD620 instrumentation amplifier. These components are integrated into one 8 pin Dip. The input transistors Q1 and Q2 provide a single differential-pair bipolar input for high precision.
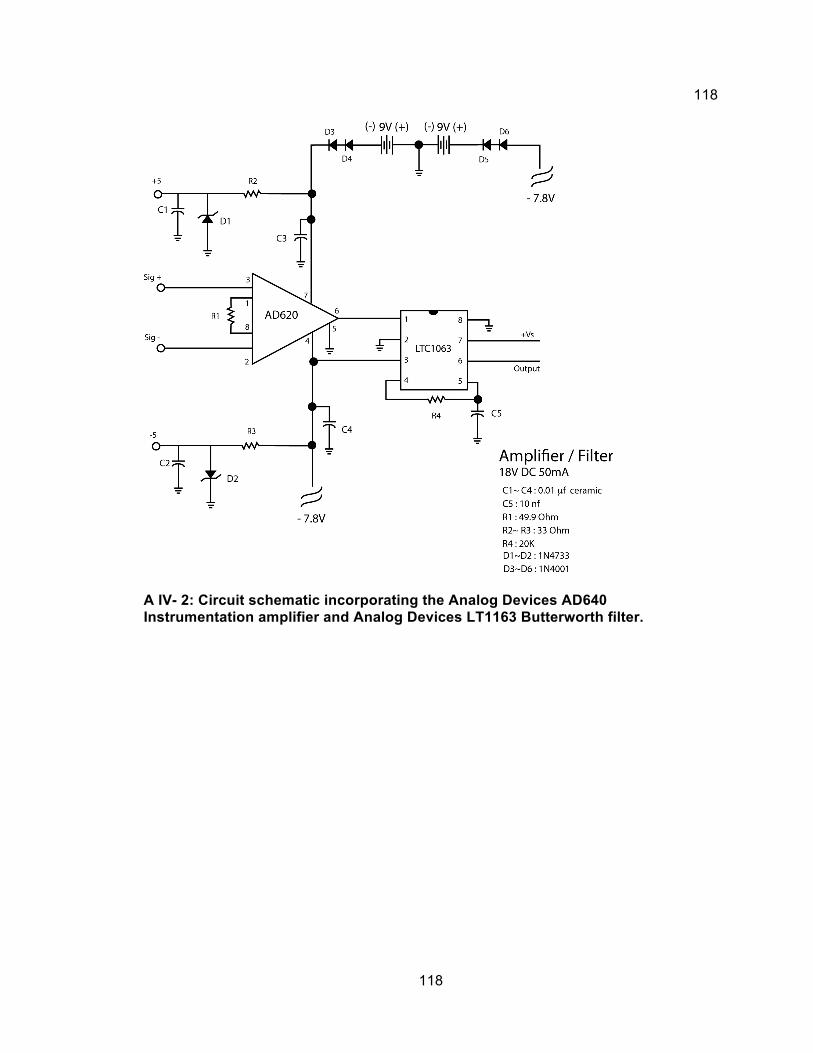
118
118
A IV- 2: Circuit schematic incorporating the Analog Devices AD640 Instrumentation amplifier and Analog Devices LT1163 Butterworth filter.

119
119
A IV- 3: PCB signal amplifier silkscreen transfer image (9v input utilizing a power bridge).
A IV- 4: PCB (prototype) etching results. Copper traces and pads prior to drilling and component installation.
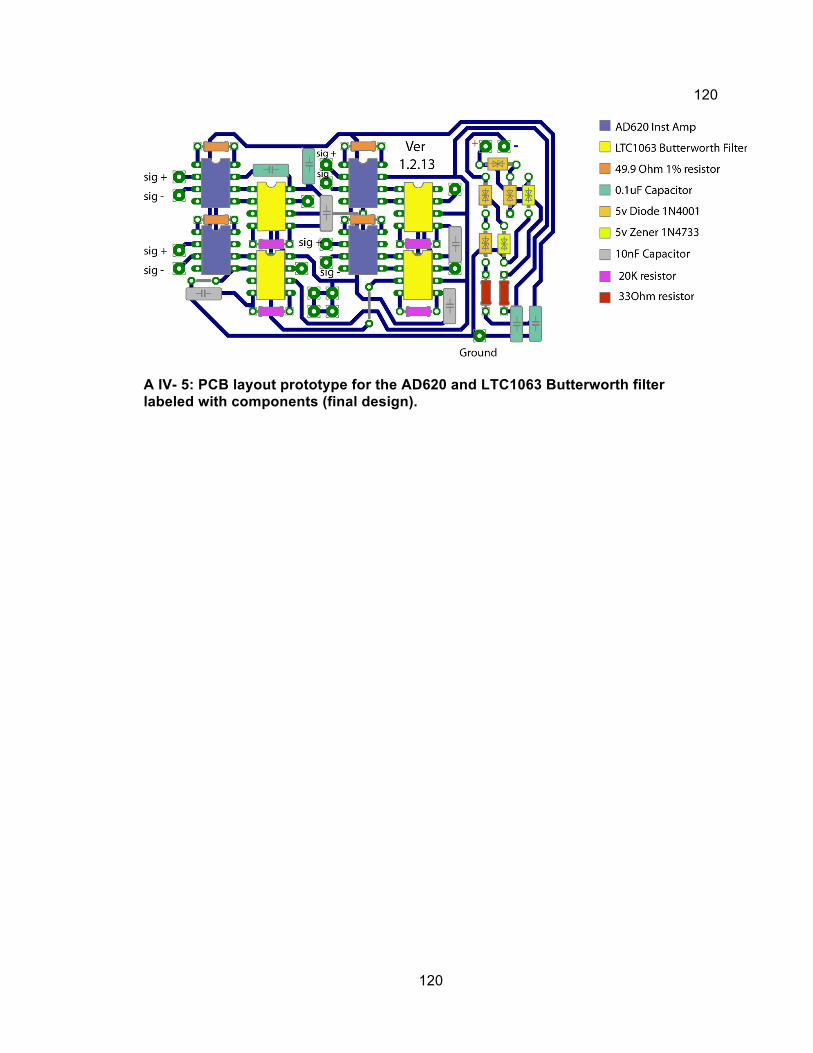
120
120
A IV- 5: PCB layout prototype for the AD620 and LTC1063 Butterworth filter labeled with components (final design).

121
121
A IV- 6: Camera and external trigger schematic utilizing a IC555 timer to power on the 12F675 microcontroller and the Vishay VO14642 SSR (solid state relay). Circuit accepts 5V-100ms pulse and allows devices up to 2A to be switched on while simultaneously sending the camera start code. Circuit is powered by 3VLi CR2025 disk battery.

122
122
A IV- 7: PCB design for the device relay. (9v power supply).

123
123
Appendix V : CAMERA MOUNT
A V- 1: Microsoft Excel spreadsheet with calculations for correct magnet requirements for the camera mount.
A V- 2: Initial camera mount design.

124
124
A V - 3: Final camera mount design.

125
125
Appendix VI: MATLAB™ Programs For Data Analysis
EMG loading script for delsys proprietary code. function [header, data] = loademg3(filename); % LOADEMG3 reads the EMG data file specified in filename. % Returns the Emg data in the variable data, which is a [channels,samples] matrix. % header contains a description of the data acquisition setup. % Returns -1 if file couldn't be opened. % Example: % >> [header, data]=loademg3('test.emg'); % Copyright 2003 Delsys Inc. % 03/11/03 Version 1.0 % 03/11/03 Version 1.1 % Replaced fgets with char(fread(fId,255,'char'))' to prevent inadvertent reading of string terminator % 03/18/03 Version 1.2 % Changed FileId to 'DEMG' and version to uint16 for backwards compatibility. % 04/30/03 Version 1.3 % Added more comments. % 05/20/03 Version 1.4 % Fixed issues with reading to many points % 06/25/03 Version 1.5 % Added support for old EMG file format % 03/17/08 Version 1.6 % Fixed bugs related to value scaling in EMG file versions V2 and V3. % 07/29/08 Version 1.7 % Implemented platform-independent fread precision. data = -1; % Default value fId=fopen(filename,'r','n'); if fId>0 % Read in header information header.ID= fgets(fId,4); % File ID % Verify the file ID if header.ID == 'DEMG' fprintf(1, 'Reading file %s...\n',filename); header.Version = fread(fId,1,'uint16'); % File version % Read old file format if header.Version == 1 | header.Version == 2 header.FileType = 0; % FileType (0 = RAW data) header.EMGworksVersion = ''; % EMGworks Version ("1.0.0.0") header.DADLLversion = ''; % DADLL Version ("1.0.0.0") header.CardManufacturer = ''; % A/D card Manufacturer header.ADCardID = []; % A/D card Identifier header.ESeries = []; % National Instruments E-Series Card? (0 = NO, 1 = YES) header.Channels = fread(fId,1,'unsigned short'); % Number of channels header.Fs= fread(fId,1,'unsigned long'); % Actual sampling frequency header.Samples = fread(fId,1,'unsigned long'); % Actual number of samples header.SamplesDesired = []; % Desired number of samples header.FsDesired = header.Fs; % Desired sampling frequency header.DataStart = []; % Data start point in the file (byte count) header.TriggerStart = []; % Start Trigger mode (0 = Auto, 1 = Manual, 2 = External trigger)
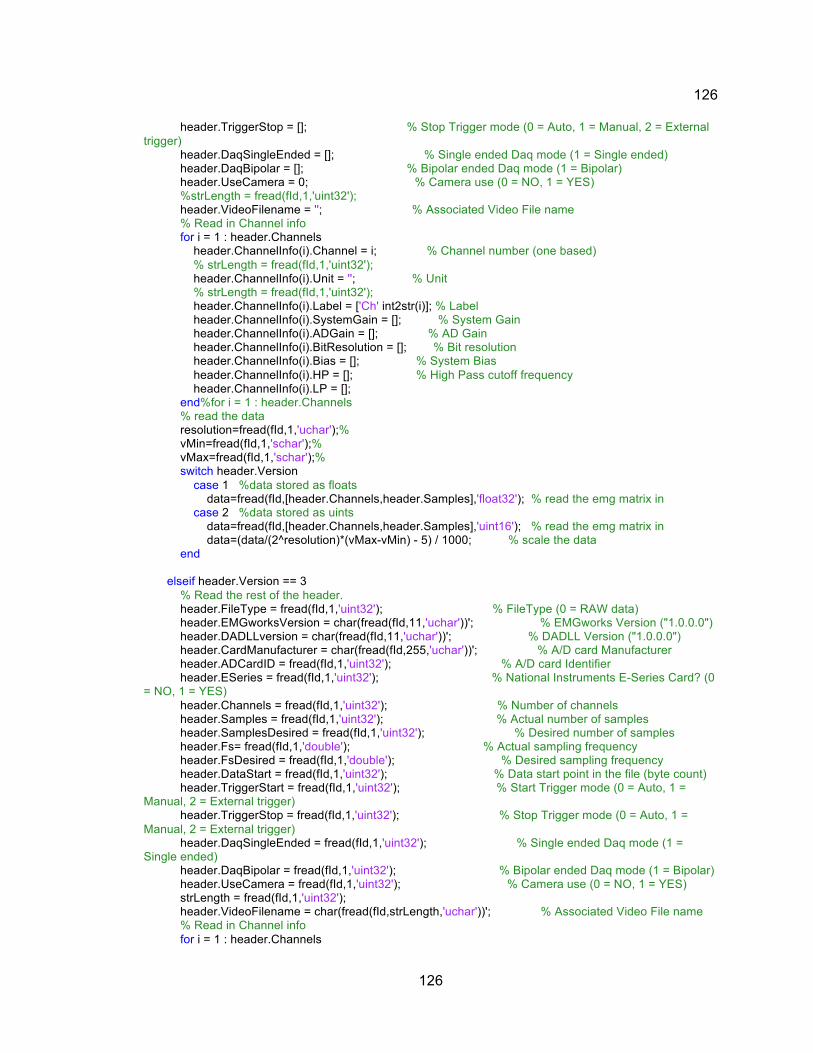
126
126
header.TriggerStop = []; % Stop Trigger mode (0 = Auto, 1 = Manual, 2 = External trigger) header.DaqSingleEnded = []; % Single ended Daq mode (1 = Single ended) header.DaqBipolar = []; % Bipolar ended Daq mode (1 = Bipolar) header.UseCamera = 0; % Camera use (0 = NO, 1 = YES) %strLength = fread(fId,1,'uint32'); header.VideoFilename = ''; % Associated Video File name % Read in Channel info for i = 1 : header.Channels header.ChannelInfo(i).Channel = i; % Channel number (one based) % strLength = fread(fId,1,'uint32'); header.ChannelInfo(i).Unit = ''; % Unit % strLength = fread(fId,1,'uint32'); header.ChannelInfo(i).Label = ['Ch' int2str(i)]; % Label header.ChannelInfo(i).SystemGain = []; % System Gain header.ChannelInfo(i).ADGain = []; % AD Gain header.ChannelInfo(i).BitResolution = []; % Bit resolution header.ChannelInfo(i).Bias = []; % System Bias header.ChannelInfo(i).HP = []; % High Pass cutoff frequency header.ChannelInfo(i).LP = []; end%for i = 1 : header.Channels % read the data resolution=fread(fId,1,'uchar');% vMin=fread(fId,1,'schar');% vMax=fread(fId,1,'schar');% switch header.Version case 1 %data stored as floats data=fread(fId,[header.Channels,header.Samples],'float32'); % read the emg matrix in case 2 %data stored as uints data=fread(fId,[header.Channels,header.Samples],'uint16'); % read the emg matrix in data=(data/(2^resolution)*(vMax-vMin) - 5) / 1000; % scale the data end elseif header.Version == 3 % Read the rest of the header. header.FileType = fread(fId,1,'uint32'); % FileType (0 = RAW data) header.EMGworksVersion = char(fread(fId,11,'uchar'))'; % EMGworks Version ("1.0.0.0") header.DADLLversion = char(fread(fId,11,'uchar'))'; % DADLL Version ("1.0.0.0") header.CardManufacturer = char(fread(fId,255,'uchar'))'; % A/D card Manufacturer header.ADCardID = fread(fId,1,'uint32'); % A/D card Identifier header.ESeries = fread(fId,1,'uint32'); % National Instruments E-Series Card? (0 = NO, 1 = YES) header.Channels = fread(fId,1,'uint32'); % Number of channels header.Samples = fread(fId,1,'uint32'); % Actual number of samples header.SamplesDesired = fread(fId,1,'uint32'); % Desired number of samples header.Fs= fread(fId,1,'double'); % Actual sampling frequency header.FsDesired = fread(fId,1,'double'); % Desired sampling frequency header.DataStart = fread(fId,1,'uint32'); % Data start point in the file (byte count) header.TriggerStart = fread(fId,1,'uint32'); % Start Trigger mode (0 = Auto, 1 = Manual, 2 = External trigger) header.TriggerStop = fread(fId,1,'uint32'); % Stop Trigger mode (0 = Auto, 1 = Manual, 2 = External trigger) header.DaqSingleEnded = fread(fId,1,'uint32'); % Single ended Daq mode (1 = Single ended) header.DaqBipolar = fread(fId,1,'uint32'); % Bipolar ended Daq mode (1 = Bipolar) header.UseCamera = fread(fId,1,'uint32'); % Camera use (0 = NO, 1 = YES) strLength = fread(fId,1,'uint32'); header.VideoFilename = char(fread(fId,strLength,'uchar'))'; % Associated Video File name % Read in Channel info for i = 1 : header.Channels

127
127
header.ChannelInfo(i).Channel = fread(fId,1,'uint32'); % Channel number (one based) strLength = fread(fId,1,'uint32'); header.ChannelInfo(i).Unit = char(fread(fId,strLength,'uchar'))'; % Unit strLength = fread(fId,1,'uint32'); header.ChannelInfo(i).Label = char(fread(fId,strLength,'uchar'))'; % Label header.ChannelInfo(i).SystemGain = fread(fId,1,'double'); % System Gain header.ChannelInfo(i).ADGain = fread(fId,1,'double'); % AD Gain header.ChannelInfo(i).BitResolution = fread(fId,1,'double'); % Bit resolution header.ChannelInfo(i).Bias = fread(fId,1,'double'); % System Bias header.ChannelInfo(i).HP = fread(fId,1,'double'); % High Pass cutoff frequency header.ChannelInfo(i).LP = fread(fId,1,'double'); % Low Pass cutoff frequency end % Read the data. data = fread(fId,[header.Channels, header.Samples], 'int16');% % Scale the data for i = 1 : header.Channels data(i,:) = (data(i,:) * header.ChannelInfo(i).BitResolution - header.ChannelInfo(i).Bias) / header.ChannelInfo(i).SystemGain; end else fprintf(1, 'Uknown file version for file %s\n',filename); end else %if header.ID == 'DEMG' fprintf(1, 'File %s is not a proper EMG file\n',filename); header=[]; % need to return something otherwise error message data = []; end %if header.ID == 'DEMG' fclose(fId); else fprintf(1, 'File %s not found !!!\n',filename); header=[]; % need to return something otherwise error message data = []; end

128
128
Matlab Processing code for field data. %**************************************************************************************** % % This .m file calls a function loademg3 which reads a Delsys data file and then returns % the data file with the header information stripped off. The resulting % 16 row matrix is then filtered using a dual pass, band pass, 2nd order % Butterworth filter. The absolute value is then taken in order to full wave % rectify the emg signal and then the data are linear enveloped using a 7 % Hz, dual pass, low pass 2nd order Butterworth filter. The cumulative % integrated EMG is then calculated. The data are then plotted % on four Figures with the assumption that rows 1 through 8 are % for the right side (RHS), and that rows 9 through 16 are for the left % side (LHS)(just to give you an idea of syntax)...btw, ':' means take % all observations in the row or column, eg. emg_lin_env(1,:)....1 is row % 1 and : is take all of the columns % % Created October 9, 2008 by M. Oliver % Modified Jan 10 2010 by M. Munro % %************************************************************************** %Clear all variables and close all open Figures clear all close all %% set up the variables and arrays for easy access filename='C:\Program Files\MATLAB\R2006b\work\Data Analysis\Sub6\MS6T2[Rep1].recovered.emg'; % working directory for this output dir = 'C:\Program Files\MATLAB\R2006b\work\Data Analysis\Sub6\output\'; %sample frequency sf = 1000.29; %Norm numbers from mRVC RMS emgnorm =[4.6962E-05,3.88328E-05,5.08506E-05,8.30072E-05,8.61446E-05,6.33585E-05,0.000181264,... 1.83929E-05,6.43458E-05,5.76933E-05,8.61446E-05,4.35121E-05,2.35723E-05,3.45773E-05]; % DC offset values (mean of MRVC)channels 1 through 14 emgmean = [1.11599E-05,2.62057E-05,8.75301E-06,-2.39584E-05,1.23409E-05,1.23409E-05,4.37167E-05,3.69512E-05,-1.07342E-05,... 1.27362E-06,1.27362E-06,3.9462E-05,3.83449E-05,1.93293E-18]; %number is cycles to process cycles = 1; %array for 4 tasks over 8 cycles.1,2,3,4,5,6,7,8; %task = [1,2,3,4;]; %this array is for one cycle to make better use of the imported script, the multi dimensional array should % be used and a looping structure set up to process all the data. task = [448334,456557,468140,484305,487426,496719,502371,645123;615185,633230,633230,684265,684265,693288,696289,730509]; %Call Matlab function loademg3 to strip header off of data (returns the %header and the data as two separate data matrices [header,data] = loademg3(filename); %Filter raw EMG Using a 10-450 Hz Band Pass Filter %Lowpass

129
129
[b,a]=butter(2,450/500,'low'); emglow=filtfilt(b,a,data(:,1:1000000)); clear data; %Highpass [b,a]=butter(2,10/500,'high'); emg=filtfilt(b,a,emglow); %*****change 'data' to 'emglow' clear emglow; [n,p] = size(emg); %make a matrix of zeroes to the size of emg emgmean1=zeros(n,p); %copy the emgmean values into a matrix of the same size as emg for i=1:p emgmean1(:,i)=emgmean'; end; %subtract emgmean values from the emg raw data to remove DC offset emg=emg-emgmean1; %Take absolute value (i.e., full wave rectify) of emg data matrix emgabs=abs(emg); clear emg; %Seperate each channel before filtering or all channels end up the same rut = emgabs(1,:); rad = emgabs(2,:); rpd = emgabs(3,:); rbb = emgabs(4,:); rtr = emgabs(5,:); rfcr = emgabs(6,:); lut = emgabs(7,:); lad = emgabs(8,:); lpd = emgabs(9,:); lbb = emgabs(10,:); ltr = emgabs(11,:); lfcr = emgabs(12,:); % Erector spinae are on channel 13 and 14 as they were placed on the % subject last res = emgabs(13,:); les = emgabs(14,:); clear emgabs; %Create 7 Hz linear envelope [b,a]=butter(2,7/500,'low'); %emg_lin_env=filtfilt(b,a,emgabs); %Filter each channel individually rutfilt = filtfilt(b,a,rut); radfilt = filtfilt(b,a,rad); rpdfilt = filtfilt(b,a,rpd); rbbfilt = filtfilt(b,a,rbb); rtrfilt = filtfilt(b,a,rtr); rfcrfilt = filtfilt(b,a,rfcr);

130
130
lutfilt = filtfilt(b,a,lut); ladfilt = filtfilt(b,a,lad); lpdfilt = filtfilt(b,a,lpd); lbbfilt = filtfilt(b,a,lbb); ltrfilt = filtfilt(b,a,ltr); lfcrfilt = filtfilt(b,a,lfcr); resfilt = filtfilt(b,a,res); lesfilt = filtfilt(b,a,les); %put the channels back into a matrix emg_lin_env=cat(2,rutfilt',radfilt',rpdfilt',rbbfilt',rtrfilt',rfcrfilt',... lutfilt',ladfilt',lpdfilt',lbbfilt',ltrfilt',lfcrfilt', resfilt',lesfilt'); %copy the emgmean values into a matrix of the same size as emg [n,p] = size(emg_lin_env); emgnorm1=zeros(n,p); for i=1:n emgnorm1(i,:)=emgnorm; end; %Normalizes emg emg_normed = emg_lin_env ./ emgnorm1 * 100; clear emg_lin_env; %building time vector deltat=1/sf; maxt=n*deltat; t=deltat:deltat:maxt; %Integrated EMG iemg=cumtrapz(t,emg_normed); %%%%%%%%%%%%%%%%%%%%%%%%%%%%% % %Cuts the emg data into manageable data files to be viewed in Excel. %Cuts determined from video time stamps and data range calc'd with Excel. %To be run after the appropriate emg filt m file % %Also takes Amplitude Probability Density (apd) for each section %Modified by Mark Munro March 6, 2009 % %%%%%%%%%%%%%%%%%%%%%%%%%%%%% %increment value incr = 2; for j=1:cycles, dirNum = num2str(j); dirSubName = strcat('cycle',dirNum,'\'); for k=1:4, dirName = strcat(dir,dirSubName); taskNum = num2str(k); taskName = strcat('task',taskNum); directory = strcat(dirName,taskName,'.txt'); if(k==1) arrayPos1 = 1;

131
131
arrayPos2 = 2; else arrayPos1 = arrayPos1+incr; arrayPos2 = arrayPos2+incr; end %cut section for Sub6 task 1 cutstart = task(j,arrayPos1); cutend = task(j,arrayPos2); section1 = emg_normed(cutstart:cutend,:); % cut section for integrated emg and divide by total section time iemgsection = iemg(cutend,:)-iemg(cutstart,:); % add 1 to compensate for matlab arrays starting at index 1 rather than index 0 sectionsize = cutend-cutstart+1; sectiontime = sectionsize * deltat; %pre populate the array with zero's before loading it with real data iemgsection1 = zeros(sectionsize,14); iemgsection1(1,:) = iemgsection / sectiontime; % APDF percentiles = prctile(section1,[10 50 90]); %pre populate the array with zero's before loading it with real data percentilessection1 = zeros(sectionsize,14); percentilessection1(1:3,:) = percentiles; %combine all emg sections together allemg = [section1, iemgsection1, percentilessection1]; %export to excel file dlmwrite(directory, allemg, '\t'); end end %Plot linear enveloped, normalized emg %**** inputted muscle names into ylable and removed SA channels %Right hand side Figure(1) subplot(6,1,1),plot(emg_normed(:,1)); xlabel('datapoint'); ylabel('Right Upper Trapezius(mV)'); subplot(6,1,2),plot(emg_normed(:,2)); xlabel('datapoint'); ylabel('Right Anterior Deltoid(mV)'); subplot(6,1,3),plot(emg_normed(:,3)); xlabel('datapoint'); ylabel('Right Posterior Deltoid(mV)'); subplot(6,1,4),plot(emg_normed(:,4)); xlabel('datapoint'); ylabel('Right Bicep(mV)'); subplot(6,1,5),plot(emg_normed(:,5)); xlabel('datapoint'); ylabel('Right Tricep(mV)'); subplot(6,1,6),plot(emg_normed(:,6));

132
132
xlabel('datapoint'); ylabel('Right FCR(mV)'); %Left Hand Side subplot(6,1,7),plot(emg_normed(:,7)); xlabel('datapoint'); ylabel('Left Upper Trapezius(mV)'); subplot(6,1,8),plot(emg_normed(:,8)); xlabel('datapoint'); ylabel('Left Anterior Deltoid(mV)'); subplot(6,1,9),plot(emg_normed(:,9)); xlabel('datapoint'); ylabel('Left Posterior Deltoid(mV)'); subplot(6,1,10),plot(emg_normed(:,10)); xlabel('datapoint'); ylabel('Left Bicep(mV)'); subplot(6,1,11),plot(emg_normed(:,11)); xlabel('datapoint'); ylabel('Left Tricep(mV)'); subplot(6,1,12),plot(emg_normed(:,12)); xlabel('datapoint'); ylabel('Left FCR(mV)'); %Erector Spinae subplot(6,1,13),plot(emg_normed(:,13)); xlabel('datapoint'); ylabel('Right ES(mV)'); subplot(6,1,14),plot(emg_normed(:,14)); xlabel('datapoint'); ylabel('Left ES(mV)');
%*************************************************************************** % % This .m file calls a function loademg3 which reads a Delsys data file and then returns % the data file with the header information stripped off. Calculate the % RMS for each mRVC trials and the normalization and output them to their % repective directories. % % Created Jan10, 2009 by M. Munro % % %************************************************************************** %Clear all variables and close all open Figures clear all close all %% set up the variables and arrays for easy access srcDirName='C:\Program Files\MATLAB\R2006b\work\Data Analysis\emg\'; % working directory for this output

133
133
outputDir = 'C:\Program Files\MATLAB\R2006b\work\Data Analysis\RMS maker\RMS\'; % number of subjects to process numSubjects = 8; %cell array so that we can appropriately name the files for later %identification. muscles = {'rut' 'rad' 'rpd' 'rbb' 'rtr' 'rfcr' 'lut' 'lad' 'lpd' 'lbb' 'ltr' 'lfcr'}; [n,p] = size(muscles); for i=1:numSubjects %Clear all variables %diectory name base for each subject subDirName = 'MRVC Standing MS'; dirNum = num2str(i); dirName = strcat(subDirName,dirNum,'\'); %loop to run all 24 trials for j=1:24 trial= j; %create the trial name trialName1 = 'MRVC Standing MS'; trialNum = num2str(j); trialName = strcat(trialName1,dirNum,'[Rep',trialNum,'].emg'); fileName = strcat(srcDirName,dirName,trialName); [header,data] = loademg3(fileName); %for each trial we want only certain channels. for example: for %trial 1, we are wanting the data for UTR UTL which was pre set %to channel 1 and channel 7 %we'll use a switch statement for each of the 24 trials as it's %cleaner to read. switch trial case 1 %trial 1 channels = [1 7];rmsCal(data,channels,muscles,outputDir,i,trial); case 2 %trial 2 channels = [2 8]; rmsCal(data,channels,muscles,outputDir,i,trial); case 3 %trial 3 channels = [3 9];rmsCal(data,channels,muscles,outputDir,i,trial); case 4 %trial 4 channels = [4 10];rmsCal(data,channels,muscles,outputDir,i,trial); case 5 %trial 5 channels = [6 12];rmsCal(data,channels,muscles,outputDir,i,trial); case 6 %trial 6 %rest case 7 %trial 7 channels = [3 9];rmsCal(data,channels,muscles,outputDir,i,trial); case 8 %trial 8 channels = [2 8];rmsCal(data,channels,muscles,outputDir,i,trial); case 9 %trial 9 channels = [6 12];rmsCal(data,channels,muscles,outputDir,i,trial); case 10 %trial 10 channels = [4 10];rmsCal(data,channels,muscles,outputDir,i,trial); case 11 %trial 11 channels = [1 7];rmsCal(data,channels,muscles,outputDir,i,trial); case 12 %trial 12 %rest

134
134
case 13 %trial 13 channels = [3 9];rmsCal(data,channels,muscles,outputDir,i,trial); case 14 %trial 14 channels = [6 12];rmsCal(data,channels,muscles,outputDir,i,trial); case 15 %trial 15 channels = [2 8];rmsCal(data,channels,muscles,outputDir,i,trial); case 16 %trial 16 channels = [1 7];rmsCal(data,channels,muscles,outputDir,i,trial); case 17 %trial 17 channels = [4 10];rmsCal(data,channels,muscles,outputDir,i,trial); case 18 %trial 18 %rest case 19 %trial 19 channels = [6 12];rmsCal(data,channels,muscles,outputDir,i,trial); case 20 %trial 20 channels = [1 7];rmsCal(data,channels,muscles,outputDir,i,trial); case 21 %trial 21 channels = [2 8];rmsCal(data,channels,muscles,outputDir,i,trial); case 22 %trial 22 channels = [4 10];rmsCal(data,channels,muscles,outputDir,i,trial); case 23 %trial 23 channels = [3 9];rmsCal(data,channels,muscles,outputDir,i,trial); case 24 %trial 24 %rest end; end; end;
%**************************************************************************************** % % This .m file reads in a clean CSV data file and then returns % resulting in a 14 column matrix is then filtered using a dual pass, band pass, 2nd order % Butterworth filter. The absolute value is then taken in order to full wave % rectify the emg signal and then the data are linear enveloped using a 7 % Hz, dual pass, low pass 2nd order Butterworth filter. The cumulative % integrated EMG is then calculated. The data are then plotted % on four Figures with the assumption that rows 1 through 7 are % for the right side (RHS), and that rows 9 through 16 are for the left % side (LHS)(just to give you an idea of syntax)... ':' means take % all observations in the row or column, eg. emg_lin_env(1,:)....1 is row % 1 and : is take all of the columns % % Created August 20th, 2011 by M. Munro % Based on processing code created by M. Oliver, 2008 % %************************************************************************** %Clear all variables and close all open Figures clear all close all %% set up the variables and arrays for easy access

135
135
data = csvread ('C:\Program Files\MATLAB\R2006b\work\Data Analysis\lab_study_2\subject11\upright\trial2_stripped.csv'); %data = csvread ('C:\Program Files\MATLAB\R2006b\work\Data Analysis\lab_study_2\subject11\forward\trial2_stripped.csv'); % working directory for this output dir = 'C:\Program Files\MATLAB\R2006b\work\Data Analysis\lab_study_2_processed\sub11\upright\'; %dir = 'C:\Program Files\MATLAB\R2006b\work\Data Analysis\lab_study_2_processed\sub11\forward\'; %sample frequency sf = 1000.29; %Norm numbers from MRVC RMS emgnorm =[0.095996619,0.142158359,0.243784961,0.061232349,0.397021988,0.365166536,0.187029212,0.175068223,0.049622336,... 0.067304463,0.138227179,0.143084884,0.101672204,0.10965721]; % DC offset values (mean of MRVC)channels 1 through 14 emgmean = [-0.042060556,-0.01561336,-0.009522825,-0.032480617,-0.01522863,-0.011250166,-0.010705131,-0.007335884,-0.007181541,... 0.000728863,-0.020445256,-0.023475107,-0.019407415,-0.019870738]; %number is cycles to process cycles = 1; %array for 4 tasks over 3 cycles.1,2,3; %this array is for one cycle to make better use of the imported script, the multi dimensional array should % be used and a looping structure set up to process all the data. task = [1,30416,30417,60823,60824,91248,91249,121664]; %Filter raw EMG Using a 10-450 Hz Band Pass Filter %Lowpass [b,a]=butter(2,450/500,'low'); emglow=filtfilt(b,a,data(:,:)); clear data; %Highpass [b,a]=butter(2,10/500,'high'); emg=filtfilt(b,a,emglow(:,:)); %*****change 'data' to 'emglow' clear emglow; [rows,columns] = size(emg); %make a matrix of zeroes to the size of emg emgmean1=zeros(rows,columns); %copy the emgmean values into a matrix of the same size as emg for i=1:rows emgmean1(rows,:)=emgmean'; end; %for i=1:n % emgmean1(n,:)=emgmean'; %end; %subtract emgmean values from the emg raw data to remove DC offset emg=emg-emgmean1; %Take absolute value (i.e., full wave rectify) of emg data matrix emgabs=abs(emg);

136
136
clear emg; %Seperate each channel before filtering or all channels end up the same rfcr = emgabs(:,1); lfcr = emgabs(:,2); lad = emgabs(:,3); rad = emgabs(:,4); lut = emgabs(:,5); rut = emgabs(:,6); rpd = emgabs(:,7); lpd = emgabs(:,8); lbb = emgabs(:,9); rbb = emgabs(:,10); rtr = emgabs(:,11); ltr = emgabs(:,12); % Erector spinae are on channel 13 and 14 as they were placed on the % subject last res = emgabs(:,13); les = emgabs(:,14); clear emgabs; %Create 7 Hz linear envelope [b,a]=butter(2,7/500,'low'); %emg_lin_env=filtfilt(b,a,emgabs); %Filter each channel individually rutfilt = filtfilt(b,a,rut); radfilt = filtfilt(b,a,rad); rpdfilt = filtfilt(b,a,rpd); rbbfilt = filtfilt(b,a,rbb); rtrfilt = filtfilt(b,a,rtr); rfcrfilt = filtfilt(b,a,rfcr); lutfilt = filtfilt(b,a,lut); ladfilt = filtfilt(b,a,lad); lpdfilt = filtfilt(b,a,lpd); lbbfilt = filtfilt(b,a,lbb); ltrfilt = filtfilt(b,a,ltr); lfcrfilt = filtfilt(b,a,lfcr); resfilt = filtfilt(b,a,res); lesfilt = filtfilt(b,a,les); %put the channels back into an array emg_lin_env=horzcat(rutfilt,radfilt,rpdfilt,rbbfilt,rtrfilt,rfcrfilt,resfilt,lutfilt,ladfilt,lpdfilt,lbbfilt,ltrfilt,lfcrfilt,lesfilt); %copy the emgmean values into a matrix of the same size as emg emgnorm1=zeros(rows,columns); for i=1:rows emgnorm1(i,:)=emgnorm; end; %Normalizes emg

137
137
emg_normed = emg_lin_env ./ emgnorm1 * 100; clear emg_lin_env; %building time vector deltat=1/sf; maxt=rows*deltat; t=deltat:deltat:maxt; %Integrated EMG iemg=cumtrapz(t,emg_normed); %%%%%%%%%%%%%%%%%%%%%%%%%%%%% % %Cuts the emg data into manageable data files to be viewed in Excel. %Cuts determined from video time stamps and data range calc'd with Excel. %To be run after the appropriate emg filt m file % %%%%%%%%%%%%%%%%%%%%%%%%%%%%% %increment value incr = 2; for j=1:cycles, dirNum = num2str(j); dirSubName = strcat('cycle',dirNum,'\'); for k=1:4, dirName = strcat(dir,dirSubName); taskNum = num2str(k); taskName = strcat('task',taskNum); directory = strcat(dirName,taskName,'.txt'); if(k==1) arrayPos1 = 1; arrayPos2 = 2; else arrayPos1 = arrayPos1+incr; arrayPos2 = arrayPos2+incr; end %cut section for Sub task 1 cutstart = task(j,arrayPos1); cutend = task(j,arrayPos2); section1 = emg_normed(cutstart:cutend,:); % cut section for integrated emg and divide by total section time iemgsection = iemg(cutend,:)-iemg(cutstart,:); % add 1 to compensate for matlab arrays starting at index 1 rather than index 0 sectionsize = cutend-cutstart+1; sectiontime = sectionsize * deltat; %pre populate the array with zero's before loading it with real data iemgsection1 = zeros(sectionsize,14); iemgsection1(1,:) = iemgsection / sectiontime; % APDF percentiles = prctile(section1,[10 50 90]); %pre populate the array with zero's before loading it with real data percentilessection1 = zeros(sectionsize,14); percentilessection1(1:3,:) = percentiles; %combine all emg sections together allemg = [section1, iemgsection1, percentilessection1];

138
138
%export to excel file dlmwrite(directory, allemg, '\t'); end end

139
139
//C code for programming the 12F675 microcontroller //*************************************************************************************** // // Pulse control code programmed into the 12F675 microcontroller that turns on and off the camera. // For the sake of the is design, we only really needed to trigger the camera, all other functions // where superfluous. Triggers a LED to pulse that matches the pulse code in the camera to turn on // or off. // Created October 9, 2010 by M. Munro // #define F_CPU 7600000 // clock frequency, set according to clock used! #include <inttypes.h> #include <stdlib.h> #include <avr/io.h> #include <util/delay.h> #include <avr/interrupt.h> #define HPERIOD 0.01537 #define RATIO 0.4 #define NPULSES 16 #define LEDOFF 0b00000001 #define LEDON 0b00010111 int main(void) { uint8_t i; DDRB = 0b00010110; // pin PB0 is input, pins PB1-PB4 are output PORTB = 0b00000001; // pull-up for input pin PB0 asm volatile ("nop"); asm volatile ("nop"); if ( PINB & (1<<PINB0) ) { for(i=0;i<NPULSES;i++) { PORTB = LEDON; _delay_ms(HPERIOD); PORTB = LEDOFF; _delay_ms(HPERIOD); } _delay_ms(7.33); // delay in MS, adjust this if clock frequency changes for(i=0;i<NPULSES;i++) { PORTB = LEDON; _delay_ms(HPERIOD); PORTB = LEDOFF; _delay_ms(HPERIOD); } } else { for(i=0;i<NPULSES;i++) { PORTB = LEDON; _delay_ms(HPERIOD); PORTB = LEDOFF; _delay_ms(HPERIOD); }
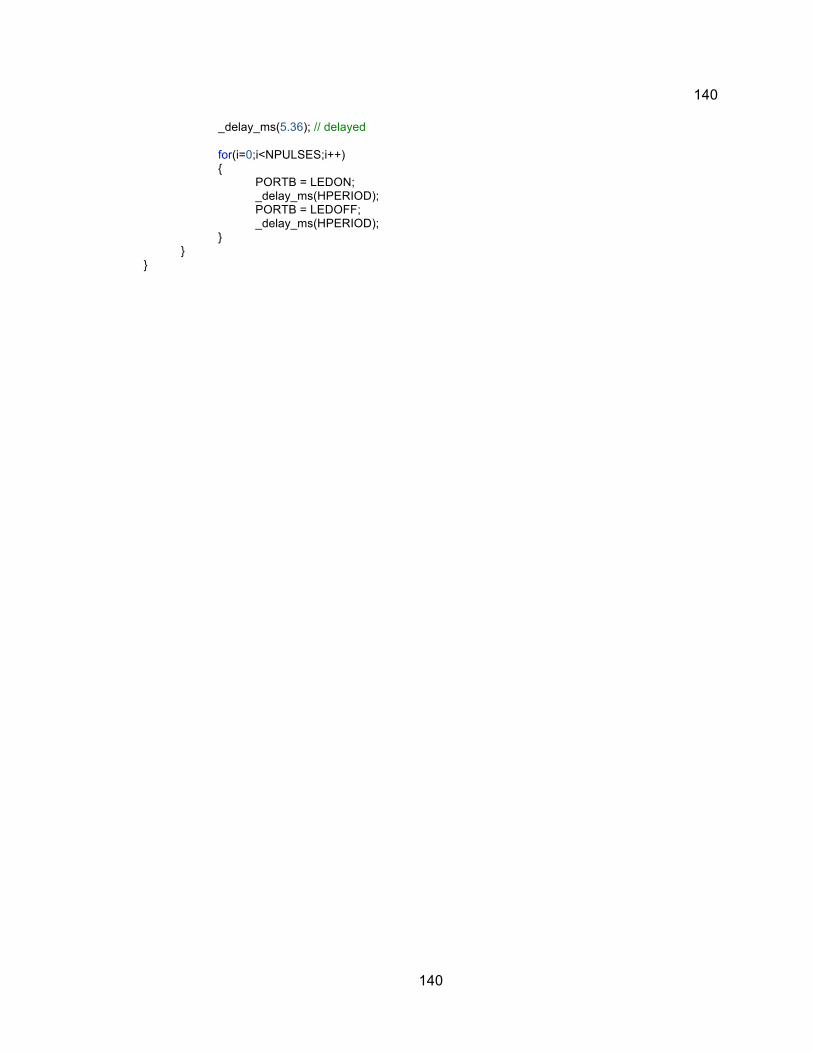
140
140
_delay_ms(5.36); // delayed for(i=0;i<NPULSES;i++) { PORTB = LEDON; _delay_ms(HPERIOD); PORTB = LEDOFF; _delay_ms(HPERIOD); } } }
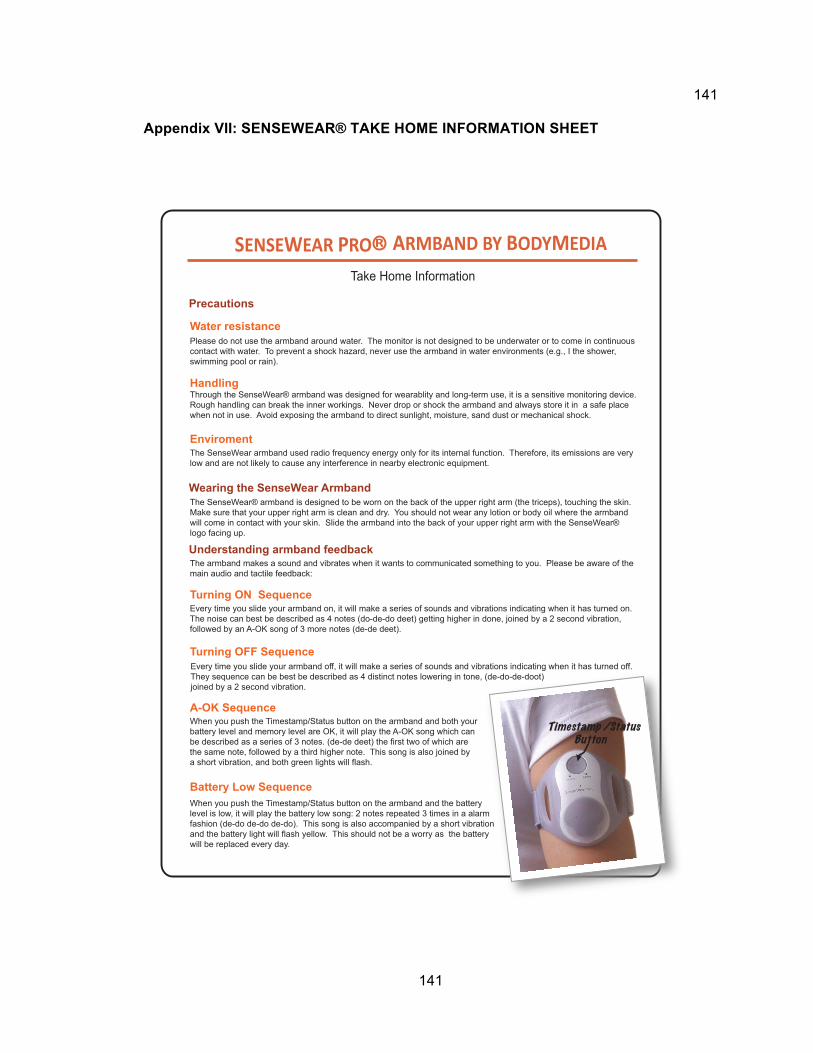
141
141
Appendix VII: SENSEWEAR® TAKE HOME INFORMATION SHEET
SENSEWEAR PRO R ARMBAND BY BODYMEDIA
Take Home Information
Please do not use the armband around water. The monitor is not designed to be underwater or to come in continuous contact with water. To prevent a shock hazard, never use the armband in water environments (e.g., I the shower, swimming pool or rain).
Water resistance
Handling
Enviroment
Turning ON Sequence
Turning OFF Sequence
A-OK Sequence
Battery Low Sequence
The armband makes a sound and vibrates when it wants to communicated something to you. Please be aware of themain audio and tactile feedback:
Every time you slide your armband on, it will make a series of sounds and vibrations indicating when it has turned on. The noise can best be described as 4 notes (do-de-do deet) getting higher in done, joined by a 2 second vibration, followed by an A-OK song of 3 more notes (de-de deet).
When you push the Timestamp/Status button on the armband and both your battery level and memory level are OK, it will play the A-OK song which can be described as a series of 3 notes. (de-de deet) the first two of which are the same note, followed by a third higher note. This song is also joined by a short vibration, and both green lights will flash.
When you push the Timestamp/Status button on the armband and the battery level is low, it will play the battery low song: 2 notes repeated 3 times in a alarm fashion (de-do de-do de-do). This song is also accompanied by a short vibration and the battery light will flash yellow. This should not be a worry as the battery will be replaced every day.
Every time you slide your armband off, it will make a series of sounds and vibrations indicating when it has turned off.They sequence can be best be described as 4 distinct notes lowering in tone, (de-do-de-doot) joined by a 2 second vibration.
Precautions
Wearing the SenseWear Armband
Understanding armband feedback
Through the SenseWear® armband was designed for wearablity and long-term use, it is a sensitive monitoring device. Rough handling can break the inner workings. Never drop or shock the armband and always store it in a safe place when not in use. Avoid exposing the armband to direct sunlight, moisture, sand dust or mechanical shock.
The SenseWear armband used radio frequency energy only for its internal function. Therefore, its emissions are very low and are not likely to cause any interference in nearby electronic equipment.
The SenseWear® armband is designed to be worn on the back of the upper right arm (the triceps), touching the skin. Make sure that your upper right arm is clean and dry. You should not wear any lotion or body oil where the armband will come in contact with your skin. Slide the armband into the back of your upper right arm with the SenseWear® logo facing up.
Timestamp /StatusButton