quantification strategies in real-time pcr michael … is widely and increasingly used because of...
TRANSCRIPT
A-Z of quantitative PCR (Editor: SA Bustin) Chapter3. Quantification strategies in real-time PCR 87
Quantification strategies in real-time PCR Michael W. Pfaffl Chaper 3 pages 87 - 112 in: A-Z of quantitative PCR (Editor: S.A. Bustin) International University Line (IUL) La Jolla, CA, USA publication year 2004 Physiology - Weihenstephan, Technical University of Munich, Center of Life and Food Science Weihenstephan, Freising, Germany [email protected] Content of Chapter 3: Quantification strategies in real-time PCR Abstract 88 3.1. Introduction 88 3.2. Markers of a Successful Real-Time RT-PCR Assay 88 3.2.1. RNA Extraction 88 3.2.2. Reverse Transcription 90 3.2.3. Comparison of qRT-PCR with Classical End-Point Detection Method 91 3.2.4. Chemistry Developments for Real-Time RT-PCR 92 3.2.5. Real-Time RT-PCR Platforms 92 3.2.6. Quantification Strategies in Kinetic RT-PCR 92 3.2.6.1. Absolute Quantification 93 3.2.6.2. Relative Quantification 95 3.2.8. Real-Time PCR Amplification Efficiency 99 3.2.9. Data Evaluation 101 3.3. Automation of the Quantification Procedure 102 3.4. Normalization 103 3.5. Statistical Comparison 106 3.6. Conclusion 107 3.7 References 108
A-Z of quantitative PCR (Editor: SA Bustin) Chapter3. Quantification strategies in real-time PCR 88
Abstract
This chapter analyzes the quantification strategies in real-time RT-PCR and all
corresponding markers of a successful real-time RT-PCR. The following aspects are
describes in detail: RNA extraction, reverse transcription (RT), and general quantification
strategies—absolute vs. relative quantification, real-time PCR efficiency calculation, data
evaluation, automation of quantification, data normalization, and statistical comparison. The
discussion turns into practical considerations with focus on specificity and sensitivity.
3.1. Introduction
Reverse transcription (RT) followed by polymerase chain reaction (PCR) represents a
powerful tool for the detection and quantification of mRNA. Real-time RT-PCR (or kinetic RT-
PCR) is widely and increasingly used because of its high sensitivity, good reproducibility, and
wide dynamic quantification range.1-4 The first practical kinetic PCR technology, the 5'-
nuclease assay, was established 1993 and combines the exponential PCR amplification of a
specific transcript with the monitoring of newly synthesized DNA in each performed PCR
cycle.5-7 It is the most sensitive method for the detection and quantification of gene
expression levels, in particular for low abundant transcripts in tissues with low RNA
concentrations, from limited tissue sample and for the elucidation of small changes in mRNA
expression levels.1-4,8-12 While kinetic RT-PCR has a tremendous potential for analytical and
quantitative applications, a comprehensive understanding of its underlying principles is
important. Fidelity of real-time RT-PCR is associated with its "true" specificity, sensitivity,
reproducibility, and robustness and, as a fully reliable quantitative method, it suffers from the
problems inherent in RT and PCR, e.g., amplification of unspecific products, primer-dimers,
amplification efficiencies, hetero-duplex formation, etc.13
This chapter analyzes the quantification strategies in real-time RT-PCR and all
corresponding markers of a successful real-time RT-PCR.
3.2. Markers of a Successful Real-Time RT-PCR Assay
3.2.1. RNA Extraction
The integrity of purified RNA is critical to all gene expression analysis techniques. The
preparation of intact cellular total RNA or pure mRNA is the first marker in gene
quantification. For successful and reliable diagnostic use, real-time RT-PCR needs high-
quality, DNA-free, and undegraded RNA.14,15 Accurate quantification and quality
A-Z of quantitative PCR (Editor: SA Bustin) Chapter3. Quantification strategies in real-time PCR 89
assessment30 of the starting RNA sample is particularly important for absolute quantification
methods that normalize specific mRNA expression levels against total RNA ("molecules/g
total RNA" or "concentrations/g total RNA").28,29 RNA, especially long mRNA up to 10 kb,14 is
easily degraded by cleavage of RNases during tissue sampling, RNA purification, and RNA
storage. The source of RNA, sampling techniques (biopsy material, single cell sampling, and
laser microdissection),2,16,17 as well as RNA isolation techniques (either total RNA or poly-
adenylated RNA) often vary significantly between processing laboratories.15 RNA extracted
from adipose or collagen-rich tissues often has a lower yield and is of lesser quality, and
contains partly degraded RNA sub-fractions (own unpublished results). Particular RNA
extraction techniques can work more effectively in one specific tissue type compared with
another one, and result in up to 10-fold variations in total RNA yield.15 RNA may contain
tissue enzyme inhibitors that result in reduced RT and PCR reaction efficiencies and
generate unreliable and "wrong" quantification results.14,15
Most RNA preparations are contaminated with DNA and protein at very low levels. Even
high-quality commercially obtained RNAs contain detectable amounts of DNA.15 While this is
not a problem for some applications, the tremendous amplification power of kinetic PCR may
result in even the smallest amount of DNA contamination to interfering with the desired
"specific amplification." To confirm the absence of residual DNA either a "minus-RT" or
"water control" should always be included in the experimental design. It may be necessary to
treat the RNA sample with commercially available RNase-free DNase, to get rid of residual
DNA. However, unspecific side reactions of the DNase often result in RNA degradation (own
unpublished results). It is always necessary to remove the DNase prior to any RT or PCR
step.
Furthermore, the design of the PCR product should incorporate at least one exon-exon splice
junction to allow a product obtained from the cDNA to be distinguished on electrophoresis
from genomic DNA contamination. However, processed pseudogenes (e.g., �-actin, GAPDH
or 18S rRNA) can be present and lead to confusion in data interpretation. In addition, intron-
lacking pseudogenes (e.g. �-actin) with equal sequence length to endogenous mRNA have
been described.18-24 They prevent a distinction between products originating from genomic
DNA versus mRNA, which poses a significant problem in qualitative and quantitative gene
quantification. Therefore, various housekeeping genes must be tested or multiplex assays of
reference genes as internal controls for the assessment of RNA and cDNA quality must be
performed.25-27
A-Z of quantitative PCR (Editor: SA Bustin) Chapter3. Quantification strategies in real-time PCR 90
3.2.2. Reverse Transcription
The second marker in quantitative RT-PCR is the production of a single-stranded (ss)
complementary DNA copy (cDNA) of the RNA through the reverse transcriptase (RT) and its
dynamic range, sensitivity, and specificity are prime consideration for a successful kinetic
RT-PCR assay.31-34 For many quantitative applications, MMLV H– RT is the enzyme of
choice,31,35,36 as its cDNA synthesis rate is up to 40-fold greater than that of AMV (own
unpublished results). Newly available thermostable RNAse H- RT maintains its activity up to
70°C, thus permitting increased specificity and efficiency of first primer annealing. However,
this enzyme may be less robust than more conventional ones as it appears to be more
sensitive to inhibitors present in RNA preparation.28,36,37
The RT step is the source of most of the variability in a kinetic RT-PCR experiment and for
each enzyme the specific reaction conditions has to be optimized. Salt contamination,
alcohol, phenol, and other inhibitors carried over from the RNA isolation process can affect
the apparent RT efficiency.13,31,34 Another source of variability is the choice of priming method
used to initiate cDNA synthesis, which can be either target gene-specific or non-specific.
Target gene-specific primers work well in conjunction with elevated RT-reaction
temperatures to eliminate spurious transcripts.36,37 The same reverse primer is used for the
subsequent PCR assay in conjunction with the corresponding gene-specific sense primer
(forward primer). However, the use of gene-specific primers necessitates a separate RT
reaction for each gene of interest. It cannot be assumed that different reactions have the
same cDNA synthesis efficiency; the result can be high variability during multiple RT
reactions.
To circumvent these high inter-assay variations in RT, target gene unspecific primers, e.g.,
random hexamer, octamer or decamer primers, can be used and a cDNA pool can be
synthesized. Similarly, poly-T oligonucleotides (consisting solely of 16-25 deoxythymidine
residues) can anneal to the polyadenylated 3' (poly-A) tail found on most mRNAs.13,30 cDNA
pools synthesized with unspecific primers can be split into a number of different target-
specific kinetic PCR assays. This maximizes the number of genes that can be assayed from
a single cDNA pool, derived from one small RNA sample. Therefore the gene expression
results are directly comparable between the applied assays, at least within one and the same
RT pool. In conclusion, a rank order of RT efficiency can be shown for the applied different
primers for ONE specific gene: random hexamer primers > poly-dT primer > gene-specific
primer (own unpublished results).
Importantly, not only RNA quantity and quality, but also yield and quality of cDNA can be
highly variable. Certainly, there is evidence that cDNA yield from sequences near the 5' end
of partially degraded mRNAs is significantly less than from sequences near the poly-A tail
and assays aimed at identifying RNA degradation are being developed.3,14,34,38 Thus, reliable
A-Z of quantitative PCR (Editor: SA Bustin) Chapter3. Quantification strategies in real-time PCR 91
internal quality control of cDNA synthesis is essential. Controls are generally performed by
PCR amplification of reference genes, mostly common housekeeping genes (GAPDH,
albumin, actins, tubulins, cyclophilin, microglobulins, 18S ribosomal RNA (rRNA) or 28S
rRNA).11,27,39-43 The chosen reference genes used as well as the expression levels vary
between different laboratories, and only few of them have been critically evaluated (see
Section 3.4. Normalization).
3.2.3. Comparison of Real-Time RT-PCR with Classical End-Point Detection
Method
The efficacy of kinetic RT-PCR is measured by its specificity, low background fluorescence,
steep fluorescence increase, high amplification efficiency, and high level plateau.44 Typically,
the PCR reaction can be divided in four characteristic phases:45 1st phase is hidden under the
background fluorescence where an exponential amplification is expected; 2nd phase with
exponential amplification that can be detected and above the background; 3rd phase with
linear amplification efficiency and a steep increase of fluorescence; and finally 4th phase or
plateau phase, defined as the attenuation in the rate of exponential product accumulation,
which is seen concomitantly in later cycles.46,47 The amount of amplified target is directly
proportional to the input amount of target only during the exponential phase of PCR
amplification. Hence the key factor in the quantitative ability of kinetic RT-PCR is that it
measures the product of the target gene within that phase.10,45,48-51 Since data acquisition
and analysis are performed in one and the same tube, this increases sample throughput,
reduces the chances of carryover contamination, and removes post-PCR processing as a
potential source of error.52
In contrast, during the plateau phase of the PCR there is no direct relation of "DNA input" to
"amplified target"; hence classical RT-PCR assays have to be stopped at least in linear
phase.44, 53 The exponential range of amplification has to be determined for each transcript
empirically by amplifying equivalent amounts of cDNA over various cycles of the PCR or by
amplifying dilutions of cDNA over the same number of PCR cycles.10, 53 Amplified RT-PCR
end product is later detected by ethidium bromide gel staining, radioactivity labelling,
fluorescence labelling, high-performance liquid chromatography, southern blotting,
densitometric analysis, or other post-amplification detection methods.53-55 This step-wise
accumulation of post-PCR variability10,49, 53 leads to semi-quantitative results with high intra-
assay (around 30-40%) and inter-assay variability (around 50-70%; own unpublished results)
in endpoint detection assays. Finally, whereas real-time methods have a dynamic range of
A-Z of quantitative PCR (Editor: SA Bustin) Chapter3. Quantification strategies in real-time PCR 92
greater than eight orders of magnitude, the dynamic range of the endpoint assays is at best
two.10, 49, 56
3.2.4. Chemistry Developments for Real-Time RT-PCR
The third marker in kinetic RT-PCR is the right detection chemistry. Two general methods for
the quantitative detection of the amplicon have become established: gene-specific
fluorescent probes or specific double strand (ds) DNA binding agents8,49,52,57,58 based on
fluorescence resonance energy transfer (FRET).11,48,59 The best-know probe-based system is
ABI’s TaqMan,6,60,61 which makes use of the 5'-3' exonuclease activity of Taq polymerase to
quantitate target sequences in the samples. Probe hydrolysis separates fluorophore and
quencher and results in an increased fluorescence signal called "Förster type energy
transfer."62,63. The alternative is a non-sequence specific fluorescent intercalating dsDNA
binding dye, e.g., SYBR Green I (Molecular Probes) or ethidium bromide.58 For single PCR
product reactions with well-designed primers, SYBR Green I can work extremely well, with
spurious non-specific background only showing up in very late cycles.4,47,56 Among the real-
time detection chemistry, SYBR Green I and TaqMan assays produced comparable dynamic
range and sensitivity, while SYBR Green I detection was more precise and produced a more
linear decay plot than the TaqMan probe detection.10
3.2.5. Real-Time RT-PCR Platforms
A detailed description of all real-time PCR platforms is available under http://cyclers.gene-
quantification.info/ These PCR machines differ in sample capacity, up to 96-well and 384-
well standard format, others process 72 (RotorGene) or only 32 samples and require
specialized glass capillaries (LightCycler), excitation method (lasers and others broad-
spectrum light sources with various filters), and fluorescence acquisition channels. There are
also platform-specific differences in how the software processes data with focus on absolute
or relative quantification strategies.61,64,65 For at least two systems and chemistries, the ABI
PRISM 7700 using "TayMan Probes" and Roche’s LightCycler using "Hybridization Probes,"
there is little difference in accuracy and performance.66
3.2.6. Quantification Strategies in Kinetic RT-PCR
The quantification strategy is the principal marker in gene quantification. Generally, two
strategies can be performed in real-time RT-PCR. The levels of expressed genes may be
A-Z of quantitative PCR (Editor: SA Bustin) Chapter3. Quantification strategies in real-time PCR 93
measured by absolute or relative quantitative real-time RT-PCR. Absolute quantification
relates the PCR signal to input copy number using a calibration curve, while relative
quantification measures the relative change in mRNA expression levels. The reliability of an
absolute real-time RT-PCR assay depends on the condition of "identical" amplification
efficiencies for both the native target and the calibration curve in RT reaction and in following
kinetic PCR.67-69 Relative quantification is easier to perform than absolute quantification
because a calibration curve is not necessary. It is based on the expression levels of a target
gene versus a housekeeping gene (reference or control gene) and in theory is adequate for
most purposes to investigate physiological changes in gene expression levels.61,64 The units
used to express relative quantities are irrelevant, and the relative quantities can be compared
across multiple real-time RT-PCR experiments.1
3.2.6.1. Absolute Quantification
Calibration curves are highly reproducible and allow the generation of highly specific,
sensitive and reproducible data.3,4,47,54,56 However, the external calibration curve model has to
be thoroughly validated as the accuracy of absolute quantification in real-time RT-PCR
depends entirely on the accuracy of the standards. Standard design, production,
determination of the exact standard concentration, and stability over long storage time is not
straightforward and can be problematic. The dynamic range of the performed calibration
curve can be up to nine orders of magnitude from < 101 to > 1010 start molecules, depending
on the applied standard material.4,56,71 The calibration curves used in absolute quantification
can be based on known concentrations of DNA standard molecules, e.g., recombinant
plasmid DNA (recDNA), genomic DNA, RT-PCR product, and commercially synthesized big
oligonucleotide.3,4,49,54,58,71 Stability and reproducibility in kinetic RT-PCR depends on the type
of standard used and depends strongly on "good laboratory practice." Cloned recDNA and
genomic DNA are very stable and generate highly reproducible standard curves even after a
long storage time, in comparison to freshly synthesized DNA. Furthermore, the longer
templates derived from recDNA and genomic DNA mimic the average native mRNA length of
about 2 kb better than shorter templates derived from RT-PCR product or oligonucleotides.
They are more resistant against unspecific cleavage and proofreading activity of polymerase
during reaction setup and in kinetic PCR (own unpublished results). One advantage of the
shorter templates and commercially available templates is an accurate knowledge of its
concentration and length. A second advantage is that their use avoids the very time
consuming process of having to produce standard material: standard synthesis, purification,
cloning, transformation, plasmid preparation, linearization, verification, and exact
determination of standard concentration.4,47,49,56
A-Z of quantitative PCR (Editor: SA Bustin) Chapter3. Quantification strategies in real-time PCR 94
A problem with DNA-based calibration curves is that they are subject to the PCR step only,
unlike the unknown mRNA samples that must first be reverse transcribed. This increases the
potential for variability of the RT-PCR results and the amplification results may not be strictly
comparable with the results from the unknown samples. However, the problem of the
sensitivity of the RT-PCR to small variations in the reaction setup is always lurking in the
background as a potential drawback to this simple procedure. Therefore, quantification with
external standards requires careful optimization of its precision (replicates in the same kinetic
PCR run – intra-assay variation) and reproducibility (replicates in separate kinetic PCR runs
– inter-assay variation) in order to understand the limitations within the given
application.4,54,56
A recombinant RNA (recRNA) standard that was synthesized in vitro from a cloned RT-PCR
fragment in plasmid DNA is one option.4,7,47,56,72 However, identical RT efficiency, as well as
real-time PCR amplification efficiencies for calibration curve and target cDNA must be tested
and confirmed if the recRNA is to provide a valid standard for mRNA quantification.4 This is
because only the specific recRNA molecules are present during RT and the kinetics of cDNA
synthesis are not like those in native RNA (the unknown sample) that also contain a high
percentage of natural occurring subfractions, e.g., ribosomal RNA (rRNA, ~ 80%) and
transfer RNA (tRNA, 10-15%). These missing RNA subfractions can influence the cDNA
synthesis rate and in consequence RT efficiency rises and calibration curves are then
overestimated in gene quantification.36,73 To compensate for background effects and mimic a
natural RNA distribution like in native total RNA, total RNA isolated from bacterial or insect
cell lines can be used. Alternatively commercially available RNA sources can be used as
RNA background, e.g., poly-A RNA or tRNA, but they do not represent a native RNA
distribution over all RNA subspecies.4 Earlier results suggest, that a minimum of RNA
background is generally needed and that it enhances RT synthesis efficiency rate. Low
concentrations of recRNA used in calibration curves should always be buffered with
background or carrier RNA; otherwise the low amounts can be degraded easily by RNAses.
Very high background concentrations had a more significant suppression effect in RT
synthesis rate and in later real-time PCR efficiency.4
No matter how accurately the concentration of the standard material is known, the final result
is always reported relatively compared to a defined unit of interest, e.g., copies per defined
ng of total RNA, copies per genome (6.4 pg DNA), copies per cell, copies per gram of tissue,
copies per ml blood, etc. If absolute changes in copy number are important, then the
denominator still must be shown to be absolute stable across the comparison. This accuracy
may only be needed in screening experiments (amount of microorganism in food), to
measure the percentage of GMO (genetic modified organism) in food, to measure the viral
load or bacterial load in immunology and microbiology. The quality of your gene
quantification data cannot be better than the quality of the denominator. Any variation in the
A-Z of quantitative PCR (Editor: SA Bustin) Chapter3. Quantification strategies in real-time PCR 95
denominator will obscure real changes, produce artificial changes, and wrong quantification
results. Careful use of controls is critical to demonstrate that your choice of denominator was
a wise one.49 Under certain circumstances, absolute quantification models can also be
normalized using suitable and unregulated references or housekeeping genes (see Section
3.4 Normalization).
3.2.6.2. Relative Quantification
Relative quantification determines the changes in steady-state mRNA levels of a gene
across multiple samples and expresses it relative to the levels of an internal control RNA.
This reference gene is often a housekeeping gene and can be co-amplified in the same tube
in a multiplex assay or can be amplified in a separate tube.56,59 Therefore, relative
quantification does not require standards with known concentrations and the reference can
be any transcript, as long as its sequence is known.29 Relative quantification is based on the
expression levels of a target gene versus a reference gene and in many experiments is
adequate for investigating physiological changes in gene expression levels. To calculate the
expression of a target gene in relation to an adequate reference gene various mathematical
models are established. Calculations are based on the comparison of the distinct cycle
determined by various methods, e.g., crossing points (CP) and threshold values (Ct) at a
constant level of fluorescence; or CP acquisition according to established mathematic
algorithm.50,51,69 To date, several mathematical models that determine the relative expression
ratio have been developed. Two types of relative quantification models are available and
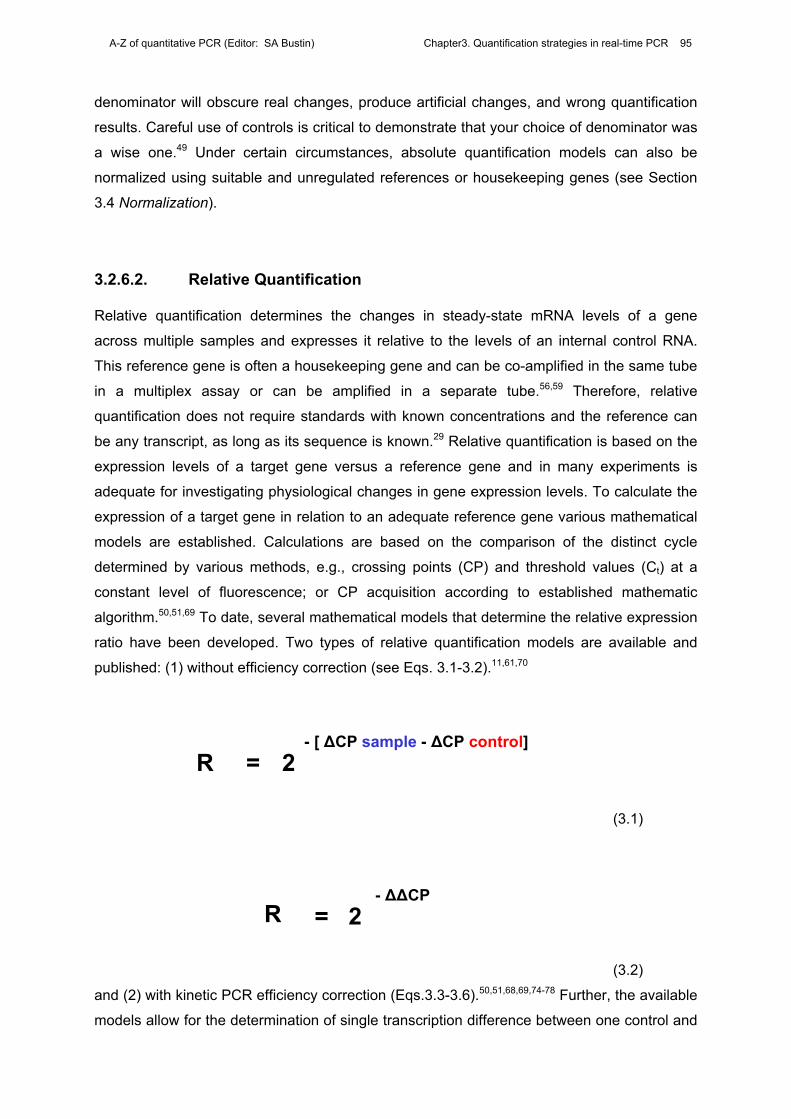
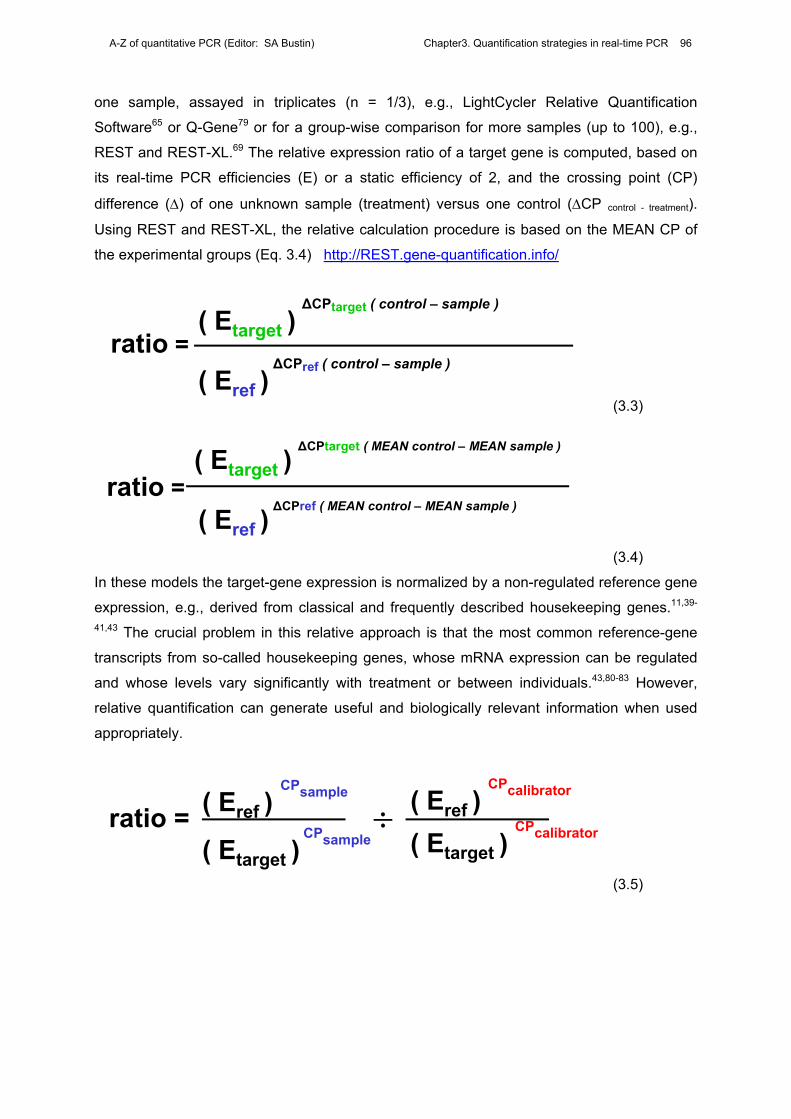
published: (1) without efficiency correction (see Eqs. 3.1-3.2).11,61,70
R = 2- [ ∆CP sample - ∆CP control]
(3.1)
= 2- ∆∆CP
R
(3.2)
and (2) with kinetic PCR efficiency correction (Eqs.3.3-3.6).50,51,68,69,74-78 Further, the available
models allow for the determination of single transcription difference between one control and
A-Z of quantitative PCR (Editor: SA Bustin) Chapter3. Quantification strategies in real-time PCR 96
one sample, assayed in triplicates (n = 1/3), e.g., LightCycler Relative Quantification
Software65 or Q-Gene79 or for a group-wise comparison for more samples (up to 100), e.g.,
REST and REST-XL.69 The relative expression ratio of a target gene is computed, based on
its real-time PCR efficiencies (E) or a static efficiency of 2, and the crossing point (CP)
difference (∆) of one unknown sample (treatment) versus one control (∆CP control - treatment).
Using REST and REST-XL, the relative calculation procedure is based on the MEAN CP of
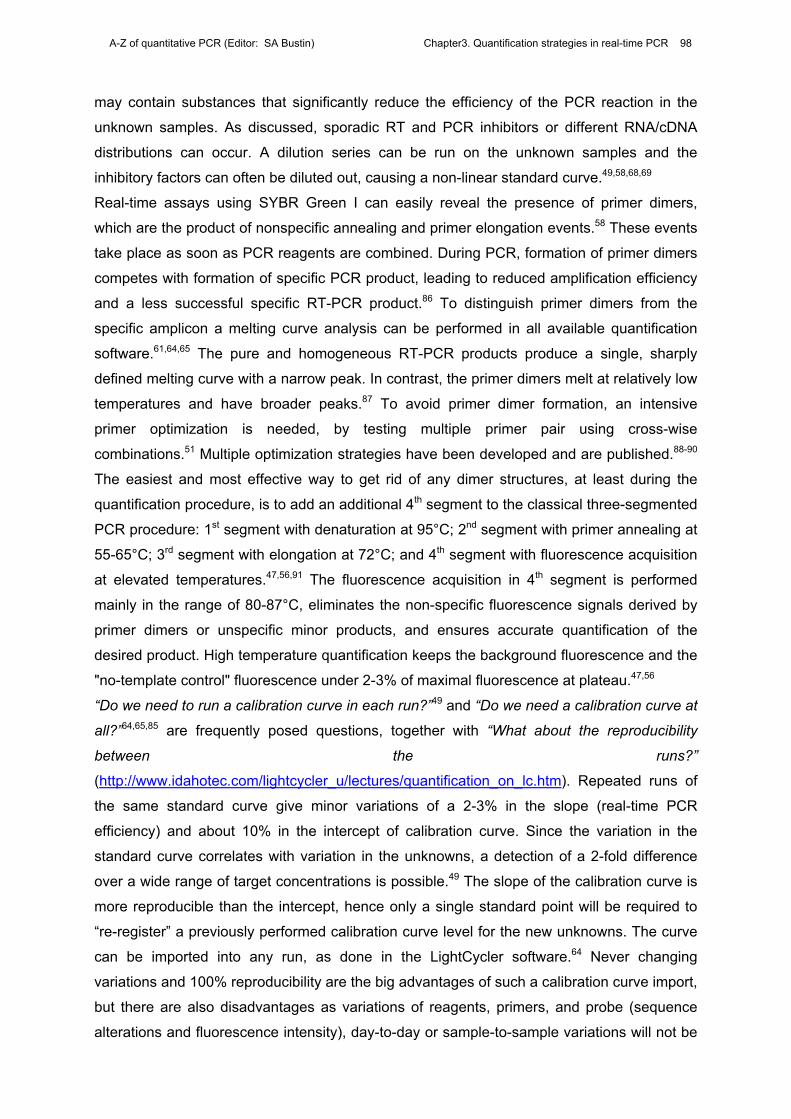
the experimental groups (Eq. 3.4) http://REST.gene-quantification.info/
( Etarget )∆CPtarget ( control – sample )
ratio =( Eref )
∆CPref ( control – sample )
(3.3)
( Etarget )∆CPtarget ( MEAN control – MEAN sample )
( Eref )∆CPref ( MEAN control – MEAN sample )
ratio =
(3.4)
In these models the target-gene expression is normalized by a non-regulated reference gene
expression, e.g., derived from classical and frequently described housekeeping genes.11,39-
41,43 The crucial problem in this relative approach is that the most common reference-gene
transcripts from so-called housekeeping genes, whose mRNA expression can be regulated
and whose levels vary significantly with treatment or between individuals.43,80-83 However,
relative quantification can generate useful and biologically relevant information when used
appropriately.
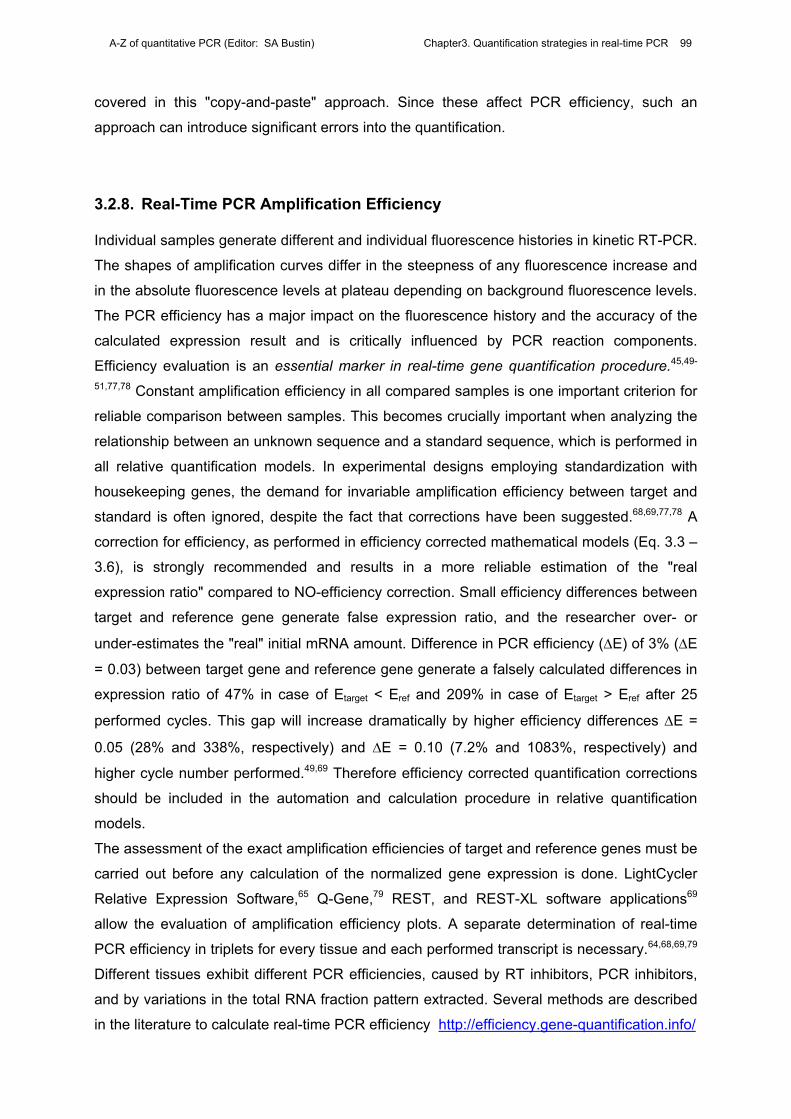
( Eref )CPsample
( Etarget )CPsample
÷ratio = ( Eref )CPcalibrator
( Etarget )CPcalibrator
(3.5)

A-Z of quantitative PCR (Editor: SA Bustin) Chapter3. Quantification strategies in real-time PCR 97
conc(target sample) / conc(ref sample) * MFratio =
conc(target cal.) / conc(ref cal.) * CF(3.6)
3.2.7. Advantages and Disadvantages of External Standards
External standard quantification is the method of choice for the nucleic acid quantification,
independent of any hardware platform used. The specificity, sensitivity, linearity, and
reproducibility allow for the absolute and accurate quantification of molecules even in tissues
with low mRNA abundance (< 100 molecules/reaction setup) and detection down to a few
molecules (< 10 molecules/reaction setup).4,12,56,71 The dynamic range of an optimal validated
and optimized external standardized real-time RT-PCR assay can accurately detect target
mRNA up to nine orders of magnitude or a billion-fold range with high assay linearity
(correlation coefficient; r > 0.99).4,12,49,56,84 In general, a mean intra-assay variation of 10-20%
and a mean inter-assay variation of 15-30% on molecule basis (maximal 2-4% variability on
CP basis, respectively) is realistic over the wide dynamic range.6,12,47,56,71,85 At high (> 107)
and low (< 103) template copy input levels the assay variability is higher than in the range
between the two.4,47,49 At very low copy numbers, under 20 copies per tube, the random
variation due to sampling error (Poisson's error law) becomes significant.49,76
A recDNA calibration curve model can quantify precisely only cDNA molecules derived from
the RT step; it says nothing about the conversion to cDNA of the mRNA molecules present in
the native total RNA sample. Variability in cDNA synthesis efficiency during reverse
transcription must be always kept in mind. Therefore, a recRNA calibration curve model has
the advantage that both RNA templates undergo parallel RT and real-time PCR steps.
However, a direct comparison suggests that the recDNA quantification model shows higher
sensitivity, exhibits a larger quantification range, has a higher reproducibility, and is more
stable than the recRNA model.4 Furthermore, recDNA external calibration curves exhibit
lower variation (intra-assay variation < 0.7%; inter-assay variation < 2.6% on CP basis) than
the recRNA model (< 2.7% and < 4.5%, respectively). Clearly, the RT step has a profound
affect on the overall result obtained from an RT-PCR assay and more thorough consideration
of RT efficiency is needed.
The main disadvantage of external standards is the lack of internal control for RT and PCR
inhibitors. All quantitative PCR methods assume that the target and the sample amplify with
similar efficiency.61,70 The risk with external standards is that some of the unknown samples
A-Z of quantitative PCR (Editor: SA Bustin) Chapter3. Quantification strategies in real-time PCR 98
may contain substances that significantly reduce the efficiency of the PCR reaction in the
unknown samples. As discussed, sporadic RT and PCR inhibitors or different RNA/cDNA
distributions can occur. A dilution series can be run on the unknown samples and the
inhibitory factors can often be diluted out, causing a non-linear standard curve.49,58,68,69
Real-time assays using SYBR Green I can easily reveal the presence of primer dimers,
which are the product of nonspecific annealing and primer elongation events.58 These events
take place as soon as PCR reagents are combined. During PCR, formation of primer dimers
competes with formation of specific PCR product, leading to reduced amplification efficiency
and a less successful specific RT-PCR product.86 To distinguish primer dimers from the
specific amplicon a melting curve analysis can be performed in all available quantification
software.61,64,65 The pure and homogeneous RT-PCR products produce a single, sharply
defined melting curve with a narrow peak. In contrast, the primer dimers melt at relatively low
temperatures and have broader peaks.87 To avoid primer dimer formation, an intensive
primer optimization is needed, by testing multiple primer pair using cross-wise
combinations.51 Multiple optimization strategies have been developed and are published.88-90
The easiest and most effective way to get rid of any dimer structures, at least during the
quantification procedure, is to add an additional 4th segment to the classical three-segmented
PCR procedure: 1st segment with denaturation at 95°C; 2nd segment with primer annealing at
55-65°C; 3rd segment with elongation at 72°C; and 4th segment with fluorescence acquisition
at elevated temperatures.47,56,91 The fluorescence acquisition in 4th segment is performed
mainly in the range of 80-87°C, eliminates the non-specific fluorescence signals derived by
primer dimers or unspecific minor products, and ensures accurate quantification of the
desired product. High temperature quantification keeps the background fluorescence and the
"no-template control" fluorescence under 2-3% of maximal fluorescence at plateau.47,56
“Do we need to run a calibration curve in each run?”49 and “Do we need a calibration curve at
all?”64,65,85 are frequently posed questions, together with “What about the reproducibility
between the runs?”
(http://www.idahotec.com/lightcycler_u/lectures/quantification_on_lc.htm). Repeated runs of
the same standard curve give minor variations of a 2-3% in the slope (real-time PCR
efficiency) and about 10% in the intercept of calibration curve. Since the variation in the
standard curve correlates with variation in the unknowns, a detection of a 2-fold difference
over a wide range of target concentrations is possible.49 The slope of the calibration curve is
more reproducible than the intercept, hence only a single standard point will be required to
“re-register” a previously performed calibration curve level for the new unknowns. The curve
can be imported into any run, as done in the LightCycler software.64 Never changing
variations and 100% reproducibility are the big advantages of such a calibration curve import,
but there are also disadvantages as variations of reagents, primers, and probe (sequence
alterations and fluorescence intensity), day-to-day or sample-to-sample variations will not be
A-Z of quantitative PCR (Editor: SA Bustin) Chapter3. Quantification strategies in real-time PCR 99
covered in this "copy-and-paste" approach. Since these affect PCR efficiency, such an
approach can introduce significant errors into the quantification.
3.2.8. Real-Time PCR Amplification Efficiency
Individual samples generate different and individual fluorescence histories in kinetic RT-PCR.
The shapes of amplification curves differ in the steepness of any fluorescence increase and
in the absolute fluorescence levels at plateau depending on background fluorescence levels.
The PCR efficiency has a major impact on the fluorescence history and the accuracy of the
calculated expression result and is critically influenced by PCR reaction components.
Efficiency evaluation is an essential marker in real-time gene quantification procedure.45,49-
51,77,78 Constant amplification efficiency in all compared samples is one important criterion for
reliable comparison between samples. This becomes crucially important when analyzing the
relationship between an unknown sequence and a standard sequence, which is performed in
all relative quantification models. In experimental designs employing standardization with
housekeeping genes, the demand for invariable amplification efficiency between target and
standard is often ignored, despite the fact that corrections have been suggested.68,69,77,78 A
correction for efficiency, as performed in efficiency corrected mathematical models (Eq. 3.3 –
3.6), is strongly recommended and results in a more reliable estimation of the "real
expression ratio" compared to NO-efficiency correction. Small efficiency differences between
target and reference gene generate false expression ratio, and the researcher over- or
under-estimates the "real" initial mRNA amount. Difference in PCR efficiency (∆E) of 3% (∆E
= 0.03) between target gene and reference gene generate a falsely calculated differences in
expression ratio of 47% in case of Etarget < Eref and 209% in case of Etarget > Eref after 25
performed cycles. This gap will increase dramatically by higher efficiency differences ∆E =
0.05 (28% and 338%, respectively) and ∆E = 0.10 (7.2% and 1083%, respectively) and
higher cycle number performed.49,69 Therefore efficiency corrected quantification corrections
should be included in the automation and calculation procedure in relative quantification
models.
The assessment of the exact amplification efficiencies of target and reference genes must be
carried out before any calculation of the normalized gene expression is done. LightCycler
Relative Expression Software,65 Q-Gene,79 REST, and REST-XL software applications69
allow the evaluation of amplification efficiency plots. A separate determination of real-time
PCR efficiency in triplets for every tissue and each performed transcript is necessary.64,68,69,79
Different tissues exhibit different PCR efficiencies, caused by RT inhibitors, PCR inhibitors,
and by variations in the total RNA fraction pattern extracted. Several methods are described
in the literature to calculate real-time PCR efficiency http://efficiency.gene-quantification.info/
A-Z of quantitative PCR (Editor: SA Bustin) Chapter3. Quantification strategies in real-time PCR 100
A) Efficiency calculation from the slopes of the calibration curve according to the equation:
E = 10 [–1/slope], as described earlier.5,49,61 Determination of efficiency should be
evaluated in a pool of all starting RNAs to accumulate all possible "negative impacts"
on kinetic PCR efficiency. Usually, real-time PCR efficiency vary with high linearity (r >
0.989) from E = 1.60 to maximal values up to E = 2.10 for cDNA input ranges from a
few pg to 75 ng cDNA input.12,56,69,71 Typically, the relationship between CP and the
logarithm of the starting copy number of the target sequence should remain linear for
up to five orders of magnitude in the calibration curve as well as in the native sample
RNA.79 This calculation method results, in some cases, in efficiencies higher than (E >
2.0), which is practically impossible in the PCR amplification theory. But as shown in
given results they are highly reproducible and constant within one transcript and
tissue.68,71 This probably indicates that this efficiency calculation method is not optimal
and overestimates the "real efficiency."
B) Efficiency calculation from the fluorescence increase in 3rd linear phase of each
logarithmic fluorescence history plot. The investigator has to decide which cycle
number to include in the analysis and plot a linear regression (similarly to the Fit Point
Method regression) where the slope of the regression line represents the PCR
efficiency. Here efficiencies between E = 1.35 and E = 1.60 are realistic and differ
dramatically from the results above.47,92 This efficiency calculation method might
underestimate the "real efficiency," because data evaluation is made in linear phase
near the plateau where reaction trend to get restrictive.46
C) Efficiency calculation on the basis of all fluorescence data points (starting at cycle 1st
up to the last cycle), according to a sigmoidal or logistic curve fit model. The advantage
of such model is that all data points will be included in the calculation process. No
background subtraction is necessary.45,50,51,77,78 Slope value is "nearly" identical to
method B and only measured at the point of inflexion at absolute maximum
fluorescence increase (1.35 < E < 1.60). But the derived slope parameters generated
by the sigmoidal or logistic models are not directly comparable with the "real PCR
efficiency." This method is easy to perform and a good estimator for the maximum
curve slope with high correlation coefficient (r > 0.99) and level of significance (p <
0.001).45,50,51,77,78
D) Efficiency calculation from the fluorescence increase only in the 2nd real exponential
phase, according to a polynomial curve fit, as described earlier Yn = Y0 (E)n, where Yn
is fluorescence acquired at cycle n, and Y0 initial fluorescence, so-called ground
fluorescence.45,74,92-94 This phase around the “Second Derivate Maximum” exhibit a real
exponential amplification behavior.45 Here in the exponential part of the PCR reaction,
kinetic is still under "full power" with no restrictions.46 In this method the calculation is
A-Z of quantitative PCR (Editor: SA Bustin) Chapter3. Quantification strategies in real-time PCR 101
performed on each reaction kinetic plot and the amplification efficiency can be
determined exactly. They range from E = 1.75 to E = 1.90, hence are between the
other methods.
Which efficiency calculation method is "the right one" and which one shows the realistic real-
time PCR kinetic and thereby is highly reproducible, has to be evaluated in further
experiments.
3.2.9. Data Evaluation
The next marker in gene quantification using real-time RT-PCR is the data evaluation. The
calculation unit in real-time PCR is a sample specific and characteristic crossing points (CP).
For CP determination various fluorescence acquisition methodologies are possible. The “Fit
Point Method” and “Threshold Cycle Method” measure the CP at a constant fluorescence
level.5,7,61,64,74 These constant threshold methods assume that all samples have the same
cDNA concentration at the threshold fluorescence. Measuring the level of background
fluorescence can be a challenge in real-time PCR reactions with significant background
fluorescence variations caused by drift-ups and drift-downs over the course of the reaction.
Averaging over a drifting background will give an overestimation of variance and thus
increase the threshold level.61,49 The threshold level can be calculated by fitting the
intersecting line upon the ten-times value of ground fluorescence standard deviation. This
acquisition mode can be easily automated and is very robust.61 In the “Fit Point Method” the
user has discard the uninformative background points, exclude the plateau values by
entering the number of log-linear points, and then fits a log-line to the linear portion of the
amplification curves. These log lines are extrapolated back to a common threshold line and
the intersection of the two lines provides the CP value. The strength of this method is that it
is extremely robust. The weakness is that it is not easily automated and so requires a lot of
user interaction.49,64 “Fit Point Method” or “Threshold Cycle Method” can be used on all
available platforms with different evaluation of background variability.
The problems of defining a constant background for all samples within one run, sample-to-
sample differences in variance and absolute fluorescence values lead to develop a new
acquisition modus according to mathematical algorithms. In the LightCycler software the
“Second Derivative Maximum Method” is performed where CP is automatically identified and
measured at the maximum acceleration of fluorescence.49,64 The kinetic fluorescence
histories of individual curves are different. They show individual background variability (1st
phase), exponential and linear growth of fluorescence (2nd and 3rd phase), and finally
reaction-specific plateau values (4th phase). The amplification reaction and the kinetic
A-Z of quantitative PCR (Editor: SA Bustin) Chapter3. Quantification strategies in real-time PCR 102
fluorescence history over various cycles is obviously not a smooth and easy function. The
mathematical algorithm on which the “Second Derivative Maximum Method” in Roche
Molecular Biochemicals software is based is unpublished. But it is possible to fit sigmoidal
and polynomial curve models45,50,51,77,78 with high significance (p < 0.001) and coefficient of
correlation (r > 0.99), which can be differentiated, and the second-derivate maximum can be
estimated.45,50,51 This increase in the rate of fluorescence increase, or better called the
acceleration of the fluorescence signal, slows down at the beginning of the 3rd linear phase.
Therefore the cycle where the second derivative is at its maximum is always between 2nd
exponential and 3rd linear phase.45
3.3. Automation of the Quantification Procedure
Automation of quantification with any kind of calibration curve using “Fit Point
Method,”“Threshold Cycle Method” or “Second Derivative Maximum Method” is fully
supported by the software supplied with the real-time instruments. The investigator has to
input his individual settings, e.g., threshold level and noise band, import an existing standard
curve, and then click for calculation of the CPs and the corresponding concentrations.
However, although relative expression is performed by researchers according to several
established mathematical models (Eqs. 3.1-3.6),61,68-70,75,79 up to now relative quantification
software has been commercially available only from Roche Molecular Biochemicals
“LightCycler Relative Quantification Software” (http://www.lightcycler-
online.com/lc_sys/soft_ind.htm#quant). The software allows for a comparison of maximal
triplets (n = 3) of a target versus a calibrator gene, both corrected via a reference-gene
expression and calculates on the basis of the median of the performed triplets. Real-time
PCR efficiency correction is possible within the software and calculated from the calibration
curve slope, according to the established equation E = 10 [–1/slope], ranging from E = 1.0
(minimum value) to E = 2.0 (theoretical maximum and efficiency optimum). A given correction
factor (CF) and a multiplication factor (MF), which are provided in the product specific
applications (Eq. 3.6) by Roche Molecular Biochemicals, have to be attended in the equation
calculation process.65
Importantly, until recently it was not possible to perform a reliable group-wise calculation of
the relative expression ratios and a subsequent statistical comparison of the results by a
statistical test with more than three repeats or more than three samples. This has changed
when new software tools were established (e.g. REST and REST-XL), both Excel®-based
and programmed in Visual Basic for Applications.68,69 Both compare two treatment groups,
with multiple data points in sample group versus control group, and calculate the relative
expression ratio between them. Four target genes with up to 100 data points can be
A-Z of quantitative PCR (Editor: SA Bustin) Chapter3. Quantification strategies in real-time PCR 103
calculated in REST-XL. The mathematical model used is published;69 it is based on the
MEAN crossing point deviation between sample and control group of up to four target genes,
normalized by the MEAN crossing point deviation of a reference gene (Eq. 3.4).
Normalization via endogenous control can be performed according to the users demand, but
it is recommended to compensate intra- and inter-RT-PCR variations.68,69,95 Therefore the
requirement for high reproducibility of RT and RT efficiency is not "that important" anymore.
cDNA input concentration variation of ±3-fold was evaluated to mimic these huge RT
variations and resulted in no significant changes of relative expression ratio.69 Specific
amplification efficiencies of four target-gene genes can be estimated and included in the
correction of the quantification ratio. If no real-time PCR efficiency assessment is performed,
REST assumes an optimal efficiency of E = 2.0. The big advantage of the software tool is the
subsequent statistical test. REST tests the group differences for significance with a newly
developed randomization test - Pair-Wise Fixed Reallocation Randomization Test©. Variation
depends only on CP variation of the investigated transcripts and remains stable between 3%
and 12%.69
Nevertheless, successful application of real-time RT-PCR and REST depends on a clear
understanding of the practical problems. Therefore a coherent experimental design,
application, and validation of the individual real-time RT-PCR assay remains essential for
accurate and fully quantitative measurement of mRNA transcripts http://REST.gene-
quantification.info/
Recently a second software tool, named Q-Gene, was developed.79 Q-Gene manages and
expedites the planning, performance, and evaluation of quantitative real-time PCR
experiments, as well as the mathematical and statistical analysis, storage, and graphical
presentation of the data. An efficiency correction is possible. The Q-Gene software
application is a tool to cope with complex quantitative real-time PCR experiments at a high-
throughput scale (96-well and 384-well format) and considerably expedites and rationalizes
the experimental setup, data analysis, and data management while ensuring highest
reproducibility (http://www.biotechniques.com/softlib/qgene.html).
3.4. Normalization
Data normalization in real-time RT-PCR is a further major marker in gene quantification
analysis. The reliability of any relative RT-PCR experiment can be improved by including an
invariant endogenous control in the assay to correct for sample-to-sample variations in RT-
PCR efficiency and errors in sample quantification. A biologically meaningful reporting of
target mRNA copy numbers requires accurate and relevant normalization to some standard
and is strongly recommended in kinetic RT-PCR.28,29,68-70 But the quality of normalized
A-Z of quantitative PCR (Editor: SA Bustin) Chapter3. Quantification strategies in real-time PCR 104
quantitative expression data cannot be better than the quality of the normalizer itself. Any
variation in the normalizer will obscure real changes and produce artifactual changes.28,29
Real-time RT-PCR-specific errors in the quantification of mRNA transcripts are easily
compounded with any variation in the amount of starting material between the samples, e.g.,
caused by sample-to-sample variation, variation in RNA integrity, RT efficiency differences,
and cDNA sample loading variation.15,31,95 This is especially relevant when the samples have
been obtained from different individuals, different tissues, and different time courses and will
result in the misinterpretation of the derived expression profile of the target genes. Therefore,
normalization of target-gene expression levels must be performed to compensate intra- and
inter-kinetic RT-PCR variations (sample-to-sample and run-to-run variations).
Data normalization can be carried out against an endogenous unregulated reference gene
transcript or against total cellular DNA or RNA content (molecules/g total DNA/RNA and
concentrations/g total DNA/RNA). Normalization according the total cellular RNA content is
increasingly used, but little is known about the total RNA content of cells or even about the
mRNA concentrations. The content per cell or per gram tissue may vary in different tissues in
vivo, in cell culture (in vitro), between individuals and under different experimental conditions.
Nevertheless, it has been shown that normalization to total cellular RNA is the least
unreliable method.3,28,29 It requires an accurate quantification of the isolated total RNA or
mRNA fraction by optical density at 260 nm (OD260), Agilent Bioanalyser 2100, or RiboGreen
RNA Quantification Kit. Alternatively the rRNA content has been proposed as an optimal and
stable basis for normalization, despite reservations concerning its expression levels,
transcription by a different RNA polymerase, and possible imbalances in rRNA and mRNA
fractions between different samples.29,42,80,96,97
To normalize the absolute quantification according to a single reference gene, a second set
of kinetic PCR reactions has to be performed for the invariant endogenous control on all
experimental samples and the relative abundance values are calculated for internal control
as well as for the target gene. For each target gene sample, the relative abundance value
obtained is divided by the value derived from the control sequence in the corresponding
target gene. The normalized values for different samples can then be directly compared. The
sets of CPs for the reference gene can be easily imported into the REST software
application, according to the given equations (Eqs. 3.3-3.4). The calculation process
considers them and allows for a normalization of the target genes with the reference
gene.64,68,69,79 Additionally, it will show whether normalization via the chosen reference is
useful by showing the factor of regulation and level of significance as result of the
randomization test. The investigators can decide if the reference is suitable in this
experimental trial or not.
Here a central question arises: “What is the appropriate reference gene for an experimental
treatment and investigated tissue?”3,41,42,98 Commonly used housekeeping genes, e.g.,
A-Z of quantitative PCR (Editor: SA Bustin) Chapter3. Quantification strategies in real-time PCR 105
GAPDH, albumin, actins, tubulins, cyclophilin, microglobulins, 18S rRNA or 28S rRNA27,39-
42,50may be suitable for reference genes, since they are present in all nucleated cell types
and are necessary for basic cell survival. The mRNA synthesis of housekeeping genes is
considered to be stable in various tissues, even under experimental treatments.39-41,50
However, numerous treatments and studies have already shown that the mentioned
housekeeping genes are regulated and vary under experimental conditions.42,43,80-83,99 It
remains up to the individual investigator to choose a reference gene that is best for reliable
normalization in their particular experimental setting. In addition, the endogenous control
should be expressed at roughly the same CP level as the target gene.3,28 At the same CP
level, reference and target experience the same condition and real-time RT-PCR kinetics
with respect to polymerase activation (heat activation of polymerase), reaction inactivation,
stochastic relation between target and primer concentration, and reaction end product
inhibition by the generated RT-PCR product.
It cannot be emphasized enough that the choice of housekeeping or lineage specific genes
is critical. For a number of commonly used reference genes processed pseudogenes have
been shown to exist, e.g.�-actin or GAPDH.22-24 These pseudogenes may be responsible for
specific amplification products in an mRNA-independent fashion and result in specific
amplification even in the absence of intact mRNA.18-21,84 It is vital to develop universal,
artificial, stable, internal standard materials that can be added prior to the RNA preparation to
monitor the efficiency of RT as well as the kinetic PCR respectively.29 Usually more than one
housekeeping genes should be tested in a multiple pair wise correlation analysis and its
behavior summarized to a housekeeping gene index called BestKeeper© 105. According to
this BestKeeper© index, which is based on the weighted expression of at least three
housekeeping genes, a more reliable basis of normalization in relative quantification can be
postulated.69,100,101 http://www.gene-quantification.de/bestkeeper.html
There is increasing appreciation of these aspects of quantitative RT-PCR and recently a
software tool was established for the evaluation of housekeeping genes expression levels.
GeNorm27 allows for an accurate normalization of real-time quantitative RT-PCR data by
geometric averaging of multiple internal control genes
(http://allserv.rug.ac.be/~jvdesomp/genorm/). The geNorm VBA applet for Microsoft Excel
determines the most stable housekeeping genes from a set of ten tested genes in a given
cDNA sample panel, and calculates a gene expression normalization factor for each tissue
sample based on the geometric mean of a user defined number of housekeeping genes. The
normalization strategy used in geNorm is a prerequisite for accurate kinetic RT-PCR
expression profiling, which opens up the possibility of studying the biological relevance of
small expression differences.27
A-Z of quantitative PCR (Editor: SA Bustin) Chapter3. Quantification strategies in real-time PCR 106
3.5. Statistical Comparison
Bio-informatics and bio-statistics on real-time RT-PCR experiment data is a new subject and
a new challenge in gene quantification analysis. This is because the coordination of the
experiments and the efficient management of the collected data has become an additional
major hurdle for kinetic RT-PCR experiments. The main challenge remains the evaluation
and the mathematical and statistical analysis of the enormous amount of data gained by this
technology, as these functions are not included in the software provided by the
manufacturers of the detection systems.79 Normally the statistical data analysis in gene
quantification, independent of block, competitive or real-time RT-PCR experiments, are all
performed on the basis of classical standard parametric tests, such as analysis of variance or
t-tests.102 Parametric tests depend on assumptions, such as normality of distributions, whose
validity is unclear. In absolute or relative quantification analysis, where the quantities of
interest are derived from ratios and variances can be high, normal distributions might not be
expected, and it is unclear how a parametric test could best be constructed.69
Only two free available software packages support statistical analysis of expression results:
Q-Gene79 and REST.69 The Q-Gene Statistics Add-In is a collection of several VBA programs
for the rapid and menu-guided performance of frequently used parametric and nonparametric
statistical tests. To assess the level of significance between any two groups expression
values, it is possible to perform a paired or an unpaired Student’s test, a Mann-Whitney U-
test, or Wilcoxon signed-rank test.102 In addition, the Pearson’s correlation analysis can be
applied between two matched groups of expression values. Furthermore, all statistical
programs calculate the mean values of both groups analyzed and their difference in
percent.79
Permutation or randomization tests are a useful alternative to more standard parametric tests
for analyzing experimental data.103,104 They have the advantage of making no distributional
assumptions about the data, while remaining as powerful as conventional tests.
Randomization tests are based on one we know to be true: that treatments were randomly
allocated.103,104 The randomization test is conducted as follows: A statistical test is based on
the probability of an effect as large as that observed occurring under the null hypothesis of
no treatment effect. If this hypothesis is true, the values in one treatment group were just as
likely to have occurred in the other group. The randomization test repeatedly and randomly
reallocates the observed values to the two groups and notes the apparent effect (expression
ratio in REST) each time. The proportion of these effects, which are as great as that actually
observed in the experiment gives us the p-value of the test
(http://www.bioss.ac.uk/smart/unix/mrandt/slides/frames.htm).
The REST software package makes full use of the advantages of a randomization test.69 In
the applied two-sided Pair-Wise Fixed Reallocation Randomization Test for each sample, the
A-Z of quantitative PCR (Editor: SA Bustin) Chapter3. Quantification strategies in real-time PCR 107
CP values for reference and target genes are jointly reallocated to control and sample groups
(= pair-wise fixed reallocation), and the expression ratios are calculated on the basis of the
mean values. In practice, it is impractical to examine all possible allocations of data to
treatment groups, and a random sample is drawn. If 2,000 or more samples are taken, a
good estimate of p-value (standard error < 0.005 at p = 0.05) is obtained.103,104
Randomization tests with a pair-wise reallocation are seen as the most appropriate approach
for this type of application. They are more flexible than non-parametric tests based on ranks
(Mann-Whitney, Kruskal-Wallis, etc.) and do not suffer a reduction in power relative to
parametric tests (t-tests, ANOVA, etc.). They can be slightly conservative (i.e., type I error
rates lower than the stated significance level) due to acceptance of randomizations with
group differences identical to that observed, but this mainly occurs when used with discrete
data.103,104
3.6. Conclusion
The recent advances in gene quantification strategies, fluorescence chemistries, and
instrumentations have led to the development of various assays whereby mRNA transcripts
can be quantified precisely in very short time. The benefits in terms of increased sensitivity,
reduced variability, reduced risk of contamination, increased throughput by automation, and
meaningful data interpretation are obvious. If done properly, kinetic RT-PCR is the most
powerful method for quantifying cellular mRNA levels. The quantification strategy used
should be designed according to the researchers demand, but must be highly optimized and
precisely validated. In the future, there is a need for greater standardization of the applied
assays to make the expression results comparable between runs, between real-time RT-
PCR platforms, and between different laboratories worldwide.
Sharing any technical and practical information for sample preparation, assay design,
standard materials, and data management will help to improve gene quantification analysis.
Therefore various information platforms and discussion forums are available on the internet
(summarized under http://infoportal.gene-quantification.info/ ).
A-Z of quantitative PCR (Editor: SA Bustin) Chapter3. Quantification strategies in real-time PCR 108
3.7 References
1. Orlando C, Pinzani P, Pazzagli M: Developments in quantitative PCR. Clin Chem Lab Med 1998, 36:255-269.
2. Lockey C, Otto E, Long Z: Real-time fluorescence detection of a single DNA molecule. Biotechniques 1998, 24:744-746.
3. Bustin SA: Absolute quantification of mRNA using real-time reverse transcription polymerase chain reaction assays. J Mol Endocrinol 2000, 25:169-193.
4. Pfaffl MW, Hageleit M: Validities of mRNA quantification using recombinant RNA and recombinant DNA external calibration curves in real-time RT-PCR. Biotechn Lett 2001, 23:275-282.
5. Higuchi R, Fockler C, Dollinger G, Watson R: Kinetic PCR analysis: Real-time monitoring of DNA amplification reactions. Biotechnology 1993, 11(9):1026-1030.,
6. Heid, C. A., Stevens, J., Livak, K.J., and Williams, P.M., Real time quantitative PCR, Genome Res., 6: 986-993, 1996.
7. Gibson, U.E., Heid, C.A,. and Williams, P.M., A novel method for real time quantitative RT-PCR. Genome Res, 6: 1095-1001, 1996.
8. Mackay, I. M., Arden, K. E., and Nitsche, A., Real-time PCR in virology, Nucleic Acids Res., 30: 1292-1305, 2002.
9. Steuerwald, N., Cohen, J., Herrera, R.J., and Brenner C.A., Analysis of gene expression in single oocytes and embryos by real-time rapid cycle fluorescence monitored RT-PCR. Mol Hum Reprod., 5: 1034-1039, 1999.
10. Schmittgen, T.D., Zakrajsek, B.A., Mills, A.G., Gorn, V., Singer, M.J., and Reed, M.W., Quantitative reverse transcription-polymerase chain reaction to study mRNA decay: comparison of endpoint and real-time methods. Anal Biochem., 285(2): 194-204, 2000.
11. Winer, J., Jung, C.K., Shacke,l I., and Williams, P.M., Development and validation of real-time quantitative reverse transcriptase-polymerase chain reaction for monitoring gene expression in cardiac myocytes in vitro. Anal Biochem., 270(1): 41-49, 1999.
12. Wittwer, C.T., and Garling, D.J., Rapid cycle DNA amplification: Time and temperature optimization. BioTechniques, 10: 76-83, 1991.
13. Freeman, W.M., Walker, S.J., and Vrana, K,E., Quantitative RT-PCR: pitfalls and potential. Biotechniques., 26(1): 112-125, 1999.
14. Swift, G.H., Peyton, M.J., and MacDonald, R.J., Assessment of RNA quality by semi-quantitative RT-PCR of multiple regions of a long ubiquitous mRNA. Biotechniques., 28(3): 524-531, 2000.
15. Mannhalter, C., Koizar, D., and Mitterbauer, G., Evaluation of RNA isolation methods and reference genes for RT-PCR analyses of rare target RNA. Clin Chem Lab Med, 38: 171-177, 2000.
16. Freeman, T.C., Lee, K., and Richardson, P.J., Analysis of gene expression in single cells. Curr Opin Biotechnol., 10(6): 579-582, 1999.
17. Dixon, A.K., Richardson, P.J., Pinnock, R.D., and Lee, K., Gene-expression analysis at the single-cell level. Trends Pharmacol Sci., 21(2): 65-70, 2000.
18. Moss, M., and Gallwitz, D., Structure of two human beta-actin related processed genes, one of which is located next to a simple repetitive sequence. EMBO, 2: 757–761, 1983.
19. Mutimer, H., Deacon, N., Crowe, S., and Sonza, S., Pitfalls of processed pseudogenes in RT-PCR. Biotechniques., 24(4): 585-588, 1998.
20. Neumaier, M., Gerhard, M., and Wagener, C., Diagnosis of micrometastases by the amplification of tissue-specific genes. Gene., 159(1): 43-47, 1995.
21. Tschentscher, P., Wagener, C., and Neumaier, M., Sensitive and specific cytokeratin 18 reverse transcription-polymerase chain reaction that excludes amplification of processed pseudogenes from contaminating genomic DNA. Clin Chem., 43(12): 2244-2250, 1997.
22. Dirnhofer, S., Berger, C., Untergasser, G., Geley, S., and Berger, P., Human beta-actin retro pseudogenes interfere with RT-PCR. Trends Genet., 11(10): 380-381, 1995.
23. Ercolani, L., Florence, B., Denaro, M., and Alexander, M., Isolation and complete sequence of a functional human glyceraldehyde-3-phosphate dehydrogenase gene. J Biol Chem., 263(30): 15335-15341, 1988.
24. Garcia-Meunier, P., Etienne-Julan, M., Fort, P., Piechaczyk, M., and Bonhomme, F., Concerted evolution in the GAPDH family of retrotransposed pseudogenes. Mamm Genome., 4(12): 695-703, 1993.
25. Watzinger, F., and Lion, T., Multiplex PCR for quality control of template RNA/cDNA in RT-PCR assays. Leukemia, 12: 1983–1986, 1998.
A-Z of quantitative PCR (Editor: SA Bustin) Chapter3. Quantification strategies in real-time PCR 109
26. Burkardt, H.J., Standardization and quality control of PCR analyses. Clin Chem Lab Med.,
38(2): 87-91, 2000. 27. Vandesompele, J., De Preter, K., Pattyn, F., Poppe, B., Van Roy, N., De Paepe, A., and
Speleman, F., Accurate normalization of real-time quantitative RT-PCR data by geometric averaging of multiple internal control genes. Genome Biology, 3(7): 0034.1-0034.11, 2002.
28. Bustin, S.A., Meaningful quantification of mRNA using real-time RT-PCR. (submitted), 2002. 29. Bustin, S.A., Quantification of mRNA using real-time RT-PCR. Trends and problems. J Mol
Endocrinol, 29(1): 23-39, 2002. 30. Glasel, J.A., Validity of nucleic acid purities monitored by 260nm/280nm absorbance ratios.
BioTechniques., 18(1): 62-63, 1994. 31. Wong, L., Pearson, H., Fletcher, A., Marquis, C.P., and Mahler, S., Comparison of the Efficiency
of Moloney Murine Leukaemia Virus (M-MuLV) Reverse Transcriptase, RNase H--M-MuLV Reverse Transcriptase and Avian Myeloblastoma Leukaemia Virus (AMV) Reverse Transcriptase for the Amplification of Human Immunoglobulin Genes. Biotechnology Techniques, 12(6): 485-489, 1998.
32. Fuchs, B,. Zhang, K., Rock, M.G., Bolander, M.E., and Sarkar, G., High temperature cDNA synthesis by AMV reverse transcriptase improves the specificity of PCR. Mol Biotechnol., 12(3): 237-240, 1999.
33. Fuchs, B., Zhang, K., Rock, M.G., Bolander, M.E., and Sarkar, G., Repeat cDNA synthesis and RT-PCR with the same source of RNA. Mol Biotechnol., 12(3): 231-235, 1999.
34. Schwabe, H., Stein, U., and Walther W., High-copy cDNA amplification of minimal total RNA quantities for gene expression analyses. Mol Biotechnol., 14(2): 165-172, 2000.
35. Hayward, A.L., Oefner, P.J., Sabatini, S., Kainer, D.B., Hinojos, C.A., and Doris ,P.A., Modelling and analysis of competitive RT-PCR. Nucleic Acids Res., 26(11): 2511-2518, 1998.
36. Freeman, W.M., Vrana, S.L., and Vrana, K.E., Use of elevated reverse transcription reaction temperatures in RT-PCR. Biotechniques., 20(5): 782-783, 1996.
37. Raja, S., Luketich, J.D., Kelly, L.A., Ruff, D.W., and Godfrey, T.E., Increased sensitivity of one-tube, quantitative RT-PCR. Biotechniques, 29: 702-708, 2000.
38. Sugita, M., Haney, J.L., Gemmill, R.M., and Franklin, W.A., One-step duplex reverse transcription-polymerase chain reaction for quantitative assessment of rna degradation. Analytical Biochemistry, 295: 113-116, 2001.
39. Marten, N.W., Burke, E.J., Hayden, J.M., and Straus, D.S., Effect of amino acid limitation on the expression of 19 genes in rat hepatoma cells. FASEB J, 8: 538-544, 1994.
40. Foss, D.L., Baarsch, M.J., and Murtaugh, M.P., Regulation of hypoxanthine phosphoribosyl transferase, glyceraldehyde-3-phosphate dehydrogenase and beta-actin mRNA expression in porcine immune cells and tissues. Anim Biotechnol., 9: 67-78, 1998.
41. Thellin, O., Zorzi, W., Lakaye, B., De Borman, B., Coumans, B., Hennen, G., Grisar, T., Igout, A., and Heinen, E., Housekeeping genes as internal standards: use and limits. J Biotechnol., 75: 291-295, 1999.
42. Goidin, D., Mamessier, A., Staquet, M.J., Schmitt, D., and Berthier-Vergnes, O., Ribosomal 18S RNA prevails over glyceraldehyde-3-phosphate dehydrogenase and beta-actin genes as internal standard for quantitative comparison of mRNA levels in invasive and noninvasive human melanoma cell subpopulations. Anal Biochem., 295(1): 17-21, 2001.
43. Schmittgen, T.D., and Zakrajsek, B.A.., Effect of experimental treatment on housekeeping gene expression: validation by real-time, quantitative RT-PCR. J Biochem Biophys Methods., 46(1-2): 69-81, 2000.
44. Cha, R.S., Thilly, W.G., Specificity, efficiency, and fidelity of PCR. PCR Methods Appl. 3(3): 18-29, 1993.
45. Tichopad A, Dilger M, Schwarz G, Pfaffl MW: Standardised determination of real-time PCR efficiency from a single reaction setup. Nucl Acids Res 2003, vol 31 issue 20, pages e122.
46. Kainz, P., The PCR plateau phase - towards an understanding of its limitations. Biochim Biophys Acta., 1494: 23-27, 2000.
47. Pfaffl, M.W., Development and validation of an externally standardised quantitative Insulin like growth factor-1 (IGF-1) RT-PCR using LightCycler SYBR Green I technology. In: Meuer, S., Wittwer, C., and Nakagawara, K., eds. Rapid Cycle Real-time PCR, Methods and Applications Springer Press, Heidelberg, ISBN 3-540-66736-9, pp 281-191, 2001.
48. Wittwer, C.T., Ririe, K.M., Andrew, R.V., David, D.A., Gundry, R.A., and Balis U.J., The LightCycler: a microvolume multisample fluorimeter with rapid temperature control. BioTechniques, 22: 176-181, 1997.
49. Rasmussen, R., Quantification on the LightCycler. In: Meuer, S, Wittwer, C, and Nakagawara, K, eds. Rapid Cycle Real-time PCR, Methods and Applications Springer Press, Heidelberg;
A-Z of quantitative PCR (Editor: SA Bustin) Chapter3. Quantification strategies in real-time PCR 110
ISBN 3-540-66736-9, 21-34, 2001. 50. Tichopad A, Didier A, Pfaffl MW: Inhibition of real-time RT-PCR quantification due to tissue
specific contaminants. Molecular and Cellular Probes 2004 (18): 45-50. 51. Tichopad A, Dzidic A, Pfaffl MW: Improving quantitative real-time RT-PCR reproducibility by
boosting primer-linked amplification efficiency. Biotechn Lett 2003, 24: 2053-2056. 52. Foy, C.A., and Parkes, H.C., Emerging Homogeneous DNA-based Technologies in the Clinical
Laboratory. Clinical Chemistry., 47: 990-1000, 2001. 53. Pfaffl, M., Meyer, H.H.D., and Sauerwein, H., Quantification of insulin-like growth factor-1 (IGF-
1) mRNA: development and validation of an internally standardised competitive reverse transcription-polymerase chain reaction. Exp Clin Endocrinol Diabetes., 106(6): 506-513, 1998.
54. Reischl, U., and Kochanowski, B., Quantitative PCR. A survey of the present technology. Mol Biotechnol., 3(1): 55-71, 1995.
55. Ferre, F., Quantitative or semi-quantitative PCR: reality versus myth. PCR Methods Appl., 2(1): 1-9, 1992.
56. Pfaffl, M.W., Georgieva, T.M., Georgiev, I.P., Ontsouka, E., Hageleit, M., and Blum, J.W., Real-time RT-PCR quantification of insulin-like growth factor (IGF)-1, IGF-1 receptor, IGF-2, IGF-2 receptor, insulin receptor, growth hormone receptor, IGF-binding proteins 1, 2 and 3 in the bovine species. Domest Anim Endocrinol., 22(2): 91-102, 2002.
57. Ginzinger, D.G., Gene quantification using real-time quantitative PCR: an emerging technology hits the mainstream. Exp Hematol., 30(6): 503-512, 2002.
58. Morrison, T.B., Weis, J.J., and Wittwer, C.T., Quantification of low-copy transcripts by continuous SYBR Green I monitoring during amplification. Biotechniques., 24(6): 954-962, 1998.
59. Wittwer, C.T., Herrmann, M.G., Gundry, C.N., and Elenitoba-Johnson, K.S., Real-time multiplex PCR assays. Methods., 25(4): 430-42, 2001.
60. Holland, P.M., Abramson, R.D., Watson, R., and Gelfand, D.H., Detection of specific polymerase chain reaction product by utilizing the 5'-3' exonuclease activity of Thermus aquaticus DNA polymerase. Proc Natl Acad Sci U S A, 88(16): 7276-7280, 1991.
61. Livak, K.J., ABI Prism 7700 Sequence detection System User Bulletin #2 Relative quantification of gene expression; 1997 & 2001. http://docs.appliedbiosystems.com/pebiodocs/04303859.pdf
62. Förster, V.T., Zwischenmolekulare Energiewanderung und Fluorescence. Annals of Physics, Leipzig, 1948.
63. Lakowicz, J.R., Energy transfer. In: Principles of Fluorescent Spectroscopy, New York: Plenum Press, pp. 303-339, 1983.
64. LightCycler Software ®, Version 3.5; Roche Molecular Biochemicals, 2001. 65. LightCycler Relative Quantification Software, Version 1.0, Roche Molecular Biochemicals, 2001. 66. Nitsche, A., Steuer, N., Schmidt, C.A., Landt, O., and Siegert, W., Different real-time PCR
formats compared for the quantitative detection of human cytomegalovirus DNA. Clin Chem., 45(11): 1932-1937, 1999.
67. Souaze, F., Ntodou-Thome, A., Tran, C.Y., Rostene, W., and Forgez, P., Quantitative RT-PCR: limits and accuracy. Biotechniques., 21(2): 280-285, 1996.
68. Pfaffl, MW., A new mathematical model for relative quantification in real-time RT-PCR. Nucleic Acids Res., 29 (9): e45 2001.
69. Pfaffl, M.W., Horgan, G.W., and Dempfle, L., Relative expression software tool (REST) for group-wise comparison and statistical analysis of relative expression results in real-time PCR. Nucleic Acids Res., 30(9): e36, 2002.
70. Livak, K.J., and Schmittgen, T.D., Analysis of relative gene expression data using real-time quantitative PCR and the 2^[-delta delta C(T)] Method. Methods., 25(4): 402-408, 2001.
71. Pfaffl, M.W., Lange, I.G., Daxenberger, A., and Meyer, H.H.D., Tissue-specific expression pattern of estrogen receptors (ER): quantification of ER alpha and ER beta mRNA with real-time RT-PCR. APMIS., 109(5): 345-355, 2001.
72. Fronhoffs, S., Totzke, G., Stier, S., Wernert, N., Rothe, M., Bruning, T., Koch, B., Sachinidis, A., Vetter, H., and Ko, Y., A method for the rapid construction of cRNA standard curves in quantitative real-time reverse transcription polymerase chain reaction. Mol Cell Probes., 16(2): 99-110, 2002.
73. Zimmermann, K., and Mannhalter, JW., Technical aspects of quantitative competitive PCR. Biotechniques., 21(2): 268-279, 1996.
74. Meijerink, J., Mandigers, C., van de Locht, L., Tonnissen, E., Goodsaid, F., and Raemaekers, J., A novel method to compensate for different amplification efficiencies between patient DNA samples in quantitative real-time PCR. J Mol Diagn., 3(2): 55-61, 2001.
75. Soong, R., Ruschoff, J., and Tabiti, K., Detection of colorectal micrometastasis by quantitative RT-PCR of cytokeratin 20 mRNA. Roche Molecular Biochemicals internal Publication, 2000.
A-Z of quantitative PCR (Editor: SA Bustin) Chapter3. Quantification strategies in real-time PCR 111
76. Peccoud, J., and Jacob, C., Theoretical uncertainty of measurements using quantitative polymerase chain reaction. Biophys J., 71(1): 101-108, 1996.
77. Liu, W., and Saint, D.A., Validation of a quantitative method for real time PCR kinetics. Biochem Biophys Res Commun., 294(2): 347-353, 2002.
78. Liu, W., and Saint, D.A., A new quantitative method of real time reverse transcription polymerase chain reaction assay based on simulation of polymerase chain reaction kinetics. Anal Biochem., 302(1): 52-59, 2002
79. Muller, P.Y., Janovjak, H., Miserez, A.R., and Dobbie, Z., Processing of gene expression data generated by quantitative real-time RT-PCR. Biotechniques, 32(6): 1372-1378, 2002.
80. Bhatia, P., Taylor, W.R., Greenberg, A.H., and Wright, J.A., Comparison of glyceraldehyde-3-phosphate dehydrogenase and 28S-ribosomal RNA gene expression as RNA loading controls for northern blot analysis of cell lines of varying malignant potential. Anal Biochem., 216: 223-226, 1994.
81. Bereta, J., and Bereta, M., Stimulation of glyceraldehyde-3-phosphate dehydrogenase mRNA levels by endogenous nitric oxide in cytokine-activated endothelium. Biochem Biophys Res Commun.; 217: 363-369, 1995.
82. Chang, T.J., Juan, C.C., Yin, P.H., Chi, C.W., and Tsay, H.J., Up-regulation of beta-actin, cyclophilin and GAPDH in N1S1 rat hepatoma. Oncol Rep., 5: 469-471, 1998.
83. Zhang, J., and Snyder, S.H., Nitric oxide stimulates auto-ADP-ribosylation of glyceraldehydes 3 phosphate dehydrogenase. PNAS, 89: 9382-9385, 1992.
84. Jung, R., Soondrum, K., Neumaier, M., Quantitative PCR. Clin Chem Lab Med., 38(9): 833-836, 2000.
85. Gentle, A., Anastasopoulos, F., and McBrien, N.A., High-resolution semi-quantitative real-time PCR without the use of a standard curve. Biotechniques., 31(3): 502-508, 2001.
86. Das, S., Mohapatra, S.C., and Hsu, J.C., Studies on primer-dimer formation in polymerase chain reaction (PCR). Biotechnology Techniques, 13(10): 643-646, 1999.
87. Ririe, K.M., Rasmussen, R.P., and Wittwer, C.T., Product differentiation by analysis of DNA melting curves during the polymerase chain reaction. Anal Biochem., 245(2): 154-160, 1997.
88. Vandesompele, J., De Paepe, A., and Speleman, F., Elimination of Primer-Dimer Artifacts and Genomic Coamplification Using a Two-Step SYBR Green I Real-Time RT-PCR. Anal Biochem., 303(1): 95-98, 2002.
89. Brownie, J., Shawcross, S., Theaker, J., Whitcombe, D., Ferrie, R., Newton, C., and Little, S., The elimination of primer-dimer accumulation in PCR. Nucleic Acids Res., 25(16): 3235-3241, 1997.
90. Sturzenbaum, S.R., Transfer RNA reduces the formation of primer artifacts during quantitative PCR. Biotechniques., 27(1): 50-52, 1999.
91. How to Reduce Primer Dimers in a LightCycler PCR, Roche Diagnostics Technical Note No.. 1, 1999.
92. Raeymaekers, L., Basic principles of quantitative PCR. Mol Biotechnol., 15(2): 115-122, 2000. 93. Chelly, J., Kaplan, J.C., Maire, P., Gautron, S., and Kahn, A., Transcription of the dystrophin
gene in human muscle and non-muscle tissue. Nature., 333(6176): 858-860, 1988. 94. Schnell, S., and Mendoza, C., Theoretical description of the polymerase chain reaction. J Theor
Biol., 188(3): 313-318, 1997. 95. Karge, W.H., Schaefer, E.J., and Ordovas J.M., Quantification of mRNA by polymerase chain
reaction (PCR) using an internal standard and a non-radioactive detection method. Methods Mol Biol, 110: 43-61, 1998.
96. Zhong, H., and Simons, J.W., Direct comparison of GAPDH, beta-actin, cyclophilin, and 28S rRNA as internal standards for quantifying RNA levels under hypoxia. Biochem Biophys Res Commun., 259(3): 523-526, 1999.
97. Solanas, M., Moral, R., and Escrich, E., Unsuitability of using ribosomal RNA as loading control for Northern blot analyses related to the imbalance between messenger and ribosomal RNA content in rat mammary tumors. Anal Biochem., 288(1): 99-102, 2001.
98. Haberhausen, G., Pinsl, J., Kuhn, C.C., and Markert-Hahn C., Comparative study of different standardization concepts in quantitative competitive reverse transcription-PCR assays. J Clin Microbiol, 3: 628-633, 1988.
99. Zhu G, Chang Y, Zuo J, Dong X, Zhang M, Hu G, and Fang F., Fudenine, a C-terminal truncated rat homologue of mouse prominin, is blood glucose-regulated and can up-regulate the expression of GAPDH. Biochem Biophys Res Commun., 281(4): 951-956, 2001.
100. Inderwies T, Pfaffl MW, Meyer H.H.D, Bruckmaier RM: Detection and quantification of mRNA expression of α- and β-adrenergic receptor subtypes in the bovine mammary gland of dairy cows. Domestic Animal Endocrinology, 2003, (24):123-135.
A-Z of quantitative PCR (Editor: SA Bustin) Chapter3. Quantification strategies in real-time PCR 112
101. Reist M, Pfaffl MW, Morel C, Meylan M, Hirsbrunner G, Blum JW, Steiner A: Quantitative mRNA analysis of bovine 5-HT receptor subtypes in brain, abomasum, and intestine by real-time PCR. Journal of Receptors and Signal Transduction 23(4): 271-287.
102. Sheskin, D., Handbook of Parametric and Nonparametric Statistical Procedures. CRC Press LLC, Boca Raton, FL, 2000.
103. Manly, B., Randomization, Bootstrap and Monte Carlo Methods in Biology. Chapman & Hall, 1997.
104. Horgan, G.W., and Rouault, J., Introduction to randomization tests, Biomathematics and Statistics Scotland, 2000.
105. Pfaffl M.W., Tichopad A., Prgomet C., Neuvians T. P. Determination of stable housekeeping genes, differentially regulated target genes and sample integrity: BestKeeper – Excel-based tool using pair-wise correlations. Biotechnology Letters 26(6): 509-515.