quantification with proteome discoverer 1 with proteome discoverer bernard delanghe overview: which...
TRANSCRIPT

Quantification with Proteome DiscovererBernard Delanghe

Overview: Which approach to use?Quantification Method What When to use
Proteome DiscovererQuantification Method What When to useMetabolic labeling SILAC Cell culture systems
Small changes (10-50%)P tid l b li Di th l ti TMT Ti t iPeptide labeling Dimethylation, TMT,
iTRAQTissue proteinsMultiplexing (time courses)Moderate changes (20-200%))
Label free using detector response
Extracted Ion chromatograms, area calculation
Many largely similar experimentsModerate changes (20-200%)
Label free using spectral counting
Number of spectra per protein
Many highly similar experimentsL h (>100%)Large changes (>100%)
Single or Multiple Reaction Monitoring (SMR or MRM)
Absolutequantification, spiked with standards
Complex biological matrix(Serum)
2
with standards (AQUA)
PinPoint

Proteomics and Quantification
3

New feature for Proteome Discoverer 1.2
• Fast, Easy and automated Stable Isotope Precursor Ion Quantification• Exploits the capabilities of high-resolution MS with precursor ion-based
quantification
100k resolution1. Classical SILAC with heavy Arginene and Lysine2. SILAC with heavy Isoleucine3. Peptides labeled with light, medium, and heavy dimethyl4. Others like O16/O18, ICAT, ICPL5. Doublets or Triplets6. Using any enzymeg y y7. Any fragmentation technique (or a combinartion):CID, HCD, ETD, ECD8. Any search engine (or a combinartion : Mascot, Sequest or Zcore
4

Preconfigured workflows
Complete automation thru XcaliburComplete automation thru Xcaliburand Discoverer Daemon
5

Why are reliable and sensitive algorithms needed?
Jesper_SILAC_HeLa #6382 RT: 45.42 AV: 1 NL: 8.44E6F: FTMS + p NSI Full ms [350.00-1800.00]
90
95
100388.25610
Where are the SILAC pairs?
65
70
75
80
85
90 Where are the SILAC pairs?
45
50
55
60
65
elat
ive
Abu
ndan
ce
20
25
30
35
40Re
• Zoom -in
400 500 600 700 800 900 1000 1100 1200 1300 1400 1500 1600 1700 18000
5
10
15
571.28833514.79395
429.09048
856.41388717.35846 1202.27087 1403.652341003.24561 1738.042971611.30396
6
m/z

Why are reliable and sensitive algorithms needed?
Jesper_SILAC_HeLa #6382 RT: 45.42 AV: 1 NL: 8.44E6F: FTMS + p NSI Full ms [350.00-1800.00]
16
17
Where are the SILAC pairs?
12
13
14
15
16
408.71713
Where are the SILAC pairs?
8
9
10
11
12
ativ
e A
bund
ance
4
5
6
7Rel
571.28833
635.31781553 76978
• Zoom -in
350 400 450 500 550 600 650 700 750 800 850 900 9500
1
2
3 514.79395429.09048
553.76978
466.26569856.41388717.35846
593.36768816.42786658.33838 914.43488737.35095
993.68835
7
m/z

Why are reliable and sensitive algorithms needed?
Jesper_SILAC_HeLa #6382 RT: 45.42 AV: 1 NL: 2.76E6F: FTMS + p NSI Full ms [350.00-1800.00]
16
17
Where are the SILAC pairs?
12
13
14
15
16 Where are the SILAC pairs?
8
9
10
11
12
ativ
e A
bund
ance
4
5
6
7Rel
• Zoom -in
358 359 360 361 362 363 364 365 366 367 368 369 370 371 3720
1
2
3 359.54297367.23563
369.21545363.22928359.87726362.23062 367.73743361.14905 369.71750365.20734363.73093359.22189 366.69992 368.23752
8
m/z

Why are reliable and sensitive algorithms needed?
Jesper_SILAC_HeLa #6382 RT: 45.42 AV: 1 NL: 7.74E4F: FTMS + p NSI Full ms [350.00-1800.00]
90
95
100359.54297
Where are the SILAC pairs?
70
75
80
85
90 367.23563
• Here
Where are the SILAC pairs?
45
50
55
60
65
ativ
e A
bund
ance
369.21545359 87726
20
25
30
35
40Rel 363.22928359.87726
362.23062
367.73743
361.14905360.21176
369 71750
359 360 361 362 363 364 365 366 367 368 369 3700
5
10
15
20 369.71750365.20734363.73093
365.71732370.21140366.69992
368.23752361.71088 364.17877
9
m/z

Result in Proteome Discoverer
10

Why are reliable and sensitive algorithms needed?
Jesper_SILAC_HeLa #6382 RT: 45.42 AV: 1 NL: 7.74E4F: FTMS + p NSI Full ms [350.00-1800.00]
90
95
100359.54297
70
75
80
85
90 367.23563
45
50
55
60
65
ativ
e A
bund
ance
369.21545359 87726
20
25
30
35
40Rel 363.22928359.87726
362.23062
367.73743
361.14905360.21176
369 71750
• And here
359 360 361 362 363 364 365 366 367 368 369 3700
5
10
15
20 369.71750365.20734363.73093
365.71732370.21140366.69992
368.23752361.71088 364.17877
11
m/z

Result in Proteome Discoverer
12
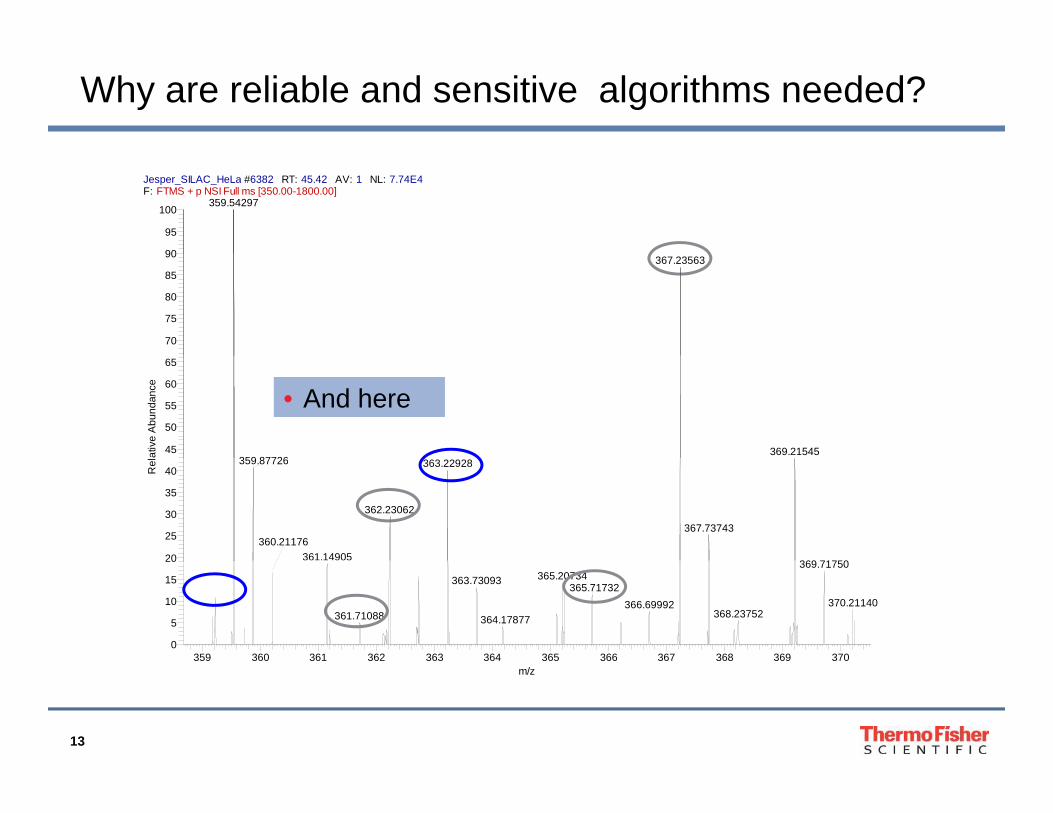
Why are reliable and sensitive algorithms needed?
Jesper_SILAC_HeLa #6382 RT: 45.42 AV: 1 NL: 7.74E4F: FTMS + p NSI Full ms [350.00-1800.00]
90
95
100359.54297
70
75
80
85
90 367.23563
45
50
55
60
65
ativ
e A
bund
ance
369.21545359 87726
• And here
20
25
30
35
40Rel 363.22928359.87726
362.23062
367.73743
361.14905360.21176
369 71750
359 360 361 362 363 364 365 366 367 368 369 3700
5
10
15
20 369.71750365.20734363.73093
365.71732370.21140366.69992
368.23752361.71088 364.17877
13
m/z

Result in Proteome Discoverer
14

Why are reliable and sensitive algorithms needed?
Jesper_SILAC_HeLa #6382 RT: 45.42 AV: 1 NL: 7.74E4F: FTMS + p NSI Full ms [350.00-1800.00]
90
95
100359.54297
Including the low abundant
70
75
80
85
90 367.23563Including the low abundant peptides and proteins
Peptide intensity about 4000 counts
45
50
55
60
65
ativ
e A
bund
ance
369.21545359 87726
Peptide intensity about 4000 counts
20
25
30
35
40Rel 363.22928359.87726
362.23062
367.73743
361.14905360.21176
369 71750
359 360 361 362 363 364 365 366 367 368 369 3700
5
10
15
20 369.71750365.20734363.73093
365.71732370.21140366.69992
368.23752361.71088 364.17877
15
m/z

Precursor Quan: How Does It Work?
EventDetection
PeptideIdentification
Isotope PatternDetection
Isotope PatternProtein Inference / Isotope PatternMultiplet Detection
Peptide
Protein Inference /Protein Grouping
Peptide Quantification
PeptideUniqueRedundantPeptide
Classification
Protein
RedundantNot Uniqueetc.
16
Quantification

Event Detection
Traditional TIC Chromatogram
Create XIC for every peak in every scan
Keep XICs with shape of eluting component
Event Chromatogram
Event Chromatogram
Peak-detection on every „good“ XIC
Event Chromatogram
Create an „event“ for each good“ XICeach „good XIC• Mass• Intensity• Area
RT
17
• RT• Etc.

Precursor Quan: Quan Result Display
18

Precursor Quan: Validation
HeLa Digest(Arg10, Lys8)
MixtureL : H = 1 : 3
Proteome Discoverer: Peptides at 1% FDRLog2 based
Count % Median Mean * 68% IntervalUnique 1182 56.18 2.31 2.35 1.25 1.84 - 2.90
Processing Time [min]Proteome Discoverer
Mascot Search 10Event Detection 6Quantification 2
Redundant 681 32.37 2.27 2.28 1.19 1.91 - 2.70Not Unique 50 2.38 2.23 2.16 1.19 1.87 - 2.65
Peptides with Single Peak ChannelsUnique 83 3.94 2.59 2.52 1.89 1.37 - 4.90
Redundant 17 0.81 2.93 3.10 1.34 2.19 - 3.93Not Unique 0 0 00 Total 18Not Unique 0 0.00
Indistinguishable Channels 3 0.14Inconsistently Labeled 7 0.33
Excluded by Method 53 2.52No Quan Values 28 1.33
Total 2104
19
Quantified 2013 95.67Not Quantifiable 63 2.99No Quan Values 28 1.33

Precursor Quan: Validation
HeLa Digest(Arg10, Lys6)
MixtureL : H = 1 : 10 >4 orders of magnitude
Proteome Discoverer: Peptides at 1% FDRLog2 based
Count % Median Mean * 68% IntervalUnique 422 31.14 8.51 8.49 1.58 5.37 - 13.49
Redundant 133 9.82 8.44 8.72 1.43 5.91 - 12.03edu da t 33 9 8 8 8 3 5 9 03Not Unique 46 3.39 8.32 8.15 1.29 6.44 - 10.76
Peptides with Single Peak ChannelsUnique 180 13.28 9.83 8.60 2.57 3.83 - 25.23
Redundant 8 0.59 9.75 11.99 1.81 5.39 - 17.64Not Unique 15 1.11 10.93 7.98 2.62
I di ti i h bl
Processing Time [min]Proteome Discoverer
Mascot Search 8Event Detection 1Quantification 1Indistinguishable
Channels 2 0.15Inconsistently Labeled 4 0.30
Excluded by Method 391 28.86No Quan Values 154 11.37
Total 1355
Quantification 1Total 10
20
Quantified 804 59.34Not Quantifiable 397 29.30No Quan Values 154 11.37
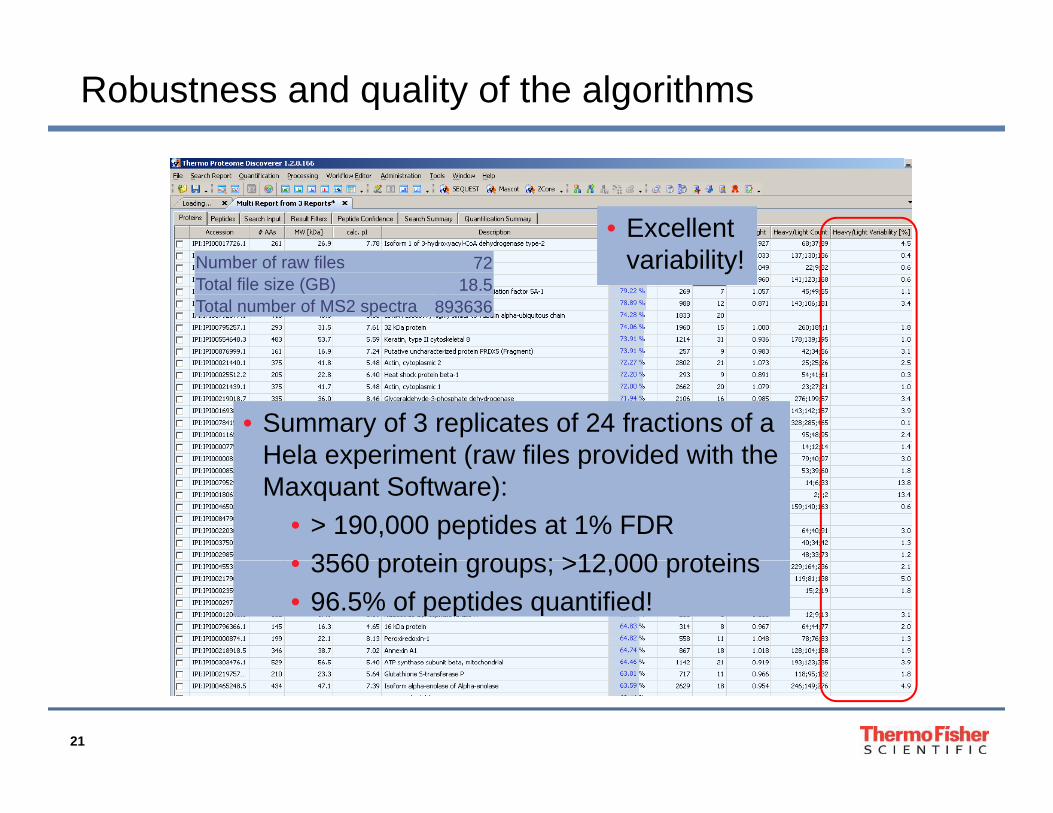
Robustness and quality of the algorithms
• Excellent i bilit !variability!Number of raw files 72
Total file size (GB) 18.5Total number of MS2 spectra 893636
• Summary of 3 replicates of 24 fractions of a Hela experiment (raw files provided with theHela experiment (raw files provided with the Maxquant Software):
• > 190,000 peptides at 1% FDR• 3560 protein groups; >12 000 proteins• 3560 protein groups; >12,000 proteins• 96.5% of peptides quantified!
21

Complete SILAC Quantitation Workflow
®• Pierce® SILAC Quantitation Kits[500 ml media (2x), 50 ml dialyzed FBS (2x) and 50 mg of 13C6 L-lysine (1x), L-lysine (1x), L-arginine (2x)]
• RPMI 1640 kit, #89982• DMEM kit, #89983• Human Mesenchymal Stem Cell Kit #88200• Mouse Embryonic Stem Cell Kit
#88206
• LTQ Orbitrap Velos• Proteome Discoverer 1.2
22
Comprehensive Quantitative Proteomics enabled by simultaneous MS and MS/MS

Precursor Quan: Workflow for Unlabeled Peptides
• Precursor Ions Quantifier node has area calculation included
• Can be used in conjunction with Reporter Ions Quantifier node
23

Spectral CountingSpectral Counting
Bernard Delanghe

Definition
• The total number of identified peptide sequences (peptide spectrum matches) for the protein, including those redundantly identified.
• Standard feature in Proteome Discoverer
25

Protein Area Calculation
• Alternative method in Proteome Discoverer: Protein area calculation
• Average of the 3 highest peptide areaspeptide areas
• Same algorithms as for Precursor Ion Quantification
• Standard workflow• Standard workflow
26

Comparison of different quantification methods
• LTQ Orbitrap Velos raw file, SILAC labeled (Lys 8, Arg 10) HELA cells• Fixed Heavy Light ratio 3/1• 686 proteins identified (peptides at 1% FDR)
• Quantification methods• SILAC: Heavy/Light ratio • Area: Protein Area Heavy labeled peptide\ Protein Area Light labeled
peptide (area calculated as average of the 3 highest peptide areas)• Spectral Counting
SILAC Area Spectral CountingMedian 2.3 2.1 1.4Average 2.4 2.2 1.6SD 0.7 1.6 1.2% Quantified Proteins 82% 54% 51%
27

Distribution of Protein Heavy/Light ratios
10.000
12.000
Top 100 Proteins
8.000
tio
Spectral counting as well as Peak area Is unreliable at lower protein abundance
6.000
Heavy/Light Rat
SILAC Heavy/Light
Area Heavy/Light
SC Heavy/Light
2.000
4.000
Spectral counting is underestimating the ratios
0.000
0.000E0 5.000E7 1.000E8 1.500E8Area Light
28

Conclusion
• Proteome Discoverer has fast, robust, sensitive and reliable algorithms for Precursor based quantification.
• The workflow can be completely automated.
• Protein Area calculation method is clearly better than the spectral counting method.
• Thermo Fisher Scientific offers a complete workflow: from reagents to results.
29