quantitative analysis for management
DESCRIPTION
Quantitative Analysis for Management. Chapter 4 Decision Trees. Chapter Outline. 4.1 Introduction 4.2 Decision Trees 4.3 How Probability Values Are Estimated by Bayesian Analysis. Learning Objectives. Students will be able to: Develop accurate and useful decision trees - PowerPoint PPT PresentationTRANSCRIPT

To accompany Quantitative Analysis for Management, 7e by (Render/Stair
4-1 © 2000 by Prentice Hall, Inc., Upper Saddle River, N.J. 07458
Quantitative Analysis Quantitative Analysis for Managementfor Management
Chapter 4Chapter 4Decision Trees Decision Trees
To accompany Quantitative Analysis for Management, 7e by (Render/Stair
4-2 © 2000 by Prentice Hall, Inc., Upper Saddle River, N.J. 07458
Chapter OutlineChapter Outline4.1 Introduction
4.2 Decision Trees
4.3 How Probability Values Are Estimated by Bayesian Analysis
To accompany Quantitative Analysis for Management, 7e by (Render/Stair
4-3 © 2000 by Prentice Hall, Inc., Upper Saddle River, N.J. 07458
Learning ObjectivesLearning ObjectivesStudents will be able to:
Develop accurate and useful decision treesRevise probability estimates using Bayesian
Analysis
To accompany Quantitative Analysis for Management, 7e by (Render/Stair
4-4 © 2000 by Prentice Hall, Inc., Upper Saddle River, N.J. 07458
IntroductionIntroductionDecision treesDecision trees enable one to look at
decisions: with many alternativesalternatives and states of states of
naturenature which must be made in sequence
To accompany Quantitative Analysis for Management, 7e by (Render/Stair
4-5 © 2000 by Prentice Hall, Inc., Upper Saddle River, N.J. 07458
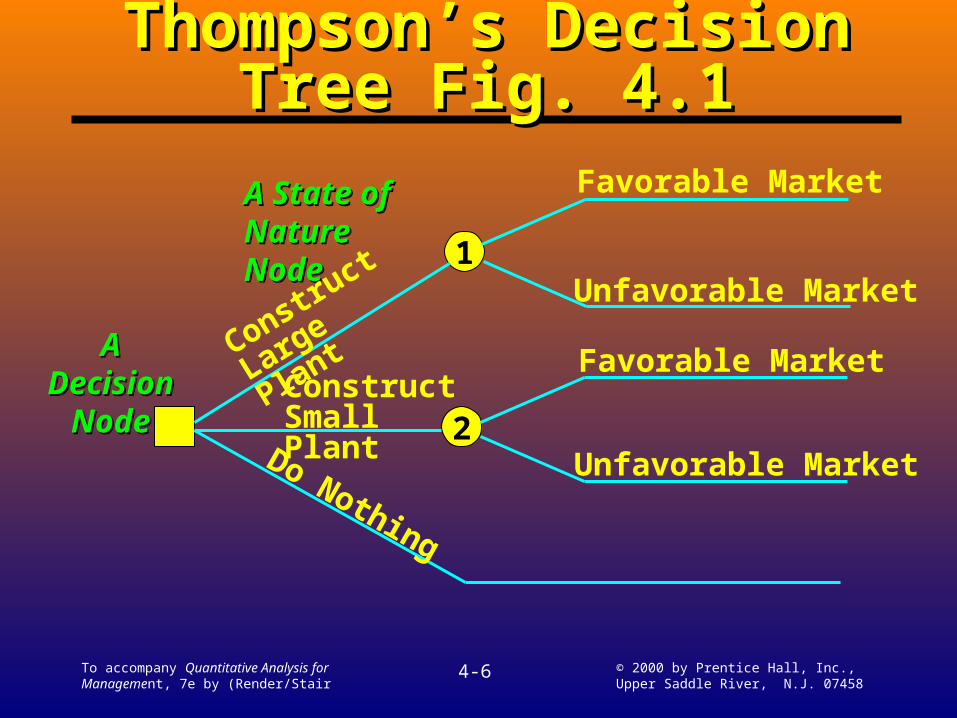
Decision TreesDecision TreesA graphical representation where:
a decision node from which one of several alternatives may be chosen
a state-of-nature node out of which one state of nature will occur
To accompany Quantitative Analysis for Management, 7e by (Render/Stair
4-6 © 2000 by Prentice Hall, Inc., Upper Saddle River, N.J. 07458
Thompson’s Decision Tree Thompson’s Decision Tree Fig. 4.1Fig. 4.1
1
2
A Decision A Decision NodeNode
A State of A State of Nature NodeNature Node
Favorable Market
Unfavorable Market
Favorable Market
Unfavorable Market
Construct
Large Plant
Construct Small PlantDo Nothing
To accompany Quantitative Analysis for Management, 7e by (Render/Stair
4-7 © 2000 by Prentice Hall, Inc., Upper Saddle River, N.J. 07458
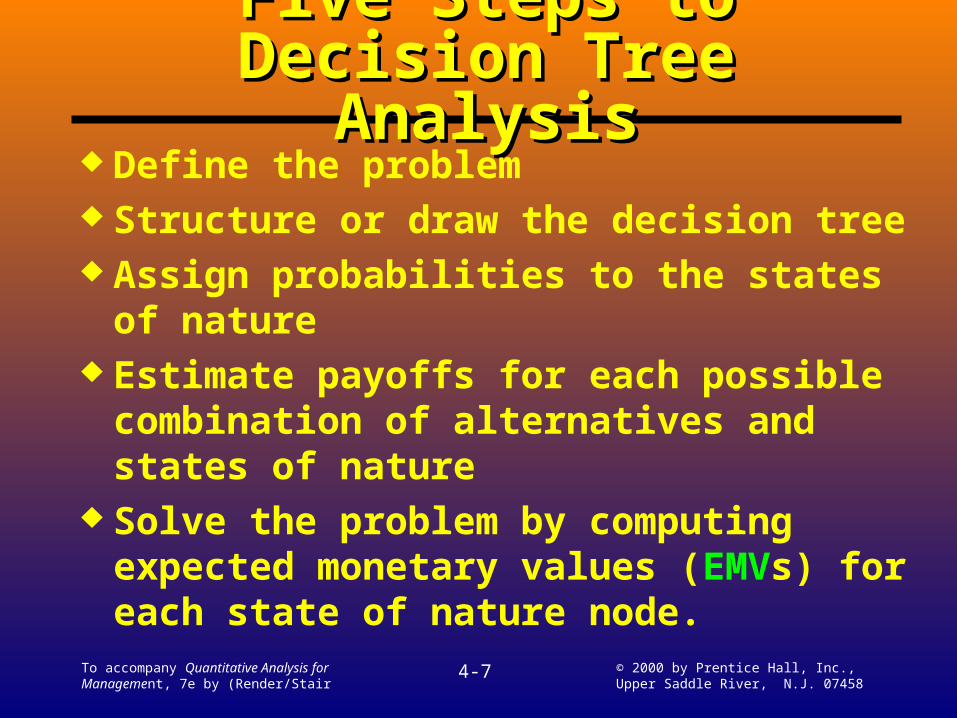
Five Steps toFive Steps toDecision Tree AnalysisDecision Tree Analysis
Define the problem Structure or draw the decision tree Assign probabilities to the states of nature Estimate payoffs for each possible
combination of alternatives and states of nature
Solve the problem by computing expected monetary values (EMVs) for each state of nature node.

To accompany Quantitative Analysis for Management, 7e by (Render/Stair
4-8 © 2000 by Prentice Hall, Inc., Upper Saddle River, N.J. 07458
Thompson’s Decision Tree Thompson’s Decision Tree Fig. 4.2Fig. 4.2
1
2
A Decision A Decision NodeNode
A State of A State of Nature NodeNature Node Favorable (0.5)
Market
Unfavorable (0.5) MarketFavorable (0.5) Market
Unfavorable (0.5) Market
Construct
Large Plant
Construct Small PlantDo Nothing
$200,000$200,000
-$180,000-$180,000
$100,000$100,000
-$20,000-$20,000
00
EMV EMV =$40,000=$40,000
EMVEMV=$10,000=$10,000
To accompany Quantitative Analysis for Management, 7e by (Render/Stair
4-9 © 2000 by Prentice Hall, Inc., Upper Saddle River, N.J. 07458
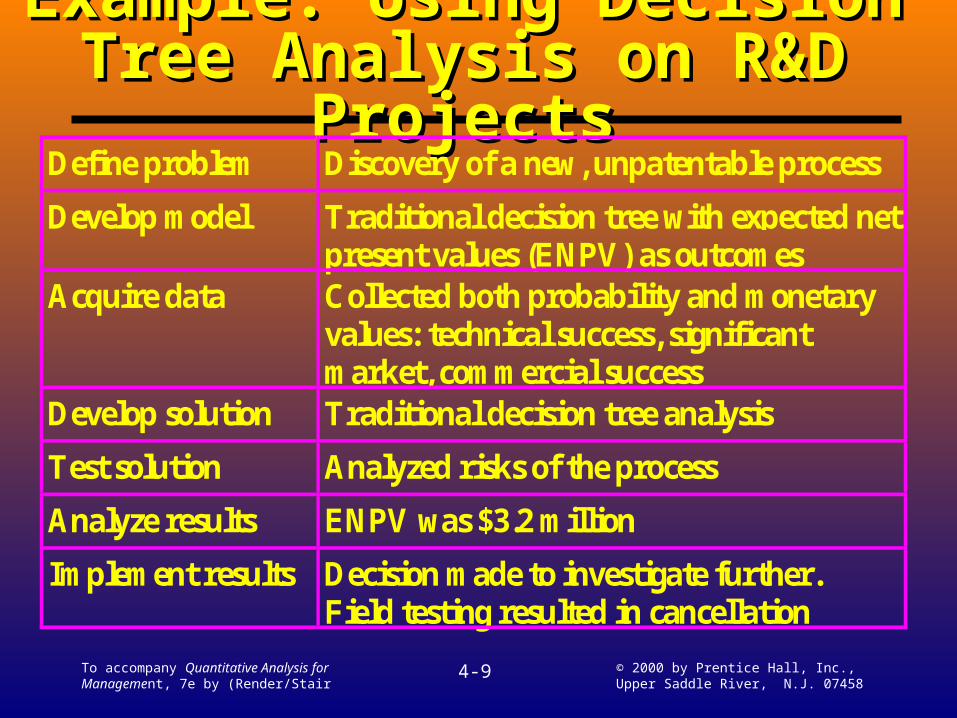
Example: Using Decision Tree Example: Using Decision Tree Analysis on R&D ProjectsAnalysis on R&D Projects
Define problem Discovery of a new, unpatentable processDevelop model Traditional decision tree with expected net
present values (ENPV) as outcomesAcquire data Collected both probability and monetary
values: technical success, significantmarket, commercial success
Develop solution Traditional decision tree analysisTest solution Analyzed risks of the processAnalyze results ENPV was $3.2 millionImplement results Decision made to investigate further.
Field testing resulted in cancellation

To accompany Quantitative Analysis for Management, 7e by (Render/Stair
4-10 © 2000 by Prentice Hall, Inc., Upper Saddle River, N.J. 07458
Thompson’s Decision TreeThompson’s Decision TreeFig. 4.3Fig. 4.3
To accompany Quantitative Analysis for Management, 7e by (Render/Stair
4-11 © 2000 by Prentice Hall, Inc., Upper Saddle River, N.J. 07458
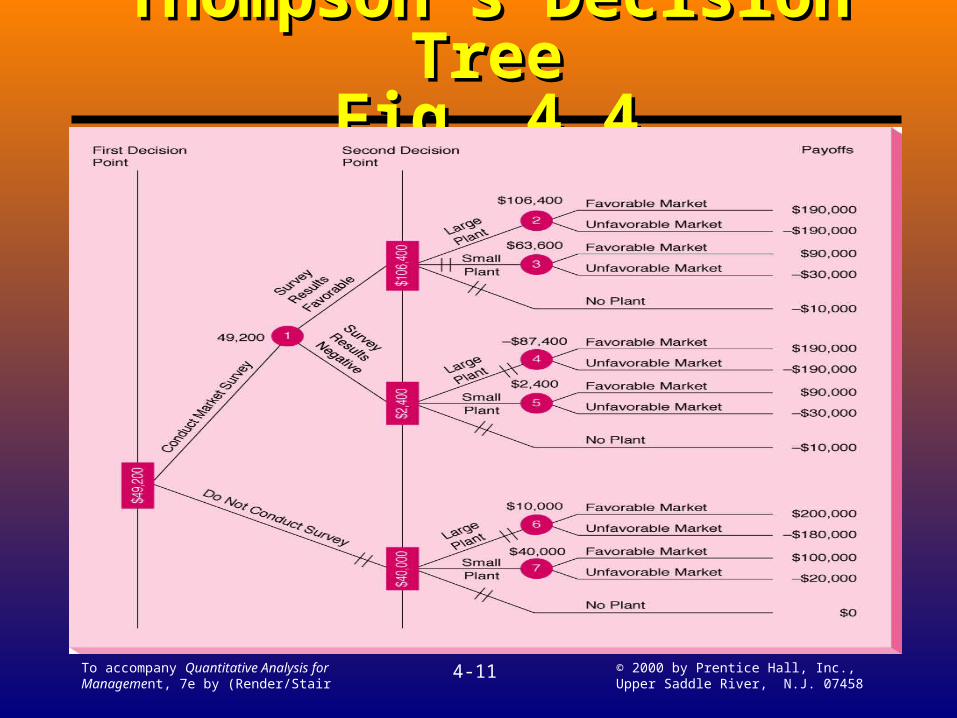
Thompson’s Decision TreeThompson’s Decision TreeFig. 4.4Fig. 4.4
To accompany Quantitative Analysis for Management, 7e by (Render/Stair
4-12 © 2000 by Prentice Hall, Inc., Upper Saddle River, N.J. 07458
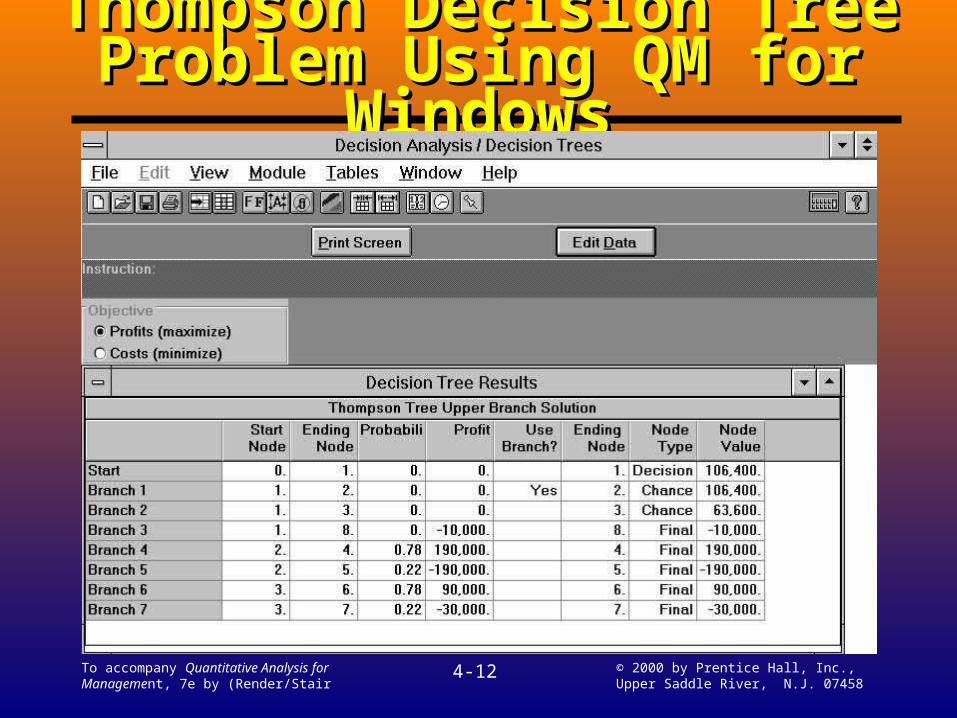
Thompson Decision Tree Problem Thompson Decision Tree Problem Using QM for WindowsUsing QM for Windows
To accompany Quantitative Analysis for Management, 7e by (Render/Stair
4-13 © 2000 by Prentice Hall, Inc., Upper Saddle River, N.J. 07458
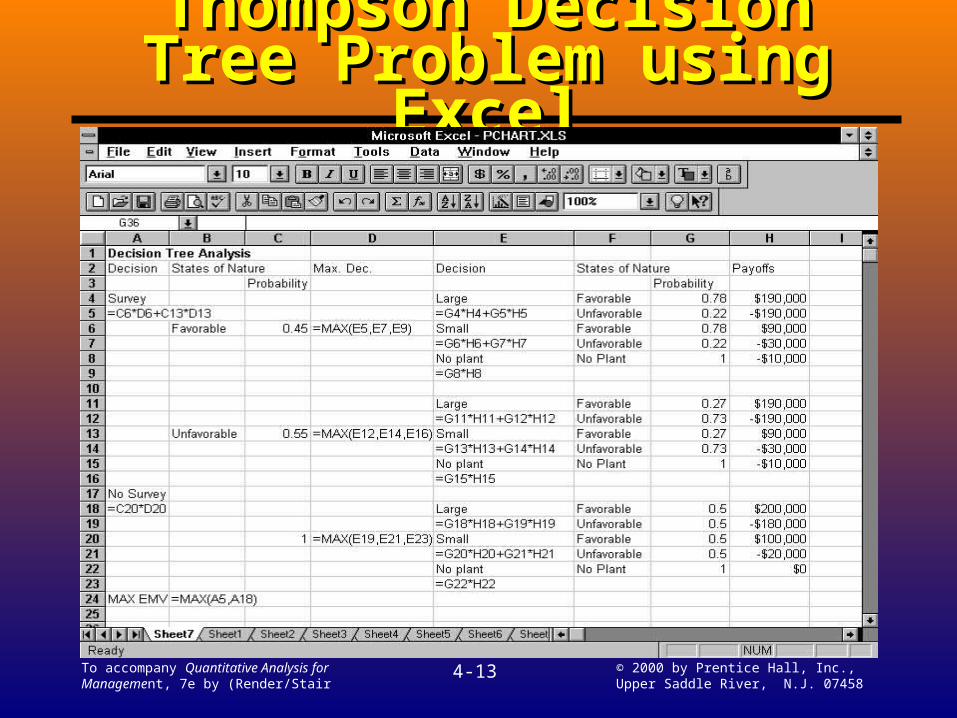
Thompson Decision Tree Thompson Decision Tree Problem using ExcelProblem using Excel

To accompany Quantitative Analysis for Management, 7e by (Render/Stair
4-14 © 2000 by Prentice Hall, Inc., Upper Saddle River, N.J. 07458
Expected Value of Sample Expected Value of Sample InformationInformation
Expected value of best decision withwith sample information, assuming no cost to gather it
Expected value of best decision withoutwithout sample information
EVSIEVSI =
To accompany Quantitative Analysis for Management, 7e by (Render/Stair
4-15 © 2000 by Prentice Hall, Inc., Upper Saddle River, N.J. 07458
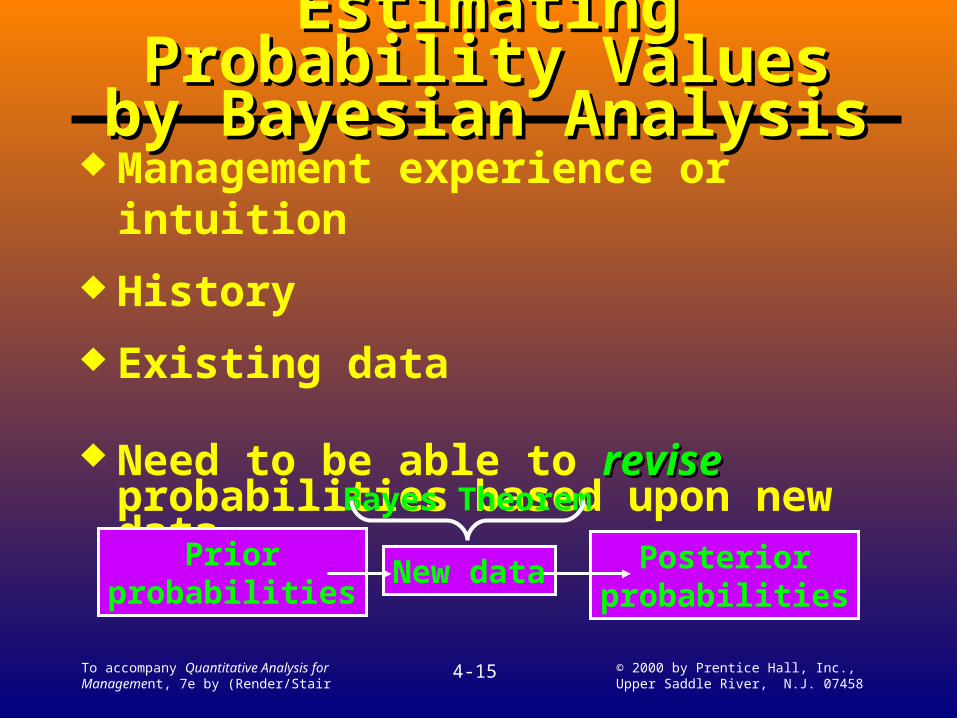
Estimating Probability Estimating Probability Values by Bayesian AnalysisValues by Bayesian Analysis
Management experience or intuition History Existing data
Need to be able to reviserevise probabilities based upon new data
Priorprobabilities New data Posterior
probabilities
Bayes Theorem
To accompany Quantitative Analysis for Management, 7e by (Render/Stair
4-16 © 2000 by Prentice Hall, Inc., Upper Saddle River, N.J. 07458
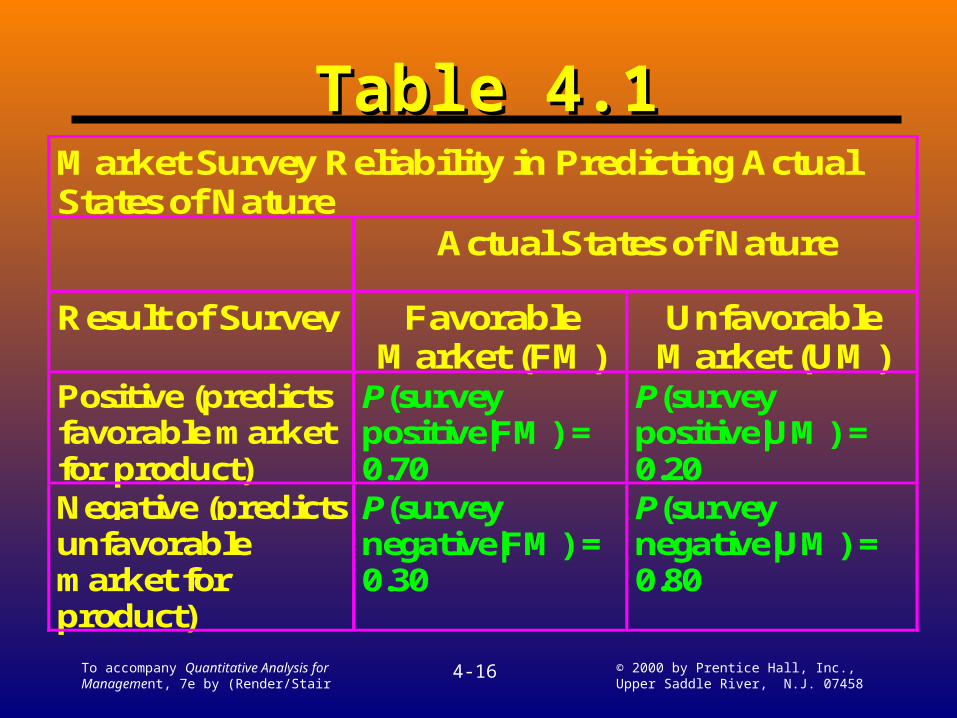
Table 4.1Table 4.1Market Survey Reliability in Predicting ActualStates of Nature
Actual States of Nature
Result of Survey FavorableMarket (FM)
UnfavorableMarket (UM)
Positive (predictsfavorable marketfor product)
P(surveypositive|FM) =0.70
P(surveypositive|UM) =0.20
Negative (predictsunfavorablemarket forproduct)
P(surveynegative|FM) =0.30
P(surveynegative|UM) =0.80
To accompany Quantitative Analysis for Management, 7e by (Render/Stair
4-17 © 2000 by Prentice Hall, Inc., Upper Saddle River, N.J. 07458
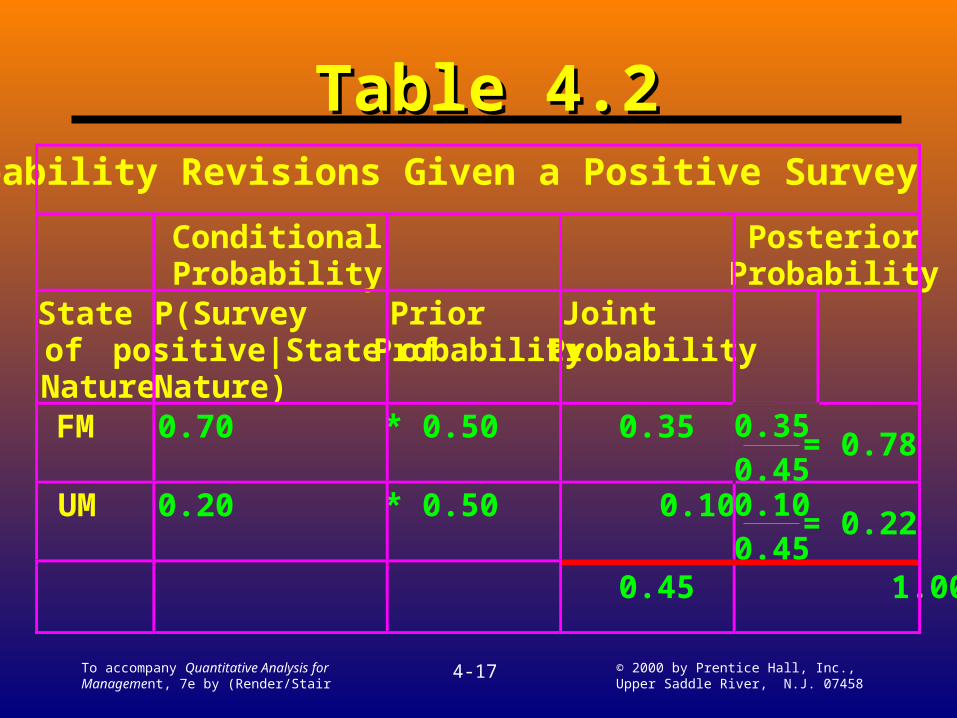
Table 4.2Table 4.2Probability Revisions Given a Positive Survey
ConditionalProbability
PosteriorProbability
StateofNature
P(Surveypositive|State ofNature)
PriorProbability
JointProbability
FM 0.70 * 0.50 0.350.450.35 = 0.78
UM 0.20 * 0.500.450.10 0.10 = 0.22
0.45 1.00
To accompany Quantitative Analysis for Management, 7e by (Render/Stair
4-18 © 2000 by Prentice Hall, Inc., Upper Saddle River, N.J. 07458
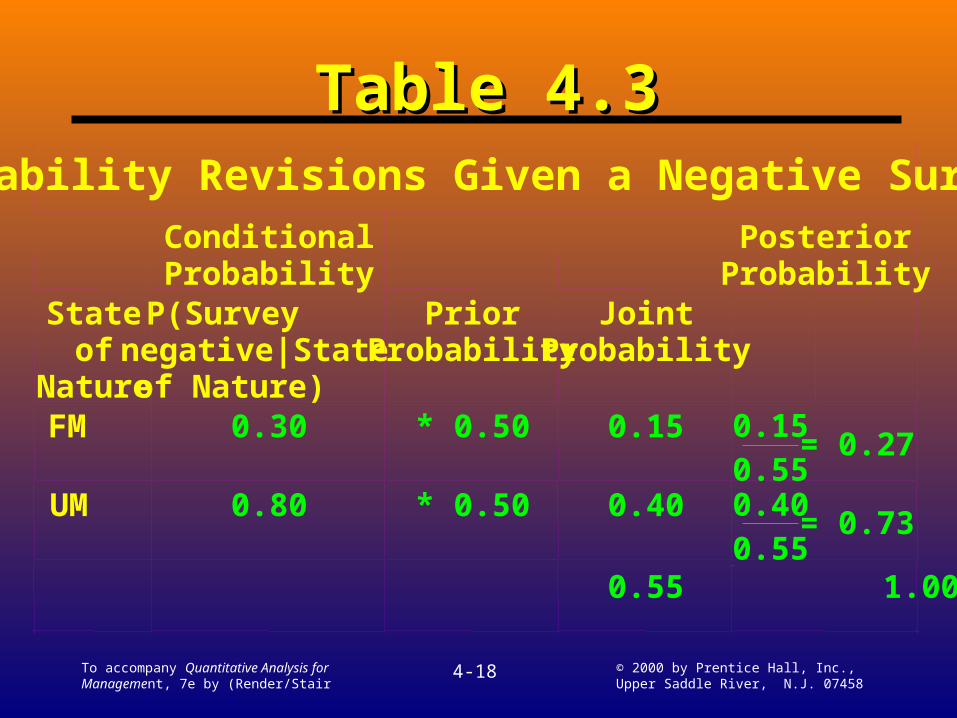
Table 4.3Table 4.3Probability Revisions Given a Negative Survey
ConditionalProbability
PosteriorProbability
Stateof
Nature
P(Surveynegative|Stateof Nature)
PriorProbability
JointProbability
FM 0.30 * 0.50 0.150.550.15 = 0.27
UM 0.80 * 0.50 0.400.550.40 = 0.73
0.55 1.00