quantitative assessment of liquefaction potential in ... papers/giannakogiorgos... · quantitative...
TRANSCRIPT
6th International Conference on Earthquake Geotechnical Engineering 1-4 November 2015 Christchurch, New Zealand
Quantitative Assessment of Liquefaction Potential in Selected Areas in
Christchurch, New Zealand
A. Giannakogiorgos1, G. Papathanassiou2, E. Vautherin3
ABSTRACT The objective of this paper is to present the combined liquefaction case histories data from the
2010 – 2011 Canterbury earthquake sequence (CES) and the Emilia – Romagna region (Northern Italy) 2012 earthquake, on the recently proposed Liquefaction Potential Index (LPI) - Liquefaction Severity Index (LSN) classification chart. The revised LPI-LSN chart classes I, II and IV, are in reasonable agreement with the distribution of cases from Christchurch area and can be used for the initial site characterization.
Introduction
Over the last decade there is a well-established necessity for compiling liquefaction-based microzonation maps in order to understand liquefaction-induced hazard and manage the associated risk of foundation and structural damage. The quantitative assessment of the liquefaction potential has to be assessed on a site-by-site basis instead of the individual identification of each soil layer’s factor of safety against liquefaction, if the purpose is to produce liquefaction hazard maps. The performance of the individual soil layers encountered at a site cannot be captured with the use of a Geographic Information System (GIS) and used for the hazard maps, therefore the use of potential indexes is a well-established alternative. One of the most widely used is the Liquefaction Potential Index (LPI) proposed by Iwasaki et al. (1978), where discrete threshold LPI values for the evaluation of the severity of liquefaction-induced damage were proposed. According to Iwasaki et al. (1978), the liquefaction potential should be characterized as “low” at sites where 0<LPI<5, “high” for LPI values in the range of 5 – 15 and “very high” for LPI values greater than 15. Several researchers (Toprak and Holzer, 2003; Sonmez, 2003) concluded that the Iwasaki proposed values are in agreement with their observations, research and analysis, while studies following the severe earthquakes in Kocaelli – Izmit (Turkey) and Chi-Chi (Taiwan), both 1999 events, concluded that threshold values should be revised. In particluar, Lee et al. (2004) and Papathanassiou (2008) proposed a value of 13 and 14 respectively, to be the boundary between the occurrence and non-occurrence of liquefaction surface manifestation and induced ground “disturbance”. Recently, Green et al. (2014) highlighted the importance of having consistency in the way threshold LPI values are determined and how the LPI values are estimated to assess liquefaction hazard.
1Associate Geotechnical Engineer, Coffey Geotechnics (NZ) Ltd, Christchurch, New Zealand, [email protected] 2Dr, Dept. of Geology, Aristotle University of Thessaloniki, Greece, [email protected] 3Geotechnical Engineer, Coffey Geotechnics (NZ) Ltd, Christchurch, New Zealand, [email protected]
Following the 2010 – 2011 Canterbury earthquake series (CES, Christchurch – New Zealand) which affected the city of Christchurch and the Canterbury region causing widespread liquefaction, lateral spreading and ground settlement, a new parameter, Liquefaction Severity Number (LSN) developed by Tonkin & Taylor (2013), has been proposed. The new parameter was developed following an attempt to better understand the effects of liquefaction on residential sites (mostly timber framed single storey houses) within the affected area. The LSN parameter could be considered as an extension of the LPI philosophy and represents an alternative method for assessing the response of structures to liquefaction, following comprehensive research. The LSN parameter, due to its depth weighting by a hyperbolic function (1/z) rather than a linear or less depth-biased weighting, gives much greater weight to liquefaction at shallow depths. As a result, LSN introduces greater importance on the thickness of the non-liquefiable crust when the groundwater table is close to the ground surface; and as a consequence it is heavily influenced by the “accuracy” of estimating the groundwater table during past or future earthquake events. The LSN is higher for liquefying soils closer to the ground surface in comparison to liquefying layers at depth. Tonkin and Taylor (2013) developed and proposed the first classification using the LSN associating; 'little to no expression of liquefaction, minor effects' with 0 < LSN <10; 'minor expression of liquefaction, some sand boils' with 10 < LSN < 20; 'moderate expression of liquefaction, with sand boils and some structural damage' with 20
< LSN < 30; 'moderate to severe expression of liquefaction, settlement can cause structural damage'
with 30 < LSN < 40; 'major expression of liquefaction, undulations and damage to ground surface, severe total
and differential settlement of structures' with 40 < LSN < 50; 'severe damage, extensive evidence of liquefaction at surface, severe total and differential
settlements affecting structures, damage to services' for LSN ≥ 50 It is normal practice to estimate and use one parameter to assess the liquefaction vulnerability potential. However, as per the recently published article by Papathanassiou et al. (2015), where both LPI and LSN used within the epicentral area of the Emilia-Romagna 2014 earthquake, their use revealed a more useful future “tool” for delineating sites likely to liquefy. In particluar, it was shown that the combination of these values could be used for discriminating the tendency of different geological/geotechnical subsoil conditions to generate, or not, liquefaction surface manifestations. Based on the observed field evidence of liquefaction-induced phenomena at ground surface and considering the combinations of LPI - LSN values, four classes were initially proposed: ‘almost no liquefaction effects are observed on ground surface’ (class-I), ‘few liquefaction effects are observed on ground surface’ (class-II), ‘effects of liquefaction are likely observed on ground surface’ (class-III) and ‘effects of liquefaction are very likely observed on ground surface’ (class-IV). The objective of this paper is to present the combined liquefaction case histories data from the 2010 – 2011 Canterbury earthquake sequence (CES) and the Emilia – Romagna region (Northern Italy) 2012 earthquake, on the proposed LPI - LSN classification chart.
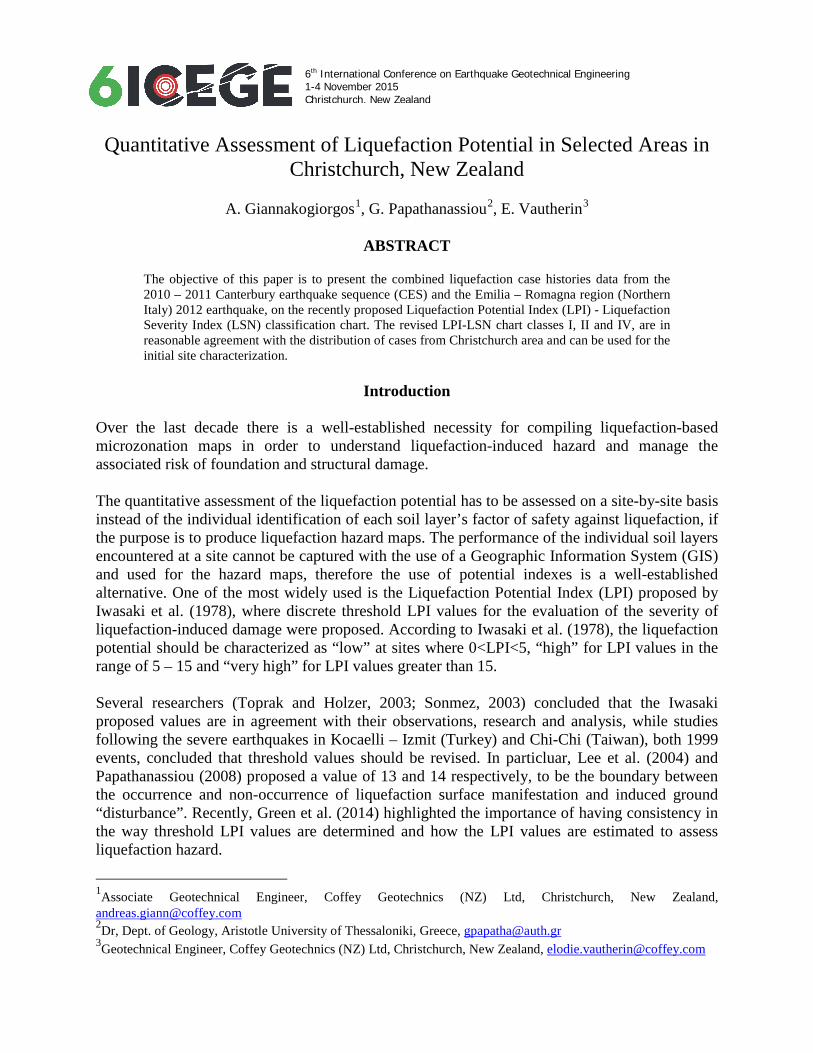
Database – Summary of Case Histories The 2010 – 2011 Canterbury earthquake sequence began with the 4 September 2010 Darfield earthquake (Mw=7.1) with several reported liquefaction occurrences. The Christchurch 22 February 2011 (Mw=6.2) earthquake, the second major event, triggered extensive liquefaction-induced damage and lateral spreading close to streams and rivers with significant damage to structures and facilities (Figure 1).
Figure 1. Liquefaction and lateral spreading, following the 22 February 2011 Christchurch earthquake (from Canterbury Geotechnical Database CGD)
As shown in Figure 1, widespread liquefaction was induced during the Christchurch earthquake. 31 Cone Penetration Test (CPT) case histories were selected for the detailed analyses in the vicinity of existing strong motion stations within the area. At every CPT location, “readings” from the existing GIS layers in the Canterbury Geotechnical Database (GCD) were extracted including the event specific groundwater table (GNS Science), the peak ground acceleration (Bradley & Hughes 2012), and ground surface observations regarding liquefaction occurrence which have been used in our analysis (Figure 2; liquefaction surface manifestation). Moreover, the 25 high-quality CPT liquefaction case histories used by Green et al (2014), were included in our analysis as a second data set.
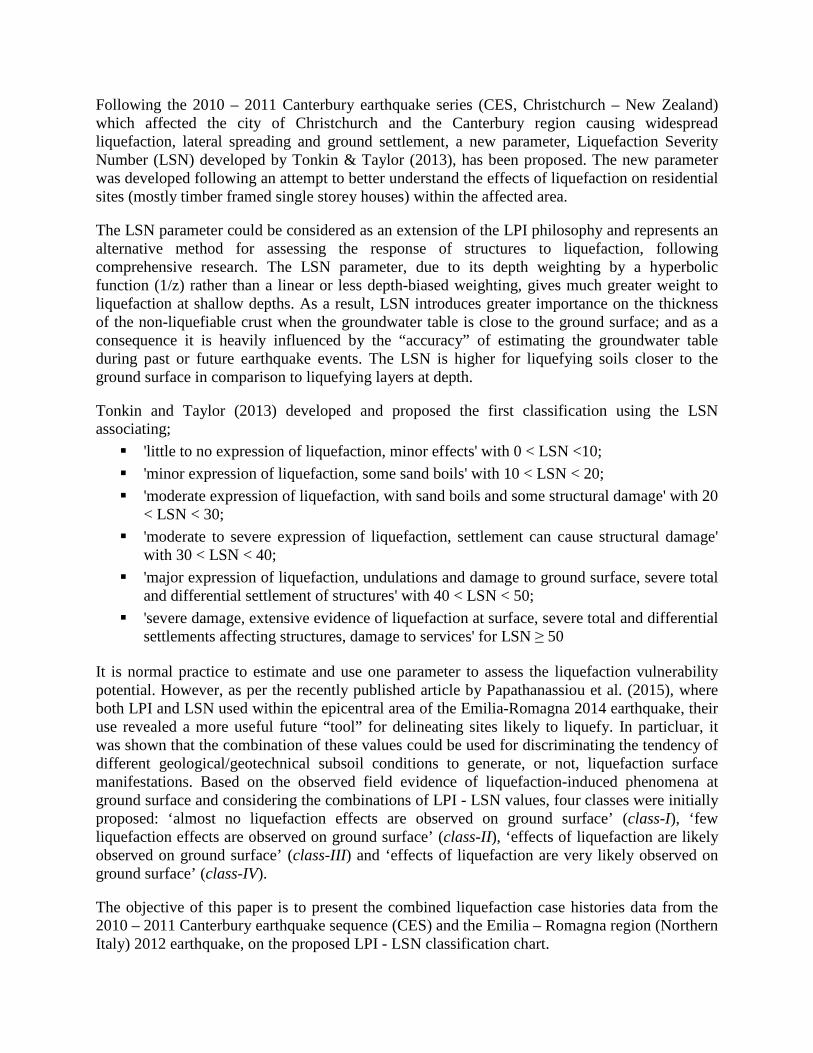
The selected CPTs are primarily located in 6 general areas within the Christchurch’ central business district (CBD), south-west and north respectively, within the suburb of Shirley, in the area of Linwood, around Pages Road, North New Brighton and North and South Kaiapoi.
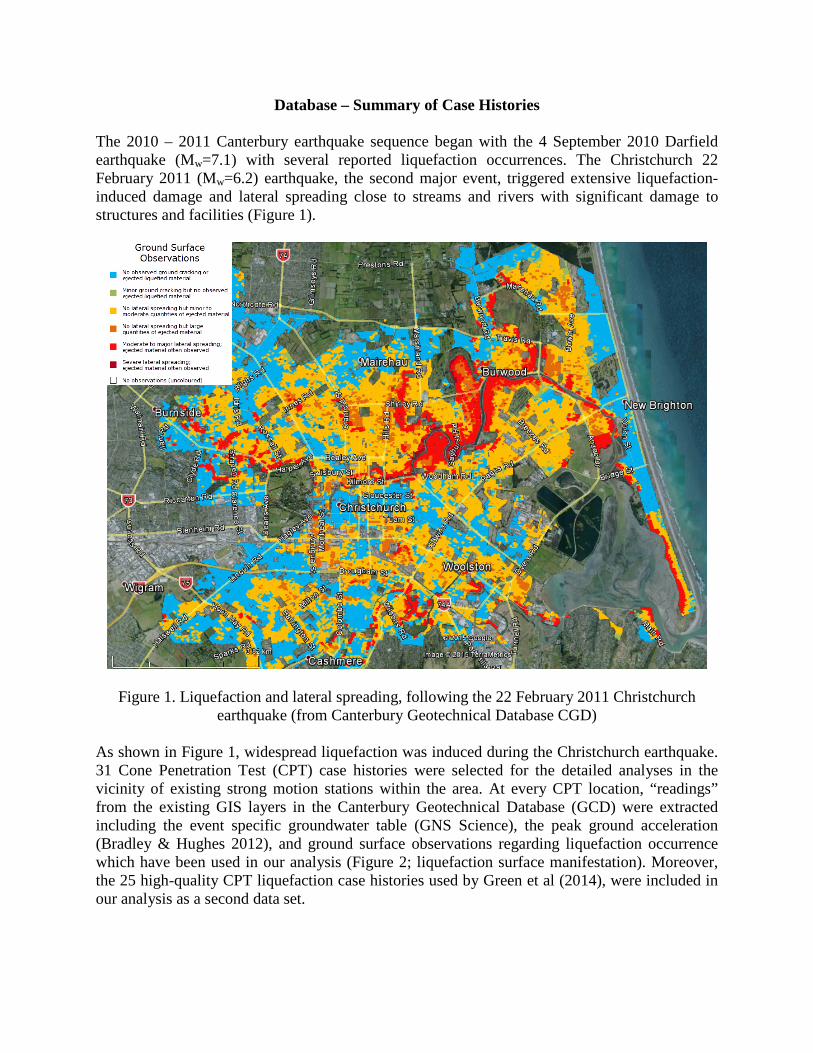
Figure 2. Liquefaction surface manifestation, 22 February 2011 Christchurch earthquake Regarding the data collected after the Emilia earthquake, it is pointed out by Papathanassiou et al. (2015) that only test sites with clear positive or negative evidence of liquefaction-induced ground disruption were selected (Figure 3). In summary, a total of 60 in-situ tests were used of which 23 were undertaken in 'liquefied' zones and 37 in 'non-liquefied' zones, and LPI - LSN per site were evaluated using the Idriss and Boulanger (2008) triggering method. The groundwater level was obtained during the site investigation while the seismic loading was evaluated following the Bindi et al. (2011) ground motion probability equation (GMPE). This procedure was preferred among several similar empirical relations due to i) it is specifically based on the Italian strong motion database ITACA (http://itaca.mi.ingv.it); ii) it takes into account the nature of faulting and iii) it is certainly the most up to date for Italy.
Figure 3. Liquefaction phenomena documented in the area of San Carlo
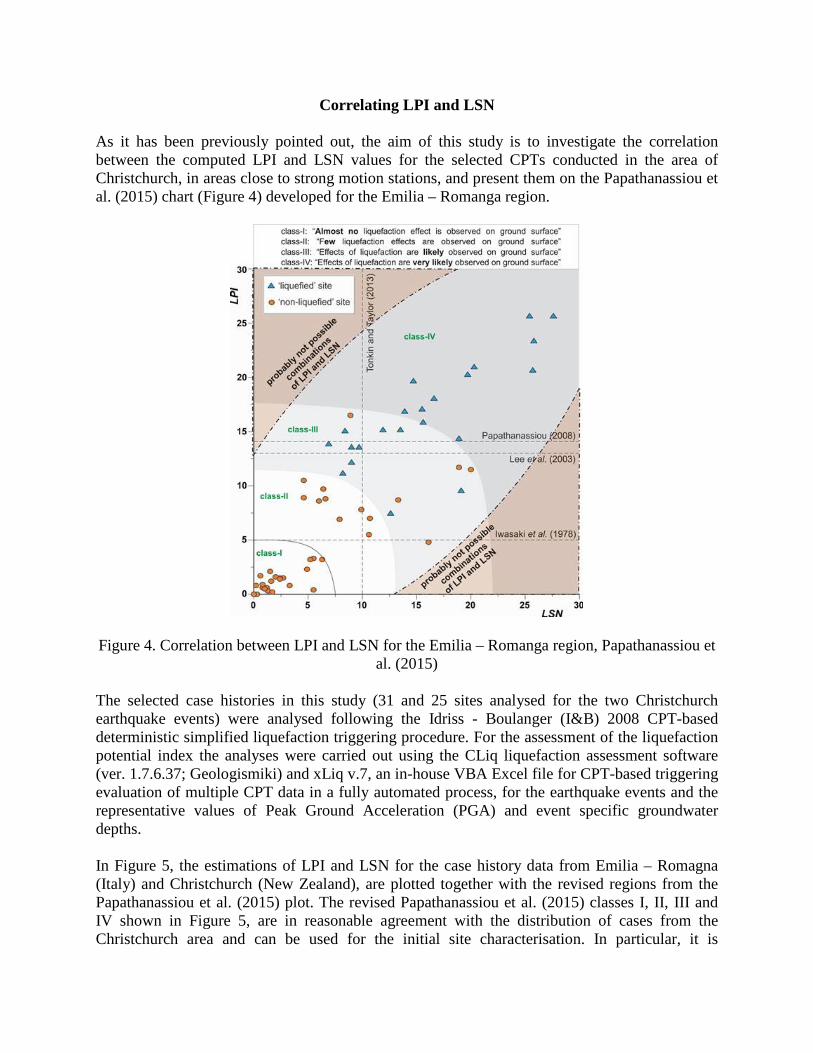
Correlating LPI and LSN As it has been previously pointed out, the aim of this study is to investigate the correlation between the computed LPI and LSN values for the selected CPTs conducted in the area of Christchurch, in areas close to strong motion stations, and present them on the Papathanassiou et al. (2015) chart (Figure 4) developed for the Emilia – Romanga region.
Figure 4. Correlation between LPI and LSN for the Emilia – Romanga region, Papathanassiou et
al. (2015) The selected case histories in this study (31 and 25 sites analysed for the two Christchurch earthquake events) were analysed following the Idriss - Boulanger (I&B) 2008 CPT-based deterministic simplified liquefaction triggering procedure. For the assessment of the liquefaction potential index the analyses were carried out using the CLiq liquefaction assessment software (ver. 1.7.6.37; Geologismiki) and xLiq v.7, an in-house VBA Excel file for CPT-based triggering evaluation of multiple CPT data in a fully automated process, for the earthquake events and the representative values of Peak Ground Acceleration (PGA) and event specific groundwater depths. In Figure 5, the estimations of LPI and LSN for the case history data from Emilia – Romagna (Italy) and Christchurch (New Zealand), are plotted together with the revised regions from the Papathanassiou et al. (2015) plot. The revised Papathanassiou et al. (2015) classes I, II, III and IV shown in Figure 5, are in reasonable agreement with the distribution of cases from the Christchurch area and can be used for the initial site characterisation. In particular, it is
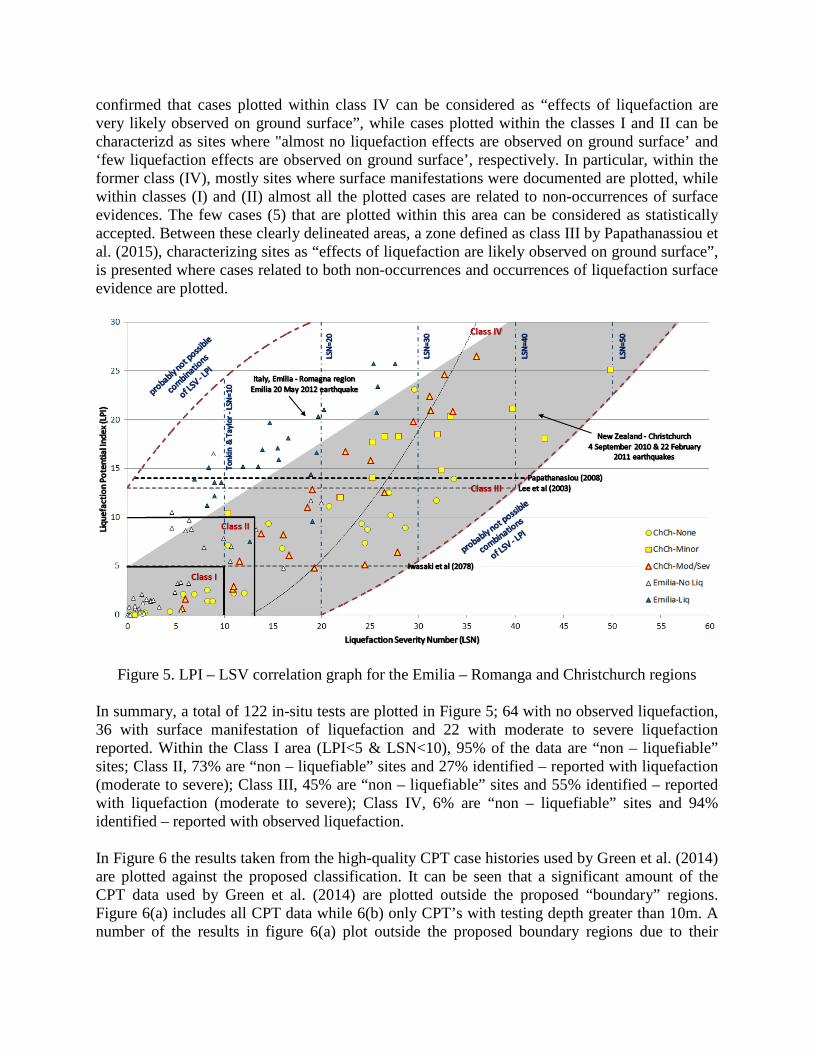
confirmed that cases plotted within class IV can be considered as “effects of liquefaction are very likely observed on ground surface”, while cases plotted within the classes I and II can be characterizd as sites where "almost no liquefaction effects are observed on ground surface’ and ‘few liquefaction effects are observed on ground surface’, respectively. In particular, within the former class (IV), mostly sites where surface manifestations were documented are plotted, while within classes (I) and (II) almost all the plotted cases are related to non-occurrences of surface evidences. The few cases (5) that are plotted within this area can be considered as statistically accepted. Between these clearly delineated areas, a zone defined as class III by Papathanassiou et al. (2015), characterizing sites as “effects of liquefaction are likely observed on ground surface”, is presented where cases related to both non-occurrences and occurrences of liquefaction surface evidence are plotted.
Figure 5. LPI – LSV correlation graph for the Emilia – Romanga and Christchurch regions In summary, a total of 122 in-situ tests are plotted in Figure 5; 64 with no observed liquefaction, 36 with surface manifestation of liquefaction and 22 with moderate to severe liquefaction reported. Within the Class I area (LPI<5 & LSN<10), 95% of the data are “non – liquefiable” sites; Class II, 73% are “non – liquefiable” sites and 27% identified – reported with liquefaction (moderate to severe); Class III, 45% are “non – liquefiable” sites and 55% identified – reported with liquefaction (moderate to severe); Class IV, 6% are “non – liquefiable” sites and 94% identified – reported with observed liquefaction. In Figure 6 the results taken from the high-quality CPT case histories used by Green et al. (2014) are plotted against the proposed classification. It can be seen that a significant amount of the CPT data used by Green et al. (2014) are plotted outside the proposed “boundary” regions. Figure 6(a) includes all CPT data while 6(b) only CPT’s with testing depth greater than 10m. A number of the results in figure 6(a) plot outside the proposed boundary regions due to their
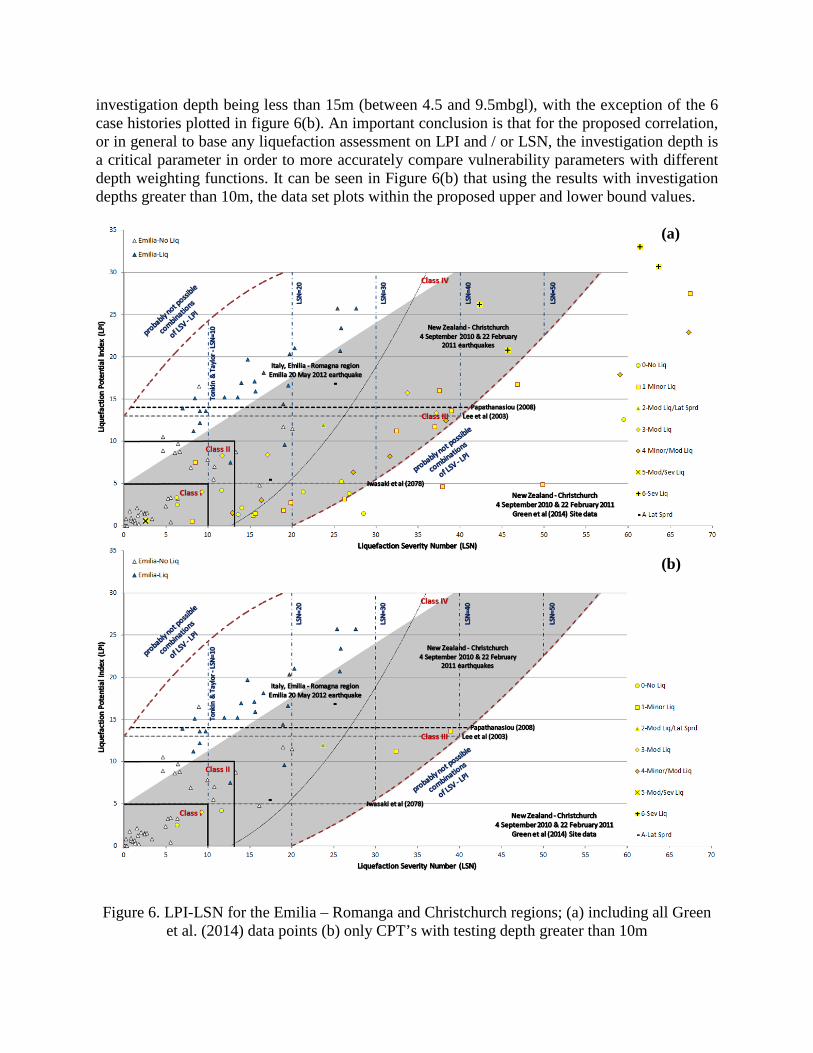
investigation depth being less than 15m (between 4.5 and 9.5mbgl), with the exception of the 6 case histories plotted in figure 6(b). An important conclusion is that for the proposed correlation, or in general to base any liquefaction assessment on LPI and / or LSN, the investigation depth is a critical parameter in order to more accurately compare vulnerability parameters with different depth weighting functions. It can be seen in Figure 6(b) that using the results with investigation depths greater than 10m, the data set plots within the proposed upper and lower bound values.
(a)
(b)
Figure 6. LPI-LSN for the Emilia – Romanga and Christchurch regions; (a) including all Green
et al. (2014) data points (b) only CPT’s with testing depth greater than 10m
Concluding Remarks The main goal of this study was the correlation of computed LPI and LSN values in a graph that could be used for the classification of a site regarding its susceptibility to liquefaction-induced effects at ground surface. In order to achieve this, the PLI and LSN were evaluated at selected sites where in-situ tests (CPT) were conducted after the Canterbury earthquakes. The selection of the sites was based on the reliability of post-earthquake documentation regarding the occurrence or not of liquefaction-induced ground disruption and on the proximity to an accelerograph in order to be able to directly use the recorded value of strong ground motion. As an outcome, it is shown that the occurrence or not of liquefaction-induced surface disruption for the majority of the tested cases could be confirmed by the proposed by Papathanassiou et al. (2015) chart. Thus, it seems that the tendency of different subsoil conditions to generate, or not, liquefaction surface manifestations can also be determined by the combination of the computed LPI and LSN values at one site.
References Bindi D., Pacor F., Luzi L., Puglia R., Massa M., Ameri G. and Paolucci R. (2011): Ground motion prediction equations derived from the Italian strong motion database. Bull. Earthquake Eng., 9, 1899-1930, doi: 10.1007/s10158-011-9313-z.
Bradley and Hughes (2012a & b) Conditional Peak Ground Accelerations in the Canterbury Earthquakes for Conventional Liquefaction Assessment, Part 1 and 2, Technical Report for the Ministry of Business, Innovation and Employment, April 2012. 22p.
Canterbury Geotechnical Database (2014) "Event Specific Groundwater Surface Elevations", Map Layer CGD0800 - 10 June 2014, retrieved [15/2/15] from https://canterburygeotechnicaldatabase.projectorbit.com/
Canterbury Geotechnical Database (2013) "Liquefaction and Lateral Spreading Observations", Map Layer CGD0300 - 11 Feb 2013, retrieved [15/2/15] from https://canterburygeotechnicaldatabase.projectorbit.com/
Canterbury Geotechnical Database (2013) "Conditional PGA for Liquefaction Assessment", Map Layer CGD5110 - 21 Feb 2013, retrieved [15/2/15] from https://canterburygeotechnicaldatabase.projectorbit.com/
Geologismiki Geotechnical Software, Cliq v1.7.6.34 – CPT Liquefaction Assessment Software
Green R.,Cubrinovski M., Cox B., Wood C., Wotherspoon L., Bradley B. and Maurer B. (2014):Select Liquefaction Case Histories from 2010 – 2011 Canterbury Earthquake Sequence. Earthquake Spectra, Volume 30, No 1,February 2014, EERI
Iwasaki T., Tatsuoka F., Tokia K.i. and Yasuda S. (1978): A practical method for assessing soil liquefaction potential based on case studies at various sites in Japan. 2nd Int. Conf. on Microzonation, San Francisco, Proceedings, 885-896.
Lee D.H., Ku C.S. and Yuan H. (2004): A study of the liquefaction risk potential at Yuanlin, Taiwan. Eng. Geol., 71(1-2), 97-117.
Papathanassiou G. (2008): LPI-based approach for calibrating the severity of liquefaction- induced failures and for assessing the probability of liquefaction surface evidence. Eng. Geol., 96, 94-104.
Papathanassiou, G., Mantovani A., Tarabusi, G., Rapti D., Caputo R. 2015. Assessment of liquefaction potential for two liquefaction prone areas considering the May 20, 2012 Emilia (Italy) earthquakeEngineering Geology 189 (2015) 1–16, http://dx.doi.org/10.1016/j.enggeo.2015.02.002
Sonmez H. (2003): Modification of the liquefaction potential index and liquefaction susceptibility mapping for a liquefaction-prone area (Inegol, Turkey). Environmental Geology 44(7), 862-871.
Tonkin and Taylor (2013): Canterbury Earthquakes 2010 and 2011. Land report as at 29 February 2012. 108 pp., Earthquake Commission (http://www.tonkin.co.nz/canterbury-land-information/docs/downloads2592013/T&T-
Stage-3-Report.pdf, last visited May 9, 2014).
Toprak S. and Holzer T.L. (2003): Liquefaction Potential Index: Field Assessment. J. Geotech. Geoenviron. Eng., 129(4), 315-322.
van Ballegooy S., Malan P., Lacrosse V., Jacka M.E., Cubrinovski M., Bray J.D., O'Rourke T.D., Crawford S.A. and Cowan H. (2014): Assessment of Liquefaction-Induced Land Damage for Residential Christchurch. Earthquake Spectra, 30(1), 31-55, doi: 10.1193/031813EQS070M.
xLiq, VBA Excel file for CPT-based triggering evaluation of multiple CPT data in a full automated process, xLiq v.7 2015, Giannakogiorgos A., Coffey Geotechnics (NZ) Ltd