quantitative capstone template - trinity washington web viewquantitative capstone template. ......
TRANSCRIPT

TITLE OF THE PAPERSUBTITLE OF THE PAPER
YOUR FULL NAME
SCHOOL OF BUSINESS AND GRADUATE STUDIES
TRINITY WASHINGTON UNIVERSITY
Submitted to (**Instructor title and name) on behalf of the faculty of the School of Business and Graduate Studies in partial fulfillment of the degree requirements for the (Full name of your ***degree program)
Semester Year

Abstract
150 to 250 words covering the Background, Objective, Research Design, Data Analysis, Results or Findings, Conclusions and Recommendations.
Keywords:
The author acknowledges she/he completed this assignment in the spirit of the Trinity Washington University policy regarding academic honesty and plagiarism.
Page 2 of 32
Quantitative capstone template

Table of Contents
Page
Introduction_________________________________________________________________6Statement of the Problem______________________________________________________6Objective_______________________________________________________________________6Research Questions____________________________________________________________6
Research question one___________________________________________________________6
Research question two___________________________________________________________7
Research Method_______________________________________________________________7Population______________________________________________________________________7Example________________________________________________________________________8Ethical Considerations__________________________________________________________8Research Design_______________________________________________________________9
Theory______________________________________________________________________9Theoretical Perspective_______________________________________________________10Theoretical Framework________________________________________________________10
Youth decide to not use synthetic Marijuana. - Dependent variable________________________10
Access - independent variable one_________________________________________________10
Price - independent variable two__________________________________________________10
Role models - independent variable three___________________________________________10
Peer pressure - independent variable four___________________________________________10
Moderating variables___________________________________________________________10
Analysis____________________________________________________________________11Sample_______________________________________________________________________11Example______________________________________________________________________11Example______________________________________________________________________12
Data Sets____________________________________________________________________12
Substance Abuse and Mental Health Services Administration data________________________13
Centers for Disease Control data__________________________________________________13
Data Analysis and Coding_____________________________________________________13Tests and measures____________________________________________________________13
Example______________________________________________________________________14Measures of association ________________________________________________________14
Analysis by research question____________________________________________________15
Page 3 of 32
Quantitative capstone template

Multiple regressions____________________________________________________________18
Discussion_________________________________________________________________19Research Questions___________________________________________________________20
Research question one__________________________________________________________20
Research question two__________________________________________________________20
Conclusions___________________________________________________________________20Recommendations____________________________________________________________21
Implications___________________________________________________________________21
Summary_____________________________________________________________________21
References_________________________________________________________________22Appendices________________________________________________________________24
Appendix A: Recruitment Materials____________________________________________24Appendix B: Informed Consent________________________________________________25Appendix C: Data Collection Instrument_______________________________________27
Page 4 of 32
Quantitative capstone template

List of Tables
Page
Table 1. Frequency: Year of birth.--------------------------------------------------------------------13Table 2. Frequency: Gender.---------------------------------------------------------------------------13Table 3. Frequency: Race.------------------------------------------------------------------------------13Table 4. Crosstabulations: Future as a volunteer.----------------------------------------------15Table 5. Correlations: Social media fundraising * How you would give.-----------------15Table 6. Independent sample group statistics for young alumni giving.----------------16Table 7. Independent samples t- tests for young alumni giving.---------------------------16Table 8. Cross tabulations: My future as a volunteer 2---------------------------------------17Table 9. Correlations: social media fundraising * How would you give 2----------------17Table 10. Independent sample group statistics for young alumni giving.---------------18Table 11. Independent samples t- tests for young alumni giving.-------------------------18Table 12. Model Summary BA-------------------------------------------------------------------------19Table 13. ANOVA BA--------------------------------------------------------------------------------------19Table 14. Coefficients BA-------------------------------------------------------------------------------19
List of Figures
Page
Figure 1. The theoretical model of teenagers who choose not to use synthetic marijuana.---------------------------------------------------------------------------------------------------12
Page 5 of 32
Quantitative capstone template
Introduction
This is your rhetorical argument leading to the discussion of the research problem below. See the Argument to Abstract to Introduction document for assistance. This section builds from general knowledge to the more specific details and context that your research problem exists within. It should be written in an academic voice, be logical, and be heavily supported with citations. The argument should lead the reader to acknowledge or agree with your determination of the research problem. This should take 2-4 paragraphs.
Statement of the Problem
Discuss your research problem and then narrow your research focus to a segment or fragment of the problem, which is manageable in the scope of a one-semester research project. Then discuss your working hypothesis of the problem. Do not forget to support this problem with citations. Then finish with your thesis statement (IF, THEN, and THUS) concerning how the problem might be resolved or explained and the ramifications of implementing the resolution, or knowing the explanation.
Objective
Discuss your purpose and what you will deliver based on the results of the study. The deliverable is important in an applied research. Deliverables might include models, lists of practices, policy recommendations, etcetera. Think of impacting your targeted population with your deliverable and facilitating your THUS part of the thesis statement. Discuss these with your instructor.
Research Questions
Discuss how you will investigate your working hypothesis by asking the questions that follow. It is advisable to limit yourself to 2-3 research questions to limit the scope of your study. You might list further questions as limitations of the study below in the Assumptions and Limitations. Remember, these are the general questions you ask to investigate your research hypothesis.
Research question one
List the question.
Page 6 of 32
Quantitative capstone template

Null hypothesis one
List the null hypothesis.
Alternate hypothesis one
List the alternate hypothesis.
Discuss your intent in asking the question in a separate paragraph.
Research question two
List the question.
Null hypothesis two
List the null hypothesis.
Alternate hypothesis two
List the alternate hypothesis.
Discuss your intent in asking the question in a separate paragraph. And so on for each research question. It is good to limit the research questions to 2-3 for a study of this scope.
Research Method
Begin the chapter with a discussion of the worldview or philosophy that guides your research and provide a general discussion of your methodology, citing Creswell (2015), Remler and Van Ryzin (2014), Szafran (2009), and others as appropriate. Include how it informed your choice of a quantitative interview strategy, and why it is appropriate to what you are trying to learn or accomplish. This is a good place to cite related research studies for their use of quantitative methods and interviewing. Then discuss your research method (your strategy) for collecting data, informing your readers of how you will ensure the replicability and trustworthiness of your strategy. Then discuss why you are using the forms of structured questions you have chosen (nominal, ordinal, and scaled), and what they bring for response and data. You are establishing why this choice is appropriate to the study and how it will work, in general. This sets the stage for the full discussion of your research design (data collection strategy) in the section further below.
Page 7 of 32
Quantitative capstone template

Population
Who are you including in this study and why. It is important in a quantitative study to restrict participation by qualifying your population to a manageable size that will yield a sample of 100-200. Next, narrate how you get to the population total, and then calculate the representative sample from your total population. These calculations are important, and must be narrated clearly. You will find it helpful to find a proxy or representative population to start with, which will limit your sample size, include the margin of error (ME) and the confidence intervals (CI) it was calculated with. It is important to understand most SPSS tests require more than 100 responses to calculate results. Those who qualify, agree to participate, and sing the informed consent are your participants. Then discuss where you will find potential participants to recruit them, this is known as your setting. Remember this is where you will encounter potential participants to recruit them, it is not where they will take your survey.
Example
The intended population is residents of the District of Columbia. These residents will consist of individuals of diverse socioeconomic backgrounds and races. Participants will be asked if they are 18 or older and must be at least the age of 18 to participate in the survey. Individuals under the age of 18 will not participate due to their inability to vote in local and national elections. The study is solely an examination of voting age adults. The sample size for this study is calculated based on the nearly 400,000 registered voters in the District of Columbia, since this sample is too large to effectively survey a standard population of 20,000 was used. The sample size is 369 participants with a 5.0% margin of error, a 95% confidence interval, and a 40% response rate (RAOsoft, 2016). Individuals will be recruited using random sampling. Participants will be recruited at various public places, including but not limited to, Metro stations, coffee shops, and grocery stores in all four quadrants of the city. Recruitment materials are found in Appendix A.
Potential participants will be recruited using the Internet as a recruitment tool. The recruitment script (see Appendix A) will be posted on Facebook group page created for this study and LinkedIn professional groups. The recruitment
Page 8 of 32
Quantitative capstone template

script will have a link to the informed consent document, created in Google Docs. If a participant does not give consent they cannot proceed. Those who give consent will be taken to a second Google Doc form, which contains my contact information. I will make appointments with potential participants to conduct the interview at the local library, making use of a small meeting room.
Thomas, W. C. ( 2013). D.C. Voting Rights and Budget Autonomy: The Impact of Denied Voting Rights and Budget Autonomy on the Residents of the Nation’s Capital, Trinity Washington University, Washington, DC.
Ethical Considerations
In this section, you have three important areas to discuss,
How you will gain informed consent, The participant’s rights, and The risks the participant might encounter, including how you as the
researcher will avoid or limit those risks.
You might write this section in three separate paragraphs, which then can be transferred to the IRB application.
Research Design
Discuss in narrative form the detailed step by step process of how you will conduct the entire research study (the collection of your data). Think of this as the operator’s manual for your experiment that you might share with others so they can be assured that it is replicable and of the rigor of your experiment. Give a step by step how to description that another would follow to replicate your methodology. The section needs to have enough good detail to eliminate assumptions or the need to ask questions, and without becoming so granular in detail that no one will read it. It is a balancing act between too much information and not enough information. Use the language of next, then, last, or first, second, third. I recommend starting on a blank page of a new document. Then, write your steps in a bulleted list and review the items for order, consistency, and correctness. Next, write the bullets in narrative form below the bulleted list and review it for order, consistency, and correctness. Last, paste it into my capstone paper.
Page 9 of 32
Quantitative capstone template

Theory
Discuss the logic that leads you to choose the theory below in investigating and analyzing your research problem. Then discuss how you will proceed through the chapter. This might only be one paragraph. The section below uses Albert Bandura’s (1972) social learning theory. He later superseded this with social cognitive theory (Bandura, 1972) so there is little available beyond the citation to a publication in the UK. Please seek out a theory your own from more current sources. The purpose is to have head start in explaining what you find, or a departure point for further analysis. What you are building to is the theoretical model, which will be named based on the research method. You are trying to develop in your readers a deep and thorough enough understanding of the theory that the more concise model makes sense. See the ADMN 699 Capstone Resources Moodle page section, Preparing Yourself and Your Paper, Developing a Theoretical Perspective. There you will find advice and fields of theory to explore.
Theoretical Perspective
Discuss the theoretical perspective that guides the study, or is used to explain the phenomena of your research problem or the hypothesized resolution or explanation. This might be an established theory or proposition, or best practices, principles, or guidelines. Cover some of the history and background, how scholars and practitioners currently use the theory to explain the phenomena, and how the theory might be used to explain your problem, or a resolution to your problem. For example, social learning theory (SLT) is a part of the social cognitive theory (SCT) of Albert Bandura (1977). In this case, you might discuss SCT in general, and the why and how if its development. Then move to SLT; what it is and its factors (access, price, role models, and peer pressure). Next, complete the discussion by adding and critique or commentary. Finish with a discussion of why this theory, proposition, or these guidelines might explain or respond to your research hypothesis. Note that in the dependent variable state the outcome you are investigating or testing for, then describe it.
Page 10 of 32
Quantitative capstone template

Theoretical Framework
Describe the framework and its relationship to the working hypothesis. In other words, how it might explain the problem or the resolution – explanation. The discuss each variable.
Youth decide to not use synthetic Marijuana. - Dependent variable
Discuss the dependent variable. Be sure to cite your references.
Access - independent variable one
Discuss independent variable one. Be sure to cite your references.
Price - independent variable two
Discuss the independent variable two. Be sure to cite your references.
Role models - independent variable three
Discuss independent variable three. Be sure to cite your references.
Peer pressure - independent variable four
Discuss independent variable four. Be sure to cite your references.
Moderating variables
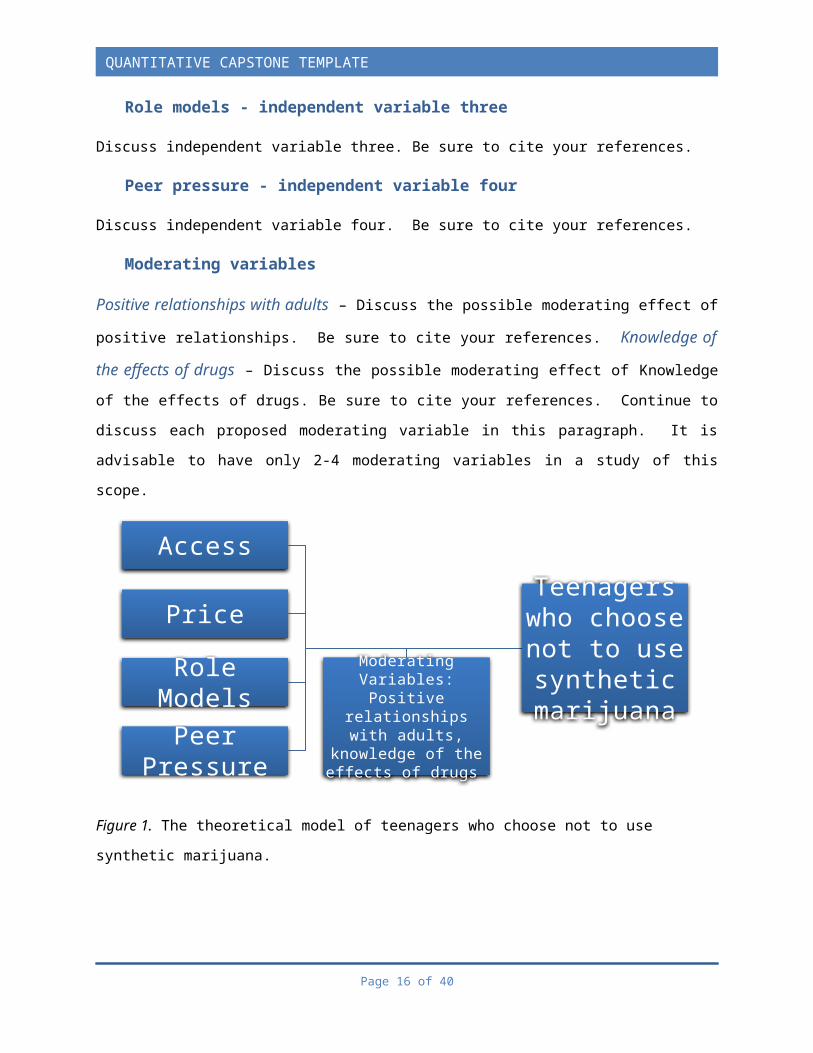
Positive relationships with adults – Discuss the possible moderating effect of positive relationships. Be sure to cite your references. Knowledge of the effects of drugs – Discuss the possible moderating effect of Knowledge of the effects of drugs. Be sure to cite your references. Continue to discuss each proposed moderating variable in this paragraph. It is advisable to have only 2-4 moderating variables in a study of this scope.
Page 11 of 32
Quantitative capstone template

Figure 1. The theoretical model of teenagers who choose not to use synthetic marijuana.
Analysis
Describe what you will accomplish in this chapter and how you will proceed.
Sample
Discuss who participated in your study. This section is written differently for quantitative and qualitative studies, use the correct format. Quantitative studies often use frequency and or cross tabulation tables to develop an aggregate (overall) understanding of the participants.
Example
The data was collected from a total of 95 participants, 64 female (67%), and 31 (33%) male. The participants were age 60 and above, and they all resided in the Ward 5, Washington, DC Metropolitan Area. Of the 95 participants, 58 (61%) were boomers and 37 (39%) traditionalists (see Tables 1-2). Ward 5 has an ethnically diverse group of seniors. The racial breakdown of the participants was not representative of the ethnic diversity of the population of Ward 5’s seniors. The breakdown of respondents was 92 (97%) African-American, 2 Hispanic, and 1 American Indian (see Table 3). Also, of the 58 boomers who took the survey, 37 (64%) own or have access to a computer, 18 (31%) an iPad, and 32 (55%) a
Page 12 of 32
Quantitative capstone template
Teenagers who choose not to use synthetic
marijuana
Access
Price
Role Models
Peer Pressure
Moderating Variables: Positive relationships
with adults, knowledge of the effects of drugs

smartphone. This compares to the 37 traditionalists who took the survey, of whom 11 (30%) own or have access to a computer, 2 (5%) an iPad, and 5 (14%) a smartphone (see Tables 4-6). All participants completed the informed consent form and the survey online and manually between the dates of November 18 and November 24, 2014.
Table 1. Frequency: Year of birth.
Frequency % Valid % Cumulative %
Valid
Boomers 58 61.1 61.1 61.1
Traditionalists 37 38.9 38.9 100.0Total 95 100.0 100.0
Table 2. Frequency: Gender.
Frequency % Valid % Cumulative %
Valid
Female 64 67.4 67.4 67.4
Male 31 32.6 32.6 100.0Total 95 100.0 100.0
Table 3. Frequency: Race.
Frequency % Valid % Cumulative %
Valid
African-American 92 96.8 96.8 96.8
Hispanic 2 2.1 2.1 98.9American Indian 1 1.1 1.1 100.0Total 95 100.0 100.0
For an analysis of secondary data sets, , this would be the reference for the data set and a brief annotated bibliography to include the authors, the year, and the title of the source.
Example
Data Sets
The data used in this study were retrieved from three sources. Data on age, gender, income status, population, race and ethnicity, and region were obtained from the U.S. Census Bureau. Information on the number of Suboxone providers within each state was obtained from the Substance Abuse and Mental Health Services Administration. Lastly, information on the number of heroin and opioid
Page 13 of 32
Quantitative capstone template

overdose-related deaths was obtained from the CDC WONDER database. The data were grouped together, by state, to form the aggregate data set used to conduct this study.
Substance Abuse and Mental Health Services Administration data
Information on the number of Suboxone providers was collected from the Substance Abuse and Mental Health Services Administration database. The database keeps track of the number of DATA-certified Suboxone providers in each state. The information provided in this database is sorted by state, year, and the maximum number of patients each provider can treat with Suboxone (30 patients for first-year Suboxone providers or 100 patients for providers who have been treating patients with Suboxone for two or more years) (SAMHSA, n.d.).
Centers for Disease Control data
Information on the number of heroin and opioid overdose-related deaths was obtained from the Multiple Cause of Death (MCD) database, which is available via the CDC WONDER website. The information in the MCD database is retrieved from death certificates of U.S. residents. A single underlying cause of death and multiple additional causes of death can be extracted from this database by several demographic groupings, including state of residence. The cause of death codes used for this study may be found in Appendix B. Researchers using data from the MCD database agree not to report any state-level data for cases where less than 10 observations are made (CDC, n.d., About multiple). No such instances were observed in this study.
And so on….
Data Analysis and Coding
Quantitative - Present discussions and explanations and then tables in each section below. Some researchers present the results by levels of inference, and others by research question. After the questions, then a section of multiple regression.
Tests and measures
Discuss the strategy of tests you will run in your statistical analysis program and the expected measurements to show significance, probability, strength of
Page 14 of 32
Quantitative capstone template

association, etcetera. Cite statistics texts, such as Szafran’s Answering Questions with Statistics, or research texts from your review of related research in the Literature Review. For example, in a standard social sciences study a specific range of measures of significance (p<= 0.05) and association (Pearsons’s = -1.0, 1.0) are expected in tests (tables) you might run on the data. In some cases, it might be appropriate to develop and test a predictive model of variables, which effect the dependent variable. In these instances, you might run an ANOVA. Narrate the list the range of significance and/ or association and show them in tables. In social science research, you would be expected to run tests (results in the form of tables) for: understanding your sample: (frequency and descriptive tables), measures of association (Cross Tabs, Correlation, Chi-square), testing the hypothesis with the appropriate t- test (one sample t- test, paired (two) sample t- test, independent, t- test), and tests for prediction (ANOVA, or multiple regression).
Any of these statistical tests might look at values such as mean, difference of mean, degrees of freedom, f, Pearson’s Movement Correlation Coefficient (PMCC) (or Pearson’s r), significance (p), slope (b), beta (β), multiple correlation coefficient (R), or the coefficient of determination (R2), and many more. Please be prepared to discuss why you are using these statistics and what their values mean. These lists are not fully inclusive of the tests you should run and statistics you should calculate, so work with your faculty to determine in advance the appropriate tests to run. Be certain to discuss what the measurements indicate. For example, it is important to know what indicates a strong association, or a positive correlation. This shows that you know in advance what results you are expecting in your data (not that you know the exact results, but have a reasonable expectation). For example,
Example
Measures of association
Measures of association are a single statistic, which provides a value for the relationship (covariation) between two variables. Additionally, ordinal measures of association are able to indicate the strength of the relationship and the direction of the relationship (Szafran, 2012, p. 196).
Page 15 of 32
Quantitative capstone template
Pearson’s correlation (PMCC)
Correlation is a test of the strength of association between two variables in the model. PMCC shows strong positive correlation at values of 0.5 to 1.0, and strong negative correlation at values of -1.0 to -0.5. Then follow with medium correlation, weak correlation, and no correlation. You should also offer information regarding the difference between a positive and a negative correlation. Significance (2-tailed) is another test of the strength of association between two variables in the model. Significance (2-tailed) shows strong positive correlation at values of 0.05 to 0.0, and strong negative correlation at values of 0.0 to -0.05. Then follow with medium correlation, weak correlation, and no correlation. You should also offer information regarding the difference between a positive and a negative correlation. When compared with the PMCC in the Coefficients (a) table a researcher can determine from two independent tests of the strength of association and indicates variables to investigate through further inferential analysis.
Then follow with the next test and its measures until you have covered them all…
Analysis by research question
Research question one
Cross tabulations
Discuss the results expressed in the table(s) (including the numerical data), then present the table(s) before moving on to the next section. Be certain to give the expected count and the residuals and report the total percent.
Table 4. Crosstabulations: Future as a volunteer.
I have participated in the following ECA or OCA? (Volunteer)
Total
Yes NoMy grades in high school and college matter for my future.
Strongly Agree
Count 16 21 37Expected Count 13.5 23.5 37.0Residual 2.5 -2.5
Somewhat Agree
Count 0 2 2Expected Count .7 1.3 2.0Residual -.7 .7
Page 16 of 32
Quantitative capstone template

AgreeCount 0 4 4Expected Count 1.5 2.5 4.0Residual -1.5 1.5
Somewhat Disagree
Count 0 1 1Expected Count .4 .6 1.0Residual -.4 .4
TotalCount 16 28 44Expected Count 16.0 28.0 44.0
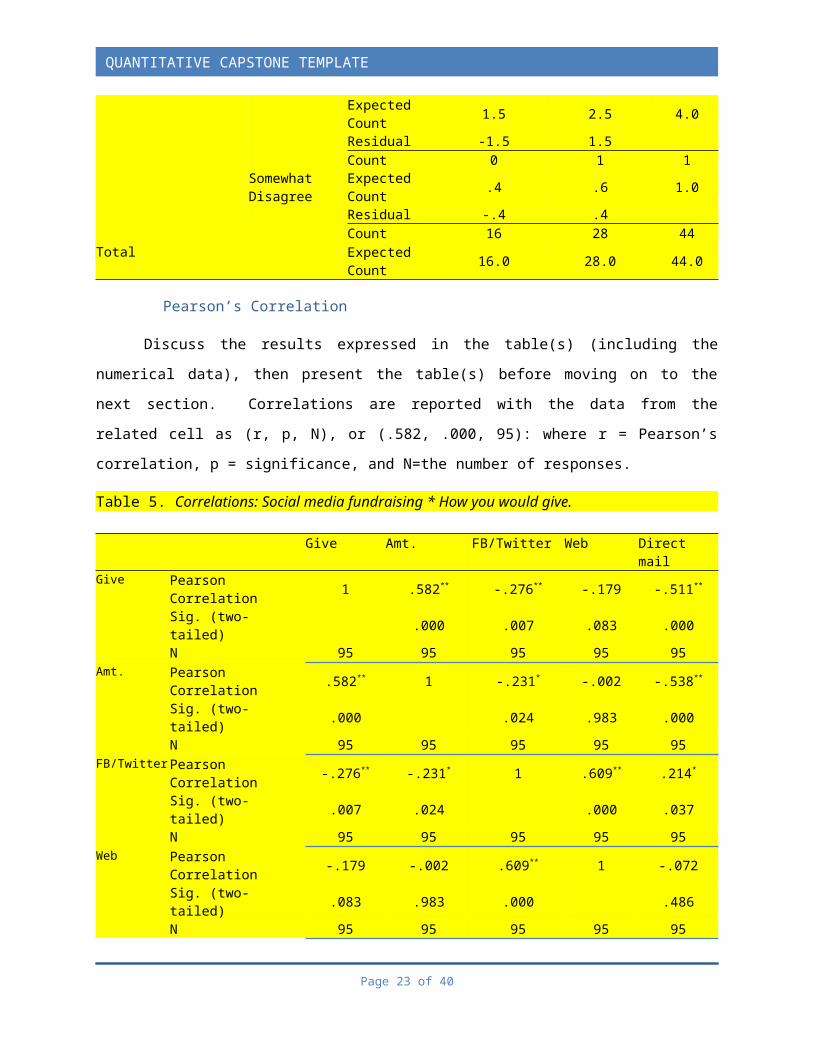
Pearson’s Correlation
Discuss the results expressed in the table(s) (including the numerical data), then present the table(s) before moving on to the next section. Correlations are reported with the data from the related cell as (r, p, N), or (.582, .000, 95): where r = Pearson’s correlation, p = significance, and N=the number of responses.
Table 5. Correlations: Social media fundraising * How you would give.
Give Amt. FB/Twitter Web Direct mailGive Pearson Correlation 1 .582** -.276** -.179 -.511**
Sig. (two-tailed) .000 .007 .083 .000N 95 95 95 95 95
Amt. Pearson Correlation .582** 1 -.231* -.002 -.538**
Sig. (two-tailed) .000 .024 .983 .000N 95 95 95 95 95
FB/Twitter Pearson Correlation -.276** -.231* 1 .609** .214*
Sig. (two-tailed) .007 .024 .000 .037N 95 95 95 95 95
Web Pearson Correlation -.179 -.002 .609** 1 -.072Sig. (two-tailed) .083 .983 .000 .486N 95 95 95 95 95
Direct mail Pearson Correlation -.511** -.538** .214* -.072 1Sig. (two-tailed) .000 .000 .037 .486N 95 95 95 95 95
** Correlation is significant at the 0.01 level (two-tailed).* Correlation is significant at the 0.05 level (two-tailed).
t- Tests (one-sample, independent, or paired)
Discuss the results expressed in the table(s) (including the numerical data), then present the table(s) before moving on to the next section. For t- tests report the (t, df, p), or (.824, 52, .176): where t = the t statistic, df = the degrees of freedom, and p = the significance). The null hypothesis is accepted or rejected based p ≥ .05.
Page 17 of 32
Quantitative capstone template

Table 6. Independent sample group statistics for young alumni giving.
enjoyed experienceDonated? N Mean Std. Deviation Std. Error MeanYes 16 4.75 .577 .144No 38 4.61 .595 .096
satisfied experience Yes 16 4.69 .793 .198No 38 4.47 .647 .105
Table 7. Independent samples t- tests for young alumni giving.
Levene's Test for Equality of Variances t-test for Equality of Means
F Sig. t df
Sig. (2-tailed)
Mean Difference
Std. Error Difference
95% Confidence Interval of the DifferenceLower Upper
enjoyed experience
Equal variances assumed
1.445 .235 .824 52 .414 .145 .176 -.208 .497
Equal variances not assumed
.834 29.039 .411 .145 .174 -.210 .500
satisfied experience
Equal variances assumed
.403 .528 1.037 52 .305 .214 .206 -.200 .628
Equal variances not assumed
.953 23.815 .350 .214 .224 -.249 .677
Research question two
Cross tabulations
Discuss the results expressed in the table(s) (including the numerical data), then present the table(s) before moving on to the next section. Be certain to give the expected count and the residuals and report the total percent.
Table 8. Cross tabulations: My future as a volunteer 2
I have participated in the following ECA or OCA? (Volunteer)
Total
Yes NoMy grades in high school and college matter for my future.
Strongly AgreeCount 16 21 37Expected Count 13.5 23.5 37.0Residual 2.5 -2.5
Somewhat Count 0 2 2
Page 18 of 32
Quantitative capstone template

Agree Expected Count .7 1.3 2.0
Residual -.7 .7
AgreeCount 0 4 4Expected Count 1.5 2.5 4.0Residual -1.5 1.5
Somewhat Disagree
Count 0 1 1Expected Count .4 .6 1.0Residual -.4 .4
Total Count 16 28 44Expected Count 16.0 28.0 44.0
Pearson’s Correlation
Discuss the results expressed in the table(s) (including the numerical data), then present the table(s) before moving on to the next section. Correlations are reported with the data from the related cell as (r, p, N), or (.582, .000, 95): where r = Pearson’s correlation, p = significance, and N=the number of responses.
Table 9. Correlations: social media fundraising * How would you give 2
Give Amt. FB/Twitter Web Direct mailGive Pearson Correlation 1 .582** -.276** -.179 -.511**
Sig. (two-tailed) .000 .007 .083 .000N 95 95 95 95 95
Amt. Pearson Correlation .582** 1 -.231* -.002 -.538**
Sig. (two-tailed) .000 .024 .983 .000N 95 95 95 95 95
FB/Twitter Pearson Correlation -.276** -.231* 1 .609** .214*
Sig. (two-tailed) .007 .024 .000 .037N 95 95 95 95 95
Web Pearson Correlation -.179 -.002 .609** 1 -.072Sig. (two-tailed) .083 .983 .000 .486N 95 95 95 95 95
Direct mail Pearson Correlation -.511** -.538** .214* -.072 1Sig. (two-tailed) .000 .000 .037 .486N 95 95 95 95 95
** Correlation is significant at the 0.01 level (two-tailed).* Correlation is significant at the 0.05 level (two-tailed).
t- Tests (one-sample, independent, or paired)
Discuss the results expressed in the table(s) (including the numerical data), then present the table(s) before moving on to the next section. For t- tests report the (t, df, p), or (.824, 52, .176): where t = the t statistic, df = the degrees of freedom, and p = the significance). The null hypothesis is accepted or rejected based p ≥ .05.
Page 19 of 32
Quantitative capstone template

Table 10. Independent sample group statistics for young alumni giving.
enjoyed experienceDonated? N Mean Std. Deviation Std. Error MeanYes 16 4.75 .577 .144No 38 4.61 .595 .096
satisfied experience Yes 16 4.69 .793 .198No 38 4.47 .647 .105
Table 11. Independent samples t- tests for young alumni giving.
Levene's Test for Equality of Variances t-test for Equality of Means
F Sig. t df
Sig. (2-tailed)
Mean Difference
Std. Error Difference
95% Confidence Interval of the DifferenceLower Upper
enjoyed experience
Equal variances assumed
1.445 .235 .824 52 .414 .145 .176 -.208 .497
Equal variances not assumed
.834 29.039 .411 .145 .174 -.210 .500
satisfied experience
Equal variances assumed
.403 .528 1.037 52 .305 .214 .206 -.200 .628
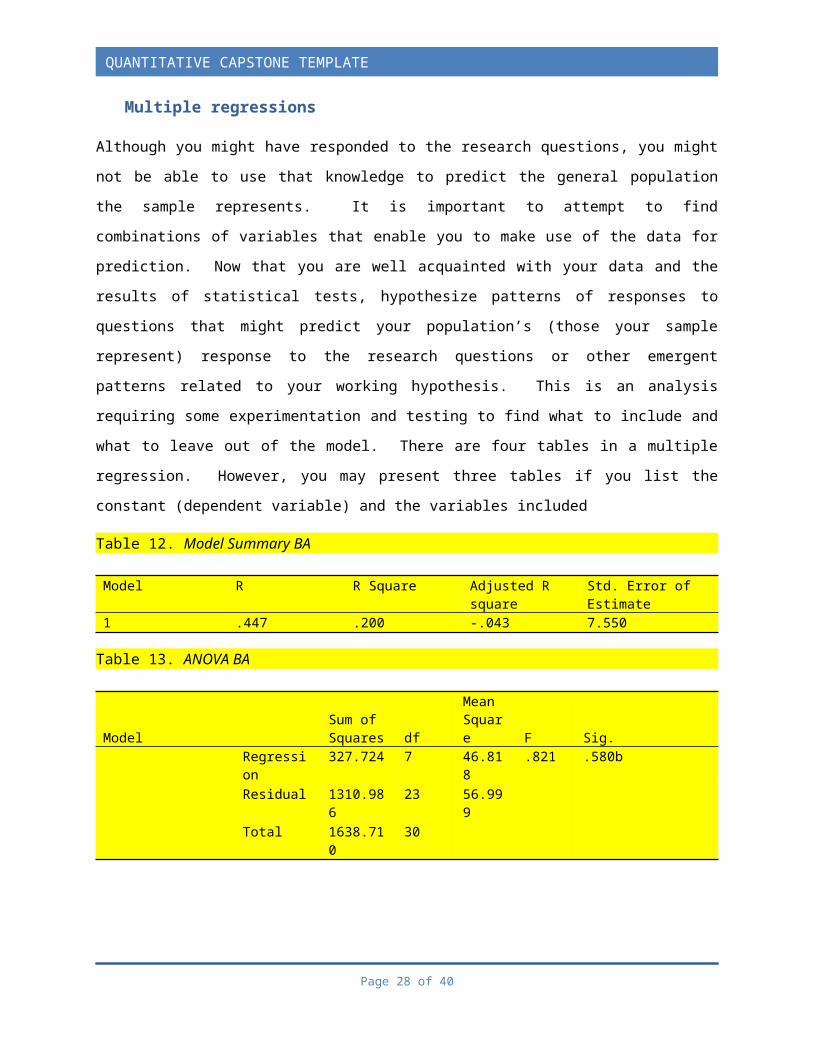
Multiple regressions
Although you might have responded to the research questions, you might not be able to use that knowledge to predict the general population the sample represents. It is important to attempt to find combinations of variables that enable you to make use of the data for prediction. Now that you are well acquainted with your data and the results of statistical tests, hypothesize patterns of responses to questions that might predict your population’s (those your sample represent) response to the research questions or other emergent patterns related to your working hypothesis. This is an analysis requiring some experimentation and testing to find what to include and what to leave out of the model. There are four tables in a multiple regression. However, you may present three tables if you list the constant (dependent variable) and the variables included
Table 12. Model Summary BA
Model R R Square Adjusted R square
Std. Error of Estimate
Page 20 of 32
Quantitative capstone template

1 .447 .200 -.043 7.550
Table 13. ANOVA BA
ModelSum of Squares df
Mean Square F Sig.
Regression
327.724 7 46.818 .821 .580b
Residual 1310.986
23 56.999
Total 1638.710
30
Table 14. Coefficients BA
ModelUnstandardized Coefficients
Standardized Coefficients
t Sig.B Std. Error Beta(Constant) 29.419 10.716 2.745 .012
Education CVR
-.159 .208 -.183 -.767 .451
Education BA .164 .223 .188 .738 .468Public Safety CVR
.566 .411 .522 1.375 .182
Public Safety BA
-.582 .417 -.472 -1.397
.176
Economy BA .065 .344 .059 .189 .852Congressional Voting
.197 .170 .268 1.158 .259
Economy CVR
-.062 .317 -.057 -.196 .846
Discussion
Discuss the purpose of this chapter and how it will proceed.
Research Questions
State briefly your intent to respond to the research questions, which were developed to investigate the research hypothesis, with consideration for the results or findings of the analysis. Keep this section to responses based on the results or findings.
Page 21 of 32
Quantitative capstone template

Research question one
List the research question.
Null hypothesis one.
List the null hypothesis.
Alternate hypothesis one.
List the alternate hypothesis.
Discuss what you know from the data and determine to accept or reject the null hypothesis. Offer specific examples from your results, and link to the argument or theory. Keep this to the response based on the results of our coding and analysis.
Research question two
List the question.
Null hypothesis two
List the null hypothesis.
Alternate hypothesis two
List the alternate hypothesis.
And so on… until you address each question posed in the study.
Conclusions
Now that you have mastered understanding your data and you have responded to your research questions, you have a body of knowledge concerning your research problem. Take this opportunity to discuss what you now know and how what you know can be applied to resolve or explain your problem. Included specific examples from your analysis chapter, cite participants if possible, and link to the literature you used to write the Introduction and Theory with citations.
Recommendations
Make recommendations for implementing your resolution. Discuss in depth what your research population, policymakers, administrators, or others might need to
Page 22 of 32
Quantitative capstone template
accomplish to might make your recommendations work. This is where you would present models, list, policies, practices, and etcetera.
Implications
Then discuss the implications of implementing your recommendations for your target population, the scholar or practitioner community, and even the wider social effects. This assists readers in seeing that your recommendations are not too Pollyanna-ish, or pie-in-the-sky. They have merit, value, and are applicable.
Summary
Summarize the entire project. This should be a more detailed narrative of the abstract or summary from the beginning, and might take a full page.
Page 23 of 32
Quantitative capstone template

References
The references section is written in the hanging indent style and with a sentence space of 1.5 for improved readability. There must be a reference for every work cited, and nothing should be referenced that is not cited, in the entire document.
See the APA 6th Publication Manual, chapter 7 for the appropriate reference styles for each type of source used.
Your reference section should include every work cited in the paper. The reference section of an APA research paper is unlike a bibliography from other publishing styles. The reference section of this paper may only include works that you have cited in the document. You may not include items that influenced you, or are recommended reading, only include what you have cited. For example,
American Psychological Association, (2009). Publication manual of the American psychological association (6th ed.)., Washington, D.C.: Author
Booth, W. C, Colomb, G.G., & Williams, J. L. (2008). The craft of research, (3rd ed.), Chicago, IL, Chicago University Press. *Use Chapters 3 to 5 to clarify your topic into questions.
Creswell, J. S. (2014). Research design: Qualitative, quantitative, and mixed methods approaches. (4th ed.), Thousand Oaks, CA: Sage Publishing
Krippendorff, K. (2006). Reliability in content analysis: Some common misconceptions and recommendations. Human Communication Research 30(3) 411–433
Krippendorff, K. (2013). Content analysis: An introduction to its methodology. Thousand Oaks, CA: Sage Publications
Lester, J. D. & Lester, J. D., Jr. (2011). Writing research papers: A complete guide, Upper Saddle River, NJ: Pearson Longman. *Use chapter 7, sections F & G to develop an annotated bibliography and turn it into a literature review.
Merriam, S. B. (2009). Qualitative research: a guide to design and implementation (2nd ed.). Thousand Oaks, CA: Sage Publishing. *Use all chapters as they are helpful.
Page 24 of 32
Quantitative capstone template

Merriam, S. B. & Tisdell, E. J. (2016). Qualitative research: a guide to design and implementation (3rd ed.). Thousand Oaks, CA: Sage Publishing. *Use all chapters as they are helpful.
Paul, R. & Elder, L. (2008). The miniature guide to critical thinking: Concepts and tools. Dillon Beach, CA: Foundation for Critical Thinking.
Remler, D. K. & Van Ryzin, G. G. (2010). Research methods in practice: Strategies for description and causation (2nd ed.). Thousand Oaks, CA: Sage Publishing.
Saldana, J. (2009). The coding manual for qualitative researchers. Thousand Oaks, CA: Sage Publishing. *The appropriate sections for your primary and secondary coding of the data.
Saldana, J. (2014). The coding manual for qualitative researchers. Thousand Oaks, CA: Sage Publishing. *The appropriate sections for your primary and secondary coding of the data.
Saldana, J. (2016). The coding manual for qualitative researchers. Thousand Oaks, CA: Sage Publishing. *The appropriate sections for your primary and secondary coding of the data.
Schensul, S. L., Schensul, J. J., & LeCompte, M. D. (1999) Essential ethnographic methods: Observations, interviews, and questionnaires. In Ethnographer’s Toolkit Schensul, J. J., & LeCompte, M. D. (Eds.) Lanham, MD: Altamira Press. *The appropriate chapter for surveys or interviews.
Schensul, J. J., & LeCompte, M. D. (2013) Essential ethnographic methods: Observations, interviews, and questionnaires. In Ethnographer’s Toolkit Schensul, J. J., & LeCompte, M. D. (Eds.) Lanham, MD: Altamira Press. *The appropriate chapter for surveys or interviews.
Shenton, A. K. (2004). Strategies for ensuring trustworthiness in qualitative research projects. Education for Information 22 63–75
Szafran, R. (2012). Answering questions with statistics. Thousand Oaks, CA: Sage Publishing
Yin, R. K., (2013). Case study research: Design and methods (5th ed.), Thousand Oaks, CA: Sage Publishing. *The standard for case study research.
Page 25 of 32
Quantitative capstone template

Page 26 of 32
Quantitative capstone template

Appendices
Appendix A: Recruitment Materials
Place examples of the script you will use to standardize your recruitment of participants; your flyers, notices, emails, contents of Facebook page contents, and etcetera. This is important in that it shows the instructor and the IRB that you are using a planned approach to recruiting, and that you are not using coercion, or deception to gain participants. You might also benefit from a script you can follow when speaking to strangers.
Page 27 of 32
Quantitative capstone template
Appendix B: Informed Consent
Title of the Research Study
I would like to invite you to participate in a research project, which will add to the (knowledge of, or practice of) _____________________________. The findings or results this study will help fulfill the requirements for a Master of ______________________ at Trinity Washington University. I am under the supervision of my faculty advisor (Dr. or Prof.) ____________________.
Participation: I will ask you to (to participate in an interview/ to complete a survey/ take pre- and post-tests/ participate in a workshop or seminar, and etcetera).
Privacy: Your participation in this study and your responses is confidential. In the study, and the resulting paper, you will be known by a pseudonym if I refer to you. This document and any notes or recordings that might personally identify you as a participant in this study will be kept in a secure place that only I will have access to. Only the faculty advisor, and myself, might know who has participated in this study. Three years after the completion of this research study all personally identifying information will be destroyed.
Risk: The researcher foresees minimal risk to participants as follows,
No risk of physical harm
A potential for minor emotional discomfort, depending on the topic of the study and questions posed, or responses sought. If you experience discomfort, you may choose to skip questions or to withdraw from the study. If you experience discomfort beyond the time you participate in this study you may contact the faculty advisor (contact information is below).
No social, economic, or legal implications are expected. It is recommended you do not share the specifics of your responses or your participation in this study with others. The researcher will maintain your confidentiality throughout the study.
Benefits: Assisting the researcher in completing their degree requirements and contributing to the general knowledge related to this research topic are the only expected benefits. There is no direct benefit and no compensation associated with this study.
Page 28 of 32
Quantitative capstone template

Page 29 of 32
Quantitative capstone template
Signature page
Title of your Research Study
I understand I may withdraw from this study at any time. If I have any questions or concerns regarding my participation in this research study I may contact the faculty advisor, Dr/Prof. ______________________, or the BGS Institutional Review Board (IRB), which oversees the ethical practice of research involving persons conducted at the Trinity Washington University School of Business and Graduate Studies. By signing this document, I understand the following,
I understand what it means to participate in this study. I understand my rights as a participant in this study, which the
researcher has explained. My participation is confidential, including all information I share, and I
will be known by a pseudonym if referred to in the study. I am indicating that I consent to participate in this study, that I am at
least 18 years of age, and I am eligible to participate in this study.
I may retain a copy of this document for my own records.
Signature: ________________________________________________ Date: _______________
Printed Name: _________________________________________________________________
Phone Number, Email Address, or Postal Address: ___________________________________
_____________________________________________________________________________
Thank you for your participation,
Your name, CandidateYour degree titleEmail Address: @students.trinitydc.edu
Research Supervisor: Dr. ________________________(202) 884-9640, or [email protected]
BGS Institutional Review Board (202) 884-9640, or email [email protected] with BGS IRB Questions in the subject line.
Page 30 of 32
Quantitative capstone template

Page 31 of 32
Quantitative capstone template

Appendix C: Data Collection Instrument
Insert an MS Word friendly version of your survey questionnaire or interview here in this appendix. This should have all the questions included and any narration or other interaction with the participant. The text should be exact as it was reviewed, and as it was approved by the IRB committee. If this is a survey, use this document to create the survey in Google Docs. *Note that if you copy and paste from a browser based survey it will bring over hidden macros and other security issues.
Page 32 of 32
Quantitative capstone template