quantitative determination and classification of...
TRANSCRIPT
1
Quantitative determination and classification of energy drinks
using near-infrared spectroscopy
Anita Rácz1,2
, Károly Héberger1,
*, Marietta Fodor2
1 Plasma Chemistry Research Group, Research Centre for Natural Sciences, Hungarian Academy
of Sciences, H-1117 Budapest XI., Magyar Tudósok krt. 2.
2 Department of Applied Chemistry, Faculty of Food Science, Szent István University,
H-1118 Budapest XI., Villányi út 29-43.
* To whom correspondence should be sent:
E-mail address: [email protected] (Károly Héberger)
2
Abstract
Almost a hundred commercially available energy drink samples from Hungary, Slovakia
and Greece were collected for the quantitative determination of their caffeine and sugar content
with FT-NIR spectroscopy and high performance liquid chromatography (HPLC). Calibration
models were built with partial least squares regression (PLS-R). An HPLC-UV method was used
to measure the reference values for caffeine content, while sugar contents were measured with
the Schoorl method. Both the nominal sugar content (as indicated on the cans) and the measured
sugar concentration were used as references. Although the Schoorl method has larger error and
bias, appropriate models could be developed using both references. The validation of the models
was based on sevenfold cross-validation and external validation. FT-NIR analysis is a good
candidate to replace the HPLC-UV method, because it is much cheaper than any
chromatographic method, while it is also more time-efficient. The combination of FT-NIR with
multi-dimensional chemometric techniques like PLS-R can be a good option for the detection of
low caffeine concentrations in energy drinks.
Moreover, three types of energy drinks that contain i) taurine, ii) arginine and iii) none of these
two components, were classified correctly using principal component analysis and linear
discriminant analysis. In fact, such classifications are important for the detection of adulterated
samples and for quality control, as well. In this case more than a hundred samples were used for
the evaluation. The classification was validated with cross-validation and several randomization
tests (X-scrambling).
Keywords: energy drink, caffeine, sugar, classification, PCA, LDA, FT-NIR

3
Introduction
Energy drinks are one of the most common functional beverages nowadays amongst
commercially available soft drinks. The high caffeine concentration combined with a
characteristic flavor, color and diverse and unique appearances has conquered the entire world in
the past decades. On the other hand, energy drinks might carry dangerous side effects. They
provide refreshment, good taste and energy for athletes, adolescents and students, who often
consume them in large quantities, because they look like (especially in a 1.5 L bottle) and taste
like common soft drinks. In most countries energy drinks are not prohibited for minors, which
means that anybody can consume them uncontrollably.
In the past decade many publications have dealt with the two greatest risks, the caffeine
and the sugar intake from energy drinks. Extreme caffeine intake can lead to hypertension,
cardiac arrhythmia, liver and kidney problems in case of long-term consumption, besides the
potential overdose symptoms [1]. Unregulated caffeine intake in the case of children and
adolescents cannot solely cause cardiac abnormalities, but it can cause mood and behavioral
disorders [2]. Heckman et al. also mentioned that caffeine intake can be dangerous for pregnant
women. It can increase the risk of impaired fetal growth and decrease fertility [3]. Another paper
draws attention to the sugar content of energy drinks, where the biggest problems are obesity and
the risk of type 2 diabetes mellitus [4]. An average portion of energy drink contains 10 g sugar
per 100 ml liquid.
A new “trend” has shown up in the last years, which is quickly spreading amongst
adolescents and college students: the combination of energy drinks with alcohol [5]. This
combination can cause serious problems, for example the dehydration of the body caused by
4
drinking alcohol is increased by the effect of caffeine. Ferreira et al. confirmed in their paper
that, although the combination of energy drinks with alcohol can give a false feeling that the
decrease of motor coordination has stopped, it cannot be detected in reality [6]. Another
experiment with college students concluded that those students who consume energy drinks with
alcohol have a higher risk to be involved in alcohol–related consequences [7].
As the consumption of energy drinks is an increasing and daily issue, especially in the
case of adolescents, control of the caffeine and sugar content is of utmost importance for both the
consumers and the producers. While every country has its own controlling and regularization
systems, among the hundreds of energy drink brands one can assume that they are unregulated.
There are plenty of methods reported in the literature for measuring the caffeine content of
energy drinks, and one can find sources for the examination of sugar contents as well. Two types
of experiments can be distinguished: spectrometric and chromatographic techniques. From the
first group Armenta et al. used solid-phase Fourier-transform Raman spectrometry for the
analysis of commercial energy drink samples [8] and in another paper an UV/VIS derivative
spectrophotometric approach with solid phase extraction is presented [9]. As for the other group,
one can successfully apply HPTLC-UV densitometric analysis [10], dispersive liquid-liquid
microextraction (DLLME) with gas chromatography-nitrogen phosphorus detection (GC-NPD)
[11] or surfactant-mediated matrix-assisted laser desorption/ionization time-of-flight mass
spectrometry (MALDI-TOF-MS) for the determination of caffeine content, and also vitamins
such as riboflavin, nicotinamide, etc. [12]. Some other examples are summarized (including
those mentioned above) in Table 1 in detail.
5
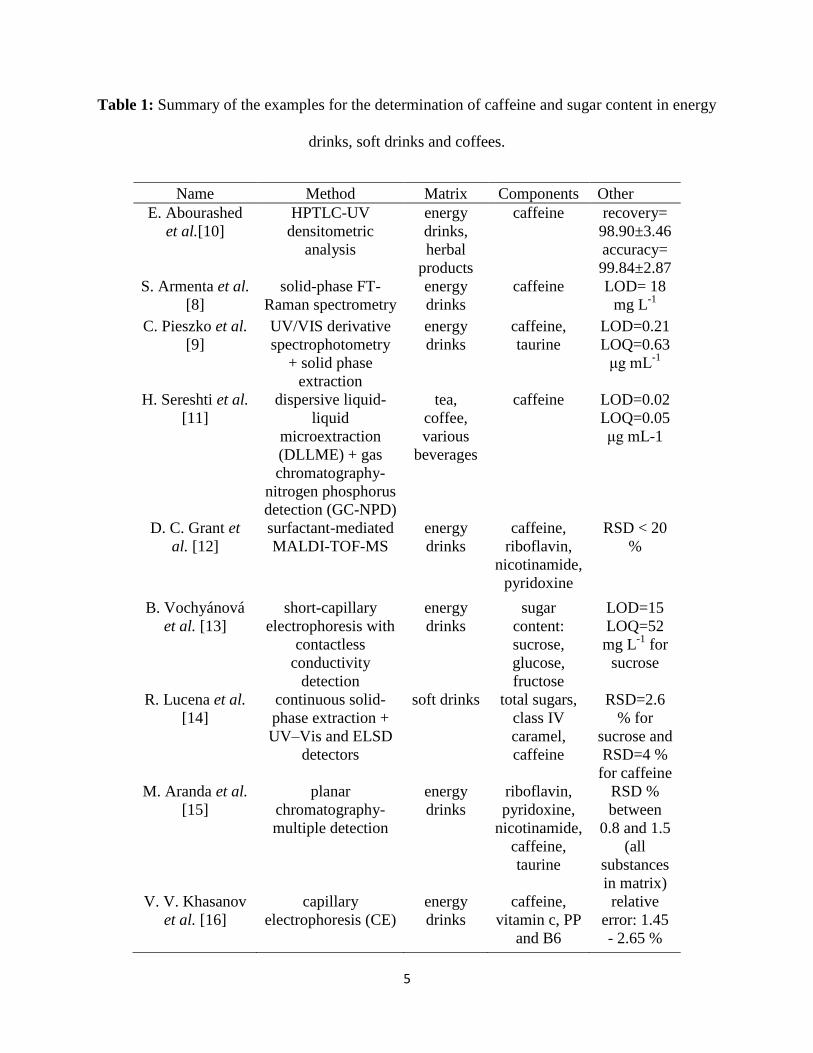
Table 1: Summary of the examples for the determination of caffeine and sugar content in energy
drinks, soft drinks and coffees.
Name Method Matrix Components Other
E. Abourashed
et al.[10]
HPTLC-UV
densitometric
analysis
energy
drinks,
herbal
products
caffeine recovery=
98.90±3.46
accuracy=
99.84±2.87
S. Armenta et al.
[8]
solid-phase FT-
Raman spectrometry
energy
drinks
caffeine LOD= 18
mg L-1
C. Pieszko et al.
[9]
UV/VIS derivative
spectrophotometry
+ solid phase
extraction
energy
drinks
caffeine,
taurine
LOD=0.21
LOQ=0.63
μg mL-1
H. Sereshti et al.
[11]
dispersive liquid-
liquid
microextraction
(DLLME) + gas
chromatography-
nitrogen phosphorus
detection (GC-NPD)
tea,
coffee,
various
beverages
caffeine LOD=0.02
LOQ=0.05
μg mL-1
D. C. Grant et
al. [12]
surfactant-mediated
MALDI-TOF-MS
energy
drinks
caffeine,
riboflavin,
nicotinamide,
pyridoxine
RSD < 20
%
B. Vochyánová
et al. [13]
short-capillary
electrophoresis with
contactless
conductivity
detection
energy
drinks
sugar
content:
sucrose,
glucose,
fructose
LOD=15
LOQ=52
mg L-1
for
sucrose
R. Lucena et al.
[14]
continuous solid-
phase extraction +
UV–Vis and ELSD
detectors
soft drinks total sugars,
class IV
caramel,
caffeine
RSD=2.6
% for
sucrose and
RSD=4 %
for caffeine
M. Aranda et al.
[15]
planar
chromatography-
multiple detection
energy
drinks
riboflavin,
pyridoxine,
nicotinamide,
caffeine,
taurine
RSD %
between
0.8 and 1.5
(all
substances
in matrix)
V. V. Khasanov
et al. [16]
capillary
electrophoresis (CE)
energy
drinks
caffeine,
vitamin c, PP
and B6
relative
error: 1.45
- 2.65 %
6
Although the mentioned methods can be used with success, they are time- and money-
demanding because of the necessary pretreatments, solvents and other required materials. In the
field of spectroscopy, Fourier transformed near infrared spectroscopy is one of the fastest and
cheapest techniques, which is commonly used in several research areas from pharmaceutical to
food sciences. The method is easy to use and in most cases it does not need any sample
pretreatment. We can find some publications in the literature for the determination of caffeine
content with FT-NIR as well, but only for coffee samples [17,18].
Therefore, our aim was to develop a novel, money- and time-saving method for the
determination of caffeine and sugar concentration in energy drinks with FT-NIR spectroscopy.
The technique has not been used earlier for this type of analysis and sample matrix. An easy
HPLC-UV method was further developed from an international standard to provide a reference
method for the determination of caffeine concentrations. While caffeine and sugar are the most
important components, minor components such as taurine or arginine should not be ignored
either. In Hungary, production of taurine-containing energy drinks is legally hindered, thus most
of the producers are trying to avoid this component; it is either omitted altogether, or replaced
with arginine. From this point of view, Hungarian energy drinks can be termed “carbonated soft
drinks with high caffeine content” (which is currently the official term for them), as they differ
from their American or other European counterparts. It has to be indicated on the bottles, which
means that the quality control and verification of these energy drink samples are also important.
Moreover, there are several producers, who distribute various products with different
compositions. In this work, we have developed quantitative models, and classification analyses
of energy drinks based on their most important ingredients and sugar content.
7
Materials and methods
Samples
91 energy drink samples in total were used for the determination of sugar content. They
contained 71 original, commercially available samples from Hungary, Slovakia and Greece.
Some original samples were used only in one part of the experiments (for example just for
caffeine concentration determination or for sugar concentration determination according to
Schoorl) and others were used in all cases. (It was necessary to allow some overlap between the
examinations, because the samples could not have been stored for longer periods unaltered.) The
other samples were mixtures of the original ones. It was necessary to extend our dataset with
mixtures, as we intended to cover the examined concentration range uniformly.
In the classifications, 108 samples were used to make a diverse dataset with specific
minor components (taurine, arginine).
For the determination of caffeine content, 42 original samples and 33 mixtures were used.
Most of the commercial samples in Hungary contain nominally 160 ppm or 320 ppm caffeine.
Thus the concentration range between the minimum and maximum values was extended with
mixtures (typical ratios were 1:1, 1:2, 1:3 and 1:4).
Sample preparation
For the HPLC-UV measurements the energy drink samples were sonicated in an
ultrasonic bath (type T2MODX; VWR) for 20 minutes; then, 50 µl of them was diluted to
1600 µl with ultra-pure water in vials. External calibration with peak area integration was used
8
for the quantification of total caffeine concentration in the energy drink samples. The calibration
points were the following: 2.5, 5.0, 10.0, and 20.0 ppm (because of the thirty-two-times dilution).
The only “sample pretreatment” step for FT-NIR analysis after the sonication was
pouring the samples into 10 ml vials.
High-performance liquid chromatography (HPLC-UV)
Methanol (MeOH; HPLC grade) was purchased from Scharlau (Barcelona, Spain). The
caffeine standard (≥98%) was obtained from the Sigma–Aldrich group (Schnelldorf, Germany).
Ultra-pure water (18.2 Mcm) was obtained from a Milli-Q system from Merck-Millipore
(Milford, MA, USA).
The international standard for the determination of caffeine content in coffee and coffee
products (ISO 20481:2008) was adapted for the energy drink samples. Briefly, an Agilent 1200
HPLC (Agilent Technologies, Santa Clara, CA, USA) system was used for the HPLC-UV based
quantification of caffeine. An Agilent Zorbax XDB C18 HPLC column (4.6 mm × 150 mm × 5.0
μm) was used in isocratic mode at 40 °C. The flow rate was 1 ml min-1
, the injection volume was
20 µl, while the chromatographic run lasted for 18 min. UV detection was carried out at 273 nm,
and additional peak purity measurements were executed at 260 nm in order to exclude samples
containing impurities in the retention window of caffeine.
Fourier-transform near infrared spectroscopy (FT-NIR)
A Bruker MPATM
Multipurpose FT-NIR analyzer (Bruker Optik GmbH, Ettlingen,
Germany) was used for FT-NIR measurements. The device is equipped with a quartz beam
splitter; an integrated RocksolidTM
interferometer; a thermostated sample compartment equipped
9
with a flow-through cuvette; a TE-InGaAs detector working in the 800–2500 nm wavelength
range (12500-4000 cm-1
wavenumber). OPUS 6.5 (Bruker Optik GmbH, Ettlingen, Germany)
software was integrated as a device manager. Transmission mode was used for the collection of
absorption spectra. The spectral resolution was 8 cm-1
, the scanner speed was 10 kHz and each
spectrum was the average spectrum of 32 subsequent scans. The samples were measured three
times, and averages were used for the further analysis. Derivation and standardization of the
spectra were used as data pretreatment methods in each case of model building.
Partial least-squares regression (PLS-R)
Partial least-square regression is one of the most commonly used multivariate regression
techniques. One of the most understandable and explanatory papers about PLS-R is the work of
P. Geladi and B. R. Kowalski [19]. Soon after being published, PLS-R became more and more
popular in the field of chemistry. The method is based on the regression between the PLS
components of the X (independent) and Y (dependent) variables. There is an interrelation
between the PLS components of the X and Y matrices, which can be assigned to the regression
coefficient, b. The number of latent variables (PLS components) is really important, if it is not
chosen in a proper way, then one can easily over- or underfit the model. One commonly used
method for choosing the optimal number is the minimum value of the root mean squared error of
cross-validation (RMSECV):
√∑ ( ̂ )
(1)

10
where ̂ denotes the predicted y values with cross-validation, is the measured y value and
N is the number of samples [20].
The validation of the regression models is also important. Sevenfold cross-validation, leave-one-
out cross-validation, internal test validation and external validation are the most common
techniques. However, cross-validation is probably the most widely used method for estimating
prediction error [21]. The goodness of the final regression models is determined with several
commonly used performance parameters like R2, Q
2, RMSECV, etc. R
2 is the coefficient of
determination for the calibration model, which can be calculated with the following equation
[22]:
∑ ( ̂ )
∑ ( ̅ )
(2)
where is the measured y value, ̂ is the predicted y value and ̅ is the mean of the measured
y values. Q2 is calculated with the same equation as R
2, but from the validation data. RSS is the
residual sum of squares and TSS is the total sum of squares. OPUS 6.5 [23] was applied for
PLSR model building.
Linear discriminant analysis (LDA) with the use of principal component (PC) scores
Linear discriminant analysis is another popular technique in the field of classification
methods [24]. It is a supervised method, i.e. we must know the class memberships before the
analysis. It is similar to principal component analysis (PCA), but here canonical variables (roots)
are calculated, and ellipses (or hyperellipsoids) are plotted around the points of the groups. The

11
discriminant function is defined as a line, which connects the intersections of the ellipses. If the
number of groups is N, the number of canonical variables is N-1.
LDA has a limitation in the number of variables, but PCA can compress the information
into a smaller number of variables, which can easily be used in linear discriminant analysis to
replace the original variables. Principal component analysis [25] can be thought of as the pair of
PLS-R in the multidimensional pattern recognition world, in terms of being as popular as PLS-R.
However, it cannot be used as a classification method, but only to recognize different patterns
and groupings in our dataset without the use of any dependent (grouping) variable(s). The basic
idea of this method is the following: the original dataset can be decomposed into two matrices, P
and T, where P contains the loadings and T contains the score vectors. The loading and score
vectors are calculated from the linear combinations of the original variables using orthonormality
as a constraint. The principal components explain parts of the variance in the original data matrix
in decreasing order.
STATISTICA 12 [26] was applied for both the PCA and LDA analyses.
Results and discussion
Determination of caffeine content
The 42 original energy drink samples were measured first with the HPLC-UV method.
The other 33 mixtures were prepared from the original ones. Since we knew the exact
concentration values and the used amounts in the mixtures, only a few mixture samples were
checked again with HPLC. Relative standard deviations were calculated for these samples: the

12
proportional error differences of standard deviation were below 5 % (5% threshold was chosen
by the authors). Every sample was measured three times with HPLC-UV and then the average of
the calculated caffeine concentrations were used for the FT-NIR measurements as reference
values. Peak purity was also checked for the method: the samples were measured at 260 nm, as
well. The results were compared with the original measurements at 270 nm, and there were no
significant differences according to the t test (the predefined error limit was 5 %). The running
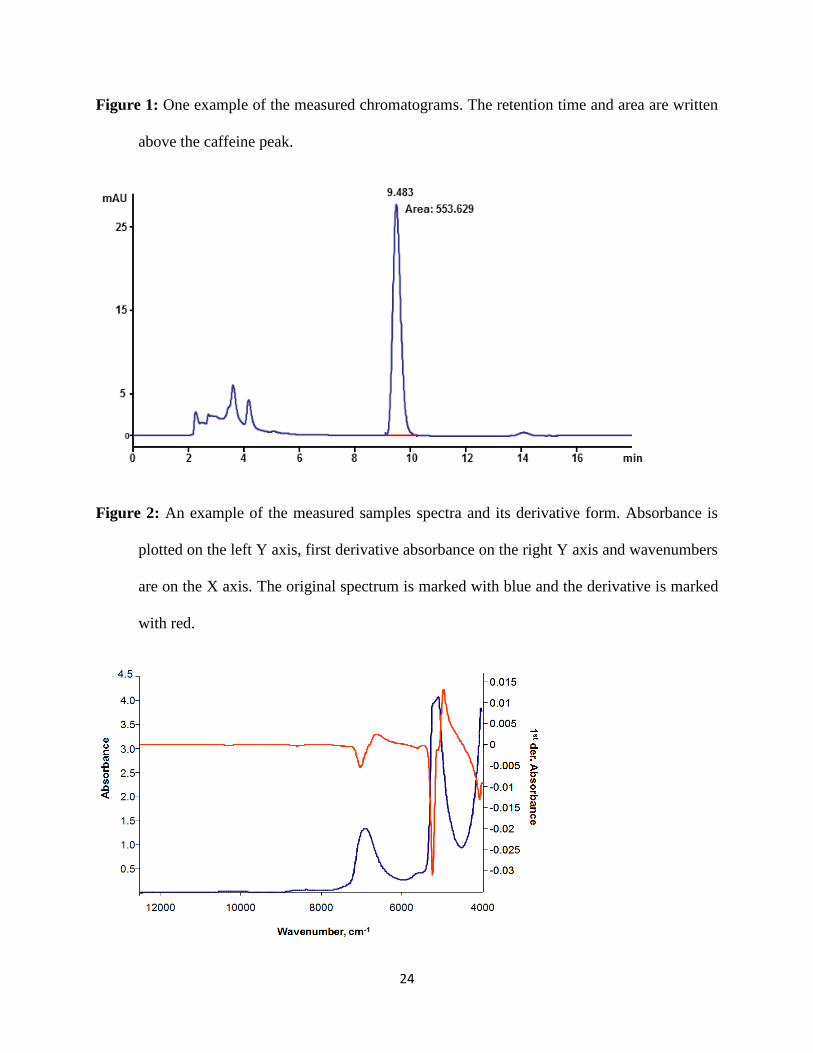
time of the HPLC-UV analysis was 18 minutes. The retention time for the caffeine peak was
around 9.5 minutes. One of the measured chromatograms can be seen on Figure 1 as an
example.
Figure 1
Every sample was examined three times from 10 ml vials with a quartz flow cuvette with
the FT-NIR analyzer. Figure 2 shows an example of the measured spectra and its derivative
form. The concentration range of caffeine was between 118 and 338 ppm, based on HPLC-UV
determination. This measurement was really delicate because the caffeine concentration was
really low in the samples compared to other components.
Figure 2
Principal component analysis was used for spectral outlier detection. There was no
spectral outlier in our dataset, thus the final number of samples was 75. Then, the models were
optimized with different wavelength selections and data preprocessing methods in OPUS 6.5
software. The applied data preprocessing methods were derivation and standardization (standard
normal variate). The number of smoothing points was 17. The selected wavenumber ranges
were: 12490 – 7498, 6102 – 5446 and 4605 – 4243 cm-1
. The number of latent variables was
13
eight, which was chosen by the global minimum of the root mean squared error of cross
validation (RMSECV).
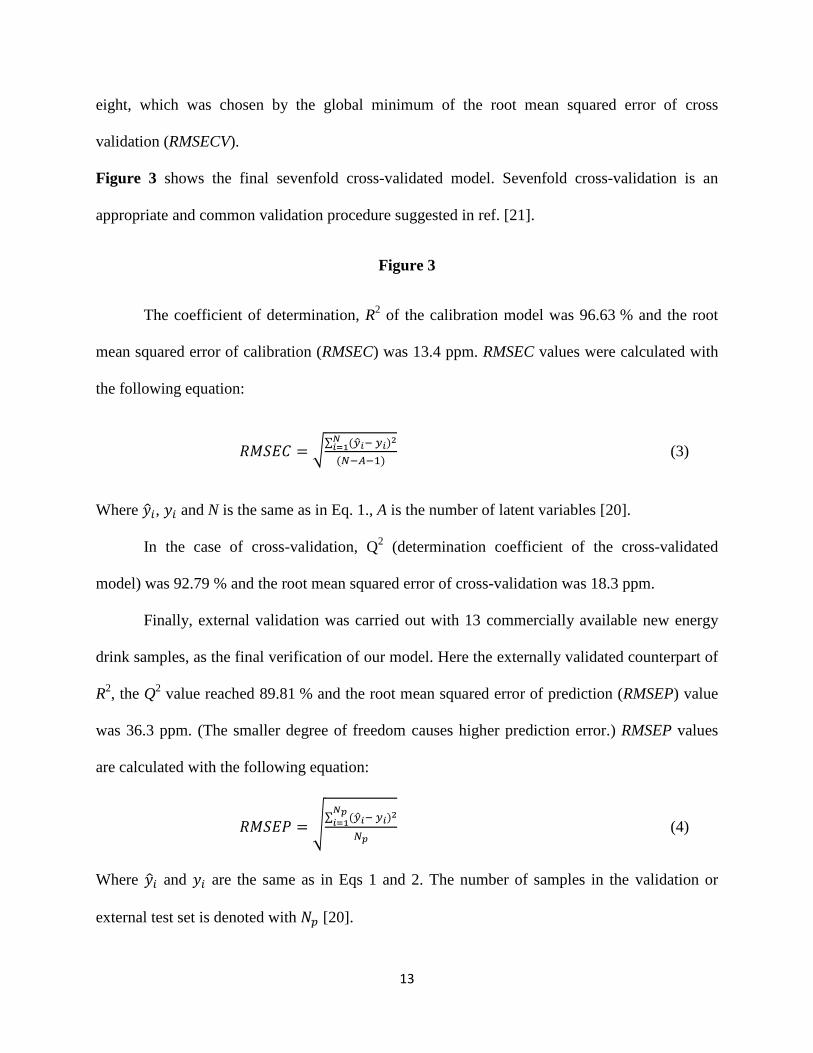
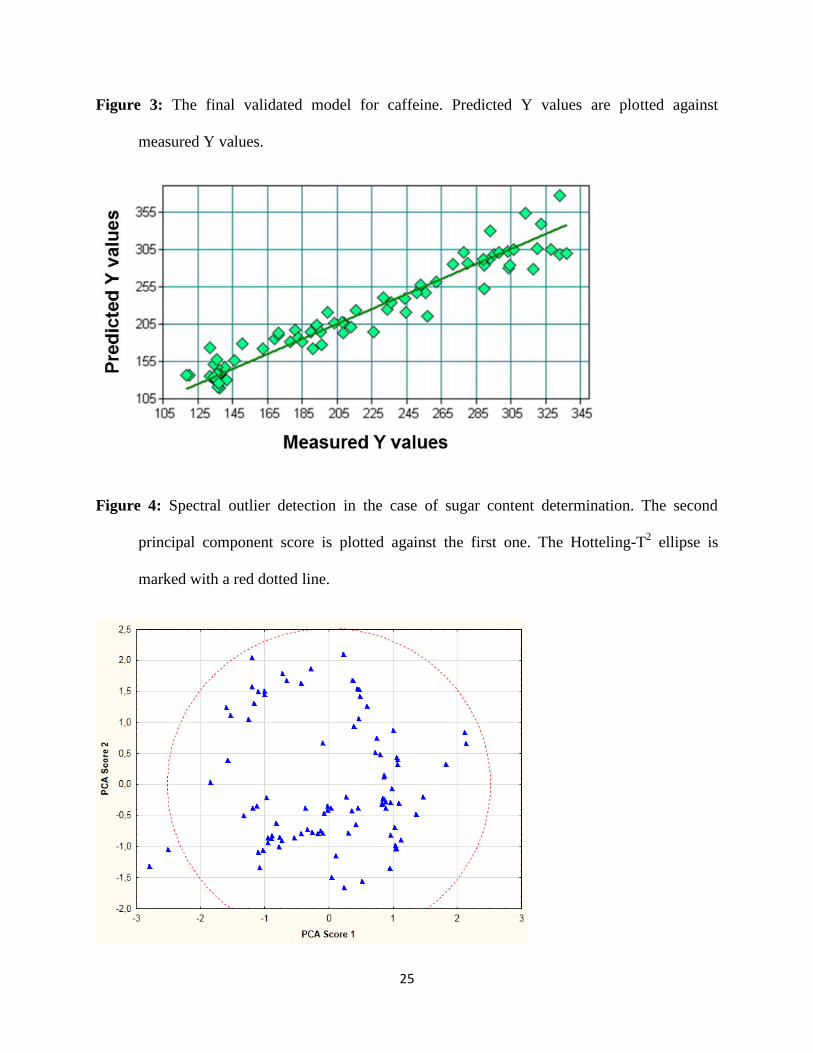
Figure 3 shows the final sevenfold cross-validated model. Sevenfold cross-validation is an
appropriate and common validation procedure suggested in ref. [21].
Figure 3
The coefficient of determination, R2 of the calibration model was 96.63 % and the root
mean squared error of calibration (RMSEC) was 13.4 ppm. RMSEC values were calculated with
the following equation:
√∑ ( ̂ )
( ) (3)
Where ̂ , and N is the same as in Eq. 1., A is the number of latent variables [20].
In the case of cross-validation, Q2 (determination coefficient of the cross-validated
model) was 92.79 % and the root mean squared error of cross-validation was 18.3 ppm.
Finally, external validation was carried out with 13 commercially available new energy
drink samples, as the final verification of our model. Here the externally validated counterpart of
R2, the Q
2 value reached 89.81 % and the root mean squared error of prediction (RMSEP) value
was 36.3 ppm. (The smaller degree of freedom causes higher prediction error.) RMSEP values
are calculated with the following equation:
√∑ ( ̂ )
(4)
Where ̂ and are the same as in Eqs 1 and 2. The number of samples in the validation or
external test set is denoted with [20].

14
The selected spectral areas can be assigned to functional groups and bonds such as
methyl antisymmetric and symmetric stretch 1st and 2
nd overtones [27], 1
st overtone of C–O and
N–H or CONH amide combination bands [28,29].
Determination of sugar content
71 original and 20 mixed samples (91 in all) were used for the determination of sugar
content in the energy drinks. The mixture samples were made from the original ones with the use
of different mixing ratios. (The producers prefer the usage of dedicated few typical sugar
concentrations; thus, we had to extend the number of samples with mixtures for a better
coverage.)
The Schoorl method was used as the reference for the determination of sugar
concentration. This method is frequently used for the determination of sugar content in food
analysis. The applied technique was based on an AOAC standard [30]. 75 of the 91 samples were
chosen and measured in this way. However, the method has a large bias and relatively large
standard deviation (namely 12.4 %), especially in the range of small amounts of sugar (1-2
g/100ml). Thus we decided to use and compare both of the original (indicated on the can) and the
measured values, because the nominal concentrations have less error (based on a simple
weighing).
In this case every sample was analyzed three times from 10 ml vials in a quartz flow
cuvette with an FT-NIR analyzer, as well. The average of the spectra was used for further
chemometric analysis. First, PCA was applied to detect spectral outliers. The result is shown in
15
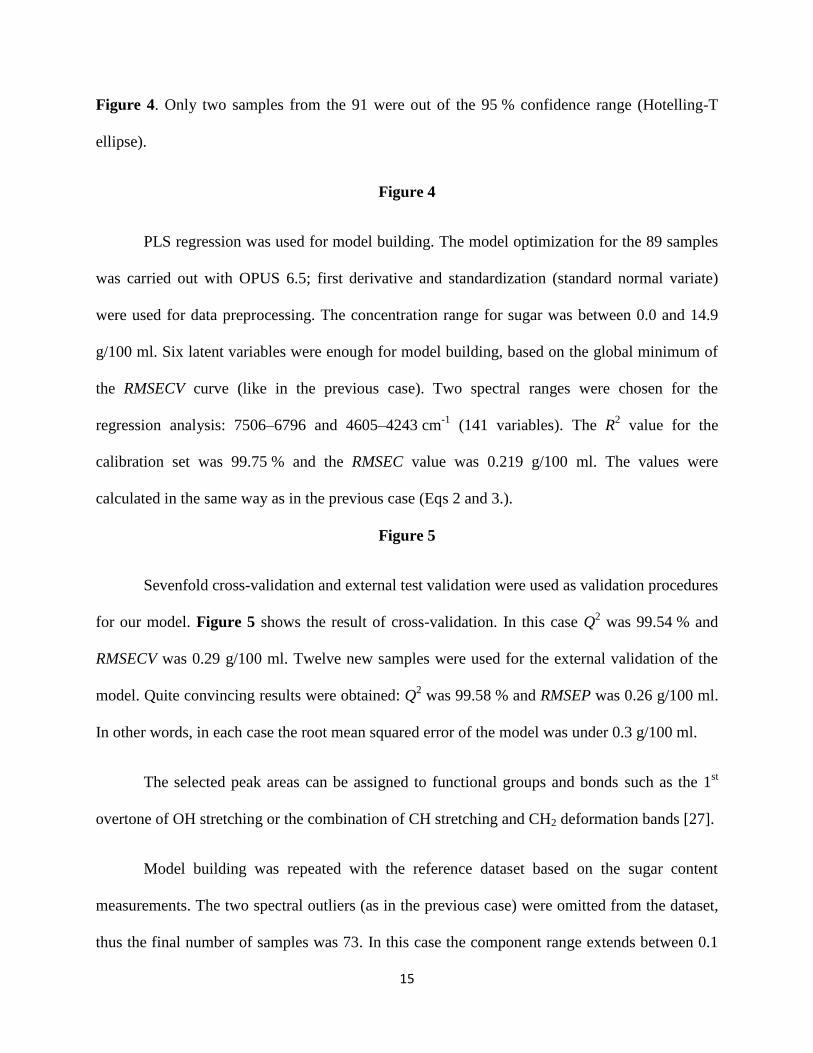
Figure 4. Only two samples from the 91 were out of the 95 % confidence range (Hotelling-T
ellipse).
Figure 4
PLS regression was used for model building. The model optimization for the 89 samples
was carried out with OPUS 6.5; first derivative and standardization (standard normal variate)
were used for data preprocessing. The concentration range for sugar was between 0.0 and 14.9
g/100 ml. Six latent variables were enough for model building, based on the global minimum of
the RMSECV curve (like in the previous case). Two spectral ranges were chosen for the
regression analysis: 7506–6796 and 4605–4243 cm-1
(141 variables). The R2 value for the
calibration set was 99.75 % and the RMSEC value was 0.219 g/100 ml. The values were
calculated in the same way as in the previous case (Eqs 2 and 3.).
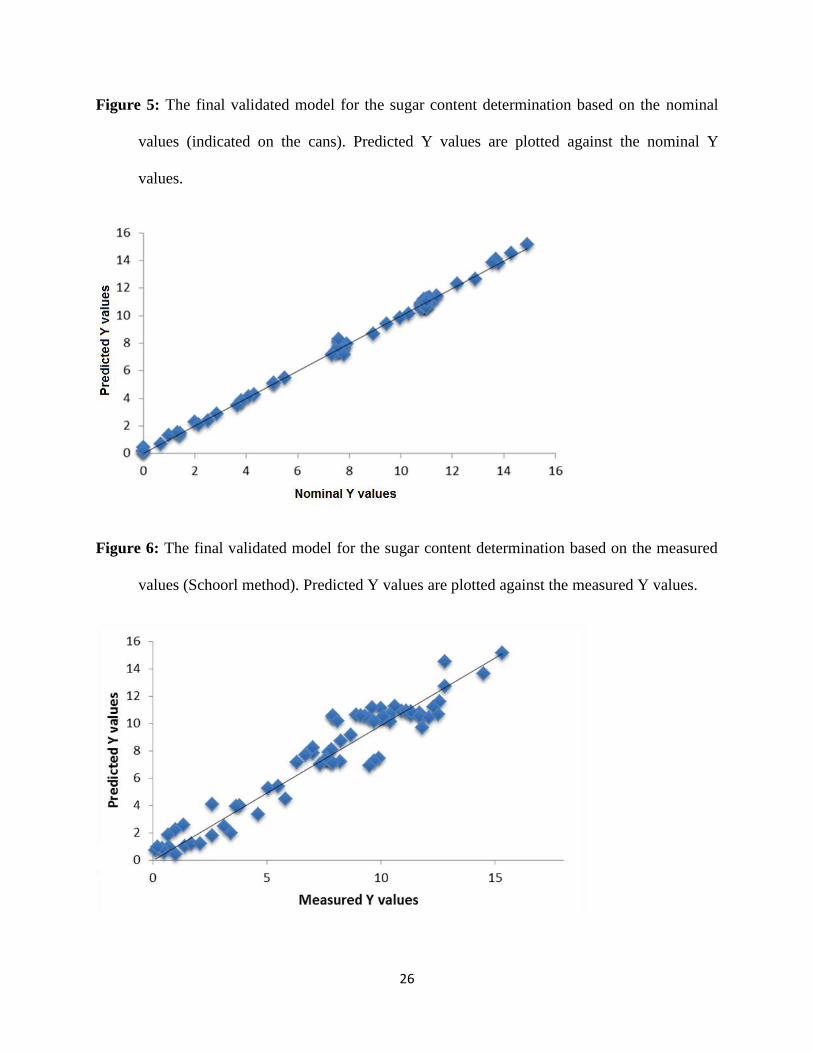
Figure 5
Sevenfold cross-validation and external test validation were used as validation procedures
for our model. Figure 5 shows the result of cross-validation. In this case Q2 was 99.54 % and
RMSECV was 0.29 g/100 ml. Twelve new samples were used for the external validation of the
model. Quite convincing results were obtained: Q2 was 99.58 % and RMSEP was 0.26 g/100 ml.
In other words, in each case the root mean squared error of the model was under 0.3 g/100 ml.
The selected peak areas can be assigned to functional groups and bonds such as the 1st
overtone of OH stretching or the combination of CH stretching and CH2 deformation bands [27].
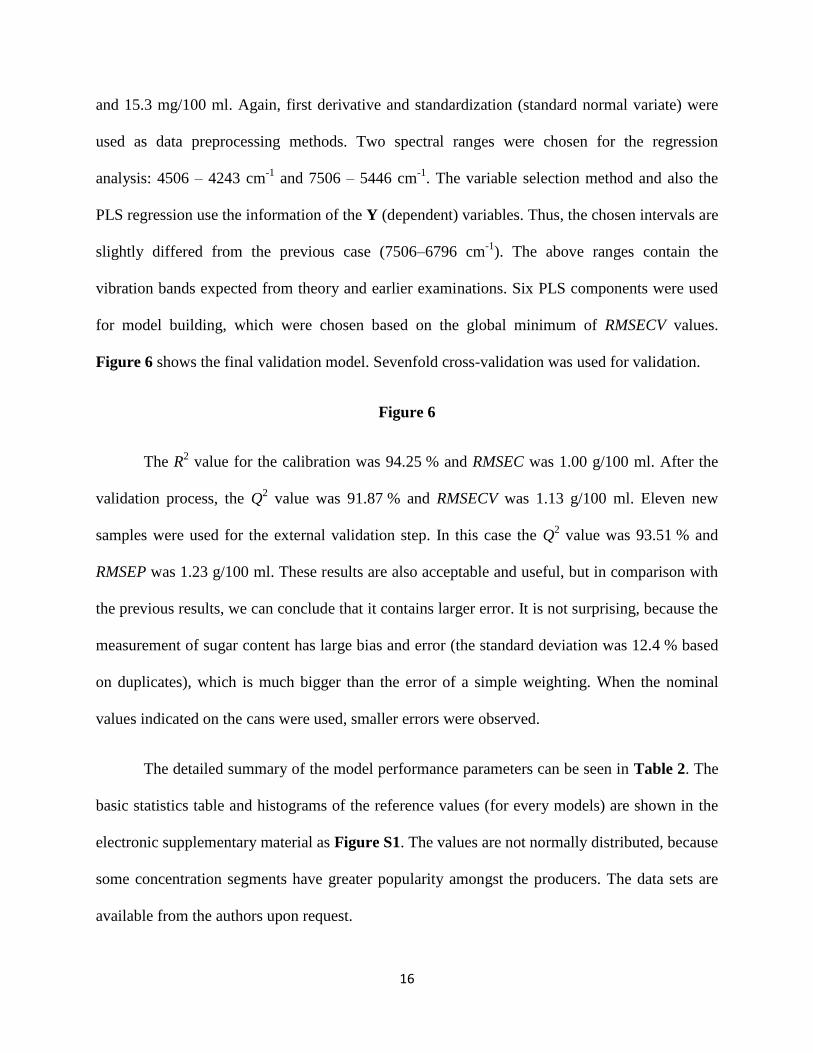
Model building was repeated with the reference dataset based on the sugar content
measurements. The two spectral outliers (as in the previous case) were omitted from the dataset,
thus the final number of samples was 73. In this case the component range extends between 0.1
16
and 15.3 mg/100 ml. Again, first derivative and standardization (standard normal variate) were
used as data preprocessing methods. Two spectral ranges were chosen for the regression
analysis: 4506 – 4243 cm-1
and 7506 – 5446 cm-1
. The variable selection method and also the
PLS regression use the information of the Y (dependent) variables. Thus, the chosen intervals are
slightly differed from the previous case (7506–6796 cm-1
). The above ranges contain the
vibration bands expected from theory and earlier examinations. Six PLS components were used
for model building, which were chosen based on the global minimum of RMSECV values.
Figure 6 shows the final validation model. Sevenfold cross-validation was used for validation.
Figure 6
The R2 value for the calibration was 94.25 % and RMSEC was 1.00 g/100 ml. After the
validation process, the Q2 value was 91.87 % and RMSECV was 1.13 g/100 ml. Eleven new
samples were used for the external validation step. In this case the Q2 value was 93.51 % and
RMSEP was 1.23 g/100 ml. These results are also acceptable and useful, but in comparison with
the previous results, we can conclude that it contains larger error. It is not surprising, because the
measurement of sugar content has large bias and error (the standard deviation was 12.4 % based
on duplicates), which is much bigger than the error of a simple weighting. When the nominal
values indicated on the cans were used, smaller errors were observed.
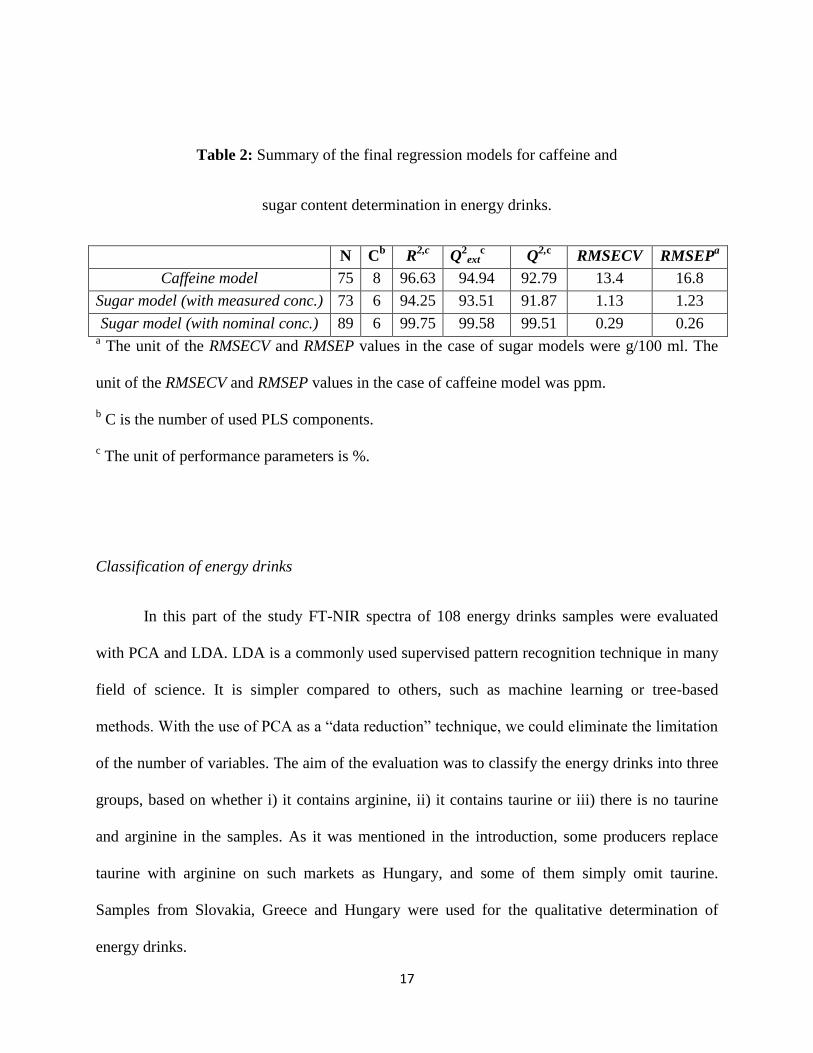
The detailed summary of the model performance parameters can be seen in Table 2. The
basic statistics table and histograms of the reference values (for every models) are shown in the
electronic supplementary material as Figure S1. The values are not normally distributed, because
some concentration segments have greater popularity amongst the producers. The data sets are
available from the authors upon request.
17
Table 2: Summary of the final regression models for caffeine and
sugar content determination in energy drinks.
N Cb
R2,c
Q2
extc Q
2,c RMSECV
a
RMSEPa
Caffeine model 75 8 96.63 94.94 92.79 13.4 16.8
Sugar model (with measured conc.) 73 6 94.25 93.51 91.87 1.13 1.23
Sugar model (with nominal conc.) 89 6 99.75 99.58 99.51 0.29 0.26 a The unit of the RMSECV and RMSEP values in the case of sugar models were g/100 ml. The
unit of the RMSECV and RMSEP values in the case of caffeine model was ppm.
b C is the number of used PLS components.
c The unit of performance parameters is %.
Classification of energy drinks
In this part of the study FT-NIR spectra of 108 energy drinks samples were evaluated
with PCA and LDA. LDA is a commonly used supervised pattern recognition technique in many
field of science. It is simpler compared to others, such as machine learning or tree-based
methods. With the use of PCA as a “data reduction” technique, we could eliminate the limitation
of the number of variables. The aim of the evaluation was to classify the energy drinks into three
groups, based on whether i) it contains arginine, ii) it contains taurine or iii) there is no taurine
and arginine in the samples. As it was mentioned in the introduction, some producers replace
taurine with arginine on such markets as Hungary, and some of them simply omit taurine.
Samples from Slovakia, Greece and Hungary were used for the qualitative determination of
energy drinks.
18
In the first step, the average spectra of the samples from 12500 to 4000 cm-1
were used for
principal component analysis. Standardization (standard normal variate) was applied as data
preprocessing. After that the first twenty PCA scores were used for the further analysis with
LDA.
LDA, as implemented in StatisticaTM
(Tulsa, Oklahoma, USA) has different options to
choose the significant variables for model building, such as forward stepwise, backward stepwise
or all effects. Forward stepwise model building method and threefold cross-validation were
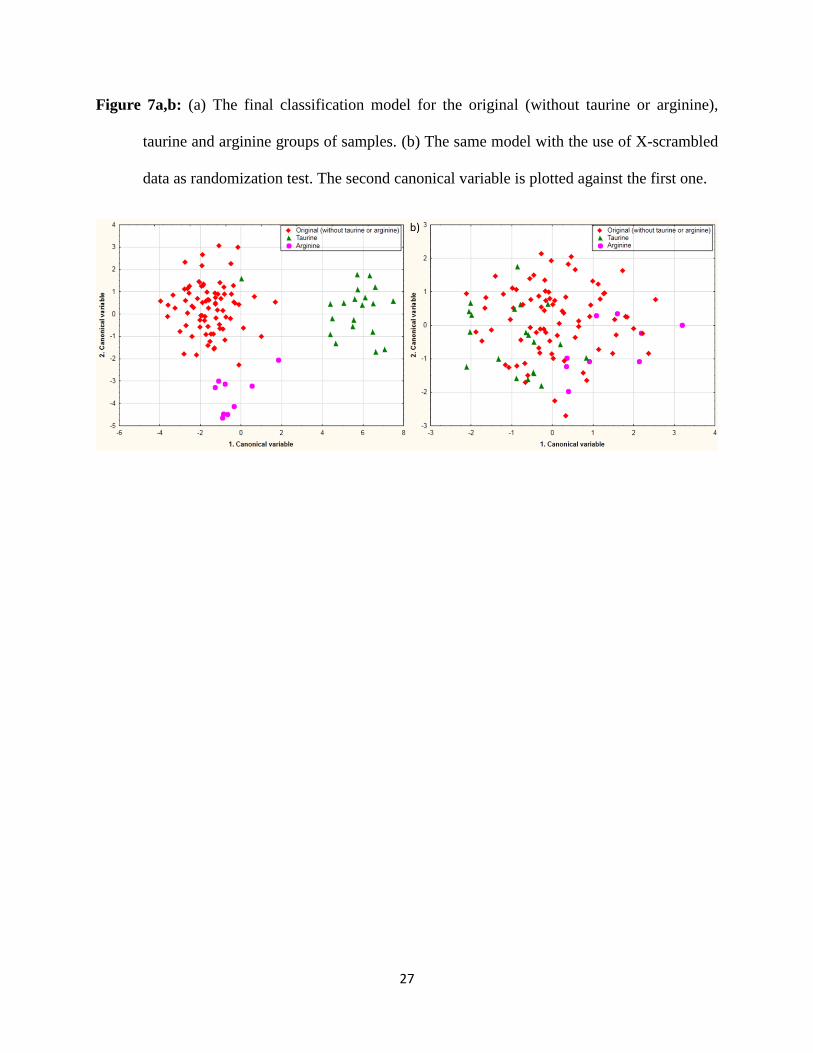
applied in the evaluation. Proper validation is very important; it should be tested, whether the
results are artefacts or not. For this purpose as another validation method for the model, X-
scrambling randomization test was used three times. Figure 7ab shows the final result with the
comparison of a typical example for X-scrambling validation model. The three earlier mentioned
groups can be clearly classified based on LDA and PCA analysis (and only FT-NIR spectra) and
the validation of the model returned good results as well. The correct classification rate of the
cross-validated model was 95.68 %.
Figure 7ab
Conclusion
The application of FT-NIR spectroscopy for the quantitative determination of caffeine
and sugar concentrations in energy drinks is a great opportunity, not just because it saves time
and money, but all of the validated models’ R2 values are above the 90.0 % level (see details in
Table 2). The models can replace HPLC and other frequently used (but time- and money-
consuming) methods in the field of the determination of caffeine and sugar concentration.
Almost a hundred energy drink samples were examined, thus these models cover virtually the

19
whole market of commercial energy drinks in Hungary. In the case of sugar content
determination, we can reach better models with the use of nominal concentrations, instead of
using the Schrool-method; it means that the latter method has a larger bias than the simple
weighing.
The samples with arginine, taurine or without them were clearly classified with PCA and
LDA analysis with a 95.7 % correct classification rate. The classification of these samples based
on our grouping system can be used for the verification and detection of adulteration of the
energy drinks. This type of classification of energy drinks is unique in the literature.
Acknowledgements
The authors would like to thank Dr. Mihály Dernovics and Andrea Vass for their help and
the useful advices in HPLC-UV measurements and Csilla Biróova for her help in sugar content
measurements.
Conflict of Interest
The authors declare that they have no conflict of interest.
20
References
[1] Reissig CJ, Strain EC, Griffiths RR. Caffeinated energy drinks-A growing problem. Drug
Alcohol Depend. 2009;99:1–10.
[2] Seifert SM, Schaechter JL, Hershorin ER, Lipshultz SE. Health effects of energy drinks
on children, adolescents, and young adults. Pediatrics. 2011;127:511–28.
[3] Heckman MA, Weil J, de Mejia EG. Caffeine (1, 3, 7-trimethylxanthine) in foods: A
comprehensive review on consumption, functionality, safety, and regulatory matters. J
Food Sci. 2010;75:77–87.
[4] Malik VS, Schulze MB, Hu FB. Intake of sugar-sweetened beverages and weight gain : a
systematic review. Am J Clin Nutr. 2006;84:274–88.
[5] Malinauskas BM, Aeby VG, Overton RF, Carpenter-Aeby T, Barber-Heidal K. A survey
of energy drink consumption patterns among college students. Nutr J. 2007;6:35.
[6] Ferreira SE, de Mello MT, Pompéia S, de Souza-Formigoni MLO. Effects of energy drink
ingestion on alcohol intoxication. Alcohol Clin Exp Res. 2006;30:598–605.
[7] O’Brien MC, McCoy TP, Rhodes SD, Wagoner A, Wolfson M. Caffeinated cocktails:
Energy drink consumption, high-risk drinking, and alcohol-related consequences among
college students. Acad Emerg Med. 2008;15:453–60.
[8] Armenta S, Garrigues S, de la Guardia M. Solid-phase FT-Raman determination of
caffeine in energy drinks. Anal Chim Acta. 2005;547:197–203.
[9] Pieszko C, Baranowska I, Flores A. Determination of energizers in energy drinks. J Anal

21
Chem. 2010;65:1228–34.
[10] Abourashed EA, Mossa JS. HPTLC determination of caffeine in stimulant herbal products
and power drinks. J Pharm Biomed Anal. 2004;36:617–20.
[11] Sereshti H, Samadi S. A rapid and simple determination of caffeine in teas, coffees and
eight beverages. Food Chem. 2014;158:8–13.
[12] Grant DC, Helleur RJ. Simultaneous analysis of vitamins and caffeine in energy drinks by
surfactant-mediated matrix-assisted laser desorption/ionization. Anal Bioanal Chem.
2008;391:2811–8.
[13] Vochyánová B, Opekar F, Tůma P, Štulík K. Rapid determinations of saccharides in high-
energy drinks by short-capillary electrophoresis with contactless conductivity detection.
Anal Bioanal Chem. 2012;404:1549–54.
[14] Lucena R, Cárdenas S, Gallego M, Valcárcel M. Continuous flow autoanalyzer for the
sequential determination of total sugars, colorant and caffeine contents in soft drinks. Anal
Chim Acta. 2005;530:283–9.
[15] Aranda M, Morlock G. Simultaneous determination of riboflavin, pyridoxine,
nicotinamide, caffeine and taurine in energy drinks by planar chromatography-multiple
detection with confirmation by electrospray ionization mass spectrometry. J Chromatogr
A. 2006;1131:253–60.
[16] Khasanov V V., Slizhov YG, Khasanov V V. Energy drink analysis by capillary
electrophoresis. J Anal Chem. 2013;68:357–9.
[17] Huck CW, Guggenbichler W, Bonn GK. Analysis of caffeine, theobromine and
22
theophylline in coffee by near infrared spectroscopy (NIRS) compared to high-
performance liquid chromatography (HPLC) coupled to mass spectrometry. Anal Chim
Acta. 2005;538:195–203.
[18] Zhang X, Li W, Yin B, Chen W, Kelly DP, Wang X, et al. Improvement of near infrared
spectroscopic (NIRS) analysis of caffeine in roasted arabica coffee by variable selection
method of stability competitive adaptive reweighted sampling (SCARS). Spectrochim
Acta - Part A Mol Biomol Spectrosc. 2013;114:350–6.
[19] Geladi P, Kowalski BR. Partial least-squares regression: a tutorial. Anal Chim Acta.
1986;185:1–17.
[20] Naes T, Isaksson T, Fearn T, Davies T. Validation. A user-friendly Guid. to Multivar.
Calibration Classif., Chicester: NIR Publications; 2002, pp. 155–75.
[21] Hastie T, Tibshirani R, Friedman J. Model Assessment and Selection. Elem. Stat. Learn.
Data Mining, Inference, Predict., Springer, New York; 2001, pp. 214–6.
[22] Rácz A, Bajusz D, Héberger K. Consistency of QSAR models: Correct split of training
and test sets, ranking of models and performance parameters. SAR QSAR Environ Res.
2015;26:683–700.
[23] Bruker Corporation, Billerica, MA U. OPUS 6.5 n.d.
[24] Hastie T, Tibshirani R, Friedman J. Linear Methods for Classification. Elem. Stat. Learn.
Data Mining, Inference, Predict., Springer, New York; 2001, pp. 84–90.
[25] Wold S, Esbensen K, Geladi P. Principal component analysis. Chemom Intell Lab Syst.
1987;2:37–52.
23
[26] Statsoft Inc., Tulsa, OK U. STATISTICA 12 n.d.
[27] Workman J, Jr. Functional groupings and calculated locations in wavenumbers (cm-1) for
IR spectroscopy. Handb. Org. Compd. NIR, IR, Raman, UV-Vis Spectra Featur. Polym.
Surfactants, San Diego: Academic Press; 2000, pp. 229–36.
[28] Magalhães LM, Machado S, Segundo MA, Lopes JA, Páscoa RNMJ. Rapid assessment of
bioactive phenolics and methylxanthines in spent coffee grounds by FT-NIR
spectroscopy. Talanta. 2016;147:460–7.
[29] Ribeiro JS, Ferreira MMC, Salva TJG. Chemometric models for the quantitative
descriptive sensory analysis of Arabica coffee beverages using near infrared spectroscopy.
Talanta. 2011;83:1352–8.
[30] Horovitz W. Sugar and Sugar products. Off. methods Anal. Assoc. Off. Anal. Chem.,
Washington, USA: AOAC; 1975, p. 573.
24
Figure 1: One example of the measured chromatograms. The retention time and area are written
above the caffeine peak.
Figure 2: An example of the measured samples spectra and its derivative form. Absorbance is
plotted on the left Y axis, first derivative absorbance on the right Y axis and wavenumbers
are on the X axis. The original spectrum is marked with blue and the derivative is marked
with red.
25
Figure 3: The final validated model for caffeine. Predicted Y values are plotted against
measured Y values.
Figure 4: Spectral outlier detection in the case of sugar content determination. The second
principal component score is plotted against the first one. The Hotteling-T2 ellipse is
marked with a red dotted line.
26
Figure 5: The final validated model for the sugar content determination based on the nominal
values (indicated on the cans). Predicted Y values are plotted against the nominal Y
values.
Figure 6: The final validated model for the sugar content determination based on the measured
values (Schoorl method). Predicted Y values are plotted against the measured Y values.
27
Figure 7a,b: (a) The final classification model for the original (without taurine or arginine),
taurine and arginine groups of samples. (b) The same model with the use of X-scrambled
data as randomization test. The second canonical variable is plotted against the first one.