quantitative determination of ochratoxin a by liquid chromatography/electrospray tandem mass...
TRANSCRIPT
JOURNAL OF MASS SPECTROMETRYJ. Mass Spectrom. 35, 23–32 (2000)
Quantitative determination of ochratoxin A byliquid chromatography/electrospray tandemmass spectrometry
B. P.-Y. Lau,* P. M. Scott, D. A. Lewis and S. R. KanhereHealth Canada, Health Protection Branch, Food Research Division, Address Locator 2203D, Tunney’s Pasture, Ottawa,Ontario, Canada K1A 0L2
Mass spectrometry of ochratoxin A (OTA) and B (OTB) under electrospray ionization (ESI) and atmosphericpressure chemical ionization (APCI) was studied. ESI offers higher sensitivities and less fragmentation thanAPCI. A sensitive LC/MS/MS method for the determination of ochratoxin A (OTA) in human plasma sampleswas developed. The absolute minimum detection limit was around 10–20 pg per injection, corresponding to0.5 ppb in an injection equivalent to 20–40µg of human plasma. Ochratoxin B (OTB) was used as an internalstandard and its absence in real-life samples was carefully checked before samples were spiked with the internalstandard. It was found that these two ochratoxins are susceptible to sodium adduct formation. Fragmentions from the [M Y H]Y and [M Y Na]Y ions of both OTA and OTB were monitored in the multiple reactionmonitoring mode. Three quantitative approaches, standard addition method, internal standard method (usingochratoxin B as an internal standard) and external standard method, were compared in the analysis of humanblood plasma. Results from the mass spectrometric method were comparable to those from a conventionalLC/fluorescence method. The LC/MS/MS method was also applied to the analysis of contaminated coffeesamples. Copyright 2000 John Wiley & Sons, Ltd.
KEYWORDS: ochratoxin A; ochratoxin B; electrospray ionization; liquid chromatography/mass spectrometry; tandem massspectrometry
INTRODUCTION
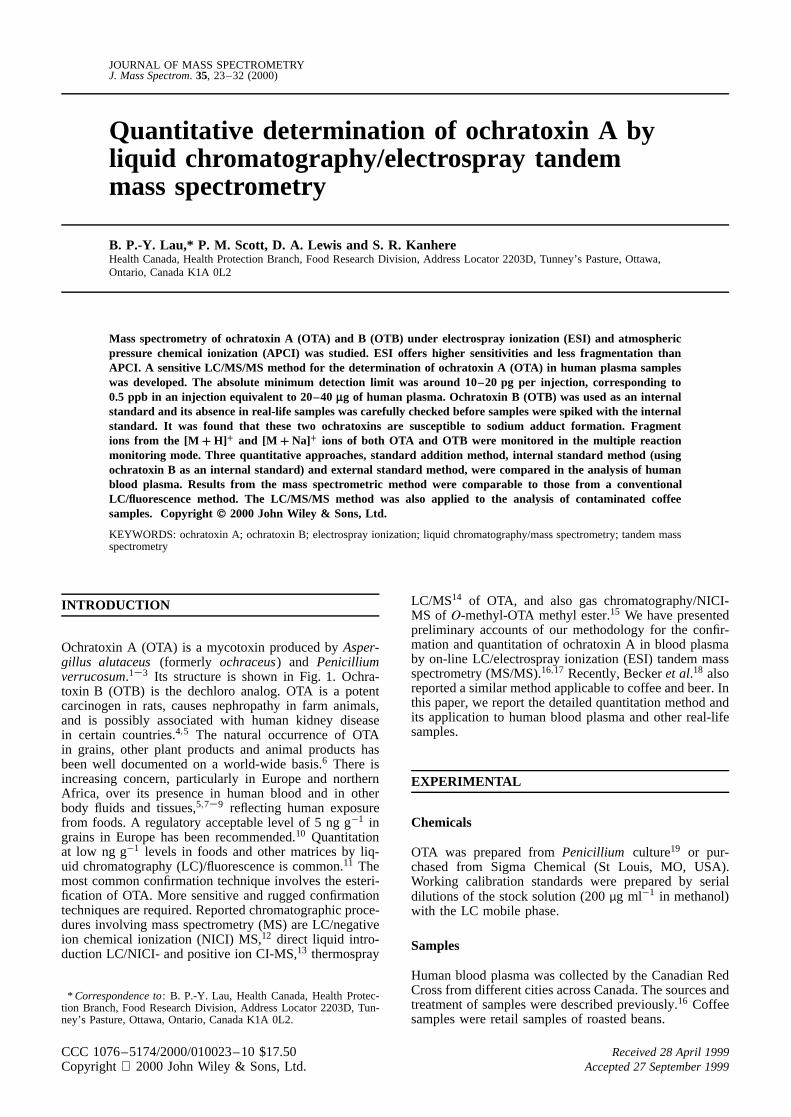
Ochratoxin A (OTA) is a mycotoxin produced byAsper-gillus alutaceus (formerly ochraceus) and Penicilliumverrucosum.1–3 Its structure is shown in Fig. 1. Ochra-toxin B (OTB) is the dechloro analog. OTA is a potentcarcinogen in rats, causes nephropathy in farm animals,and is possibly associated with human kidney diseasein certain countries.4,5 The natural occurrence of OTAin grains, other plant products and animal products hasbeen well documented on a world-wide basis.6 There isincreasing concern, particularly in Europe and northernAfrica, over its presence in human blood and in otherbody fluids and tissues,5,7–9 reflecting human exposurefrom foods. A regulatory acceptable level of 5 ng g�1 ingrains in Europe has been recommended.10 Quantitationat low ng g�1 levels in foods and other matrices by liq-uid chromatography (LC)/fluorescence is common.11 Themost common confirmation technique involves the esteri-fication of OTA. More sensitive and rugged confirmationtechniques are required. Reported chromatographic proce-dures involving mass spectrometry (MS) are LC/negativeion chemical ionization (NICI) MS,12 direct liquid intro-duction LC/NICI- and positive ion CI-MS,13 thermospray
* Correspondence to: B. P.-Y. Lau, Health Canada, Health Protec-tion Branch, Food Research Division, Address Locator 2203D, Tun-ney’s Pasture, Ottawa, Ontario, Canada K1A 0L2.
LC/MS14 of OTA, and also gas chromatography/NICI-MS of O-methyl-OTA methyl ester.15 We have presentedpreliminary accounts of our methodology for the confir-mation and quantitation of ochratoxin A in blood plasmaby on-line LC/electrospray ionization (ESI) tandem massspectrometry (MS/MS).16,17 Recently, Beckeret al.18 alsoreported a similar method applicable to coffee and beer. Inthis paper, we report the detailed quantitation method andits application to human blood plasma and other real-lifesamples.
EXPERIMENTAL
Chemicals
OTA was prepared fromPenicillium culture19 or pur-chased from Sigma Chemical (St Louis, MO, USA).Working calibration standards were prepared by serialdilutions of the stock solution (200µg ml�1 in methanol)with the LC mobile phase.
Samples
Human blood plasma was collected by the Canadian RedCross from different cities across Canada. The sources andtreatment of samples were described previously.16 Coffeesamples were retail samples of roasted beans.
CCC 1076–5174/2000/010023–10 $17.50 Received 28 April 1999Copyright 2000 John Wiley & Sons, Ltd. Accepted 27 September 1999
24 B. P.-Y. LAU ET AL.
Figure 1. Structures of ochratoxin A (OTA) and ochratoxin B(OTB).
Extraction and clean-up method
A detailed description of the extraction and clean-upmethods has been published.17 In brief, 1 ml of plasmawas mixed with 0.25 ml of saturated NaCl solution and5 ml of methanol. The volume of solution was recordedafter centrifugation and a correction was made to com-pensate for the volume of anti-coagulant in the plasma.The plasma methanol extract was mixed with 5 ml of0.015M orthophosphoric acid and then subjected to solid-phase extraction (SPE) (Supelclean LC-18 from Supelco)clean-up. After the SPE cartridge had been washedwith 5 ml of 0.015M orthophosphoric acid and 5 ml ofmethanol–0.015M orthophosphoric acid (1 : 1), OTA waseluted with 2 ml of methanol.
Further purification was achieved by passing theextract in 3ð 2.5 ml of methanol–phosphate-bufferedsaline (PBS) solution (85 : 15) through an OchraTestimmunoaffinity column (Vicam, Watertown, MA, USA).After the column had been washed with 5 ml ofmethanol–PBS and 10 ml of distilled water, OTA waseluted with 3 ml of methanol. The eluate was evaporatedto dryness under nitrogen and the residue was dissolvedin 0.25 ml of methanol for LC/fluorescence or 0.25 ml ofmobile phase for LC/MS/MS analyses.
Ground coffee was extracted in the Winnipeg labo-ratory, using methanol–3% aqueous sodium hydrogen-carbonate (1 : 1), followed by immunoaffinity columnclean-up.20,21
LC/fluorescence determination
A 250 mmð 3.2 mm i.d. Ultratechsphere ODS LC col-umn (5µm particle size; HPLC Technology, Mac-clesfield, UK) was used. For plasma analysis, themobile phase, acetonitrile–methanol–0.15M orthophos-phoric acid (1 : 1 : 1), was delivered isocratically at a flow-rate of 0.8 ml min�1 by a Shimadzu LC-10AD HPLCpump. Detection of OTA was achieved by using a Shi-madzu RF-551 fluorescence detector with excitation andemission wavelengths set at 330 and 470 nm, respectively.
For coffee analysis, using equivalent instrumentation,the mobile phases were (A) acetronitrile–water–aceticacid (850 : 1130 : 20) and (B) acetonitrile–acetic acid(99 : 1) and the gradient was 100% A for 12.5 min andthen programmed to 39% A at 30 min. The fluorescenceemission wavelength was also changed to 440 nm.
LC/MS and LC/MS/MS
A 10 cmð 4.6 mm i.d. TSK-GEL super-ODS column(2 µm particle size; TosoHaas, Montgomeryville, PA,USA) was used in our early development work andwas replaced by a 250ð 2.1 mm i.d. CSC-InertSil-ODS2column (5µm particle size) (CSC, Canada) in laterexperiments. Mobile phase (0.17% (v/v) formic acidin acetonitrile–methanol–water (1 : 1 : 1) was deliveredisocratically by a Hewlett-Packard Model HP-1100 LCsystem (including binary pumps, degasser, autosamplerand variable-wavelength UV detector) at a constant flow-rate of 0.6 ml min�1 for the TSK-GEL column and0.2 ml min�1 for the InertSil-ODS2 column. In theformer case, a splitter (constructed from a Valco low-dead volume tee and appropriate length of 0.17 mm i.d.PEEK tubing to achieve the desired split ratio) wasused to reduce the LC effluent to 0.1–0.2 ml min�1
for the electrospray ionization (ESI) LC/MS interface,whereas no splitting was employed when the InertSilcolumn was used. Flow injections were made by meansof a Rheodyne Model 7125 injector for all MS scanningmode experiments and the autosampler was used for allinjections using the selected ion monitoring (SIM) andmultiple reaction monitoring (MRM) modes. Volumes of10–20µl of the extract were injected.
A Quattro II (Micromass, UK) triple-quadrupole tan-dem mass spectrometer equipped with an ESI ion sourceand an atmospheric pressure chemical ionization (APCI)ion source was used. Data acquisition, data processingand instrument control were performed through MicrosoftWindows-NT (v3.51)-based MassLynx software (Micro-mass) on a Pentium Pro (Digital Equipment) computer.The following operating parameters were used: sourcetemperature, 80°C; nebulizing gas, 15 l h�1; drying gas,450 l h�1; ESI capillary voltage,C3.5 kV. The coronadischarge voltage was 3.0 kV and the sheath gas was250 l h�1 in the APCI mode.
The scan ranges werem/z 150–600 in single MS modeandm/z 100–420 in the MS/MS mode, both at a scan rateof 1.5 s per scan. The skimmer lens (between the samplecone and the skimmer) voltage was set at 5 V higher thanthe cone voltage whereas the skimmer was maintained at1.5 V. For SIM, ions monitored for OTA werem/z 404,386, 358 and 239, each for a dwell time of 0.2 s with
Copyright 2000 John Wiley & Sons, Ltd. J. Mass Spectrom. 35, 23–32 (2000)

DETERMINATION OF OCHRATOXIN A BY LC/ES-MS/MS 25
the cone voltage set at 35 V. In the MS/MS mode, thecone voltage was reduced to 27 V to maximize the parent([M C H]C) ion abundances.
MRM was performed using the following parent-to-fragment transitions:m/z 426! 261, 404! 358 and404! 239 for OTA andm/z 392! 227, 370! 324 and370! 205 for OTB, each with a dwell time of 0.25 s;an inter-channel delay of 0.02 s and a span of 0.1 Dawere used. The cone voltage and collision energy foreach transition were programmed as described in Table 1through the MassLynx acquisition software. The colli-sion gas (argon) pressure was 2.7ð 10�3 mbar. The massspectrometer resolution was set at¾10% valley separa-tion between adjacent masses for both mass analyzers.SIM and MRM data were smoothed twice for every twoadjacent data points to improve peak detection.
Quantitation
External standard method.Calibration curves were con-structed from the responses of each ion monitored plusthe total ion current for OTA and OTB.
Internal standard method.While the concentration of internalstandard (OTB) was maintained constant, the OTA/OTBresponse ratios were plotted against the concentrationof OTA.
Table 1. MRM parameters for OTA and OTB (internalstandard)
Transition Identity of Cone Collision(m/z) fragment ion voltage (V) energy (V)
370! 205 [MOTB C H]� C9H11O2N 27 20370! 324 [MOTB C H]� HCOOH 27 13392! 227 [MOTB CNa]� C9H11O2N 35 20404! 239 [MOTA C H]� C9H11O2N 27 25404! 358 [MOTA C H]� HCOOH 27 13426! 261 [MOTA CNa]� C9H11O2N 35 20
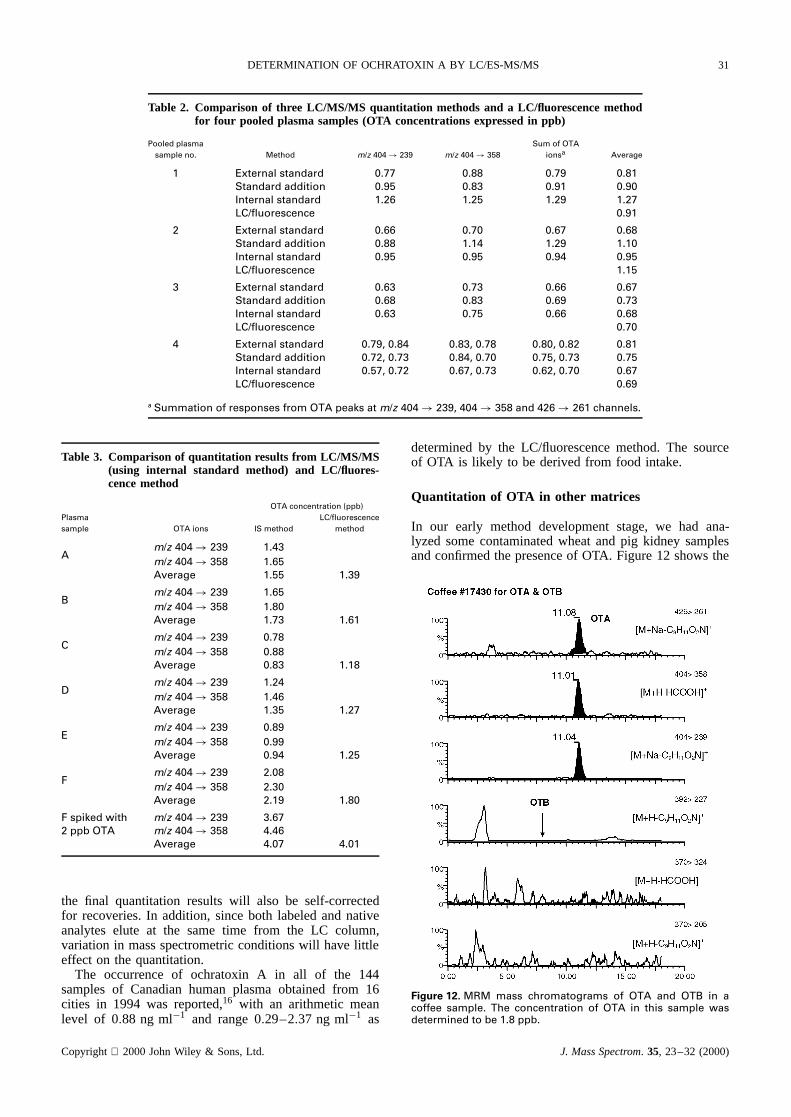
Standard addition method.Each sample extract was indi-vidually spiked with equal volumes of standard solu-tions equivalent to 0, 50, 100 and 200 pg of OTA. Theresponses from spiked samples were plotted against thespiked amount. The endogenous OTA was determined bythe x-intercept (on the negativex-axis) from the extrapo-lation of the experimental curve.
RESULTS AND DISCUSSION
LC/ESI-MS
Although electrospray is considered to be a mild ioniza-tion method and generally produces quasi-molecular ionswith little fragmentation, it is well known that by vary-ing the potential differences between the sampling coneand the skimmer in the ESI ion source, collision-induceddissociation (CID) (also termed ‘cone voltage fragmenta-tion’ or ‘in-source CID’) of these ions from the analytewill occur. As in our case, if the skimmer voltage is main-tained constant, this potential difference will be directlyproportional to the cone voltage. The production of thesestructurally characteristic fragments at high cone voltagecan be very helpful for identification purposes when asingle mass analyzer is used, but it should be minimizedwhen maximum sensitivity for the transmission of the par-ent ions (usually the protonated molecule) is required forthe MS/MS experiments.
We have previously reported16 the electrospray massspectrum of OTA as shown in Fig. 2, and Beckeret al.18
published a similar spectrum. In addition to the domi-nant protonated molecule atm/z 404, low-abundance frag-ment ions resulting from loss of water ([MC H� H2O]Catm/z 386), loss of formic acid ([MC H� HCOOH]C atm/z 358) and loss of phenylalanine ([MC H� Phe]C atm/z 239), were observed. Protonated phenylalanine gaverise to the peak atm/z 166 at high cone voltages. OTA also
Figure 2. Electrospray mass spectrum of OTA at a cone voltage of 35 V.
Copyright 2000JohnWiley & Sons,Ltd. J. MassSpectrom. 35, 23–32 (2000)
26 B. P.-Y. LAU ET AL.
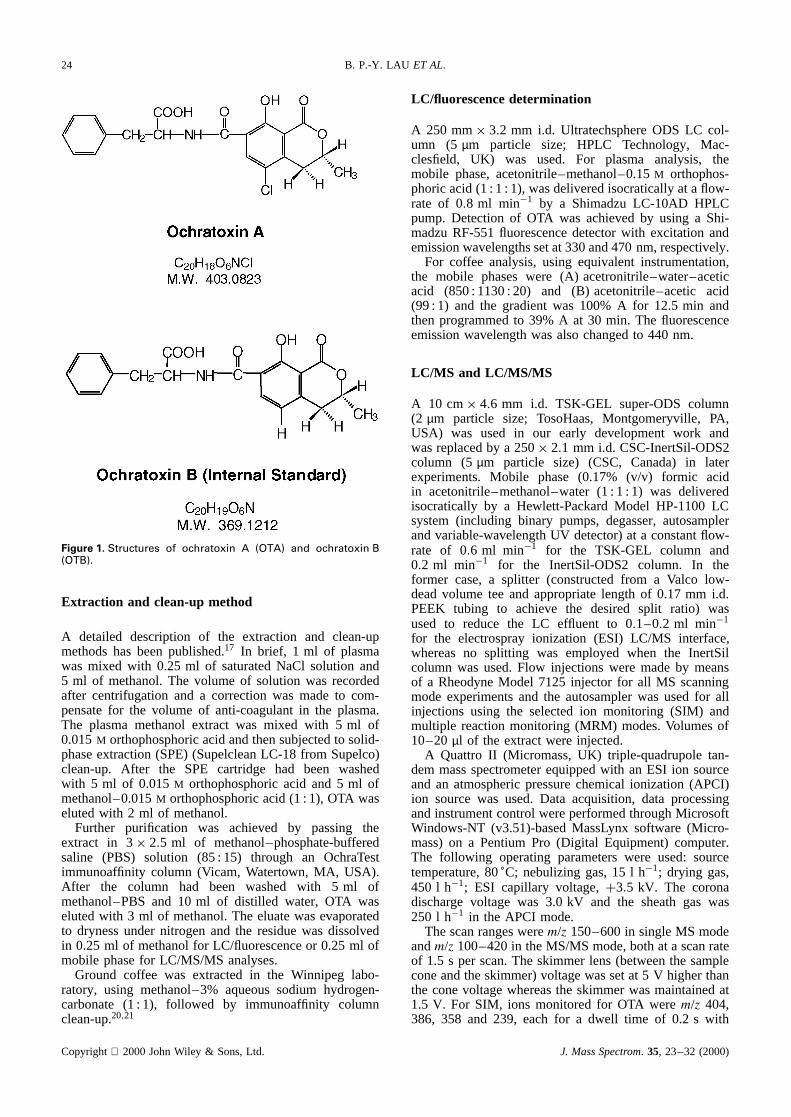
associates with alkali metal ions, as shown by the pres-ence of sodium and potassium adduct ions ([MC Na]Cat m/z 426 and [MC K]C at m/z 442). Solvent clusteredwith the sodium adduct ion, [MC NaC CH3CN]C (m/z467) was also detected at lower cone voltage. Doublycharged ions corresponding to [MC NH4 C Na]2C and[M C NH4C K]2C appear atm/z 221.5 and 229.5, respec-tively. Figure 3(a) and (b) show the electrospray massspectra of OTA standard mixed with 5 mM NaCl and5 mM KCl, respectively, and introduced by flow injection.Exchange of the alkali metal ion with the acidic protonfollowed by cationization yielded [M� HC 2K]C at m/z480, [M� HC 2Na]C at m/z 448 and [M� HC 2NaCMeCN]C atm/z 489.
Similarly to OTA, as shown in Fig. 4, OTB producesthe protonated molecule atm/z 370, plus ions resultingfrom the losses of water, formic acid and phenylalanine atm/z 352, 324 and 205, respectively. Ammonium, sodiumand potassium adduct ions and the [MC NaC CH3CN]Ccluster ion were observed atm/z 387, 392, 408 and 433,respectively. Peaks atm/z 115 and 237, which disappearedafter switching to other solvent systems, are possiblyimpurities.
Atmospheric pressure chemical ionization
Attempts were also made to use APCI as an alterna-tive ionization method for OTA analysis. Under APCI
Figure 3. Electrospray mass spectra of OTA in the presence of (a) 5 mM NaCl and (b) 5 mM KCl.
Figure 4. Electrospray mass spectrum of OTB at a cone voltage of 25 V.
Copyright 2000JohnWiley & Sons,Ltd. J. MassSpectrom. 35, 23–32 (2000)

DETERMINATION OF OCHRATOXIN A BY LC/ES-MS/MS 27
conditions, as shown in Fig. 5(a) OTA gives rise pre-dominately to protonated decarboxylated phenylalanine(m/z 120) and to the protonated OTA molecule (m/z404) as well as less abundant protonated phenylala-nine (m/z 166) at low cone voltage. Fragment ionsat m/z 358 ([MC H� HCOOH]C) and 239 ([MC H�Phe]C) become more pronounced at higher cone volt-ages. OTB behaves in the same way in the APCImode [Fig. 5(b)] with the exception that the protonatedmolecule atm/z 370 is the most intense peak at lowcone voltages, and fragment ions atm/z 352, 324, 205and 120 are produced at higher cone voltages as in theESI mode.
Based on the same amounts of sample injected, theoverall APCI sensitivities of OTA and OTB were muchlower than that in the electrospray mode, hence APCIoffers no analytical advantage over ESI.
ESI-MS/MS analysis
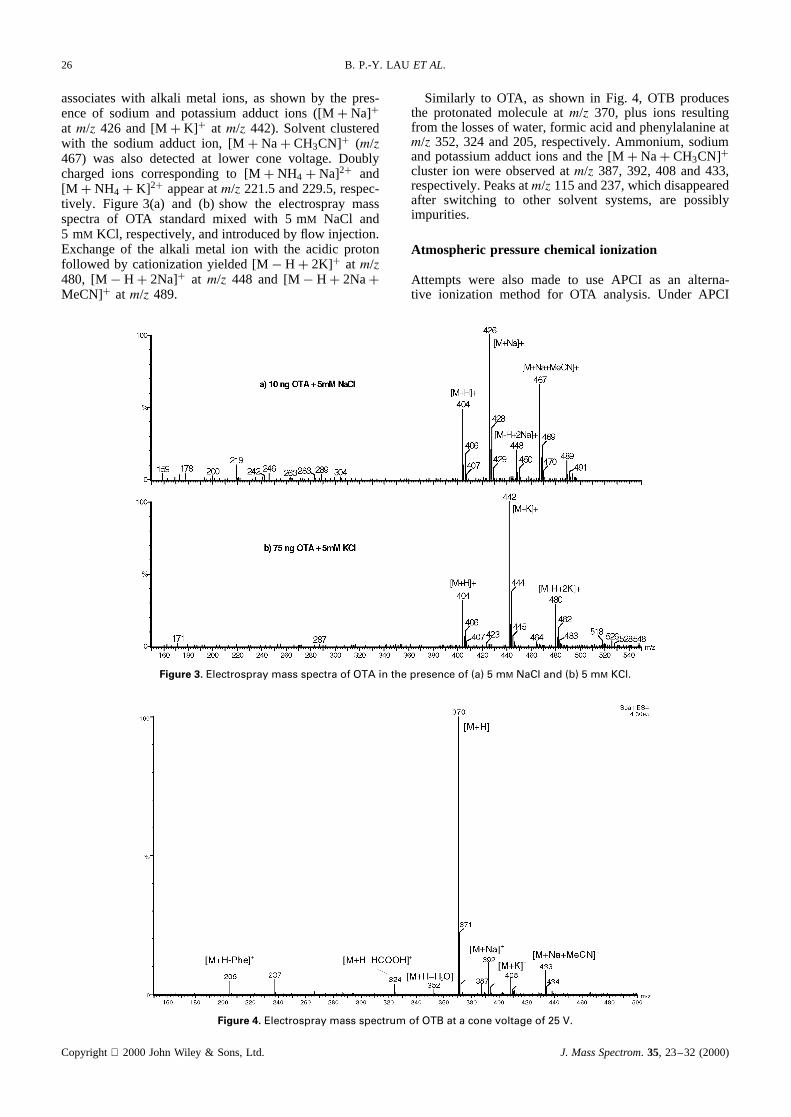
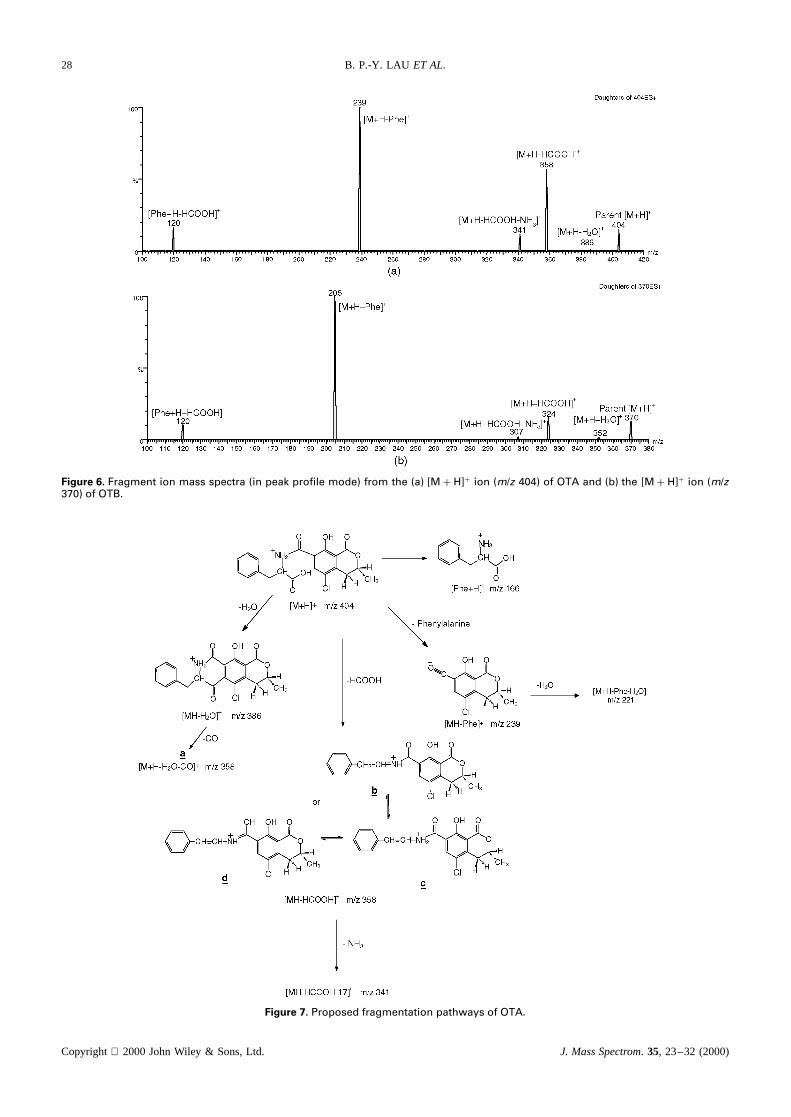
Protonated molecules of OTA (m/z 404) and OTB (m/z370) were subjected to CID in the MS/MS mode. In bothcases, as shown in Fig. 6(a) and (b), with moderate col-lision energy (around 10 eV), fragments resulting fromthe loss of phenylalanine (m/z 239 for OTA andm/z 205for OTB) were the most intense fragment ions, followedby [MH � HCOOH]C (m/z 358 for OTA andm/z 324for OTB), [MH � HCOOH� NH3]C (m/z 341 for OTAand m/z 307 for OTB) and [MH� H2O] (m/z 386 forOTA andm/z 352 for OTB). Protonated and decarboxy-lated phenylalanine atm/z 120 was also common in bothcases. Cationized molecules followed similar fragmenta-tion schemes.
Proposed fragmentation pathways are presented inFig. 7. Beckeret al.18 suggested that them/z 358 ion
Figure 5. APCI mass spectra of (a) OTA at a cone voltage of 20 V and (b) OTB.
Copyright 2000JohnWiley & Sons,Ltd. J. MassSpectrom. 35, 23–32 (2000)
28 B. P.-Y. LAU ET AL.
Figure 6. Fragment ion mass spectra (in peak profile mode) from the (a) [MC H]C ion (m/z 404) of OTA and (b) the [MC H]C ion (m/z370) of OTB.
Figure 7. Proposed fragmentation pathways of OTA.
Copyright 2000JohnWiley & Sons,Ltd. J. MassSpectrom. 35, 23–32 (2000)

DETERMINATION OF OCHRATOXIN A BY LC/ES-MS/MS 29
in the ESI ion mass spectrum of OTA was derivedfrom consecutive fragmentation [MC H� H2O� CO](possibly structurea in Fig. 7) from the protonatedmolecule. Our data indicated that them/z 404 ion ([MCH]C) was the only parent ion observed in the parent scanof m/z 358, suggesting that the latter ion was formedthrough a simple loss of neutral formic acid (structuresb and c). A similar parent scan conducted on them/z324 ion from OTB (i.e. only the parent ion atm/z 370was observed) confirmed that it originated solely from the[OTBC H]C ion. We believe the conjugation of doublebonds in product ions as shown in Fig. 7 is a majorcontributing factor for the stability of these fragments.
At high collision energies (e.g. 30 eV), the fragmention of [M C H]C from OTA showed additional fragmentsat m/z 221 ([MC H� Phe� H2O]C), 193 and 165. The[M C H]C of OTB yielded additional ions atm/z 223 and187 ([MC H� Phe� H2O]C).
For our quantitative analyses, the two most abundantfragments from the [MC H]C ions of the analyte, OTA, andthe internal standard, OTB, were monitored in the MRMmode. Since alkali metal ions associate very easily withochratoxins and sodium ion is commonly present in biolog-ical samples, the [MC Na]C to [M C Na� C9H11O2N]Ctransitions from both OTA and OTB were also monitored.In our early method development, it was found that lowconcentrations of potassium ions in the sample normallydo not impose a serious problem.
The signal from each of the six transitions mentionedabove was maximized by optimizing the cone voltageand collision energy individually, and by programmingwithin each MRM cycle as listed in Table 1 in the Exper-imental section. Figure 8 shows typical MRM mass chro-matograms of a mixture of 50 pg of OTA standard and100 pg of OTB internal standard. The sensitivity for OTBis approximately three times greater than that for OTA.Although sensitivities may vary from day to day, theabsolute minimum detection limits (based on the signal-to-noise ratio of 3 for both [MC H] ! [MH � HCOOH]and [MC H] ! [MH � C9H11O2N] transitions) are bet-ter than 20 pg for OTA and 10 pg for OTB. However, ifonly the latter transition is monitored, the detection lim-its can be reduced by a factor of 2–5. When the systemis fully optimized for OTA alone (for example, using ahigher organic composition in the mobile phase), as littleas 5 pg of OTA can be easily detected (Fig. 9). Linearresponse curves were obtained by using the external orthe internal standard method over the range 50–2000 pginjected on-column.
Studies were carried out to investigate the effect ofthe presence of alkali metal ions on quantitation. Threesets of calibration standards mixed with 10 mM NaCl,KCl or NH4OAc were prepared separately. Calibrationcurves obtained from these salt-containing sets were notsignificantly different from the no-salt set. This resultsuggests that excess alkali metal ions may have beenwashed off from the sample plug in the beginning of theLC run and do not impose too much of a problem inquantitation.
Quantitation of OTA in human plasma
Extra precautions were taken before the internal standardOTB was spiked into the final sample extract prior to
Figure 8. MRM mass chromatograms of a mixture of 50 pg ofOTA and 100 pg of OTB (internal standard).
Figure 9. MRM mass chromatograms of 5 pg of OTA.
the LC analysis.The original extractswereanalyzedfirstto ensurethat no native OTB was detectable.Among
Copyright 2000JohnWiley & Sons,Ltd. J. MassSpectrom. 35, 23–32 (2000)
30 B. P.-Y. LAU ET AL.
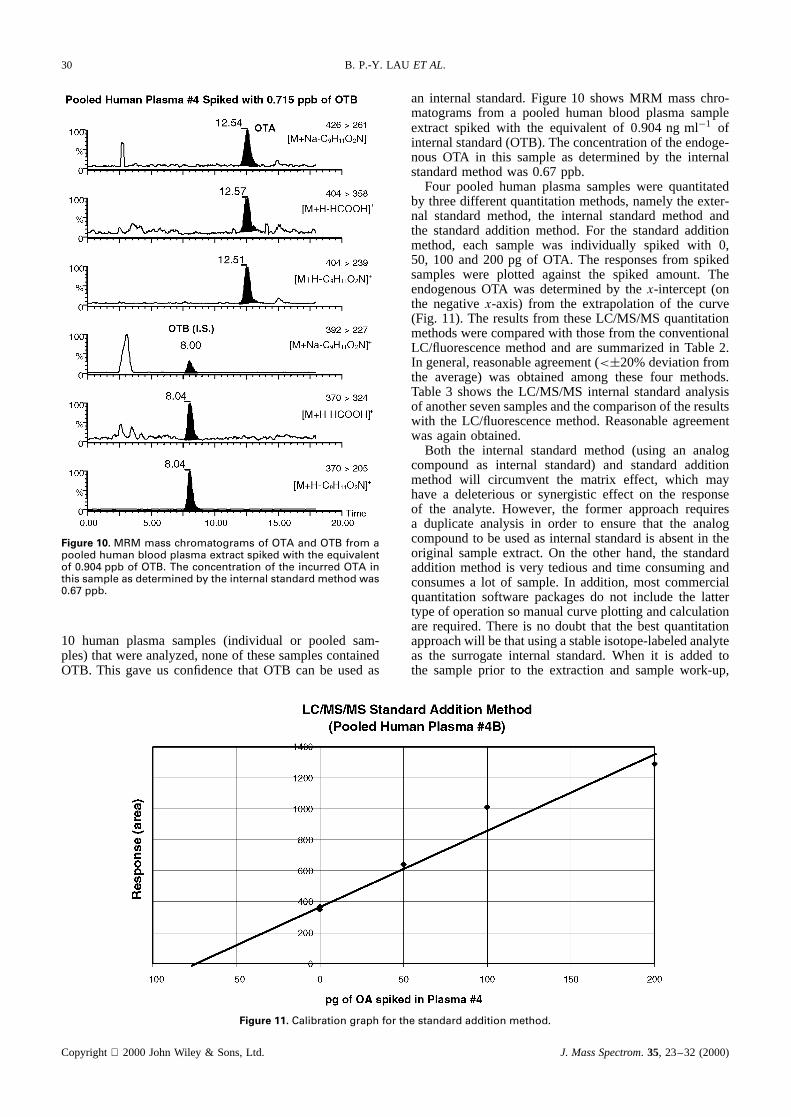
Figure 10. MRM mass chromatograms of OTA and OTB from apooled human blood plasma extract spiked with the equivalentof 0.904 ppb of OTB. The concentration of the incurred OTA inthis sample as determined by the internal standard method was0.67 ppb.
10 human plasma samples(individual or pooled sam-ples)thatwereanalyzed,noneof thesesamplescontainedOTB. This gaveus confidencethat OTB can be usedas
an internal standard.Figure10 showsMRM masschro-matogramsfrom a pooled humanblood plasmasampleextract spiked with the equivalentof 0.904 ng ml�1 ofinternalstandard(OTB). Theconcentrationof theendoge-nous OTA in this sampleas determinedby the internalstandardmethodwas0.67ppb.
Four pooled humanplasmasampleswere quantitatedby threedifferentquantitationmethods,namelytheexter-nal standardmethod, the internal standardmethod andthe standardaddition method.For the standardadditionmethod, each sample was individually spiked with 0,50, 100 and 200 pg of OTA. The responsesfrom spikedsampleswere plotted against the spiked amount. TheendogenousOTA was determinedby the x-intercept(onthe negativex-axis) from the extrapolationof the curve(Fig. 11). The resultsfrom theseLC/MS/MS quantitationmethodswerecomparedwith thosefrom theconventionalLC/fluorescencemethodand are summarizedin Table2.In general,reasonableagreement(<š20%deviationfromthe average)was obtainedamong these four methods.Table3 showsthe LC/MS/MS internal standardanalysisof anothersevensamplesandthecomparisonof theresultswith the LC/fluorescencemethod.Reasonableagreementwasagainobtained.
Both the internal standardmethod (using an analogcompoundas internal standard)and standardadditionmethod will circumvent the matrix effect, which mayhave a deleteriousor synergistic effect on the responseof the analyte.However, the former approachrequiresa duplicate analysis in order to ensurethat the analogcompoundto be usedasinternalstandardis absentin theoriginal sampleextract.On the other hand,the standardadditionmethodis very tediousandtime consumingandconsumesa lot of sample.In addition,most commercialquantitationsoftwarepackagesdo not include the lattertypeof operationsomanualcurveplotting andcalculationarerequired.Thereis no doubt that the bestquantitationapproachwill bethatusingastableisotope-labeledanalyteas the surrogateinternal standard.When it is addedtothe sampleprior to the extractionand samplework-up,
Figure 11. Calibration graph for the standard addition method.
Copyright 2000JohnWiley & Sons,Ltd. J. MassSpectrom. 35, 23–32 (2000)
DETERMINATION OF OCHRATOXIN A BY LC/ES-MS/MS 31
Table 2. Comparison of three LC/MS/MS quantitation methods and a LC/fluorescence methodfor four pooled plasma samples (OTA concentrations expressed in ppb)
Pooled plasma Sum of OTAsample no. Method m/z 404! 239 m/z 404! 358 ionsa Average
1 External standard 0.77 0.88 0.79 0.81Standard addition 0.95 0.83 0.91 0.90Internal standard 1.26 1.25 1.29 1.27LC/fluorescence 0.91
2 External standard 0.66 0.70 0.67 0.68Standard addition 0.88 1.14 1.29 1.10Internal standard 0.95 0.95 0.94 0.95LC/fluorescence 1.15
3 External standard 0.63 0.73 0.66 0.67Standard addition 0.68 0.83 0.69 0.73Internal standard 0.63 0.75 0.66 0.68LC/fluorescence 0.70
4 External standard 0.79, 0.84 0.83, 0.78 0.80, 0.82 0.81Standard addition 0.72, 0.73 0.84, 0.70 0.75, 0.73 0.75Internal standard 0.57, 0.72 0.67, 0.73 0.62, 0.70 0.67LC/fluorescence 0.69
a Summation of responses from OTA peaks at m/z 404! 239, 404! 358 and 426! 261 channels.
Table 3. Comparison of quantitation results from LC/MS/MS(using internal standard method) and LC/fluores-cence method
OTA concentration (ppb)Plasma LC/fluorescencesample OTA ions IS method method
m/z 404! 239 1.43A
m/z 404! 358 1.65Average 1.55 1.39
m/z 404! 239 1.65B
m/z 404! 358 1.80Average 1.73 1.61
m/z 404! 239 0.78C
m/z 404! 358 0.88Average 0.83 1.18
m/z 404! 239 1.24D
m/z 404! 358 1.46Average 1.35 1.27
m/z 404! 239 0.89E
m/z 404! 358 0.99Average 0.94 1.25
m/z 404! 239 2.08F
m/z 404! 358 2.30Average 2.19 1.80
m/z 404! 239 3.67F spiked with2 ppb OTA m/z 404! 358 4.46
Average 4.07 4.01
the final quantitation results will also be self-correctedfor recoveries. In addition, since both labeled and nativeanalytes elute at the same time from the LC column,variation in mass spectrometric conditions will have littleeffect on the quantitation.
The occurrence of ochratoxin A in all of the 144samples of Canadian human plasma obtained from 16cities in 1994 was reported,16 with an arithmetic meanlevel of 0.88 ng ml�1 and range 0.29–2.37 ng ml�1 as
determined by the LC/fluorescence method. The sourceof OTA is likely to be derived from food intake.
Quantitation of OTA in other matrices
In our early method development stage, we had ana-lyzed some contaminated wheat and pig kidney samplesand confirmed the presence of OTA. Figure 12 shows the
Figure 12. MRM mass chromatograms of OTA and OTB in acoffee sample. The concentration of OTA in this sample wasdetermined to be 1.8 ppb.
Copyright 2000JohnWiley & Sons,Ltd. J. MassSpectrom. 35, 23–32 (2000)

32 B. P.-Y. LAU ET AL.
MRM mass chromatograms from a coffee sample, indi-cating the presence of 1.8 ppb of OTA and the absence ofOTB, in agreement with an LC/fluorescence measurementof 1.5 ppb. OTA was also determined by LC/MS/MS intwo other samples of coffee at levels of 0.15 and 0.14 ppb.
CONCLUSION
This paper has demonstrated excellent sensitivity andspecificity of the LC/MS/MS method in the quantitativedetermination and confirmation of OTA in human plasmasamples and some food commodities at low- and sub-ppb levels. Although it is always preferable to use stableisotope-labeled OTA as a surrogate internal standard, ourdata demonstrate that it is feasible to use OTB as a sub-stitute for those samples which do not contain native
OTB. Our results also indicated that there was no signifi-cant difference among the three quantitative methods usedand results agreed reasonably well with LC/fluorescencedetection.
Since the detection of OTA in all Canadian humanserum samples that we analyzed serve as an end-pointindicator of the widespread occurrence of OTA, it isimportant to determine which foods would be contam-inated with this potent natural toxin. With the presentanalytical procedure, it should be possible to carry outsurveillance on grains, animal feeds, meat, meat productsand other foodstuffs to determine contamination levels ofthis toxin.
Acknowledgement
We thank G. A. Lombaert, Health Canada, Winnipeg, for extractionof coffee samples.
REFERENCES
1. Madhyastha SM, Marquardt RR, Frohlich AA, Platford G,Abramson D. J. Agric. Food Chem. 1990; 38: 1506.
2. Abarca ML, Bragulat MR, Castela G, Cabanes FJ. Appl. Env-iron. Microbiol. 1994; 60: 2650.
3. Pitt JI. Appl. Environ. Microbiol. 1987; 53: 266.4. Kuiper-Goodman T, Scott PM. Biomed. Environ. Sci. 1989;
2: 179.5. Pohland AE, Nesheim S, Friedman L. Pure Appl. Chem.
1992; 64: 1029.6. van Egmond HP, Speijers GJA. J. Nat. Toxins 1994; 3: 125.7. Hald B. In Mycotoxins, Endemic Nephropathy and Uri-
nary Tract Tumours, Castegnaro M, Plestina R, Dirheimer G,Chernozemsky IN, Bartsch H (eds). International Agency forResearch on Cancer: Lyon, 1991; 159.
8. Miraglia M, de Dominicis A, Brera C, Corneli S, Cava E,Menghetti E, Miraglia E. Nat. Toxins 1995; 3: 436.
9. Maaroufi K, Achour A, Betbeder AM, Hammami M, Ellouz F,Creppy EE, Bacha H. Arch. Toxicol. 1995; 69: 552.
10. Krivobok S, Seigle-Murandi F, Steiman R, Creppy EE. Sys-tem. Appl. Microbiol. 1995; 18: 455.
11. Scott PM, Kanhere SR, Canela R, Lombaert GA, Bacler S.Prehrambeno-Tehnol. Biotehnol. Rev. 1991; 29: 61.
12. Marquardt RR, Frohlich AA, Sreemannarayana O, Abram-son D, Bernatsky A. Can. J. Vet. Res. 1988; 52: 186.
13. Abramson D. J. Chromatogr. 1987; 391: 315.14. Rajakyla E, Laasasenhaho K, Sakkers PJD. J. Chromatogr.
1987; 384: 391.15. Jiao Y, Blaas W, Ruhl C, Weber R. J. Chromatogr. 1992; 595:
364.16. Scott PM, Kanhere SR, Lau BP-Y, Lewis DA, Hayward S,
Ryan JJ, Kuiper-Goodman T. Food Addit. Contam. 1998; 15:555.
17. Lau BP-Y, Scott PM, Lewis DA, Kanhere SR. Abstracts of45th ASMS Conference on Mass Spectrometry and AlliedTopics, Palm Springs, CA, 1 5 June 1997; 687.
18. Becker M, Degelmann P, Herderich M, Schreier P, HumpfH-U. J. Chromatogr. A 1998; 818: 260.
19. Scott PM, Kennedy B, van Walbeek W. J. Assoc. Off. Anal.Chem. 1971; 54: 1445.
20. Health Protection Branch. Laboratory Bulletin WPG-LB-26,1999.
21. Pittet A, Tornare D, Huggett A, Viani R. J. Agric. Food Chem.1996; 44: 3564.
Copyright 2000 John Wiley & Sons, Ltd. J. Mass Spectrom. 35, 23–32 (2000)