quantitative evaluation of weathering degree through fuzzy
TRANSCRIPT

Quantitative Evaluation of Weathering Degreethrough Fuzzy-AHP Method and PetrophysicsAnalysis for Sandstone CarvingsMingshen Shao
Chinese Academy of Cultural HeritageDong Xu
Chinese Academy of Cultural HeritageYuchao Wang ( [email protected] )
Lanzhou University https://orcid.org/0000-0001-8486-9333Ziyi Wang
Chinese Academy of Cultural HeritageXingzhou Liang
Chinese Academy of Cultural HeritageLi Li
Chinese Academy of Cultural Heritage
Research Article
Keywords: Jurassic sandstone, Sandstone carvings, non-destructive test, weathering degree, Fuzzy-AHPassessment.
Posted Date: August 17th, 2021
DOI: https://doi.org/10.21203/rs.3.rs-807988/v1
License: This work is licensed under a Creative Commons Attribution 4.0 International License. Read Full License
Version of Record: A version of this preprint was published at Natural Hazards on February 15th, 2022.See the published version at https://doi.org/10.1007/s11069-022-05238-6.

Natural Hazards
1
Quantitative evaluation of weathering degree through Fuzzy-AHP 1
method and petrophysics analysis for sandstone carvings 2
Mingshen Shao1 · Dong Xu1 · Yuchao Wang1,2,* · Ziyi Wang1 · Xingzhou Liang1 · Li Li13
Abstract 4
Study on weathering degree assessment of sandstone carvings play an important role in scientific 5
conservation. However, current state of research on weathering assessment cannot reach the needs of 6
scientific evaluation. In this study, the selected sandstones originate from Jurassic and, soluble salt and 7
acid simulation experiments were carried out on standard samples. The weight, specimen surface 8
hardness, ultrasonic velocity and water absorption are measured by means of the non-destructive 9
methods. Furthermore, mineral composition and petrophysical properties are analyzed on small 10
specimens in laboratory. It is revealed that the main mineral, such as quartz and feldspar, is shown by 11
oblate and prolate in shape. Moisture content has great influence on compressive strength of rock 12
samples. Rock porosity increases with deterioration process. The decrease of quality, surface hardness 13
and ultrasonic velocity with increasing cycles. Conversely, water absorption capillary increase over 14
cycles. In addition, Fuzzy-AHP method is adopted to further evaluate weathering degree on experiment 15
samples. Results in macroscopic show that the value of weathering degree is 0.3271 for sodium sulfate 16
solution, which is shown by moderate weathering; 0.1951 for pH=1 sulfuric acid and 0.1060 for pH=2 17
sulfuric acid, which is characterized by low weathering; 0.0516 for pH=3 sulfuric acid and 0.0421 for 18
pH=4 sulfuric acid, belonging to very low weathering.19
Keywords Jurassic sandstone, Sandstone carvings, non-destructive test, weathering degree, Fuzzy-20
AHP assessment. 21
1 Introduction 22
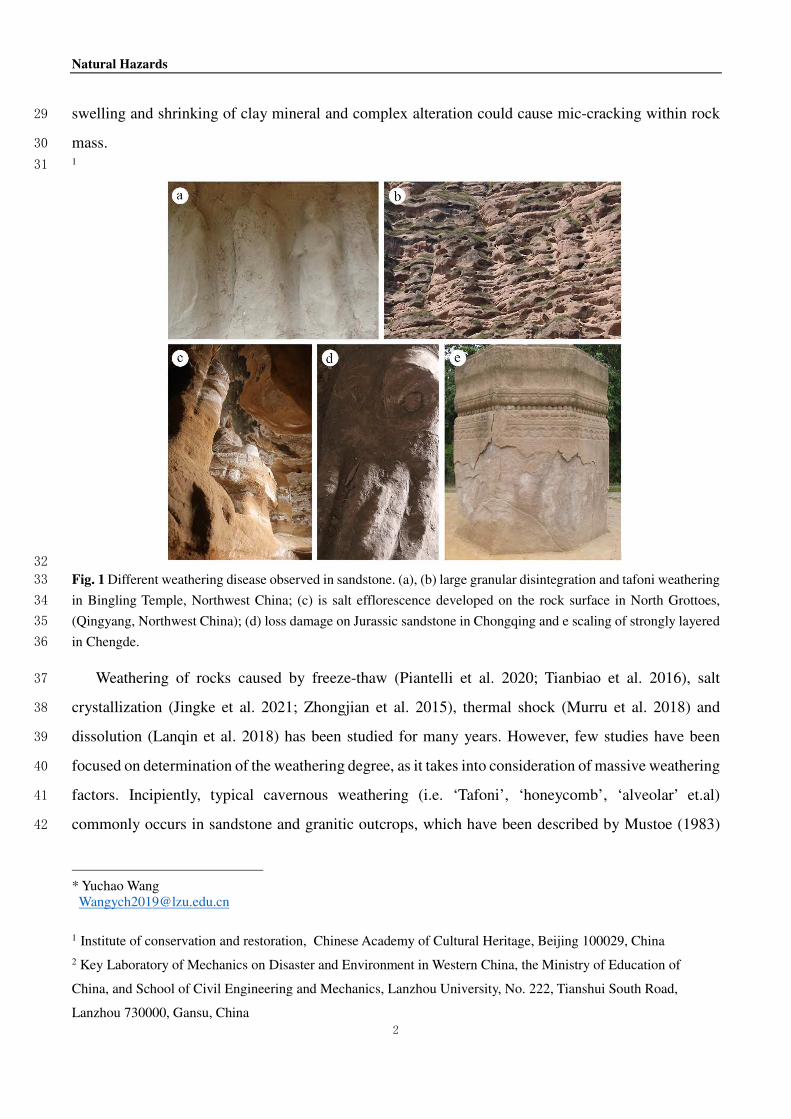
In many cases damage to cultural heritage is caused by salt, rainwash and ice crystallization. The 23
granular disintegration (Fig. 1a), tafoni (Fig. 1b), salt efflorescence (Fig. 1c), losing (Fig. 1d) and 24
scaling (Fig. 1e) are representative examples of a deterioration that may be significantly influenced by 25
rock weathering. Generally, Jurassic sandstone, being entirely crystalline, originates from geological 26
periods between the Cretaceous and the Triassic. The rock fabric of sandstone, such as grain size, 27
sorting and roundness, controls their petrophysical properties during deterioration. In addition, the 28
Natural Hazards
2
swelling and shrinking of clay mineral and complex alteration could cause mic-cracking within rock 29
mass. 30
131
32
Fig. 1 Different weathering disease observed in sandstone. (a), (b) large granular disintegration and tafoni weathering 33
in Bingling Temple, Northwest China; (c) is salt efflorescence developed on the rock surface in North Grottoes, 34
(Qingyang, Northwest China); (d) loss damage on Jurassic sandstone in Chongqing and e scaling of strongly layered 35
in Chengde.36
Weathering of rocks caused by freeze-thaw (Piantelli et al. 2020; Tianbiao et al. 2016), salt 37
crystallization (Jingke et al. 2021; Zhongjian et al. 2015), thermal shock (Murru et al. 2018) and 38
dissolution (Lanqin et al. 2018) has been studied for many years. However, few studies have been 39
focused on determination of the weathering degree, as it takes into consideration of massive weathering 40
factors. Incipiently, typical cavernous weathering (i.e. ‘Tafoni’, ‘honeycomb’, ‘alveolar’ et.al) 41
commonly occurs in sandstone and granitic outcrops, which have been described by Mustoe (1983) 42
* Yuchao Wang [email protected]
1 Institute of conservation and restoration, Chinese Academy of Cultural Heritage, Beijing 100029, China 2 Key Laboratory of Mechanics on Disaster and Environment in Western China, the Ministry of Education of
China, and School of Civil Engineering and Mechanics, Lanzhou University, No. 222, Tianshui South Road,
Lanzhou 730000, Gansu, China
Natural Hazards
3
and analyzed by Mellor (1997), who stated that these weathering formation is initiated at weak points, 43
then, elevated humidity may promote core softening, which in turn leads to further cavern enlargement 44
(Alexandrowicz 1989). Afterwards, several researchers used chemical indices to determine weathering 45
degree (Chiu and Ng 2014; Dong et al. 2015). In fact, it should be noted that chemical indices may 46
change due to mineral transformation or replacement, they are not credible indicator to evaluate 47
weathering degree. In addition, mechanical and physical properties of rocks, such as Schmidt hammer 48
rebound value, P-wave velocity, porosity, compressive and tensile strength, predominantly control its 49
physical behavior (Martinho et al. 2017; Wilhelm et al. 2016; Yun et al. 2021; Yılmaz 2012). Hence, 50
quantitative evaluation mainly used these physical indexes obtained from accelerated deterioration test 51
in laboratory. As cultural relics are non-renewable resource, most researchers advise non-destructive 52
methods to determine weathering degree of rock in site. 53
Heretofore, most of deterioration experiments under the influence of different environmental 54
factors have studied. Weight, hardness, ultrasonic velocity et al. are common characterization indices. 55
However, little research has been done on comprehensive analysis of these indices. In fact, it has 56
become a key step to conduct comprehensive assessment on sandstone carvings before carrying out 57
detailed scientific conservation work. Therefore, exploring a suitable approach to assess the 58
weathering degree of carving still need to discuss. Originally, Saaty advocated the Analytical Hierarchy 59
Process (AHP) for the first time in 1979 (Saaty 1979; Wind and Satty 1980). It is widely used for risk 60
prediction and geo-environmental assessment due to it efficient of dealing qualitative data (Alshehri 61
et al. 2015; Ercanoglu et al. 2008; Nefeslioglu et al. 2013; Ramkar and Yadav 2021). However, AHP 62
method cannot reflect actual human thinking style and assessment results always become subjective 63
and imprecise. Hence, Zadeh (1973) further proposed fuzzy theory combined with AHP to improve 64
the flexibility in judgment and decision. Furthermore, recent studies reveal that Fuzzy-AHP method is 65
successful applied on natural hazards assessment (Hategekimana et al., 2018; Rezaei et al. 2019; 66
Xiaoling et al. 2013). 67
In this study, Fuzzy-AHP method was adopted to determine the weathering degree. Sodium sulfate 68
solution and sulfuric acid were selected to conduct simulation experiment. Four pH gradients 69
(pH=1,2,3 and 4) are set. In addition, specimens selected from Jurassic sandstone were conducted non-70
destructive test, including surface hardness, ultrasonic velocity, penetration coefficient, 71
photomicrograph and quality. Both these indicators were collected of deterioration. Afterwards, AHP 72
was used to determine the weights in hierarchical framework of the weathering degree assessment. 73

Natural Hazards
4
Finally, FAHP was adopted to calculate weathering degree assessment outcomes. Furthermore, this 74
method on weathering indices will further promote the scientific conservation of future geotechnical 75
heritage. 76
2 Material and experiment 77
2.1 Petrophysical properties 78
Danzishi rock carving was located in Nanan district, Chongqing, which excavated in quartz arkose of 79
Jurassic age. Furthermore, lots of statues were carved into the sandstone cliff of Jurassic stratum. 80
Analysis of samples collected from Danzishi rock carving (Fig. 2) indicated predominantly sandy 81
and/or massive texture, poor sorting and roudness. Table 1 provided details on sampling petrophysical 82
properties.83
84
Fig. 2 Samples location. (a) Administrative division of China and Chongqing; (b) Danzishi rock carving. 85
Table 1 Basic petrophysical properties of samples86
Density(g/cm3) 2.45 Compressive strength
(MPa)
Natural state 32.41
Specific gravity 2.65 Dry state 28.89
Cohesion (KPa) 400 Saturated state 15.59
Friction angle(°) 35 Porosity (%) 10.85
In addition, Jurassic sandstone (as shown in Fig. 3) mainly consists of medium-sized sand, quartz 87
and feldspar, which differ among within themselves in that respect according to direction. 88
Microscopically, the feldspar inclusions often show serictic alteration. Commonly, quartz shows 89
idiomorphic to hypidiomorphic single crystal shapes, but it also occurs as polycrystalline quartz 90
aggregates. Partial feldspar is often altered to Chlorite and epidote. In this matrix, plagioclase and 91
quartz are dominant, and subordinated sericite and chlorite occur. In addition, quartz crystal exhibits a 92
preferred grain orientation in oblate shape, while feldspar is characterized by a prolate fabric. 93

Natural Hazards
5
Furthermore, discrete grains of minerals differ among themselves as to their coefficient of expansion, 94
which cause the deterioration within rocks.95
(a) observation under plane-polarized light (b) observation under cross-polarized light
Fig. 3 Thin section observation with polarized light.96
2.2 Experiment conditions 97
2.2.1 Experiment schedule of sodium sulfate solution98
According to testing report of study area, sodium sulfate with 5 percentage concentration was selected 99
to conduct simulation experiment on sample cubes (10×10×10cm). Then, surface hardness, ultrasonic 100
velocity and penetration coefficient were performed with non-destructive device, as shown in Fig. 4. 101
Sketch of experiment schedule were illustrated in Fig. 5. Samples were completely immersed in salt 102
solution about 12h. Then, samples were dried in air oven at 80℃ for 12 hours. Afterwards, specimens 103
were removed from oven and cooled to air temperature for 12 hours. Finally, specimens were immersed 104
in distilled water to dissolve surface salinity of samples. It should be emphasized that the hole process 105
is one cycle, and each cycle as the equivalent of 3 days. 106
107
Fig. 4 Non-destructive test equipment. (a) surface hardness apparatus; (b) Measure the ultrasonic velocity of samples; 108
(c) karsten tube test.109

Natural Hazards
6
110
Fig. 5 Experiment schedule of sodium sulfate solution.111
2.2.2 Experiment schedule of sulfuric acid solution 112
Likewise, dilute sulfuric acid was selected according to the hydrogen ion content in the testing report. 113
Four pH gradients (pH=1,2,3 and 4) were set on dilute sulfuric acid solution. As presented in Fig. 6, 114
twelve cube samples were used, and divided into four groups. Each group cubes were immersed in 115
sulfuric acid solution with different concentrations of hydrogen ions for 12 hours, dried for 12h at air 116
oven and then left to cool at air temperature for a further 12 hours. Afterwards, samples will return to 117
their containers to soak for the further repeated cycle. Finally, hardness, ultrasonic and absorption test 118
were performed by non-destructive methods after 9 cycles.119
120
Fig. 6 Experiment schedule of dilute sulfuric acid solution.121
3 Results 122
3.1 Result of sodium sulfate solution123
As presented in Fig. 7, specimens subjected to salt damage is characterized by granular disintegration 124

Natural Hazards
7
and scaling. It is interesting to note that there is a good correlation between grain size and water 125
absorption. The sample with higher grain size exhibits higher water absorption. In addition, the change 126
law of ultrasonic velocity, weight and hardness are shown in Fig. 7 (d), (e) and (f). Both of these 127
indicators decrease over repeated cycles are observed. Decrease of weight and hardness are mainly 128
caused by granular disintegration and scaling.129
130
Figs. 7 (a-f) Damage phenomena and data statistics during salt crystallization test. (a) initial state; (b) weathering 131
state after 39 repeated cycles; (c) water absorption changes; (d) ultrasonic velocity variation; (e) loss in weight; (f) 132
hardness variation.133
3.2 Result of sulfuric acid solution 134
Fig. 8 shows a clear law that hardness and ultrasonic velocity decreased over repeat cycles. Samples 135
subjected more damage with higher hydrogen ion concentration. It is obvious to observe that the 136
samples show higher degree of decrease of hardness and ultrasonic velocity. Damage degree of these 137
samples varies strong to weak in the following order: pH=1, pH=2, pH=3 and pH=4. However, results 138
do not exhibit a good law for specimen weight and water absorption. 139

Natural Hazards
8
140
Figs. 8 (a-p) Damage phenomena and data statistics during dilute sulfuric acid solution attack. (a), (b), (c) initial and 141
weathering state after a certain number of repeated cycles; d-respective variation of water absorption; (e), (f), (g), (h) 142
loss in weight; (I), (j), (k), (l) hardness variation; (m), (n), (o), (p) ultrasonic velocity variation. 143
4 Fuzzy-AHP assessment 144
4.1 Determine the hierarchical model 145
For weathering assessment degree, the judgement of importance degree of different conditions is the 146
first step to assess weathering degree through weight calculation. In this study, this hierarchical model 147
includes three layers (as shown in Fig. 9): the first layer is called as goal layer (A), i.e., specimens 148
weathering degree in this study; the second one is criterion layer which indicates sodium sulfate 149
solution (B); the third layer, as well as index layer, contains the measuremental indicators, including 150
surface hardness (C1), ultrasonic velocity (C2) and water absorption coefficient (C3). 151

Natural Hazards
9
152
Fig. 9 The hierarchical model of weathering degree assessment.153
4.2 Determine the judgement matrix (A) and the weight calculation154
Firstly, the weight judgment matrix can be established according to 1 to 9 degree compare method 155
proposed by Saaty (2006). Afterwards, the weight of each layer, as well as the vector of weights, are 156
calculated according to judgement matrix based on eigenvalue method (Shang et al. 2010): 157
maxA (2) 158
Where 1 2= , ,...,n
is the weight vector, max is largest eigenvalue of matrix A, which can be 159
calculated by using the following equation: 160
max1
( )1 ni
i i
A
n
(3) 161
Furthermore, the element of weight vector should be normalized via the Equation: 162
1
1n
i
i
(4) 163
Actually, it should be noted that consistency check plays an important role in the whole process. 164
The purpose of consistency check is to avoid the interference of other factors on reliability and 165
accuracy of matrix ranking. The specific calculation formula is as follow: 166
CICR
RI (5) 167
where CI is the consistency indicator, the value of CI is calculated by Equation (6). R I is called 168
random indicator and its value for different scales are presented in Table 2. 169
max( ) / ( 1)CI n n (6) 170
Table. 2 The value of the random indicator R I171
Scale 1 2 3 4 5 6 7 8 9
RI 0 0 0.58 0.90 1.12 1.24 1.32 1.41 1.45
Therefore, we first rank the criteria level index in order of importance. The importance degree of 172
different conditions varies from strong to weak in the following order: sodium sulfate solution, pH=1 173
sulfuric acid, pH=2 sulfuric acid, pH=3 sulfuric acid and pH=4 sulfuric acid. Furthermore, results of 174

Natural Hazards
10
weight judgment matrix are shown in Table 3 to Table 5. 175
Table 3 The weight judgment matrix of Criterion layer176
Criterion layer Weight judgment matrix
[1] [2] [3] [4] [5] Weights
[1] 5% Na2SO4 solution (B1) 1 2 3 5 7 0.440
[2] pH=1 H2SO4 solution (B2) 1/2 1 2 4 5 0.275
[3] pH=2 H2SO4 solution (B3) 1/3 1/2 1 2 3 0.151
[4] pH=3 H2SO4 solution (B4) 1/5 1/4 1/2 1 1 0.073
[5] pH=4 H2SO4 solution (B5) 1/7 1/5 1/3 1 1 0.060
max 5.0356, 0.0079 0.1CR
Table 4 The weight judgment matrix of Index layer177
Index layer Weight judgment matrix
[1] [2] [3] [4] Weights
[1] Hardness (C1) 1 2 1/5 3 0.184
[2] Ultrasonic velocity (C2) 1/2 1 1/4 5 0.170
[3] Water absorption capillary (C3) 5 4 1 7 0.588
[4] Weight (C4) 1/3 1/5 1/7 1 0.057
max 4.2539, 0.0940 0.1CR
Table 5 Results of comprehensive weights by AHP178
Criterion layer Criterion layer
weight 2iW
Index layer Index layer
weight 1iW
Comprehensive
weight 1 2n i iW W W
B1 0.440
C1 0.184 0.081
C2 0.170 0.075
C3 0.588 0.259
C4 0.057 0.025
4.3 Determine the assessment set and membership degree179
Evaluation set refers to the set composed of the evaluation grade of the possibility of evaluation target 180
as the element, 1 2 3= , , ,...,n
V v v v v . Generally, weathering degree is divided into five levels generally, 181

Natural Hazards
11
i.e., no weathering, low weathering, moderate weathering, high weathering and very high weathering 182
in Geologically. Moreover, the risk is generally scaled from 0 (0%) to 1 (100%) in mathematically. 183
Combined with the expert opinion and the classification standard of weathering degree in engineering 184
geology, assessment set is illustrated as following in this study. 185
V= [v1, v2, v3, v4, v5] (7) 186
where v1= [0.7,1.0], v2= [0.5,0.7), v3= [0.3,0.5), v4= [0.1,0.3), v5= [0,0.1)187
In addition, the membership function, including intuitive method, inferential method, F statistical 188
method and Gaussian distribution et al., is established according to the characteristics of the index 189
system. Furthermore, the triangular membership function is selected in this article because the 190
membership function is equivalent to the evaluation result, which has been successfully applied in the 191
risk assessment of earthen sites in China by Yumin (2019) and Zhiqian (2016). In addition, the fuzzy 192
set is generated using triangular membership function (Fig. 10), as shown in Equation (14): 193
𝑟𝑚1 = {1, 𝑓 ≥ 0.85𝑓−0.60.25 , 0.6 < 𝑓 < 0.85
0, 𝑓 < 0.6
𝑟𝑚2 = ⎩⎪⎨⎪⎧0, 𝑓 ≥ 0.850.85−𝑓0.25 , 0.6 ≪ 𝑓 < 0.85𝑓−0.40.2 , 0.4 ≤ 𝑓 < 0.6
0, 𝑓 < 0.4
𝑟𝑚3 = ⎩⎪⎨⎪⎧0, 𝑓 ≥ 0.60.6−𝑓0.2 , 0.4 ≪ 𝑓 < 0.6𝑓−0.20.2 , 0.2 ≤ 𝑓 < 0.4
0, 𝑓 < 0.2
𝑟𝑚4 = ⎩⎪⎨⎪⎧0, 𝑓 ≥ 0.40.4−𝑓0.2 , 0.2 ≪ 𝑓 < 0.4𝑓−0.050.15 , 0.05 ≤ 𝑓 < 0.2
0, 𝑓 < 0.05
𝑟𝑚5 = {1, 𝑓 < 0.050.2−𝑓0.15 , 0.05 ≤ 𝑓 < 0.2
0, 𝑓 > 0.2
(14)
where f is normalized value of each alternative. 194

Natural Hazards
12
195
Fig. 10 Triangle membership function.196
4.4 Calculate the comprehensive assessment197
To carry out the assessment of weathering degree, establishing decision matrix (D) is necessary. The 198
decision matrix and its normalized result (F) are as followed.199
618 2629,1.90,2531
591,2446,2.05,2525
564,2187,1.30,2528
= 483,2037,1.50,2525
468,1895,1.20,2512
425,1817,1.40,2501
385,1738,1.05,2499
D
, 0.175,0.178,0.183,0.144
0.167,0.166,0.197,0.143
0.160,0.148,0.125,0.143
= 0.137,0.138,0.144,0.143
0.132,0.128,0.115,0.143
0.120,0.123,0.135,0.142
0.109,0.118,0.101,0.142
F
200
Then, the membership can be calculated according Eqs. (14) and Fig. 10: 201
1
0, 0, 0, 0.3933, 0.6067
0, 0, 0, 0.4533, 0.5467
0, 0, 0, 0.3400, 0.6600
0, 0, 0, 0.6133, 0.3867
R
202
Therefore, the comprehensive vector of Index layer and the evaluation vector of criterion layer 203
are obtained by Eqs. (5) and (6) respectively, as shown in Equation (15) : 204
= 0,0,0,0.3843,0.6147B T (15) 205
In addition, evaluation vector of goal layer (T) can be calculated according to Eqs. (12) : 206
= 0,0,0,0.1691,0.2705T207
Finally, the value of weathering degree 208

Natural Hazards
13
= 0,0,0,0.1691,0.2705 0.05,0.2,0.4,0.6,0.85 0.3271TT
K T S , which belongs to low weathering. In 209
addition, the weight judgement matrix of Index layer and comprehensive weights under other 210
conditions are shown in Table 6 or Table 7. 211
Table 6 The weight judgement matrix of Index layer under other conditions 212
Index layer Weight judgment matrix
[1] [2] [3] [4] Weights
pH=1 H2SO4 solution (B2)
[1] Hardness (C1) 1 5 8 6 0.626
[2] Ultrasonic velocity (C2) 1/5 1 3 5 0.221
[3] Water absorption capillary (C3) 1/8 1/3 1 2 0.090
[4] Weight (C4) 1/6 1/5 1/2 1 0.064
max 4.2208, 0.0082 0.1CR
pH=2 H2SO4 solution (B3)
[1] Hardness (C1) 1 3 6 7 0.568
[2] Ultrasonic velocity (C2) 1/3 1 4 5 0.277
[3] Water absorption capillary (C3) 1/6 1/4 1 2 0.094
[4] Weight (C4) 1/7 1/5 1/2 1 0.061
max 4.0922, 0.0370 0.1CR
pH=3 H2SO4 solution (B4)
[1] Hardness (C1) 1 3 4 5 0.531
[2] Ultrasonic velocity (C2) 1/3 1 2 4 0.245
[3] Water absorption capillary (C3) 1/4 1/2 1 3 0.153
[4] Weight (C4) 1/5 1/4 1/3 1 0.072
max 4.1179, 0.0437 0.1CR
pH=4 H2SO4 solution (B5)
[1] Hardness (C1) 1 2 4 5 0.501
[2] Ultrasonic velocity (C2) 1/2 1 2 3 0.264
[3] Water absorption capillary (C3) 1/4 1/2 1 1/2 0.106
[4] Weight (C4) 1/5 1/3 2 1 0.129

Natural Hazards
14
max 4.1327, 0.0490 0.1CR
Table 7 Comprehensive weights of other conditions213
Criterion layer Criterion layer
weight 2iW
Index layer Index layer
weight 1iW
Comprehensive
weight 1 2n i iW W W
B2 0.275
C1 0.626 0.172
C2 0.221 0.061
C3 0.090 0.025
C4 0.064 0.018
B3 0.151
C1 0.568 0.086
C2 0.277 0.042
C3 0.094 0.014
C4 0.061 0.009
B4 0.073
C1 0.531 0.039
C2 0.245 0.018
C3 0.153 0.011
C4 0.072 0.005
B5 0.060
C1 0.501 0.030
C2 0.264 0.016
C3 0.106 0.006
C4 0.129 0.008
Note: B2 represent pH=1 sulfuric acid, B3 represent pH=2 sulfuric acid, B4 represent pH=3 sulfuric acid and B5 is pH=4 sulfuric acid. 214
Likewise, the value of other conditions is 0.1951 for pH=1 sulfuric acid, 0.1060 for pH=2 sulfuric 215
acid, 0.0516 for pH=3 sulfuric acid and 0.0421 for pH=4 sulfuric acid, as shown in Fig. 11. 216

Natural Hazards
15
217
Fig. 11 Comprehensive weathering degree results.218
5 Discussion 219
Rock weathering is due to the complex interplay of physical and chemical processes which are far 220
from being well understood (Turkington and Paradise, 2005). The petrophysical properties such as 221
grain fabric, grain size distribution and compressive strength, play a more active role in these processes 222
(Ruedrich and Siegesmund, 2006). 223
5.1 Grain fabric 224
As presented in Fig. 12, petrographic analyses (in cross-polarized light) and Scanning Electron 225
Microscope test on standard thin sections were performed for a qualitative description of the fresh rock 226
fabric with different magnification. 227
(a) (b) (c)

Natural Hazards
16
(d) (e) (f)
Fig. 12 Petrographic and SEM observation under different magnification. (a) ×50 magnification; (b) ×100 228
magnification; (c) ×200 magnification; (d) ×500 magnification; (e) ×1000 magnification; (f) ×2000 magnification.229
From Fig. 12, observation in cross-polarized light reveal that grains exhibit a preferred orientation 230
in a oblate or prolate shape, and little gypsum cements occur. While the microstructure is characterized 231
by layered arrangement and tight cementation between particles. Slight erosion has been performed at 232
the boundary of each layer. In addition, the separate effects of either erosion, hydration action and salt 233
crystallization of acid-rich/salt-rich water, will further lead to the deterioration within rock mass. It is 234
clearly observed in Fig. 13 under different magnification. For example, samples soaked in sodium 235
sulphate (Fig. 13a, b and c) performed big dissolution pores, which provide the channel allowing salt-236
rich fluid enter to conduct the hydration and crystallization action. In contrast, samples immersed in 237
dilute sulfuric acid solution is characterized by micro-cracking, it is obvious in Fig. 13f. Moreover, the 238
white calcium sulfate crystals are clearly observed on mineral surface (Fig. 13h to l). It is interesting 239
to note that micro-cracking and small-scale cavities (Fig. 13l) have been development on the mineral 240
surface, which is likely to result in the fracture of mineral crystal and with the loss of aqueous solution.241
SEM images of specimens under the efflorescences of mirabilite

Natural Hazards
17
SEM images of specimens under the acid deterioration (pH=1)
SEM images of specimens under the acid deterioration (pH=2)
SEM images of specimens under the acid deterioration (pH=3)
SEM images of specimens under the acid deterioration (pH=4)

Natural Hazards
18
Fig. 13 SEM images after simulation deterioration experiment. (a), (b), (c) samples damaged by salt solution; (d), 242
(e), f samples soaked in diluted sulfuric acid solution (pH=1); (g), (h), (i) samples soaked in diluted sulfuric acid 243
solution (pH=2); (j), (k), (l) dilute sulfuric acid solution with pH = 3 and m, n, o is the dilute sulfuric acid solution 244
with pH = 4.245
5.2 Pore size distribution 246
The pore size distribution of samples is determined by using mercury porosimetry (Brakel et al.1981), 247
as shown in Fig. 14. Experiment results reveal that the medium porosity of the Jurassic sandstone 248
varies between 8.01 percent for the fresh sandstone and 14.20 percent for the sandstone undergoing 249
the deterioration process. The porosity of specimens varies from high to low is in the following order: 250
samples immersed in soldium sulphate solution, samples soaked in sulfuric acid solution with pH=2, 251
samples soaked in sulfuric acid solution with pH=1, samples immersed in sulfuric acid solution with 252
pH=3, fresh sandstone and samples immersed in sulfuric acid solution with pH=4. 253
(a) (b)
(c) (d)

Natural Hazards
19
(e) (f)
Fig. 14 Pore size distribution of the investigated samples, measured by mercury porosimetry. (a) Fresh sample; (b) 254
Sample immersed in soldium sulphate solution; (c) Sample immersed in sulfuric acid solution with pH=1; (d) Sample 255
immersed in sulfuric acid solution with pH=2; (e) Sample immersed in sulfuric acid solution with pH=3; f- Sample 256
immersed in sulfuric acid solution with pH=4.257
It is clearly to obtain that samples under soldium sulphate solution degradation perform highest 258
porosity, although the cycle of salt solution is shorter than the cycle of acid solution. Samples soaked 259
in sulfuric acid performe a good correlation between porosity and weathering degree. In general, 260
porosity of samples with hydrogen ions concentration of pH=1 and pH=2 is larger than that pH=3 and 261
pH=4. Correspondingly, weathering degree of samples are higher over hydrogen ion concentration 262
increase. The value of weathering degree is 0.1951 for samples soaked in pH=1 sulfuric acid solution 263
and, 0.1060, 0.0516 or 0.0421 for sampled soaked in pH=2, pH=3, pH=4 sulfuric acid solution 264
respectively.265
266
Fig. 15 Relationship between samples porosity and weathering degree.267

Natural Hazards
20
For sulfuric acid deterioration experiment, damage usually occurs in the surface layer of samples, 268
which characterized by disintegration macroscopically and mic-cracking on partical surface at the 269
microlevel. Results of Non-destructive testing reveal that surface hardness and ultrasonic velocity 270
decrease over testing cycle. The decay rate increases with increasing hydrogen ion concentration. 271
However, soldium sulphate solution appears to be able to penetrate the interior of the specimen and 272
cause damage, which characterized by delamination and disintegration. This has been attributed in 273
pore expansion and connectivity, which can be confirmed by the change of porosity. On the other hand, 274
stress development by growth of crystal, thermal expansion and hydration also play important role in 275
deterioration process (Miyazaki et al.1992; Schmelzer et al. 2006; Winkler and Wilhelm, 1970). 276
Therefore, the weathering degree performed sever than samples with sulfuric acid damage. 277
In addition, much work have done on relationship between compressive strength and porosity 278
(Ruedrich et al. 2010). This study show a positive correlation between porosity and weathering degree 279
(Fig. 15). There is no doubt that porosity is a very important rock mechanics parameter. It is also a 280
very effective tool for establishing links between rock physics, hydraulics and mechanical indicators. 281
Based on rock porosity, we will try to consider more weathering factors in future studies to develop 282
more detailed weathering models. 283
6 Conclusions 284
According to analysis of AHP-Fuzzy assessment method and petrophysical properties, some major 285
conclusions can be drawn: 286
(1) The weathering degree of specimens varies from high to low is in the following order: samples 287
immersed in soldium sulphate solution, soaked in sulfuric acid solution with pH=1, soaked in sulfuric 288
acid solution with pH=2, samples immersed in sulfuric acid solution with pH=3, and samples 289
immersed in sulfuric acid solution with pH=4. 290
(2) Based on Fuzzy-AHP method, samples undergoing salt simulate deterioration process is shown 291
by moderate weathering (0.3271), low weathering for pH=1 sulfuric acid (0.1951) and pH=2 sulfuric 292
acid (0.1060), very low weathering for pH=3 (0.0516) and/or 4 sulfuric acid (0.0421). 293
(3) According to petrophysical analysis, comprehensive strength and porosity perform a clear 294
correlation to weathering resistance, which higher moisture content exhibit lower comprehensive 295
strength. In addition, samples with higher porosity is shown by the lower weathering resistance. 296
(4) Based on SEM observation under different magnification, microstructure is characterized by layer 297
arrangement and slight erosion, which performed at the boundary of each layer 298

Natural Hazards
21
(5) Quantitative evaluation of weathering degree plays an important role in preventive conservation. 299
Additionally, it should be emphasized that steady environment monitoring at sites are required as well. 300
Acknowledgements We gratefully acknowledge the support from the National Key Research and 301
Development Program of China (2019YFC1520602).302
Authors’ contributions Mingshen Shao proposed and drafted the manuscript. Dong Xu and 303
Yuchao Wang carried out simulated experiments. Ziyi Wang and Xingzhou Liang supported in data 304
collected and analysis. Li Li has contributed in results and discussion part. All authors revised and 305
approved the final manuscript.306
Availability of data and materials Not applicable. 307
Declarations 308
Conflicts of interest The author declares no conflict of interest. 309
References 310
Alexandrowicz Z (1989) Evolution of weathering pits on sandstone tors in the Polish Carpathians. Zeitschrift für 311
Geomorphologie, 33(3), 275-289. https://doi.org/10.1127/zfg/33/1989/275 312
Alshehri SA, Rezgui Y, Li H (2015) Disaster community resilience assessment method: a consensus-based Delphi 313
and AHP approach. Nat Hazards, 78(1), 395-416. https://doi.org/10.1007/s11069-015-1719-5 314
Brakel JV, Modry S, Svata M (1981) Mercury porosimetry : state of the art. Powder Technol 29,1-12. 315
https://doi.org/10.1016/0032-5910(81)85001-2 316
Chiu CF, Ng CWW (2014) Relationships between chemical weathering indices and physical and mechanical 317
properties of decomposed granite. Eng Geol, 179, 76-89. https://doi.org/10.1016/j.enggeo.2014.06.021 318
Dong X, Yusong D, Shuling W, Shuwen D, Chongfa C (2015) Fractal features of soil particle-size distribution of 319
different weathering profiles of the collapsing gullies in the hilly granitic region, south China. Nat Hazards, 320
79(1), 455-478. https://doi.org/10.1007/s11069-015-1852-1 321
Ercanoglu M, Kasmer O, Temiz N (2008) Adaptation and comparison of expert opinion to analytical hierarchy 322
process for landslide susceptibility mapping. B Eng Geol Environ, 67(4), 565-578. 323
https://doi.org/10.1007/s10064-008-0170-1 324
Hategekimana Y, Lijun Y, Yuping N, Jianfeng Z, Fang L, Fei Guo (2018) Integration of multi-parametric fuzzy 325
analytic hierarchy process and GIS along the UNESCO World Heritage: a flood hazard index, Mombasa County, 326
Natural Hazards
22
Kenya. Nat Hazards, 92(2), 1137-1153. https://doi.org/10.1007/s11069-018-3244-9 327
Jingke Z, Zhen L, Li L, Jianhui L, Dun L, Mingshen S (2021) Study on weathering mechanism of sandstone statues 328
in Southwest China: example from the sandstone of Niche of Sakyamuni Entering Nirvana at Dazu Rock 329
Carvings. Nat Hazards. https://doi.org/10.1007/s11069-021-04705-w 330
Lanqing W, Dongshuai H, Huaishuai S, Tiejun Z (2018) Molecular dynamics study on the Tri-calcium silicate 331
hydration in sodium sulfate solution: Interface structure, dynamics and dissolution mechanism. Constr Build 332
Mater, 170, 402-417. https://doi.org/10.1016/j.conbuildmat.2018.03.035 333
Murru A, Freire-Liata DM, Fort R, Varas-Muriel MJ, Meloni P (2018) Evaluation of post-thermal shock effects in 334
Carrara marble and Santa Caterina di Pittinuri limestone. Constr Build Mater, 186, 1200-1211. 335
https://doi.org/10.1016/j.conbuildmat.2018.08.034 336
Martinho E, Mendes M, Dionísio A (2017) 3D imaging of P-waves velocity as a tool for evaluation of heat induced 337
limestone decay. Constr Build Mater, 135, 119-128. https://doi.org/10.1016/j.conbuildmat.2016.12.192 338
Mellor A, Short J, Kirkby SJ (1997) Tafoni in the El Chorro area, Andalucia, southern spain. Earth Surf Proc Land, 339
22, 817-833. https://doi.org/10.1002/(sici)1096-9837(199709)22:9<817::aid-esp768>3.0.co;2-t 340
Miyazaki N, Uchida H, Munakata T, Fujioka K, Sugino Y (1992) Thermal stress analysis of silicon bulk single crystal 341
during Czochralski growth. J Cryst Growth, 125(1-2), 102-111. doi:https://doi.org/10.1016/0022-342
0248(92)90325-D 343
Musso Piantelli F, Herwegh M, Anselmetti FS, Waldvogel M, Gruner U (2020) Microfracture propagation in gneiss 344
through frost wedging: insights from an experimental study. Nat Hazards, 100(2), 843-860. 345
https://doi.org/10.1007/s11069-019-03846-3 346
Mustoe GE (1983) Cavernous weathering in the Capitol Reef desert,Utah. Earth Surf Proc Land, 8, 517-526. 347
https://doi.org/10.1002/esp.3290080603 348
Nefeslioglu HA, Sezer EA, Gokceoglu C, Ayas Z (2013) A modified analytical hierarchy process (M-AHP) approach 349
for decision support systems in natural hazard assessments. Comput Geosci-UK, 59, 1-8. 350
https://doi.org/10.1016/j.cageo.2013.05.010 351
Ramkar P, Yadav SM (2021) Flood risk index in data-scarce river basins using the AHP and GIS approach. Nat 352
Hazards. https://doi.org/10.1007/s11069-021-04871-x 353
Rezaei M, Amiraslani F, Samani NN, Alavipanah K (2019) Application of two fuzzy models using knowledge-based 354
and linear aggregation approaches to identifying flooding-prone areas in Tehran. Nat Hazards, 100(1), 363-385. 355
https://doi.org/10.1007/s11069-019-03816-9 356
Ruedrich J, Bartelsen T, Dohrmann R, Siegesmund S (2010) Moisture expansion as a deterioration factor for 357

Natural Hazards
23
sandstone used in buildings. Environ Earth Sci, 63(7-8), 1545-1564. https://doi.org/10.1007/s12665-010-0767-358
0 359
Ruedrich J, Siegesmund S (2006) Salt and ice crystallisation in porous sandstones. Environ Geol, 52(2), 225-249. 360
https://doi.org/10.1007/s00254-006-0585-6 361
Saaty TL (1979) Applications of analytical hierarchies. Math Comput Simulat, XXI, 1-20. 362
https://doi.org/10.1016/0378-4754(79)90101-0 363
Saaty TL (2006) Rank from comparisons and from ratings in the analytic hierarchy/network processes. Eur J Oper 364
Res, 168(2), 557-570. https://doi.org/10.1016/j.ejor.2004.04.032 365
Schmelzer JWP, Zanotto ED, Avramov I, Fokin VM (2006) Stress development and relaxation during crystal growth 366
in glass-forming liquids. J Non-Cryst Solids, 352(5), 434-443. https://doi.org/10.1016/j.jnoncrysol.2006.01.016 367
Shang G, Zaiyue Z, Cungen C (2010) Calculating weights methods in complete matrices and incomplete matrices. J 368
Softw, 5(3), 304-311. https://doi.org/10.4304/jsw.5.3.304-311 369
Turkington AV, Paradise TR (2005) Sandstone weathering: a century of research and innovation. Geomorphology, 370
67(1-2), 229-253. https://doi.org/10.1016/j.geomorph.2004.09.028 371
Tianbiao P, Wenwu C, Yumin D, Wenjuan L, Na S (2016) Snowfall-related deterioration behavior of the Ming Great 372
Wall in the eastern Qinghai-Tibet Plateau. Nat Hazards, 84(3), 1539-1550. https://doi.org/10.1007/s11069-016-373
2497-4 374
Wilhelm K, Viles H, Burke Ó (2016) Low impact surface hardness testing (Equotip) on porous surfaces - advances 375
in methodology with implications for rock weathering and stone deterioration research. Earth Surf Proc Land, 376
41(8), 1027-1038. https://doi.org/10.1002/esp.3882 377
Wind Y, Satty TL (1980) Marketing applications of the analytic hierarchy process. Manag S, 26(7), 641-658. 378
https://doi.org/10.1287/mnsc.26.7.641 379
Winkler EM, Wilhelm EJ (1970) Salt burst by hydration pressures in architectural stone in urban atmosphere. Geol 380
Soc Am Bull, 81(2), 567-572. doi:https://doi.org/10.1130/0016-7606(1970)81[567:SBBHPI]2.0.CO;2381
Xiaoling Y, Jiehua D, Hui H (2013) Application of a triangular fuzzy AHP approach for flood risk evaluation and 382
response measures analysis. Nat Hazards, 68(2), 657-674. https://doi.org/10.1007/s11069-013-0642-x 383
Yun W, Xiaozhao L, Zhen Huang, Sen Xue (2021) Effect of temperature on physical, mechanical and acoustic 384
emission properties of Beishan granite, Gansu Province, China. Nat Hazards, 107(2), 1577-1592. 385
https://doi.org/10.1007/s11069-021-04647-3 386
Yılmaz NG (2012) The influence of testing procedures on uniaxial compressive strength prediction of carbonate 387
rocks from equotip hardness tester (EHT) and proposal of a new testing methodology: Hybrid Dynamic 388

Natural Hazards
24
Hardness (HDH). Rock Mech Rock Eng, 46(1), 95-106. https://doi.org/10.1007/s00603-012-0261-y 389
Yumin D, Wenwu C, Kai C, Kewen Z (2019) Study on damage assessment of earthen sites of the Ming Great Wall 390
in Qinghai province based on Fuzzy-AHP and AHP-TOPSIS. Int J Archit Herit, 14(6), 903-916. 391
https://doi.org/10.1080/15583058.2019.1576241 392
Zadeh LA (1973) Outline of a new approach to the analysis of complex systems and decision processes. IEEE T Syst 393
Man Cy, SMC-3(1), 28-44. https://doi.org/10.1109/TSMC.1973.5408575 394
Zhongjian Z, Lihui L, Wenjie X, Yan F, Jun F (2015) Flat-plate roof collapse of shallow caverns and protective 395
measures: a case study of Longyou ancient siltstone caverns. Nat Hazards, 76, 191-213. 396
https://doi.org/10.1007/s11069-014-1481-0) 397
Zhiqian G, Wenwu C, Jingke Z, Fei Y, Xingzhou L, Faguo H, F., Qinglin G (2016) Hazard assessment of potentially 398
dangerous bodies within a cliff based on the Fuzzy-AHP method: a case study of the Mogao Grottoes, China. 399
B Eng Geol Environ, 76(3), 1009-1020. https://doi.org/10.1007/s10064-016-0865-7400
401