quantitative forecasting of political...
TRANSCRIPT
Quantitative Forecasting of Political Conflict
Philip A. SchrodtDepartment of Political SciencePennsylvania State University
[email protected]://eventdata.psu.edu
Presentation at the State Dept INR Workshop on Data-Driven Forecasting and Quantitative Analysis
Arlington VA23 April 2013

The Debate
Vs.

Main points● Event data analysis, originally developed under DARPA funding
1965-1980, is a well-understood technique for collecting systematic information on political interactions over time
● Contemporary automated coding methods allow data to be collected in a transparent and reproducible manner in real time at a very low marginal cost
● Statistical models provide 70%-80% accuracy in predicting violence in protracted conflicts in out-of-sample tests at policy-relevant forecast leads
● Exponential increases in the availability of information on political events has produced a major change in the viability and utility of these methods

Drivers of change in social science research in the 21st century
● Big data● Effective use of high performance computing
● Wider range of analytical methods
● Wider range of data
● Decentralized collaborative environments● Open source / open access
● Two weeks after GDELT was released, one could download multiple tutorials, dozens of visualizations, and hundreds of lines of ready-to-use R code
● Increased interest in policy and private-sector applications of cutting-edge techniques

European Media Monitor

Open Source Software

Political Data Sources
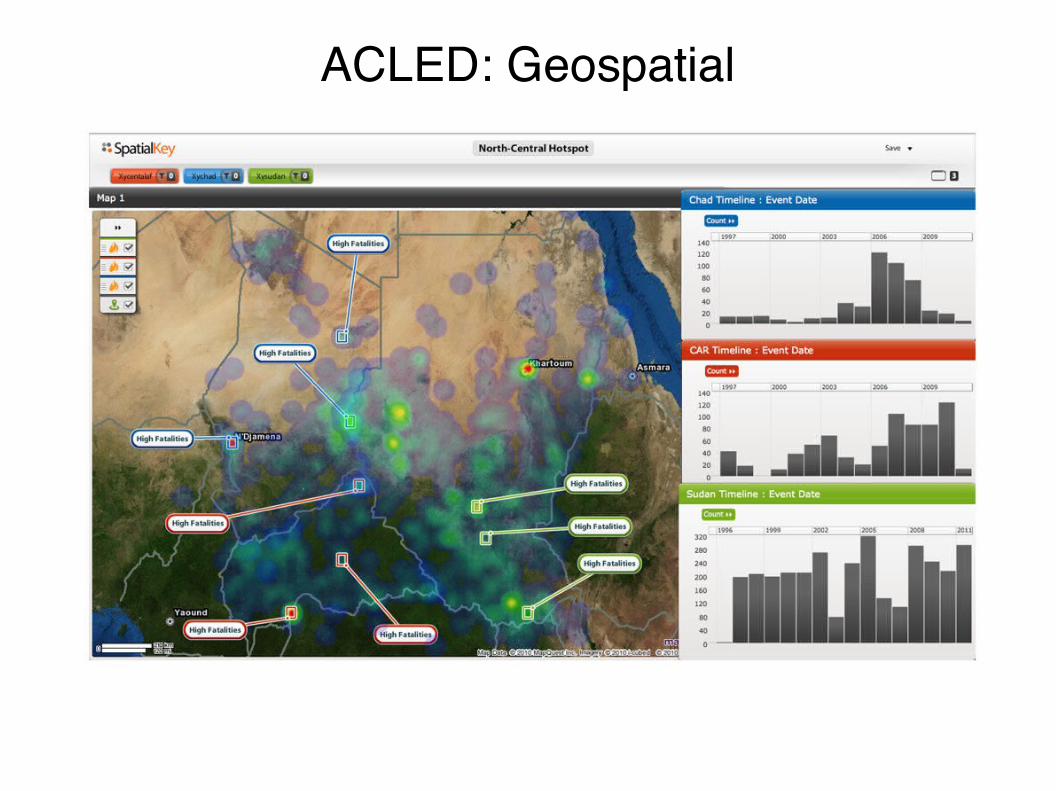
ACLED: Geospatial
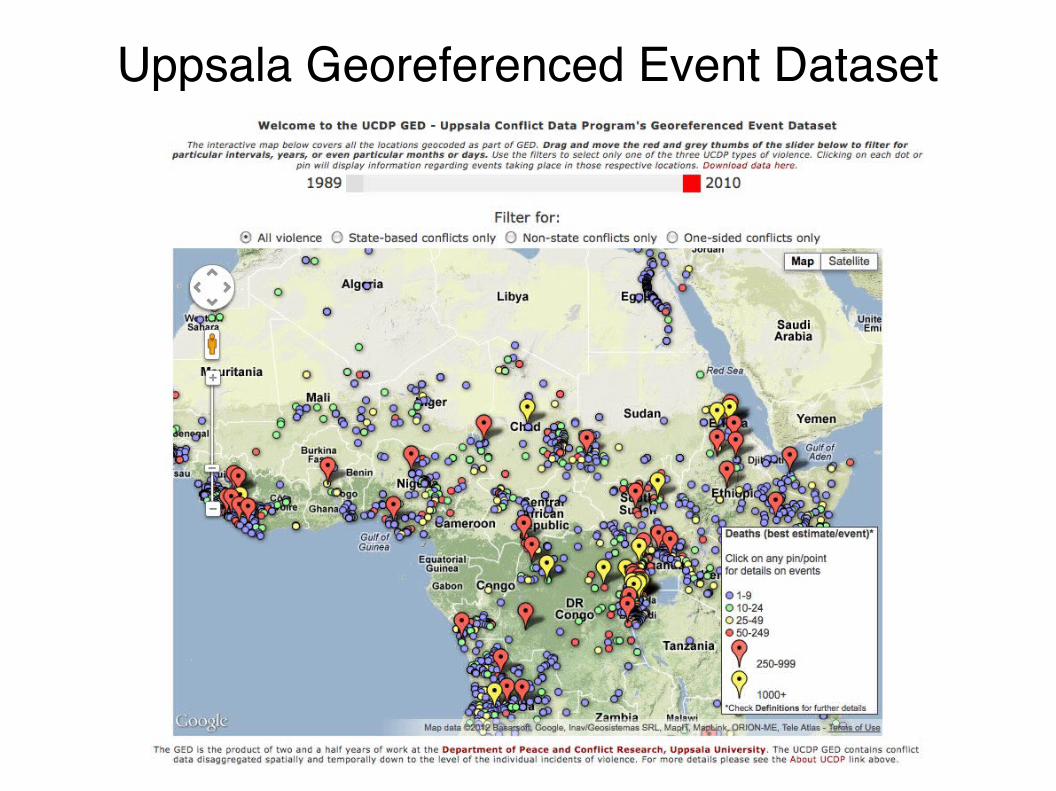
Uppsala Georeferenced Event Dataset

ICEWS Phase 1 Event Data
● 30-gigabytes of text from Lexis-Nexis
● 25 sources
● 8-million stories
● 26-million sentences
● Only first four sentences coded in each story
● 3-million events
● Generally two orders of magnitude greater than any prior event coding effort

GDELT Event Data● Open source collaboration of Univ of Illinois (Kalev Leetaru) and
Penn State
● Global coding, Jan-1979 to Jun-2012
● 200-million events based on open news sources
● CAMEO event, actor and sub-state agent coding
● 15,000 verb phrase dictionary
● 40,000+ political actors and agents
● Geolocated to city level
● Current intake of 20,000 to100,000 stories per day
● Planned daily updates, backfit to 1800
● http://eventdata.psu.edu/data.dir/GDELT.html
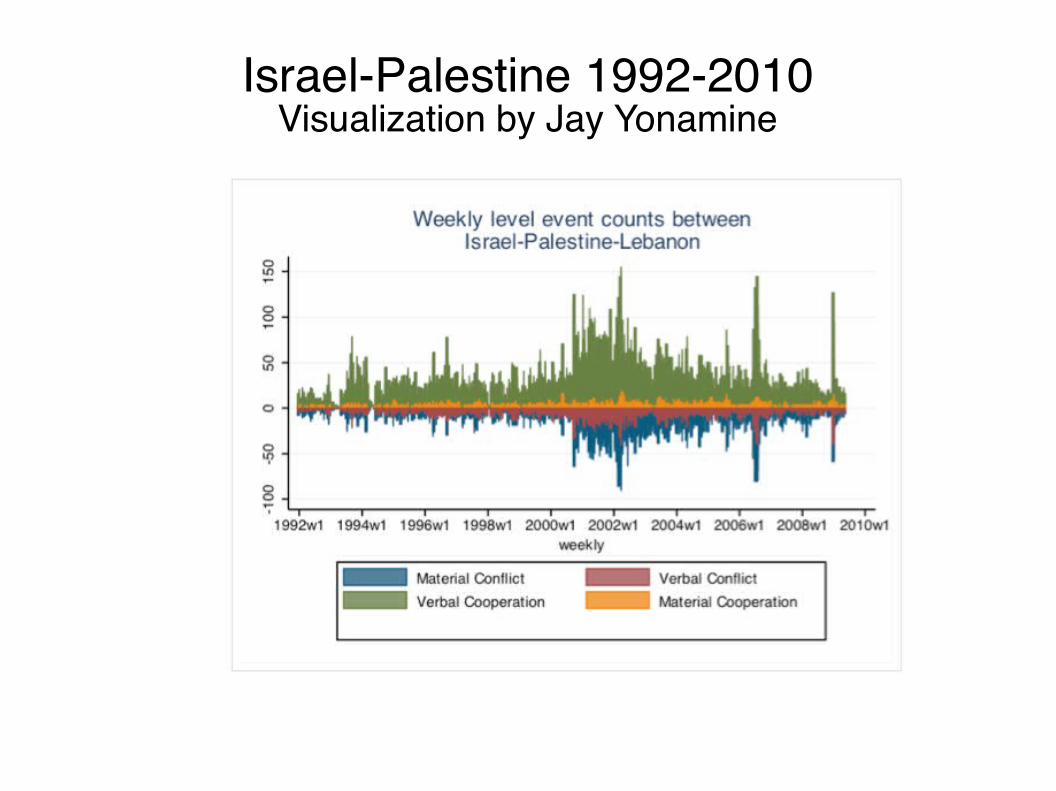
Israel-Palestine 1992-2010Visualization by Jay Yonamine

GDELT Quad Counts: China - Taiwan

GDELT: Civil Protests
Source: Rolf Fredheim,http://quantifyingmemory.blogspot.co.uk/2013/04/mapping-gdelt-data-in-r-and-some.html

GDELT: News intensity 29 Jan 2011
Source: Kalev Leetaru
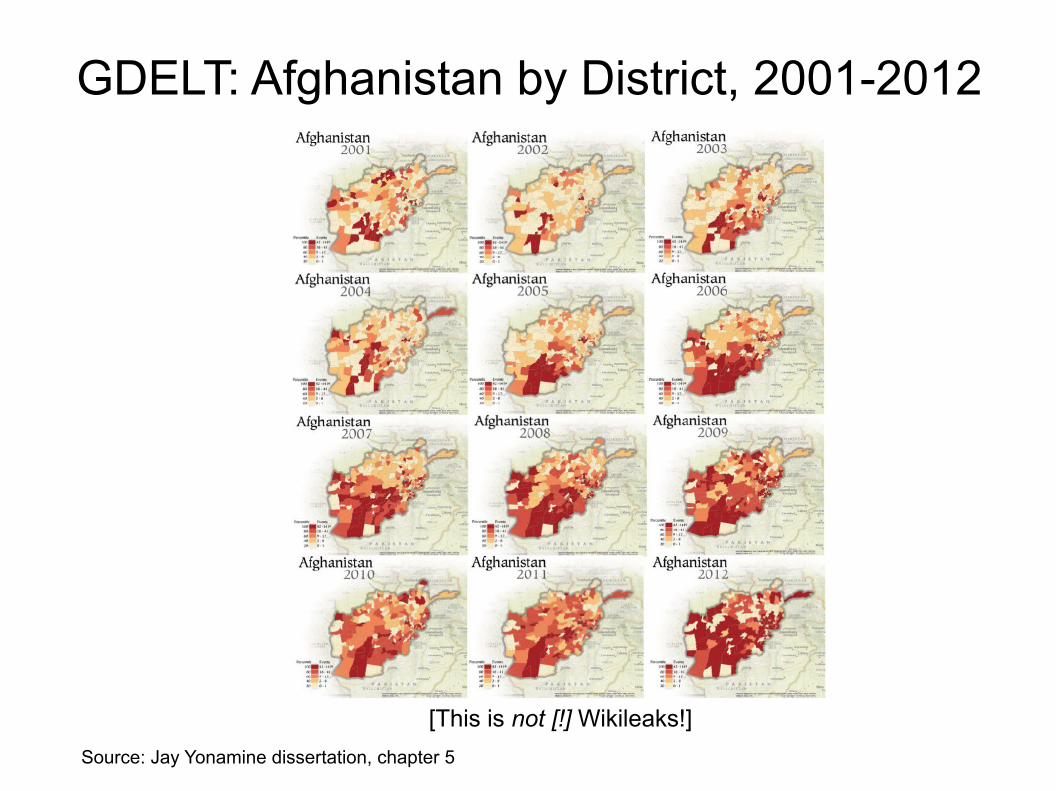
GDELT: Afghanistan by District, 2001-2012
[This is not [!] Wikileaks!]
Source: Jay Yonamine dissertation, chapter 5

Violence in Syria: Ushahihi and GDELT

Event Model: Core Innovation
● Once calibrated, real-time event forecasting models can be run entirely without human intervention
● Web-based news feeds provide a rich multi-source flow of political information in real time
● Statistical models can be run and tested automatically, and are 100% transparent
● In other words, for the first time in human history—quite literally—we have a system that can provide real-time measures of political activity without any human intermediaries
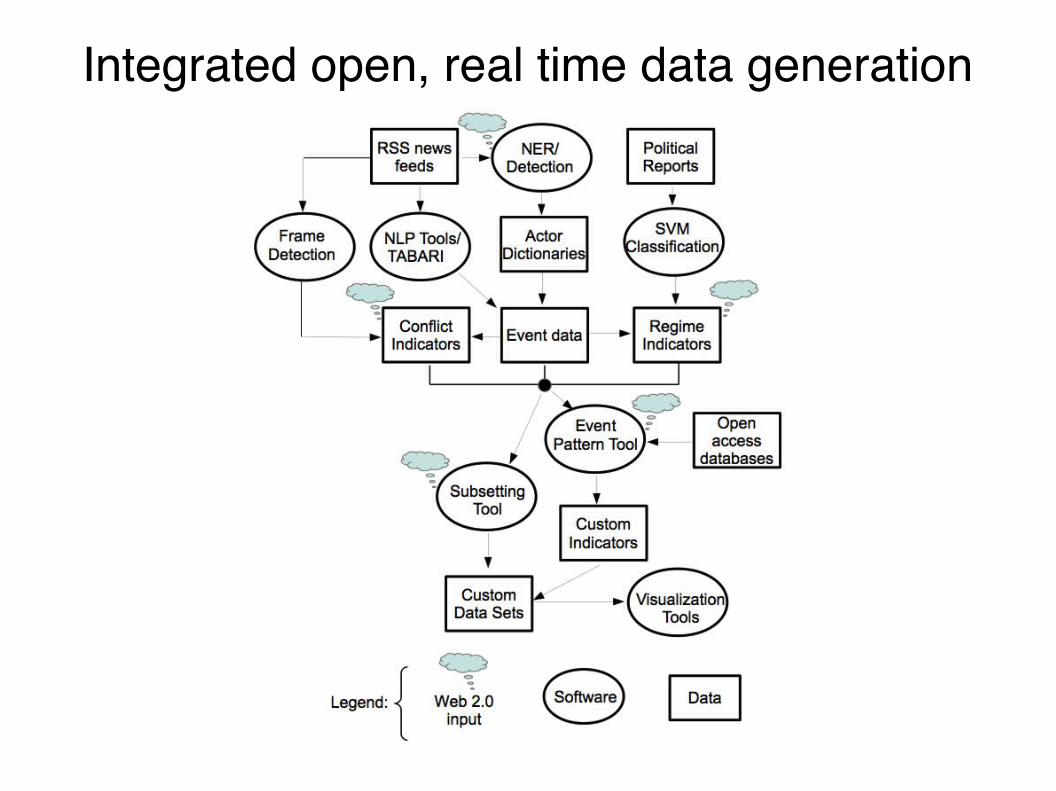
Integrated open, real time data generation
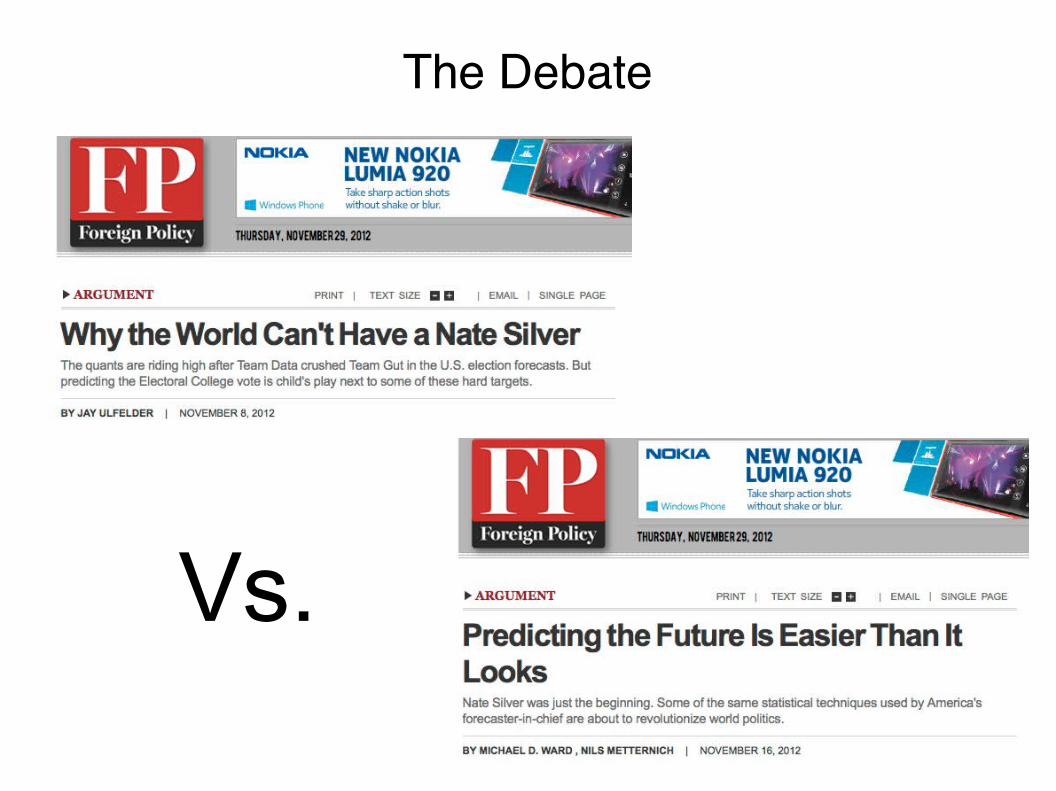
The Debate
Vs.

Factors encouraging technical political forecasting
● Success of forecasting models in other behavioral
domains● Macroeconomic forecasting [maybe...]● Elections: Nate Silver effect● Demographic and epidemiological forecasting● Famine forecasting: USAID FEWS model● Example: statistical models for mortgage repayment were quite accurate● Moneyball
● Technological imperative● Increased processing capacity● Information available on the web● “Moore’s Law states that computing power doubles every 18 months.
Human cognitive ability is pretty much a constant. This leads to some interesting and not always desirable substitution effects”Larry Bartels, Princeton University
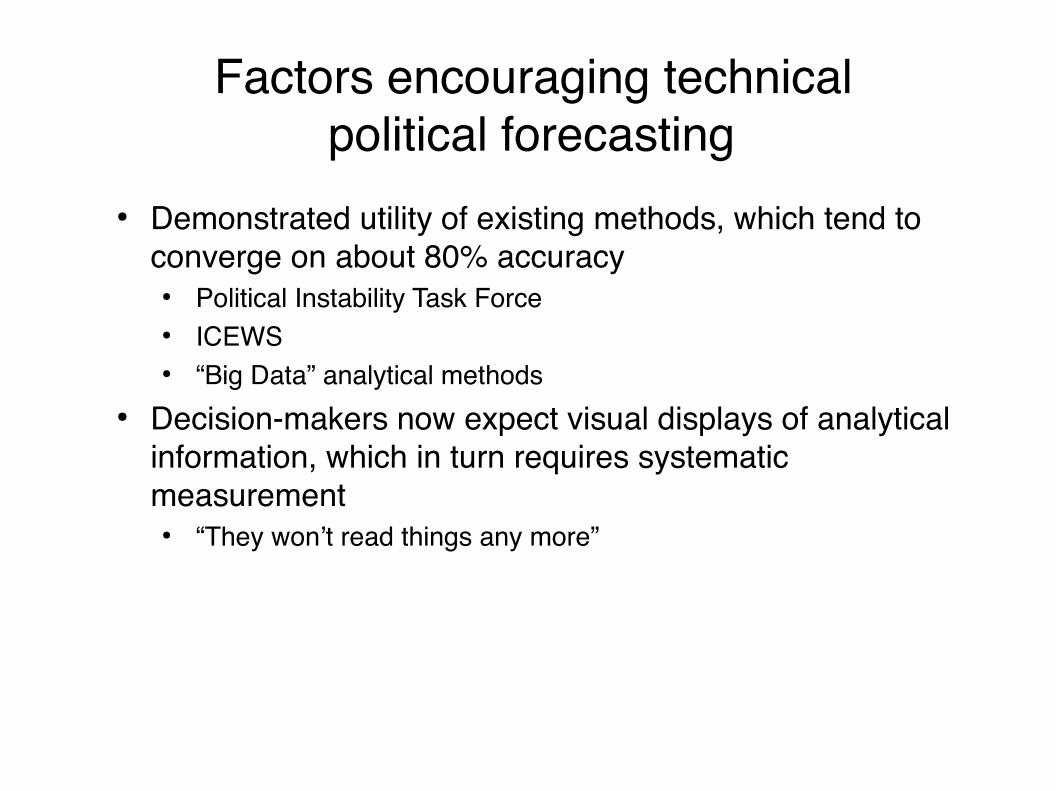
Factors encouraging technical political forecasting
● Demonstrated utility of existing methods, which tend to converge on about 80% accuracy
● Political Instability Task Force● ICEWS● “Big Data” analytical methods
● Decision-makers now expect visual displays of analytical information, which in turn requires systematic measurement
● “They won’t read things any more”

Contemporary Technical Political Forecasting
● State Failures Project 1994
● Joint Warfare Analysis Center 1997
● FEWER [Davies and Gurr 1998]
● Various UN and EU forecasting projects
● Center for Army Analysis 2002-2005
● Swiss Peace Foundation FAST 2000-present
● Political Instability Task Force 2002-present
● DARPA ICEWS 2007-present
● Peace Research Center Oslo (PRIO) and Uppsala University UCDP political forecasting models

Integrated Conflict Early Warning System
● Unclassified project funded by DARPA Information Processing Techniques Office
● Funding at $40-million for 2007-2011
● Largest quantitative conflict analysis project since the 1970s
● Objective is real-time forecasting of indicators of political instability in Asia with 6-24 month leads, 70%-80% accuracy
● Machine-coded event data has proven to be the core methodology for accurate forecasts
● Data covers 1997-present with 8.5-million stories from 27 sources
● Model accuracy has been assessed with a strict split-sample design
Reference:Sean O'Brien. Crisis early warning and decision support: Contemporary approaches and thoughts on future research. International Studies Review, 12(1):87-104, 2010.

ICEWS “Events of Interest”
Domestic Political Crisis—Significant opposition to the government, but not to the level of rebellion or insurgency (for example, power struggle between two political factions involving disruptive strikes or violent clashes between supporters)
Rebellion—Organized opposition where the objective is to seek autonomy or independence
Insurgency—Organized opposition where the objective is to overthrow the central government
Ethnic ⁄ Religious Violence—Violence between ethnic or religious groups that is not specifically directed against the government
International Crisis—Conflict between two or more states or elevated tensions between two or more states that could lead to conflict

ICEWS Evaluation Criteria
Accuracy=number of correct predictionstotal predictionsmade
Recall= number of correctly predicted conflictstotal conflicts that occured
Precision= numberof correctly predicted conflictstotal conflicts predicted
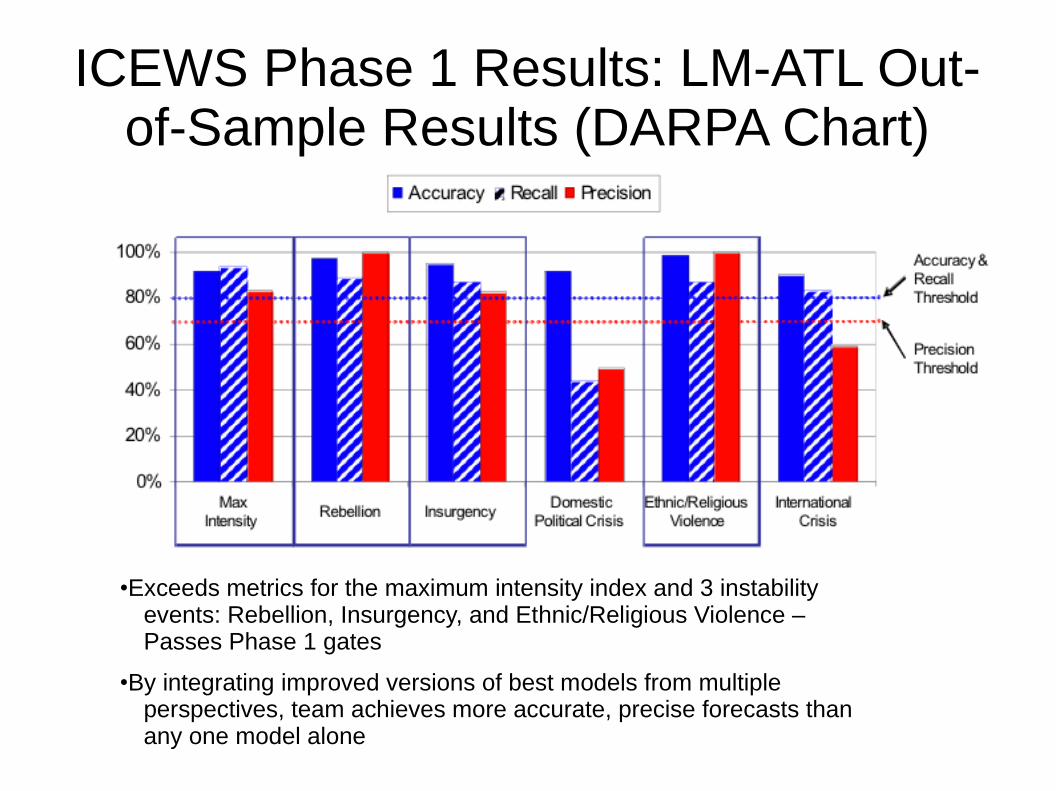
ICEWS Phase 1 Results: LM-ATL Out-of-Sample Results (DARPA Chart)
•Exceeds metrics for the maximum intensity index and 3 instability events: Rebellion, Insurgency, and Ethnic/Religious Violence – Passes Phase 1 gates
•By integrating improved versions of best models from multiple perspectives, team achieves more accurate, precise forecasts than any one model alone
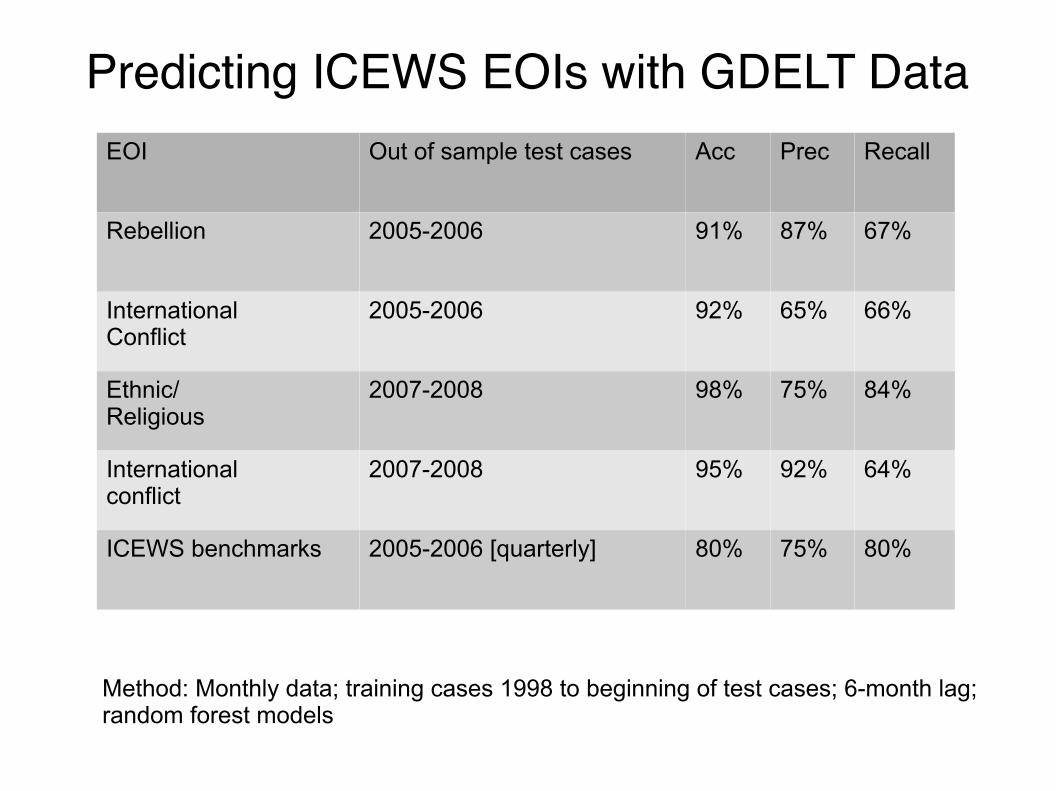
Predicting ICEWS EOIs with GDELT Data
EOI Out of sample test cases Acc Prec Recall
Rebellion 2005-2006 91% 87% 67%
International Conflict
2005-2006 92% 65% 66%
Ethnic/Religious
2007-2008 98% 75% 84%
International conflict
2007-2008 95% 92% 64%
ICEWS benchmarks 2005-2006 [quarterly] 80% 75% 80%
Method: Monthly data; training cases 1998 to beginning of test cases; 6-month lag;random forest models

Political Instability Task Force
● US government, multi-agency: 1995-present
● Statistical modeling of various forms of state-level instability
● Forecasting models actively used since about 2005
● Two year probability forecasts with roughly 80% accuracy (AUC)
● Predominantly logistic models with a simple “standard PITF” set of variables; shifting to Bayesian approaches
● Finances a variety of data sets, including Polity IV, Worldwide Atrocities Dataset, Institutions and Elections Data

But these models don't work! Wired magazine tells me so!

The Forecaster's Quartet
● Nassem Nicholas Taleb. The Black Swan[most entertaining]
● Daniel Kahneman. Thinking Fast and Slow[30 years of research which won Nobel Prize]
● Philip Tetlock. Expert Political Judgment[most directly relevant]
● Nate Silver.The Signal and the Noise: Why So Many Predictions Fail-but Some Don't [easiest read; examples from multiple domains]
The Forecaster's Quartet
● Nassem Nicholas Taleb. The Black Swan[most entertaining...or most obnoxious...]
● Daniel Kahneman. Thinking Fast and Slow[30 years of research which won Nobel Prize]
● Philip Tetlock. Expert Political Judgment[most directly relevant]
● Nate Silver.The Signal and the Noise: Why So Many Predictions Fail-but Some Don't [easiest read; examples from multiple domains]

Irreducible sources of error
● Specification error: no model of a complex, open system can contain all of the relevant variables;
● Measurement error: with very few exceptions, variables will contain some measurement error
● presupposing there is even agreement on what the “correct” measurement is in an ideal setting;
● Predictive accuracy is limited by the square root of measurement error: if your reliability is 80%, your accuracy can't be more than 90%
● Free will
● Rule-of-thumb from our rat-running colleagues:“A genetically standardized experimental animal, subjected to carefully controlled stimuli in a laboratory setting, will do whatever it wants.”
● Quasi-random structural error: Complex and chaotic deterministic systems behave as if they were random under at least some parameter combinations
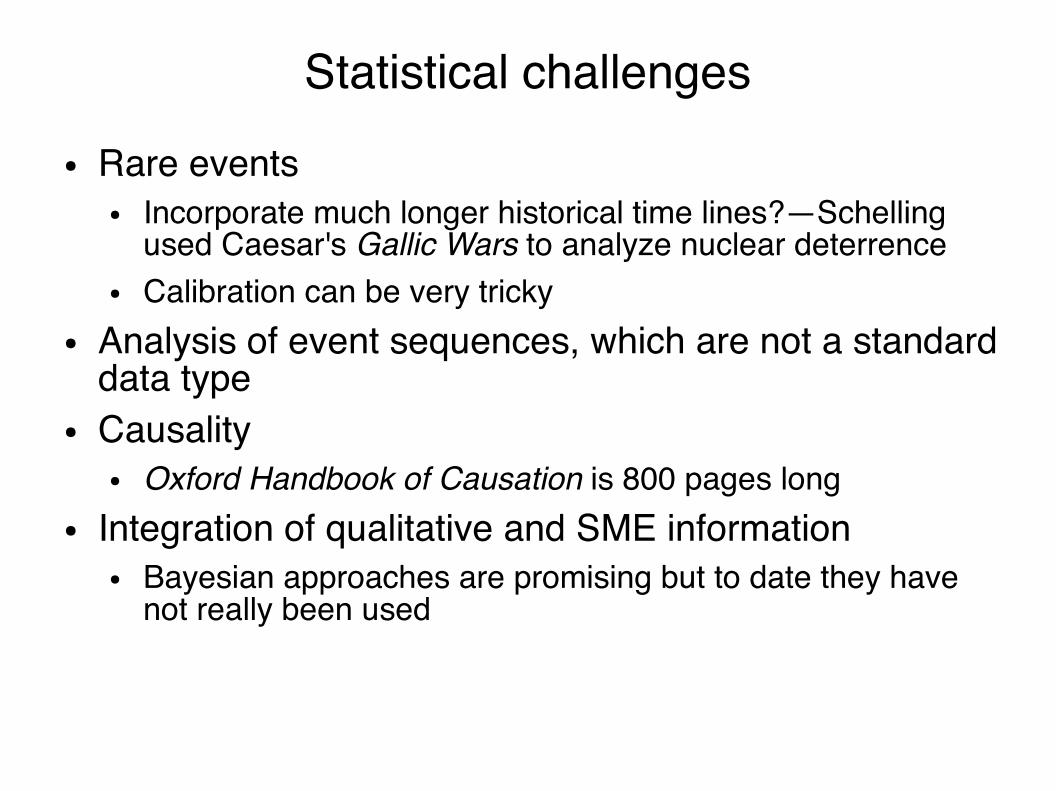
Statistical challenges
● Rare events● Incorporate much longer historical time lines?—Schelling
used Caesar's Gallic Wars to analyze nuclear deterrence
● Calibration can be very tricky
● Analysis of event sequences, which are not a standard data type
● Causality● Oxford Handbook of Causation is 800 pages long
● Integration of qualitative and SME information● Bayesian approaches are promising but to date they have
not really been used

Choice of model matters
• Arab Spring is an unprecedented product of the new social mediao Model used by Chinese censors of NSM: King, Peng,
Roberts 2012o Next likely candidates: Africa
• Arab Spring is an example of an instability contagion/diffusion processo Eastern Europe 1989-1991, OECD 1968, CSA 1859-1861,
Europe 1848, Latin America 1820-1828o Next likely candidates: Central Asia
• Arab Spring is a black swano There is no point in modeling black swans, you instead build
systems robust against them

Why do data based methods fail?● Clever anecdotes/charm/rank trump data
● Moneyball, managed mutual funds
● Ideology trumps data● 2012 Romney campaign
● “It is difficult to get a man to understand something, when his salary depends on his not understanding it.”― Upton Sinclair
● Sub-prime mortgage crisis
● The model was incorrect● Reinhart-Rogoff debt/growth model (using Excel also doesn't help)
● Black swans: very low probability events which by definition cannot be predicted
● Taleb: don't use normal-distribution models in a power-law world
● Difficulties of incorporating probabilistic reasoning by individuals and organizations
● You aren't stupid, you're human

DARPA-World

NNT-World
Why should we care about ducks?
Size
Variety
QuantitySuspicious behaviors

Where should new efforts go?
● More precise data?
● We may be at a point of diminishing returns here
● There is no point in precisely measuring noise
● Better models?
● Machine learning and Bayesian models present new opportunities
● But only if the results can be correctly understood
● Analyzing how probabilistic forecasts can be incorporated into the decision-making process
● Preferably before the Chinese do...
Philip A. Schrodt
Political Science
Pennsylvania State University
State College, PA 16802
Phone: 814-863-8978
Email: [email protected]
Project Web Site: http://eventdata.psu.edu
Questions?
