quantitative foresight modeling to inform the cgiar research program portfolio - mark w. rosegrant
TRANSCRIPT

Quantitative Foresight Modeling to Inform the CGIAR Research Program Portfolio
Mark W. RosegrantDirector, Environment and Production Technology Division, IFPRI
The CGIAR @ 45: How to boost its contribution to world welfare Lima, Peru, May 26, 2016

Overview
Methodology and Key Activities
Implications for Portfolio Design
Concluding Remarks
Outline

Overview

IFPRI + other CGIAR Centers – collaboratively conducting quantitative analyses • Alternative future scenarios to inform decisions on the design of CGIAR research program portfolio
• 2017‐2022, 2030 and 2050
One of multiple inputs into priority setting by CGIAR• Quantitative exercise • Consultation with partners • Qualitative analysis
Overview

Methodology and Key Activities

Current scenario exercise funded by USAID Draws upon the tools developed by Centers and external partners collaborating in the Global Futures and Strategic Foresight program Global Futures and Strategic Foresight program
• CGIAR initiative led by IFPRI (at present funded by PIM, CCAFS, and the Bill and Melinda Gates Foundation)
• Includes 15 CGIAR Centers and supports the prioritization of research across CRPs as well as within CRPs and Centers
Methodology: Quantitative Assessment
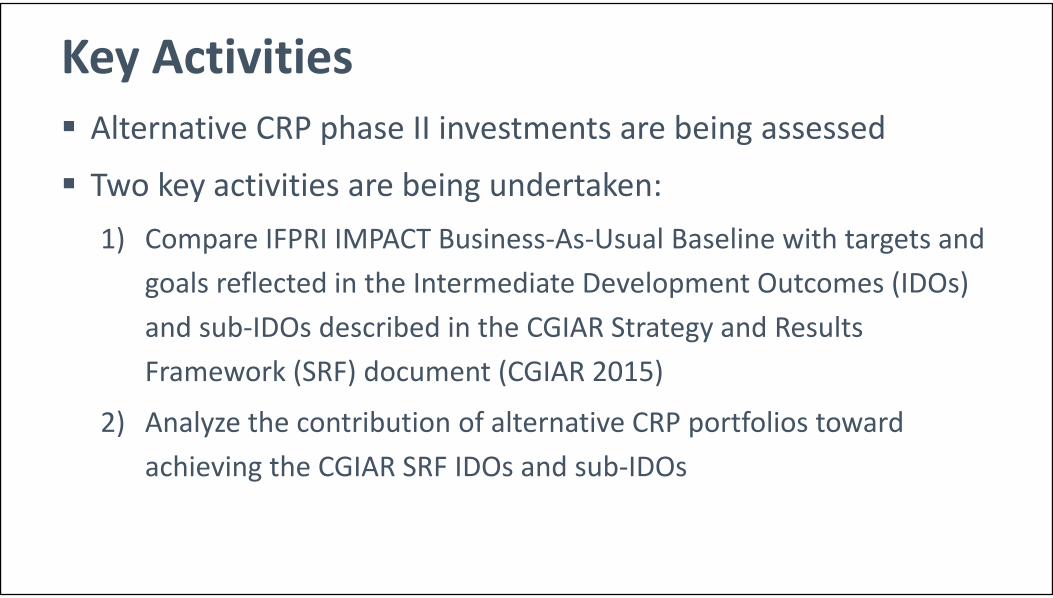
Alternative CRP phase II investments are being assessed
Two key activities are being undertaken:1) Compare IFPRI IMPACT Business‐As‐Usual Baseline with targets and
goals reflected in the Intermediate Development Outcomes (IDOs) and sub‐IDOs described in the CGIAR Strategy and Results Framework (SRF) document (CGIAR 2015)
2) Analyze the contribution of alternative CRP portfolios toward achieving the CGIAR SRF IDOs and sub‐IDOs
Key Activities

POLICIES AND DRIVERS
LINKED MODELS
OUTCOMES (Annual Projections)
• GDP• Population• Climate Change• Investment in
‐ Agricultural R&D‐ Irrigation and Water Management
• Technology• Post‐harvest Losses and Marketing Margins
• Price Policy
• Employment, GDP, and Household Income in Agriculture, Industry, Services
• International Trade by Sector
• GHG Emissions• Deforestation• Biodiversity• Soil Carbon• Energy Use
• Water demand and supply for domestic, industrial, livestock and irrigation users
• Water supply reliability• Water quality
• Crop area / livestock numbers, yields, and production
• Agricultural commodity demand
• Agricultural commodity trade and prices
• Hunger and malnourishment• Micronutrient consumption
Quantitative Assessment Scenarios
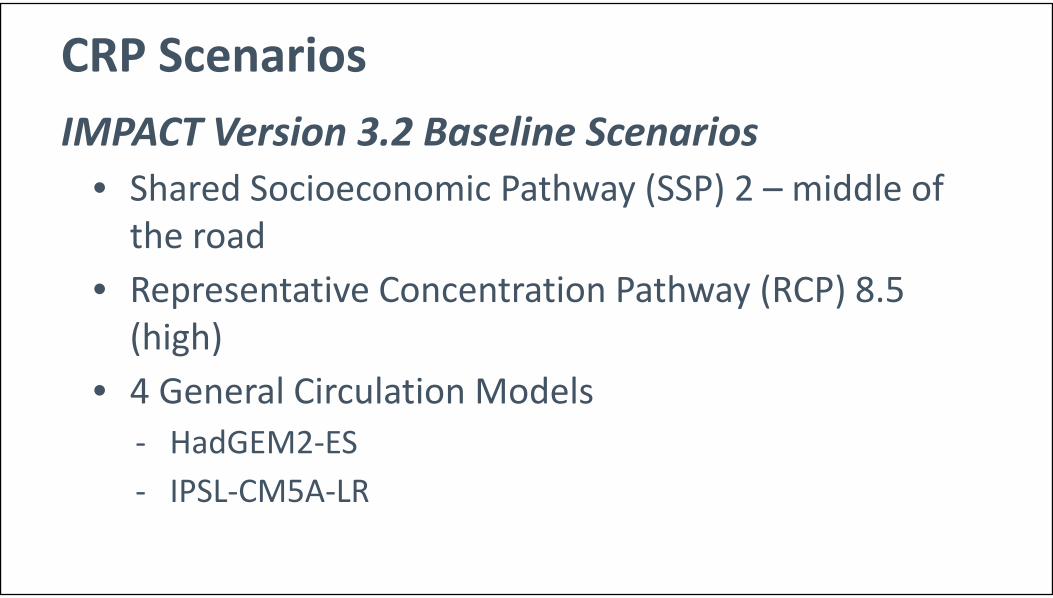
IMPACT Version 3.2 Baseline Scenarios• Shared Socioeconomic Pathway (SSP) 2 – middle of the road
• Representative Concentration Pathway (RCP) 8.5 (high)
• 4 General Circulation Models‐ HadGEM2‐ES‐ IPSL‐CM5A‐LR
CRP Scenarios

Alternative Portfolio Scenarios • Broadly reflective of alternative CRP portfolios –but not specific CRP proposals
• Different regional emphases• Different commodity group and system emphases
• Policy and natural resource management
CRP Scenarios

Alternative research investment and productivity growth rates (base, high, low)
Improved research efficiency: reduced lag times due to reform of regulatory systems and breeding systems
Increased irrigation investment: faster growth in irrigated area and higher water use efficiency
CRP Scenarios

Improved value chains (reduced marketing margins and reduced post‐harvest losses)
Improved soil quality (organic matter and water holding capacity)
Improved nutrient use efficiency
Trade policy: alternative border measures
CRP Scenarios

IMPACT
IMPACT Global Hydrological
Model
IMPACT Water Simulation Model
DSSAT Crop Models
GCM Climate Forcing
Effective PPotential ET
IRW
Irrigation Water Demand & Supply
Crop Management
WATER STRESS
Pop & GDP growth
Area & yield growth
Food Projections• Crop area /livestocknumbers, yields,and production
• Agriculturalcommoditydemand
• Agriculturalcommoditytrade and prices
• Hunger andMal‐nourishment
Water Projections• Water demand and supply for domestic, industrial, livestock and irrigation users• Water supply reliability
GLOBE CGE modelChange in GDP, cost of agrochemicals and biofuel mix
Food models
Water models
Macroeconomic policies and shocks
Method: IMPACT with CGE linkage

Model baselines are calibrated on agricultural productivity, GDP and prices and economy‐wide GDP
Climate shocks on agricultural productivity and prices are transmitted from IMPACT to GLOBE, with further iteration back to IMPACT for economy‐wide feedbacks to agriculture
Macro policy shocks on household income and GDP are transmitted from GLOBE to IMPACT
Employment and income effects of agricultural policies and investments are captured
GLOBE‐IMPACT linkage

Raw data
FAO Food Balance Sheets
Alcoholic beverages
Aquatic foods
Shared Socioeconomic
Pathways (SSPs)
Scenarios of population
growth and age and gender distribution
IMPACT scenarios
consumption results
Income growth
Population growth
Technology changes
Nutrient content tables
IMPACT commodity to consumed product
Cooking retention
Food and staple groups
Dietary Reference
Intakes (DRIs)
Estimated Average
Requirement (EAR)Recommende
d Daily Allowance
(RDA)/Adequate Intake (AI)
Tolerable Upper Intake Level (UL)
Assessment of Nutritional Impacts
Source: G. Nelson, under preparation

Data Alignment
Commodity grouping
Age and gender groupingRegional
aggregation
Indicators
Consumption diversity (Share of nutrient from staple/food group)
Nutritional adequacy (Share of nutrient
requirement consumed)
Nutritional performance indicators: Impacts of …
Climate change
Research productivity improvements
Policy changes
Assessment of Nutritional Impacts
Source: G. Nelson, under preparation

IMPACT
IMPACT
SSPs
Land Use Change (LandSHIFT)Includes cropland, pasture, forest cover, other natural land, set aside
Source: Center for Environmental Systems Research: LandSHIFThttps://www.uni‐kassel.de/einrichtungen/en/cesr/research/projects/.../landshift.html

IMPACT
DSSAT Crop
Models
GCM Climate Forcing
Irrigation Water
Demand & Supply
Crop Management
WATER STRESS
Population & GDP growth
Area & yield growth
•Crop area
•Crop yield• Soil C sequestration•N2O emission
•CH4 emission (IPCCTier 1 methodology)
Grid‐based modeling
Cropj GWP in pixelk × Cropj area in pixelkj,kCropland GHG emission in FPU =
GHG emissions‐IMPACT linkage

Biodiversity Threat Analysis: Framework
Birdsdistribution, richness & endemicity
Bird’sbio‐regions
Food Production Units (FPU)
Data collection
CurrentLand Use map
Bird’s Extinctionrisk under current
land use
Baseline & Model Calibration and
validation
Climate Data
Bird’s Extinctionrisk under current
climate
CC and LU Projections
scenario 1
land use LU scenario n
Birds Risk toextinction
LU scenario 2
LU scenario 1
scenario 1
land use CC scenario n
Birds Risk toextinction
CC scenario 2
CC scenario 1
BIO risk Projections
Source: Developed by Bárbara Willaarts, Research Centre for the Management of Agricultural and Environmental Risks (CEIGRAM), Department ofAgricultural Economics and Social Sciences, Universidad Politécnica de Madrid, Madrid, Spain; Flachsbarth, et al. 2015. The Role of Latin America’s Land and Water Resources for Global Food Security: Environmental Trade‐Offs of Future Food Production Pathways. PLOS ONE 10 (1): 1‐24

Agricultural Water Pollution Assessment: Framework and Sample Results
IMPACT
SWAT
National total
Pixel
N & P in fertilizer & manure to agricultural land
FAOSTAT (base year data)
Crop area/yield/production
Livestock numbers
Projections for scenario analysis
Sample results on agricultural nitrogen loading in base year(Source: IFPRI and Veolia 2015)
Downscaling
Metrics: N & P from arable land

Implications for Portfolio Design

Results of these scenarios can inform decision making at the CGIAR System level
Related to but different from scenarios to inform decision making at the CRP or Center level
Needs to be part of an on‐going process of analysis and discussion
Implications/Insights

Inform decisions about what specific activities are highest priority • What flagship activities should get additional funding; at the consortium level (allocating W1 and 2 funds across CRPs)
• In a CRP• At a Center
Basic implementation is technically straightforward, but efficiency gains would require • Investment in modeling improvements• Integrated, ongoing system that tracks activities ex‐ante, en‐passant, and ex‐post
Inclusion of Fine‐grained Technology Modeling for Operational Efficiency Gains

Concluding Remarks

Completion of report for USAID On‐going improvements in modeling tools and applications Multiple consuming households (low and high incomes; urban and rural) Incorporate climate variability explicitly Economic valuation Update/improve trade distortion parameters Improve demand parameters
On‐going dialogue with partners in the CGIAR and beyond
Next steps in Modeling to Inform Priority Setting

Thank you
Mark W. RosegrantDirector, Environment and Production Technology Division, IFPRI
The CGIAR @ 45: How to boost its contribution to world welfare Lima, Peru, May 26, 2016