quantitative genetics of butterfly wing color patterns
TRANSCRIPT

DEVELOPMENTAL GENETICS 15:79-91(1994)
Quantitative Genetics of Butterfly Wing Color Patterns SUSAN M. PAULSEN Department of Zoology, Duke University, Durham, North Carolina
ABSTRACT Developmental processes ex- ert their influence on the evolution of complex mor- phologies through the genetic correlations they en- gender between traits. Butterfly wing color patterns provide a model system to examine this connection between development and evolution. In butterflies, the nymphalid groundplan is a framework used to decompose complex wing patterns into their com- ponent pattern elements. The first goal of this work has been to determine whether the components of the nymphalid groundplan are the products of in- dependent developmental processes. To test this hypothesis, the genetic correlation matrices for two species of butterflies, Precis coenia and Precis ev- arete, were estimated for 27 wing pattern charac- ters. The second purpose was to test the hypothesis that the differentiation of serial homologs lowers their genetic correlations. The ”eyespots” found serially repeated across the fore- and hindwing and on the dorsal and ventral wing surfaces pro- vided an opportunity to test this hypothesis. The genetic correlation matrices of both species were very similar. The pattern of genetic correlation measured between the different types of pattern elements and between the homologous repeats of a pattern element supported the first hypothesis of developmental independence among the elements of the groundplan. The correlation pattern among the differentiated serial homologs was similarly found to support the second hypothesis: pairs of eyespots that had differentiated had lower genetic correlations than pairs that were similar in mor- phology. The implications of this study are twofold: First, the apparent developmental independence among the distinct elements of wing pattern has facilitated the vast diversification in morphology found in butterflies. Second, the lower genetic cor- relations between differentiated homologs demon- strates that developmental constraints can in fact be broken. The extent to which genetic correlations readily change, however, remains unknown. 0 1994 Wiley-Liss, Inc.
Key words: Butterfly wing patterns, developmen- tal constraints, genetic correlations, nymphalid ground pla n, quantitative genetics
INTRODUCTION The evolution of any complex morphology is gov-
erned by the genetic correlations among its compo- nents [see Lande, 1979; Lande and Arnold, 19831. In turn, the correlation structure is to a large extent de- termined by development [Cheverud, 1984, see also Ar- nold, 19921. The constraining influence of development on evolution has been used to explain why particular morphologies have nut evolved, or why the response to selection is not optimal [Cheverud, 1984; Maynard Smith et al., 19851, but has also been applied in a pos- itive sense to explain how “constraints” can channel evolution [Gould, 19891. The study of butterfly wing color patterns provides an opportunity for learning how developmental processes can influence the course of evolution through the correlations they engender.
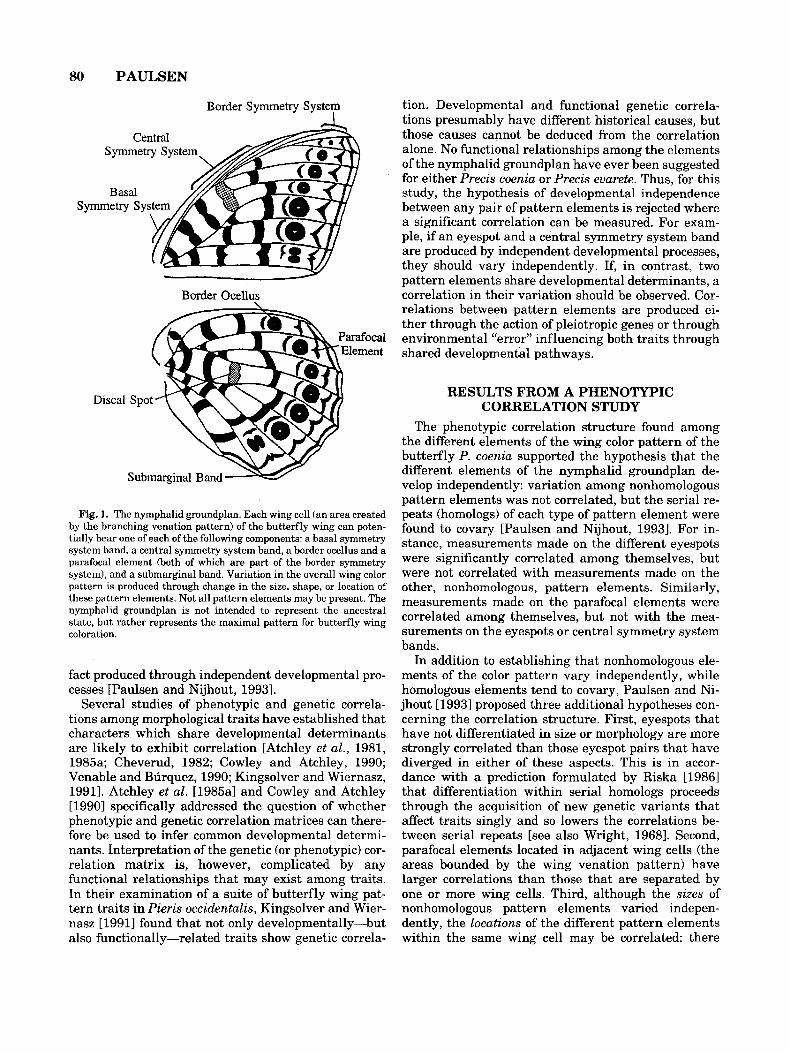
Description of variation in wing color patterns, both within and between species, is facilitated by a system of pattern element identification known as the nymph- alid groundplan [see Nijhout, 19911. Under this sys- tem, variation in butterfly wing pattern can be de- scribed in terms of variation in each of several component pattern elements: border ocelli (eyespots), parafocal elements, central symmetry system bands, and basal symmetry system bands (Fig. 1). Each pat- tern element may be serially repeated from one wing cell to the next (here “wing cell” refers to an area of the wing bounded by the venation), and these homologous repeats may differ in size, shape, and location within the wing cell. The vast diversity of butterfly wing color patterns can be understood in terms of variation in these basic pattern elements [Suffert, 1927; Schwan- witsch, 1949, 1956a,b; Nijhout and Wray, 1986, 1988; Nijhout, 19911. The success with which the nymphalid groundplan has been used to catalog variation is due to the apparent modularity of the pattern elements of butterfly wing patterns. This has raised the question of whether or not the elements of the groundplan are in
Received for publication August 4, 1993; accepted October 28,1993.
Address reprint requests to Susan M. Paulsen, Department of Zool- ogy, Duke University, Durham, NC 27708.
0 1994 WILEY-LISS, INC.
80 PAULSEN
Border Symmetry System L
Border Ocellus
Disc :a1
Fig. 1. The nymphalid groundplan. Each wing cell (an area created by the branching venation pattern) of the butterfly wing can poten- tially bear one of each of the following components: a basal symmetry system band, a central symmetry system band, a border ocellus and a parafocal element (both of which are part of the border symmetry system), and a submarginal band. Variation in the overall wing color pattern is produced through change in the size, shape, or location of these pattern elements. Not all pattern elements may be present. The nymphalid groundplan is not intended to represent the ancestral state, but rather represents the maximal pattern for butterfly wing coloration.
fact produced through independent developmental pro- cesses [Paulsen and Nijhout, 19931.
Several studies of phenotypic and genetic correla- tions among morphological traits have established that characters which share developmental determinants are likely to exhibit correlation [Atchley et al., 1981, 1985a; Cheverud, 1982; Cowley and Atchley, 1990; Venable and Bdrquez, 1990; Kingsolver and Wiernasz, 19911. Atchley et al . [1985al and Cowley and Atchley [19903 specifically addressed the question of whether phenotypic and genetic correlation matrices can there- fore be used to infer common developmental determi- nants. Interpretation of the genetic (or phenotypic) cor- relation matrix is, however, complicated by any functional relationships that may exist among traits. In their examination of a suite of butterfly wing pat- tern traits in Pieris occidentalis, Kingsolver and Wier- nasz [ 19911 found that not only developmentally-but also functionally-related traits show genetic correla-
tion. Developmental and functional genetic correla- tions presumably have different historical causes, but those causes cannot be deduced from the correlation alone. No functional relationships among the elements of the nymphalid groundplan have ever been suggested for either Precis coenia or Precis euarete. Thus, for this study, the hypothesis of developmental independence between any pair of pattern elements is rejected where a significant correlation can be measured. For exam- ple, if an eyespot and a central symmetry system band are produced by independent developmental processes, they should vary independently. If, in contrast, two pattern elements share developmental determinants, a correlation in their variation should be observed. Cor- relations between pattern elements are produced ei- ther through the action of pleiotropic genes or through environmental “error” influencing both traits through shared developmental pathways.
RESULTS FROM A PHENOTYPIC CORRELATION STUDY
The phenotypic Correlation structure found among the different elements of the wing color pattern of the butterfly P. coenia supported the hypothesis that the different elements of the nymphalid groundplan de- velop independently: variation among nonhomologous pattern elements was not correlated, but the serial re- peats (homologs) of each type of pattern element were found to covary [Paulsen and Nijhout, 19931. For in- stance, measurements made on the different eyespots were significantly correlated among themselves, but were not correlated with measurements made on the other, nonhomologous, pattern elements. Similarly, measurements made on the parafocal elements were correlated among themselves, but not with the mea- surements on the eyespots or central symmetry system bands.
In addition to establishing that nonhomologous ele- ments of the color pattern vary independently, while homologous elements tend to covary, Paulsen and Ni- jhout 119931 proposed three additional hypotheses con- cerning the correlation structure. First, eyespots that have not differentiated in size or morphology are more strongly correlated than those eyespot pairs that have diverged in either of these aspects. This is in accor- dance with a prediction formulated by Riska [19861 that differentiation within serial homologs proceeds through the acquisition of new genetic variants that affect traits singly and so lowers the correlations be- tween serial repeats [see also Wright, 19681. Second, parafocal elements located in adjacent wing cells (the areas bounded by the wing venation pattern) have larger correlations than those that are separated by one or more wing cells. Third, although the sizes of nonhomologous pattern elements varied indepen- dently, the locations of the different pattern elements within the same wing cell may be correlated: there

QUANTITATIVE GENETICS OF BUTTERFLY COLOR PATTERNS 81
were significant positive correlations between the po- sition measures for parafocal elements and eyespots within the same wing cell. The phenotypic correlation study confirmed the second and third hypotheses, but produced mixed evidence on the correlation pattern for differentiated and undifferentiated eyespot pairs [Paulsen and Nijhout, 19931.
GENETIC CORRELATION MATRIX While the phenotypic correlation matrix is much eas-
ier to estimate accurately than the genetic correlation matrix [Klein et al., 1973; Klein, 1974; Shaw, 1987; Cheverud, 19881, it is the genetic correlation matrix which is of central interest in evolutionary studies. In addition, although both phenotypic and genetic matri- ces may be used to infer shared developmental deter- minants [Cheverud, 19881, it is possible that environ- mental effects reflected in the phenotypic correlations could act through pathways distinct from those through which genetic determinants act. Furthermore, Cheverud [1982] found that although the phenotypic correlations among developmentally or functionally re- lated traits were substantially higher than those among unrelated traits, the genetic correlations were only modestly greater for related than unrelated traits.
The aim of the present study is to determine if the genetic correlation structure resembles the previously described phenotypic correlation structure. Specifi- cally, the goal is first to determine if the sizes of ho- mologous color pattern elements are genetically corre- lated, while those of nonhomologous elements are not. A second purpose is to more rigorously test Riska’s [ 19861 hypothesis concerning the evolution of serial ho- mologs, i.e., to determine if the genetic correlation is lowered among serial repeats in the processes of differ- entiation.
MATERIALS AND METHODS Estimation of the Genetic Correlation Structure
A study conducted to test the constancy of quantita- tive genetic parameters at the species level [Paulsen, 19921 provided the raw data on P. coenia and P. evarete (Lepidoptera: Nymphalidae) from which size-adjusted genetic correlations could be estimated. The breeding methods used are briefly outlined here; specific details may be found in Paulsen [19921.
Gravid adult females were collected from the field for each species. P. evarete were collected from the Vero BeacWFort Pierce area in Florida, and P. coenia were collected in Durham County, North Carolina. The off- spring from these field-collected females were raised in the lab and provided a population from which individ- uals were drawn for controlled crosses. For P. coenia 161 crosses were successfully completed; 150 pairs of P. evarete mated successfully. From each cross 20 larvae were raised under standard rearing conditions (16L: 8D, 27”C), with each individual grown in a separate
container to minimize any covariance among full-sibs due to environmental effects.
A total of 45 measurements were made on each par- ent and five of their offspring for each sex (when at least five of each sex had been produced). Measure- ments were made using a video digitizing system on an Amiga Commodore computer by recording the x- and y-coordinates for 49 landmark points on the wing pat- tern. Measurements were made to approximately the nearest 50 km, and all specimens were measured in a predetermined random order. When the landmarks that defined a trait were not visible, usually due to damage to the wing, the trait was scored as “missing.” A large number of missing values in the parental gen- eration for some traits significantly lowered the num- ber of crosses from which the genetic correlations in- volving those traits could be estimated.
Figure 2 illustrates the wing pattern traits mea- sured in this study. Landmark points on the wing vena- tion were used to measure the overall size and shape of the fore- and hindwing. Measurements such as VF1, VF3, VH1, and VH3 roughly reflect the length of the wing, while VF2, VF4, VH2, and VH4 reflect wing width. The diameter of each of the 11 eyespots was measured as the distance between the two points at which the eyespot’s ring intersected the midline crease of its wing cell (measures EYE1 . . . EYE11). Addi- tional ring diameter measurements were made on three of the eyespots (DIAM3, DIAM4, and DIAM11). The position of each eyspot was measured as the dis- tance from the center of the eyespot to the wing margin (EP1 . . . EP11). Three of the parafocal elements were measured (PA1, PA2, and PA3). Variation in the loca- tion of the parafocal element was quantified by the distance from the wing margin to the point at which the more distal edge of its outline intersected the mid- line crease. This measure also reflected the extent to which the parafocal element was “peaked” at its center. As with the parafocal elements, a subset of the central symmetry system bands was measured (CSS1 and CSSZ). The distance was taken from the apex of the wing cell in which each central symmetry system band was located to the point at which the most distal por- tion of the band intersected the midline crease.
For both species, females were on average signifi- cantly larger than males in overall body size as well as the size of each trait. Therefore, in order to combine the male and female data in a single analysis, measure- ments were first transformed so that males and fe- males had equal means for each trait [Falconer and King, 19531. Letting r equal the ratio of the mean trait value for males to that for females, each female value was multiplied by Ih(1 +r), and each male value by lh(1 + 1 lr) .
Accounting for General Size Variation Morphological traits are typically measured by the
distances between pairs of landmarks. As a conse-

82 PAULSEN
A R I I I I I I I I I I I I I I I I
C I I I I I I I I I I I I s I I I
I I I I I I I I I I I I I I I I
D I I I I I I I I I I I I I I I I
Fig. 2. Measurements made on the wing pattern. A Distances between landmarks on the wing venation which can be used to assess the size and shape of the wings. B: Diameter measures made on each of the 11 eyespots (border ocelli). C: Three measures made on representative parafocal elements and two measures made on representative central symmetry system bands. D: Position measurements made on each of the eyespots.
quence, the magnitude of such measurements will in part reflect the overall size of an individual. Thus, re- gardless of whether or not traits share developmental pathways through which genetic or environmental in- fluences act, large positive correlations can arise when measurements are made on specimens of varying size [Wright, 1954, 1968; Bookstein et al., 19851. The influ- ence of general size factors on the correlations among traits has been well investigated in phenotypic mor- phometric studies; however, the implications of size ef- fects for the interpretation of quantitative genetic pa- rameters have received little attention [but see Atchley et al., 1985b; Crespi and Bookstein, 19891.
Understanding the influence of general size varia- tion on the pattern of covariation among traits is crit- ical to the interpretation of the genetic correlations. The consequence of size variation is that, in addition to the genetic variation which specifically influences the traits of interest, the genetic variation which deter-
mines overall size will contribute to the estimates of genetic correlations (as well as the heritabilities). When heritabilities are estimated from the raw trait values, they will reflect not only variation at the genes that affect a trait specifically, but also variation in those genes that affect the overall size of the organism. Similarly, the genetic correlations will reflect not only genes with pleiotropic effects on specific traits, but also genes that simply influence general size (and so could be considered pleiotropic in the most extreme sense).
The 15 measurements made between the wing vein landmarks provided the means to assess the overall size of each individual. A principal components analy- sis was performed for each species separately using the transformed offspring data on these measures. The first principal component provided a reasonable proxy for general wing size [Jolicoeur, 1963; Bookstein et al., 1985); however, the vast majority of parents were miss- ing measurements for at least one of these traits. Thus

QUANTITATIVE GENETICS OF BUTTERFLY COLOR PATTERNS 83
large number of missing values for the wing vein mea- sures in the parental generation precluded using an individual’s score on the first principal component as a measure for its overall wing size.
An alternative to using the first principal component to represent overall size was to find a wing size mea- sure that would not only be strongly correlated with the first principal component, but would also be mea- surable in the parental generation. It was important to find a proxy for size that could be evaluated in both parents for the largest number of families possible be- cause this number would place an upper bound on the number of families available for estimating the genetic correlation using the size-adjusted trait values. DF3, a vein length measurable on both parents for 138 P. co- enia families and 114 P. evarete families, was chosen to estimate overall wing size. For P. coenia, the correla- tion between DF3 and overall size from the principal components analysis was 0.95; and for P. evarete, the correlation was 0.92. Although from some theoretical viewpoints the first principal component would have been preferred as a proxy for general size, DF3 pro- vided a good substitute.
Each trait measurement on an individual was ad- justed for the overall wing size of that individual through regression on DF3. For each of the traits mea- sured in this study and for each individual, the residual value from the regression replaced the raw trait value, i.e., the difference between the expected value for a trait given the individual’s wing size and that individ- ual’s actual value became its size-adjusted trait value. In order to construct the regression line for each trait, all of the data from both the parent and offspring gen- eration were pooled.
Estimation of Genetic Correlations Standard quantitative genetic methods [Becker,
1984; Falconer, 19891 were applied with slight modifi- cation to calculate the genetic correlations from regres- sion on the midparent values. The two cross-covari- ances, i.e., the covariance between trait i measured in the parent (Xi ) and trait j measured in the offspring (Yj), or, conversely, from trait j in the parent and i in the offspring, were averaged to estimate the genetic correlation between two traits using:
%, J)cOvfx&, yJj + n(J r)COV(xJ, y L )
( n ( t J ) + n(J 1 ) ) ~ C O v ( x t , y l , . COv(xJ,yJ~ r,] P
where rqlJ, is the number of families with a valid mea- surement on trait i for the (mid-)parent and on trait j for a t least one offspring, and no,3 is the number of families with a valid measurement on trait j for the (mid-)parent and on trait i for at least one offspring. It was necessary to weight the average of the two cross- covariances because wing damage precluded measure- ment of both traits on both parents for many trait
pairs; thus unequal family numbers were used to cal- culate the two cross-covariances.
Tests for Significant Genetic Correlations Although standard methods [Klein et al., 1973;
Klein, 1974; Falconer, 19891 for detecting whether a genetic correlation differs significantly from zero were initially applied, “significance” was ultimately deter- mined using a bootstrap method. Bootstrapping gener- ates an empirical distribution for the statistic of inter- est, here the genetic correlation, from which confidence intervals can be calculated [Efron, 1982; Efron and Tib- shirani, 19861. In this application, a whole family rather than an individual was considered to be the unit of observation. Consequently, the bootstrap distribu- tion was produced by sampling families with replace- ment, calculating the genetic correlation from the “sample,” and repeating this process 5,000 times. From the bootstrapped distribution 95 and 99% confidence intervals were calculated for each genetic correlation. A correlation was identified as significantly different from zero when its confidence interval did not include zero.
The large number of correlations estimated pre- sented difficulties in determining the true significance of specific correlations [Rice, 19891. For example, look- ing at the correlation matrix for a single species, under the null hypothesis that not one of the 946 correlations is different from zero, and assuming that the outcome of each test is an independent event, we would still expect 47 “significant” correlations to be found when using the 95% confidence interval test. It was not com- putationally practical to adjust each test for the total number of tests conducted: the application of a Bonfer- roni sequential test procedure would require the con- struction of a (1-a/946)% confidence interval. The up- per and lower bounds for such a confidence interval cannot be reliably estimated through bootstrapping (even if the number of bootstraps is increased from 5,000 to 50,000). Without such a correction, the overall probability of committing a type I error, i.e., the prob- ability of concluding that the genetic correlation for a particular pair of traits was significantly different from zero, when in fact it was not, will exceed the a (0.01 or 0.05) at which the particular test was conducted. Inter- pretation of the pattern of significant correlations in each matrix must therefore be tempered.
Matrix Permutation Tests Mantel’s matrix permutation test can be used to
evaluate the correspondence between an observed cor- relation matrix and its hypothesized structure [Dietz, 1983; Dow and Cheverud, 19851. To test whether ho- mologous pattern elements are correlated while non- homologous elements are not, the observed correlation matrices were compared to a hypothesis matrix where a “1” was assigned to correlations between homologs and a “0” was assigned to correlations between non-

84 PAULSEN
homologs [see Cowley and Atchley, 19901. To test the secondary hypothesis, that the locations of eyespots and parafocal elements are also correlated, a second hypothesis matrix was constructed-similar to the first hypothesis matrix, but with “1”s replacing the “0”s for the correlations between eyespot positions and parafo- cal element measures. The matrix permutation proce- dure tests the null hypothesis of no similarity between the actual matrix and the hypothetical one. Rejection of the null hypothesis therefore provides support, albeit limited, to the hypothesized correlation structure. Stronger support for a hypothesis is provided by a com- parison between the observed matrix and a matrix con- structed from subtracting one hypothesis matrix from another. In this comparison, significant similarity in- dicates that one hypothesis fits the data better than its competitor [Dow and Cheverud, 1985; Cowley and Atchley, 19901. Such a comparison was made between the hypothesis matrix representing correlation among homologs alone and the hypothesis matrix which also included correlation in location between eyespots and parafocal elements. In addition, a matrix permutation test was performed to assess the similarity between the genetic correlation matrices for P. coenia and P. euarete. All matrix permutation tests conducted in this study used 5,000 random matrix permutations to produce a sampling distribution for the matrix correlation mea- sure (Spearman’s rank correlation coefficient).
Test of the Correlation Pattern Among Homologs
In both species the 11 eyespots have differentiated both in morphology and average size. While eyespots on the dorsal and ventral surfaces of the forewing have one morphology, the eyespots on the dorsal and ventral sur- faces of the hindwing have a different morphology. Whether an eyespot is relatively larger or smaller, how- ever, is not associated with whether it is located on the fore- or hindwing or on the ventral or dorsal surfaces.
A true test of Riska’s [1986] hypothesis requires knowledge of the ancestral state for the set of serial homologs, from which it could be determined which features (or subsets of features) had differentiated the most from the ancestral condition. Unfortunately, the primitive and derived states for eyespots have yet to be determined for this system. It would, however, still be consistent to hypothesize that eyespots which appear similar in their present state would be more correlated than eyespots that are less similar. Similarity could refer to either size or morphology, or both.
In order to test Riska’s [ 19861 hypothesis each corre- lation calculated among the eyespot inner ring diame- ter measures (EYE1 . . . EYE11) was placed into one of three categories according to the similarity of the two eyespots in each pair. Category 1 included eyespot pairs where both eyespots have the same morphology and have roughly the same mean size across the pop- ulation, Category 2 included those pairs where the two
eyespots are either similar in morphology or similar in size, but not both. Category 3 included those pairs where the eyespots are dissimilar in both morphology and size. Whether eyespots share the same general morphology is easily distinguished and amounts to whether the two eyespots are both located on the forewing or both on the hindwing. Whether eyespots are on average similar or dissimilar in their size is a more subjective decision. Each of the 11 eyespots was assigned to one of three size classes: large, small, or vestigial.
Under Riska’s [19861 hypothesis the genetic correla- tion calculated for an eyespot pair placed in category 1 should be greater than the correlation calculated for a pair assigned to category 2. Similarly, the correlations for pairs in category 2 should be greater than the cor- relations for pairs in category 3. The following proce- dure devised by Mark Rausher of Duke University [person communication1 was used to test these predic- tions. Rather than make numerous pair-wise compar- isons, the procedure tested for significant differences among the average genetic correlations for each cate- gory of differentiation. Letting rg), rg), and rg’ repre- sent the average genetic correlations calculated for cat- egories 1,2, and 3, respectively, Riska’s hypothesis was then evaluated by testing for significant differences among categories:
A ( ~ , J ] = (rg’ ~ rg) ) > 0 A(2,3) = (rg’ - rg) ) > 0 A(1.3) = ( rg) - rc’) > 0 .
A one-sided test for each difference was conducted by bootstrapping the distributions for Ao,,,, A,,,,), and A(1,3). To produce a bootstrapped value, families were randomly sampled with replacement. Then the genetic correlation matrix was calculated from the sample, the average value was calculated for each category, and the differences among categories, 6(,,,,, 8(,,,,, and So,,,, were calculated. The distribution for each A was pro- duced from 5,000 bootstrap samples. Where the value of the 5th percentile for the distribution for A(lJ) was greater than zero, the null hypothesis of equality was rejected in favor of the alternative: that category i has the greater average genetic correlation than category j .
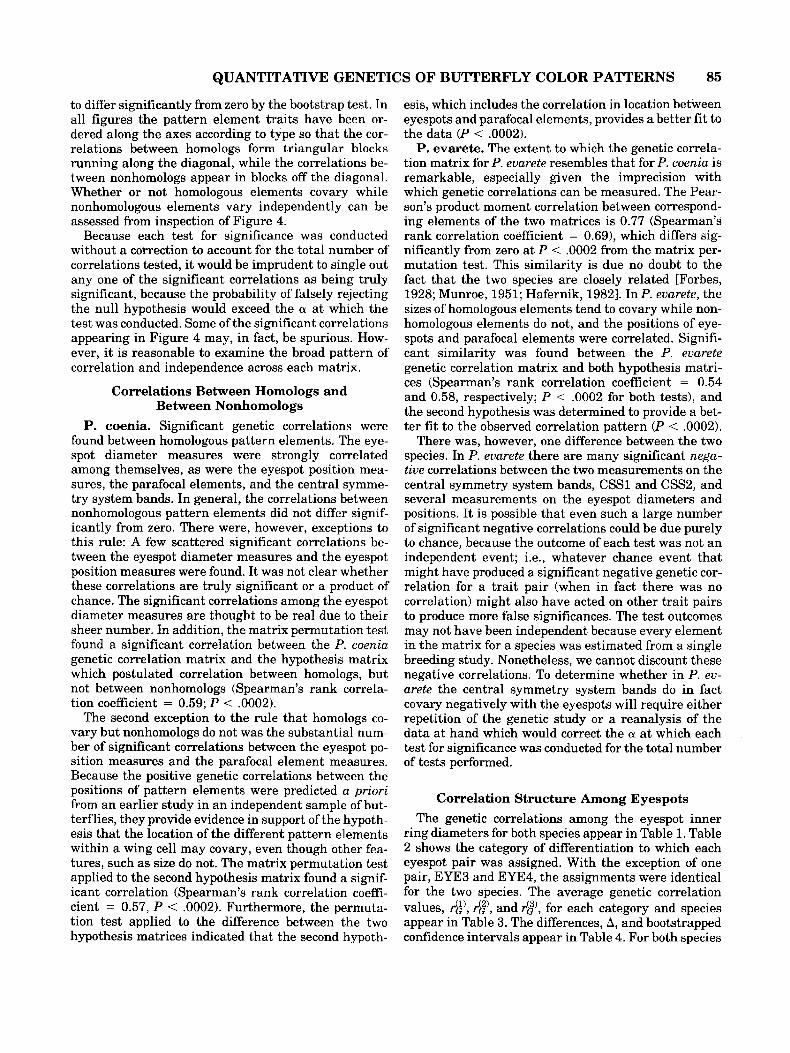
RESULTS The genetic correlation matrices for each species,
based on the size-adjusted trait values, are represented in Figure 3. Each element of the matrix is represented by a shaded square with darker shading indicating rel- atively stronger correlations. Positive and negative correlations are presented in different diagrams. Ta- bles for the explicit correlation values and their 95 and 99% confidence bounds appear in Paulsen [19921, and are not presented due to space considerations, but are available upon request. The heritability of each trait and its confidence interval appear in the Appendix. Figure 4 indicates those correlations which were found
QUANTITATIVE GENETICS OF BUTTERFLY COLOR PATTERNS 85
to differ significantly from zero by the bootstrap test. In all figures the pattern element traits have been or- dered along the axes according to type so that the cor- relations between homologs form triangular blocks running along the diagonal, while the correlations be- tween nonhomologs appear in blocks off the diagonal. Whether or not homologous elements covary while nonhomologous elements vary independently can be assessed from inspection of Figure 4.
Because each test for significance was conducted without a correction to account for the total number of correlations tested, it would be imprudent to single out any one of the significant correlations as being truly significant, because the probability of falsely rejecting the null hypothesis would exceed the a at which the test was conducted. Some of the significant correlations appearing in Figure 4 may, in fact, be spurious. How- ever, it is reasonable to examine the broad pattern of correlation and independence across each matrix.
Correlations Between Homologs and Between Nonhomologs
P. coenia. Significant genetic correlations were found between homologous pattern elements. The eye- spot diameter measures were strongly correlated among themselves, as were the eyespot position mea- sures, the parafocal elements, and the central symme- try system bands. In general, the correlations between nonhomologous pattern elements did not differ signif- icantly from zero. There were, however, exceptions to this rule: A few scattered significant correlations be- tween the eyespot diameter measures and the eyespot position measures were found. It was not clear whether these correlations are truly significant or a product of chance. The significant correlations among the eyespot diameter measures are thought to be real due to their sheer number. In addition, the matrix permutation test found a significant correlation between the P. coenia genetic correlation matrix and the hypothesis matrix which postulated correlation between homologs, but not between nonhomologs (Spearman’s rank correla- tion coefficient = 0.59; P < .0002).
The second exception to the rule that homologs co- vary but nonhomologs do not was the substantial num- ber of significant correlations between the eyespot po- sition measures and the parafocal element measures. Because the positive genetic correlations between the positions of pattern elements were predicted a priori from an earlier study in an independent sample of but- terflies, they provide evidence in support of the hypoth- esis that the location of the different pattern elements within a wing cell may covary, even though other fea- tures, such as size do not. The matrix permutation test applied to the second hypothesis matrix found a signif- icant correlation (Spearman’s rank correlation coeffi- cient = 0.57, P < .0002). Furthermore, the permuta- tion test applied to the difference between the two hypothesis matrices indicated that the second hypoth-
esis, which includes the correlation in location between eyespots and parafocal elements, provides a better fit to the data (P < .0002).
P. evarete. The extent to which the genetic correla- tion matrix for P. evarete resembles that for P. coenia is remarkable, especially given the imprecision with which genetic correlations can be measured. The Pear- son’s product moment correlation between correspond- ing elements of the two matrices is 0.77 (Spearman’s rank correlation coefficient = 0.69), which differs sig- nificantly from zero at P < .0002 from the matrix per- mutation test. This similarity is due no doubt to the fact that the two species are closely related [Forbes, 1928; Munroe, 1951; Hafernik, 19821. In P. euarete, the sizes of homologous elements tend to covary while non- homologous elements do not, and the positions of eye- spots and parafocal elements were correlated. Signifi- cant similarity was found between the P. evarete genetic correlation matrix and both hypothesis matri- ces (Spearman’s rank correlation coefficient = 0.54 and 0.58, respectively; P < .0002 for both tests), and the second hypothesis was determined to provide a bet- ter fit to the observed correlation pattern (P < .0002).
There was, however, one difference between the two species. In P. evarete there are many significant nega- tive correlations between the two measurements on the central symmetry system bands, CSSl and CSS2, and several measurements on the eyespot diameters and positions. It is possible that even such a large number of significant negative correlations could be due purely to chance, because the outcome of each test was not an independent event; i.e., whatever chance event that might have produced a significant negative genetic cor- relation for a trait pair (when in fact there was no correlation) might also have acted on other trait pairs to produce more false significances. The test outcomes may not have been independent because every element in the matrix for a species was estimated from a single breeding study. Nonetheless, we cannot discount these negative correlations. To determine whether in P. ev- arete the central symmetry system bands do in fact covary negatively with the eyespots will require either repetition of the genetic study or a reanalysis of the data at hand which would correct the CY at which each test for significance was conducted for the total number of tests performed.
Correlation Structure Among Eyespots The genetic correlations among the eyespot inner
ring diameters for both species appear in Table 1. Table 2 shows the category of differentiation to which each eyespot pair was assigned. With the exception of one pair, EYE3 and EYE4, the assignments were identical for the two species. The average genetic correlation values, r!$, rg’, and @, for each category and species appear in Table 3. The differences, A, and bootstrapped confidence intervals appear in Table 4. For both species

POSITIVE GENETIC CORRELATIONS
1
3 11
EYE~POT POSITIONS
0.0 0.2 0.4 0.6 0.8 1.0
correlation to grayscale mapping
EVF!WT DIAMETERS
EYESWT t POSITIONS I Y
NEGATIVE GENETIC CORRELATIONS
0
u 11 1
I I I 1 I
-1.0 -0.8 -0.6 -0.4 -0.2 -0.0
correlation to grayscale mapping
Fig. 3.
QUANTITATIVE GENETICS OF BUTTERFLY COLOR PATTERNS 87
the difference in the average genetic correlation be- tween category 1 and category 2, and the difference between category 1 and category 3, was significant. No significant difference was demonstrated for either spe- cies in the average genetic correlation between cate- gory 2 and category 3.
DISCUSSION The structure of the genetic correlation matrix for
both species does closely resemble that of the pheno- typic correlation matrix in P. coenia. Such similarity has been predicted by Cheverud 119881 for suites of traits where the environmental errors are expressed through the same developmental pathways as genetic influences. For P. coenia, the genetic correlations were of the same magnitude as the phenotypic correlations. One implication of this finding is that where estimates of the genetic correlation matrix are unavailable, as may often be the case for natural populations, the phe- notypic correlation matrix may provide an acceptable substitute, particularly if heritabilities are high [Chev- erud, 19881.
The genetic correlation structure found in this study is consistent with current models for the development of butterfly wing patterns [Nijhout, 19911. The devel- opment of wing color patterns is a two-stage process: in the first stage the positions of sources for pattern in- duction are determined by a process involving lateral inhibition [Meinhardt, 1982; Nijhout, 19911. Because the wing veins are thought to provide an additional source of the “activator” to the reaction-diffusion pro- cess, they play a key role in determining the location of pattern elements within a wing cell. In the second stage of development, the sources for pattern induction may act as either sources or sinks for a diffusible signal molecule. Interpretation of the resulting signal gradi- ent according to one or more thresholds established in the wing scale cells determines the size and shape of the pattern elements. Nijhout [1991] describes in detail how this process can produce central symmetry system bands, border ocelli (eyespots), and parafocal elements. That the central symmetry system bands and eyespot
Fig. 3. Genetic correlation structure. Top: The positive elements of the size-adjusted genetic correlation matrix are represented by shaded squares, with darker shading representing relatively stronger correlations. Negative correlations appear as white spaces. Bottom: The negative elements of the size-adjusted genetic correlation matrix are represented by shaded squares, with darker shading representing relatively stronger correlations. Positive correlations appear as white spaces. Values for P. coeniu appear above the diagonal while those for P. euarete appear below. The pattern traits have been ordered along the two axes according t o homology group. Because trait EP5 could not be reliably measured in P. euarete, correlations involving this trait for this species should be disregarded. Due to wing damage in the parental generation for P. euarete, insufficient numbers of families (<20) were available to estimate reliably the correlation between VH2 and VH3.
diameter measures varied independently in size in this study is consistent with their production from separate induction sources. The significant correlations between the eyespot positions and the measurements made on the parafocal elements that were found are also consis- tent with the above model: The measurements made on the parafocal elements reflected largely the position, rather than the size, of the element; and it was the same wing veins that determined the location of the induction sources for both eyespots and parafocal ele- ments.
Evolutionary Implications The genetic correlation matrix for P. evarete was sim-
ilar t o that of P. coenia, which provides evidence that the correlation structure described among the elements of the nymphalid groundplan is not special to P. coenia but holds also between congenerics. If it is true across many butterfly species that the elements of the groundplan are independent developmental units, then this may have been what has enabled the vast diver- sification of wing pattern morphology found in butter- flies. Butterfly wing patterns have evolved to serve a number of functions such as warning coloration, mim- icry, camouflage, and thermoregulation. Developmen- tal independence between the elements of the nymph- alid groundplan means that each pattern element has been free to respond independently to selection. For example, if the elements of the groundplan are uncor- related, selection to increase eyespot diameter will not produce a correlated response in the width of the cen- tral symmetry system bands or the size of the parafocal elements.
Although it may be that the primitive state for the nymphalid groundplan is independence among nonho- mologous pattern elements, it is still possible for cor- relations to arise during the course of evolution. In their study of functional coadaptation between wing pattern traits in Pieris butterflies, Kingsolver and Wiernasz 11987,19911 distinguish between genetic cor- relations produced by “developmental organization” and correlations that might be created by functional relationships between suites of traits. In addition to positive genetic correlations between homologous pat- tern elements, Kingsolver and Wiernasz 119911 found evidence for genetic correlation between functionally interacting, but nonhomologous, pattern elements. That significant genetic correlations were for the most part not found between nonhomologous pattern ele- ments in P. coenia and P. evarete perhaps reflects a lack of functional interactions between the elements of the groundplan for these species. Although the eyespots may serve to discourage predation [Blest, 19571, there are no other obvious functional aspects to the pattern in P. coenia and P. evarete [Nijhout, personal commu- nication].
In contrast to the nonhomologous pattern elements, the homologous, serial repeats of each element, are ge-

88 PAULSEN
T EYESPOT
DIAMETERS
EYESPOT t POSITIONS c
5E
WING 4 VENATION
1
SIGNIFICANT POSITIVE GENETIC CORRELATIONS
e w I . DIAMlXERS--+EYEsH]T POSlTIONS +++WING VENATION --+ 1
B
a p < 0.05 m p < ~ . ~ l
SIGNIFICANT NEGATIVE GENETIC CORRELATIONS
T EYESWT
DIAMETERS
EYESPOT t POSlllONS
1 5E
WING T VENATION
1
Fig. 4. Top: Significant positive genetic correlations. Bottom: Significant negative genetic correla- tions. Those correlations which were found to differ significantly from zero with P < .05 and P < .01 are represented by grey and black squares, respectively. The number of testa conducted was not accounted for in the tests for significance.

QUANTITATIVE GENETICS OF BUTTERFLY COLOR PATTERNS 89
TABLE 1. The Size-Adjusted Genetic Correlations Calculated for P. coenia (Above the Diagonal) and for P. evarete (Below the Diagonal) for the 11 Inner Ring Diameter Eyespot Measures*
1 2 3 4 5 6 7 8 9 10 11 1 0.60 0.47 0.35 0.74 0.39 0.35 0.48 0.38 0.23 0.32 2 0.78 0.47 0.58 0.46 0.74 0.41 0.37 0.50 0.37 0.44 3 0.67 0.54 0.58 0.45 0.52 0.70 0.54 0.56 0.46 0.42 4 0.58 0.72 0.72 0.29 0.58 0.51 0.35 0.52 0.46 0.57 5 0.82 0.58 0.53 0.52 0.43 0.51 0.68 0.37 0.24 0.52 6 0.55 0.72 0.40 0.66 0.48 0.45 0.42 0.48 0.46 0.54 7 0.21 0.17 0.32 0.40 0.48 0.24 0.84 0.65 0.48 0.66 8 0.48 0.38 0.46 0.48 0.76 0.36 0.78 0.62 0.48 0.78 9 0.27 0.31 0.38 0.55 0.39 0.53 0.38 0.52 0.96 0.55
10 0.20 0.16 0.20 0.41 0.27 0.44 0.45 0.47 0.92 0.46 11 0.45 0.55 0.34 0.60 0.76 0.47 0.72 0.83 0.53 0.59
*See Figure 2 for the eyespot numbering.
TABLE 2. Assignment of Eyespot Pairs to Differentiation Categories*
1 2 3 4 5 6 7 8 9 1 0 1 1 1 2 3 2 1 2 2 2 3 3 2 2 2 2 3 2 1 3 3 3 3 3 3 3 2 2 " 3 2 2 2 3 3 2 4 2 3 1 " 2 3 2 1 3 3 1 5 1 2 3 2 2 2 2 3 3 2 6 2 1 2 3 2 3 3 3 3 3 7 2 3 2 2 2 3 1 3 3 1 8 2 3 2 1 2 3 1 3 3 1 9 3 3 3 3 3 3 3 3 1 3
1 0 3 3 3 3 3 3 3 3 1 3 1 1 2 3 2 1 2 3 1 1 3 3
*1 is for pairs that appear similar in both morphology and average size; 2 is for pairs that are similar in either morphol- ogy or size, but not both; 3 represents pairs which differ in both morphology and size. See Figure 2 for the eyespot num- bering. The assignments for P. coenia eyespot pairs are in the upper diagonal triangle while those for P. evarete are in the lower diagonal triangle. "Eye 3 and Eye 4 differ greatly in size in P. coenia but not in P. evarete.
TABLE 3. Average Genetic Correlations for Each Category of Differentiation for P. coenia
and P. evarete
P.coenia P. evarete r<;; 0.704 0.733
0.480 0.515 zw 0.464 0.420
netically correlated. The strength of the correlation be- tween serial repeats, however, varies. The correlations among the eyespot diameter measures were examined to test whether differentiation was associated with low- ered correlations. In both species the undifferentiated eyespot pairs had significantly stronger genetic corre- lations than the differentiated pairs. It was not possi- ble, however, with the data at hand to statistically de- tect differences in correlation between the different levels of differentiation: eyespot pairs that had di- verged in both morphology and average size did not
show a significantly weaker correlation than eyespot pairs that had diverged in only one of these aspects. On the whole, however, it appears that differentiation has occurred through the acquisition of novel genetic vari- ation, specific in its influence on development. Once genetic correlations are thus lowered, or, conversely, once traits have acquired unique genetic variation, fur- ther differentiation should be less constrained.
The extent to which the genetic correlation structure resists change will determine the scope of its influence on patterns of morphological change [see Lofsvold, 1986; Kohn and Atchley, 1988; Shaw and Billington, 19911. Genetic correlations are the microevolutionary parameterization of developmental constraints [Chev- erud, 19841. If the correlation matrix resists change, the correlation matrix will constrain evolution [Lande, 1982; Wake et al., 1983; Mitchell-Olds, 19861. Paulsen [ 19921 established significant differences in the herita- bilities of traits between P. coenia and P. euarete, but was not able to provide rigorous evidence that the ge- netic correlations or covariances had changed in either species. The correlation structure among the eyespot diameter measures suggests, however, that the corre- lations among these traits have changed over time. This evidence is weak though because it is based on the assumption that in their ancestral condition the eye- spots were all equally and strongly genetically corre- lated. Furthermore, it is not known what time period was required for differentiation. The true strength of developmental constraints on evolution can only be evaluated once more is known concerning the resis- tance of genetic correlations to change.
ACKNOWLEDGMENTS This research was funded by a grant-in-aid-of-
research from Sigma Xi. Additional equipment support was provided by the Morphometrics Lab at Duke Uni- versity. H.F. Nijhout and B. Chernoff made numerous useful comments on earlier versions of the manuscript. This work has also benefited from comments by J. Kingsolver and an anonymous reviewer.

90 PAULSEN
TABLE 4. Differences in the Average Genetic Correlations Among the Three Cagtegories of Eyespot Differentiation and Their Bootstrapped Confidence Intervals
for P. coenia and P. evarete
P. coenia A(I,Z) = 0.224 A(2.3) = 0.016 Ac1,3) = 0.240
P. evarete A(1,2, = 0.218
Ac1,3) = 0.313 Aczn = 0.095
Lower 99% Lower 95% Median Upper 95% Upper 99% bound bound value bound bound
0.128 0.151 0.225 0.304 0.336 -0.099 -0.075 0.015 0.111 0.145
0.124 0.152 0.241 0.340 0.376
0.139 0.159 0.230 0.309 0.337 -0.065 -0.026 0.081 0.187 0.230
0.186 0.219 0.310 0.406 0.439
REFERENCES Arnold SJ (1992): Constraints of phenotypic evolution. Am Natur
140:s85-s107. Atehley WR, Rutledge JJ, Cowley DE (1981): Genetic components of
size and shape. 11. Multivariate covariance patterns in the rat and mouse skull. Evolution 351037-1055.
Atchley WR, Plummer AA, Riska B (19858): Genetics of mandible form in the mouse. Genetics 111:555-577.
Atchley WR, Plummer AA, Riska B (1985b): Cenetic analysis of size- scaling patterns in the mouse mandible. Genetics 111:579-595.
Becker WA (1984): “Manual of Quantitative Genetics,” 4th ed. Ann Arbor, MI: McNaughton & Gunn, Inc.
Blest AD (1957): The function of eyespot patterns in the Lepidoptera. Behaviour 11:209-256.
Bookstein FL, Chernoff BC, Elder RL, Humphries JM, Smith GR, Strauss RE (1985): “Morphometrics in Evolutionary Biology.” Acad. Nat. Sci. of Philadelphia Special Publ. 15.
Cheverud JM (1982): Phenotypic, genetic, and environmental mor- phological integration in the cranium. Evolution 36:499-516.
Cheverud J M (1984): Quantitative genetics and developmental con- straints on evolution by selection. J Theor Biol 110:155-171.
Cheverud JM (1988): A comparison of genetic and phenotypic corre- lations. Evolution 42:958-968.
Cowley DE, Atchley WR (1990): Developmental and quantitative ge- netics of correlation structure among body parts of Drosophila mel- anogaster. Am Nat 135242-268.
Crespi BJ, Bookstein FL (1989): A path-analytic model for the mea- surement of selection on morphology. Evolution 43:18-28.
Dietz EJ (1983): Permutation tests for association between two dis- tance matrices. Syst Zoo1 3221-26.
Dow MM, Cheverud JM (1985): Comparison of distance matrices in studies of population structure and genetic miro differentiation: Quadratic assignment. Am J Phys Anthropol 66:367-373.
Efron B (1982): “The Jackknife, the Bootstrap and Other Resampling Plans.” CBMS-NSF Regional Conference Series in Applied Mathe- matics. No. 38. Philadelphia.
Efron B, Tibshirani R (1986): Bootstrap methods for standard errors, confidence intervals, and other measures of statistical accuracy. Stat Sci 1:54-77.
Falconer DS (1989): “Introduction to Quantitative Genetics,” 3rd ed. New York Longman.
Falconer DS, King JWB (1953): A study of selection limits in the mouse. J Genet 51:561-581.
Forbes WTM (1928): Variation in Junonia Zauinia (Lepidoptera, Nymphalidae). J NY Entomol SOC 36:305-320.
Gould SJ (1989): A developmental constraint in Cerion, with com- ments on the definition and interpretation of constraint in evolu- tion. Evolution 43516-539.
Hafernik J E J r (1982): Phenetics and ecology of hybridization in buckeye butterflies (Lepidoptera: Nymphalidae). Uni Cal Publ En- tomol 96:l-109.
Jolicoeur P (1963): The multivariate generalization of the allometry equation. Biometrics 19:497-499.
Kingsolver JG, Wiernasz DC (1987): Dissecting correlated characters: Adaptive aspects of phenotypic covariation in melanization pattern of Pieris butterflies. Evolution 41:491-503.
Kingsolver JG, Wiernasz DC (1991): Development, function, and the quantitative genetics of wing melanin pattern in Pieris butterflies. Evolution 45:1480-1492.
Klein TW (1974): Heritability and genetic correlation: Statistical power, population comparisons, and sample size. Behav Genet 4:171- 189.
Klein TW, DeFries JC, Finkbeiner CT (1973): Heritability and ge- netic correlation: Standard errors of estimates and sample size. Be- hav Genet 3:355-364.
Kohn LAP, Atchley WR (1988): How similar are genetic correlation structures‘? Data from mice and rats. Evolution 42467-481.
Lande R (1979): Quantitative genetic analysis of multivariate evolu- tion, applied to brain:body size allometry. Evolution 33:402-416.
Lande R (1982): A quantitative genetic theory of life history evolu- tion. Ecology 62:607-615.
Lande R, Arnold SJ (1983): The measurement of selection on corre- lated characters. Evolution 37:1210-1226.
Lofsvold D (1986): Quantitative genetics of morphological differenti- ation in Peromyscus. I. Tests of the homogeneity of genetic covari- ance structure among species and subspecies. Evolution 40559-573.
Maynard Smith J , Burian R, Kauffman S, Alberch P, Campbell J, Goodwin B, Lande R, Raup D, Wolpert L (1985): Developmental constraints and evolution. Q Rev Biol602.65-287.
Meinhardt H (1982): “Models of Biological Pattern Formation.” New York Academic Press.
Mitchell-Olds T (1986): Quantitative genetics of survival and growth in Impatiens capensis. Evolution 40:107-116.
Munroe EG (1951): The genus Junonia in the West Indies (Lepi- doptera, Nymphalidae). Am Museum Novitates 1498:l-16.
Nijhout HF (1991): “The Development and Evolution of Butterfly Wing Patterns.” Washington: Smithsonian Institute Press.
Nijhout HF, Wray GA (1986): Homologies in the colour patterns of the genus Charaxes (Lepidoptera: Nymphalidae). Biol J Linn Soc 28: 387-410.
Nijhout HF, Wray GA (1988): Homologies in the scalier patterns of the genus Heliconius (Lepidoptera: Nymphalidae). Biol J Linn SOC 33:345-365.
Paulsen SM (1992): “Quantitative Genetics of the Wing Color Pattern in the Buckeye Butterfly (Precis coenia and Precis evarete): A Test for the Constancy of G.” Ph.D. thesis, Duke University.
Paulsen SM, Nijhout HF (1993): Phenotypic correlation structure among elements of the color pattern in Precis coenia (Lepidoptera: Nymphalidae). Evolution 47:593-618.
Rice WR (1989): Analyzing tables of statistical tests. Evolution 43: 223-225.
Riska B (1986): Some models for development, growth, and morpho- metric correlation. Evolution 40:1303-1311.
Schwanwitsch BN (1949): Evolution of the wing pattern in the lycae- nid Lepidoptera. Proc Zoo1 SOC London [Ser. Bl 119:189-263.
Schwanwitsch BN (1956a): Color-pattern in Lepidoptera. Entomolog- eskoe Obozrenie 35:530-546.

QUANTITATIVE GENETICS OF BUTTERFLY COLOR PATTERNS 91
Schwanwitsch BN (1956b): Wing pattern of pierid butterflies (Lepi- doptera, Pieridae). Entomologeskoe Ohozrenie 35:285-301.
Shaw RG (1987): Maximum-likelihood approaches applied to quanti- tative genetics of natural populations. Evolution 41:812-826.
Shaw RG, Billington HL (1991): Comparison of variance components between two populations of Holcus Zanatus: A reanalysis. Evolution 45:1287-1289.
Siiffert F (1927): Zur vergleichende Analyse der Schmetterlingszeich- nung. Biol Zentralbl 47:385-413.
Venable DL, Burquez A (1990): Quantitative genetics of size, shape, life-history, and fruit characteristics of the seed heteromorphic com-
posite Heterosperma pinnuturn. 11. Correlation structure. Evolution 44: 1748-1 763.
Wake DB, Roth G, Wake MH (1983): On the problem of stasis in organismal evolution. J Theoret Biol 101:211-224.
Wright S (1954): The interpretation of multivariate systems. In Kempthorne 0, Bancroft TA, Gowen JW, Lush JL (eds): "Statistics and Mathematics in Biology." Ames, IA: Iowa State University Press.
Wright S (1968): "Evolution and the Genetics of Populations, Vol. I. Genetic and Biometrical Foundations." Chicago, IL: University of Chicago Press.
APPENDIX. Heritability Estimates for Size-Adjusted Traits From Regression on the Mid-Parent*
P. coenia P. evarete 95% confidence 95% confidence
N h2 interval N h2 interval EYE1 EYE2 EYE3" EYE4" EYE5" EYE6 EYE7 EYE8 EYE9 EYE10 EYE11 DIAM3" DIAM4" DIAMll EP1 EP2 EP3 EP4 EP5 EP6 EP7 EP8 EP9 EPlO E P l l PFE1" PFE2 PFE3 CSS1" CSS2" DF1 DF2 DH1 DH2 DH3 DH4 VF1 VF2 VF3 VF4 VH1 VH2 VH3 VH4
114 138 138 134 125 138 68
137 128 130 136 138 134 123 70
131 112 74 27
136 60
112 91 90 73
109 122 72
138 132 123 123 112 69 74
138 70 69
131 138 123 47 47
138
0.609 ~~~
0.849 0.627 0.638 0.711 0.834 0.442 0.670 0.450 0.467 0.710 0.615 0.656 0.789 0.660 0.684 0.503 0.601 0.502 0.697 0.384 0.679 0.589 0.612 0.598 0.701 0.734 0.800 0.710 0.772 0.429 0.555 0.445 0.690 0.575 0.504 0.491 0.639 0.210 0.518 0.559 0.787 0.468 0.527
(0.47,0.74) (0.74,0.94) (0.52,0.73) (0.51,0.79) (0.61,0.82) (0.74,0.93) (0.25,0.62) (0.57,0.77) (0.30,0.61) (0.34,0.60) (0.61,0.83) (0.51,0.72) (0.53,0.79) (0.69,0.88) (0.47,0.83) (0.58,0.78) (0.35,0.65) (0.44,0.75) (0.16,1.02) (0.60,0.81) (0.08,0.69) (0.55,0.81) (0.45,0.74) (0.48,0.75) (0.48,0.71) (0.57,0.84) (059,038) (0.62,0.94) (0.61,0.80) (0.67,0.88) (0.32,0.54) (0.42,0.69) (0.28,0.59) (0.51,0.85) (0.40,0.74) (0.36,0.65) (0.36,0.64) (0.43,0.84) (0.10,0.32) (0.40,0.64) (0.41,0.69) (0.50,1.05) (0.27,0.70)
101 114 112 109 54
114 41
108 86 85
108 112 108 98 53
114 60 38 2
113 31 58 42 37 38 60 68 38
114 104 69 69 60 29 38
114 30 26 86
113 82 9 9
0.683 0.852 0.843 0.891 0.367 0.829 0.585 0.704 0.462 0.371 0.620 0.837 0.836 0.875 0.674 0.659 0.525 0.552
r0.1821 0.763 0.558 0.564 0.612 0.528 0.606 0.458 0.640 0.507 0.493 0.537 0.481 0.471 0.542 0.537 0.384 0.599 0.748 0.520 0.154 0.639 0.599 L0.3541 10.3001
(0.56,0.81) (0.76,0.95) (0.76,0.93) (0.80,0.98) (0.22,0.53) (0.74,0.92) (0.36,0.76) (0.58,0.84) (0.22,0.67) (0.15,0.55) (0.50,0.74) (0.76,0.92) (0.74,0.91) (0.74,0.99) (0.52,0.86) (0.53,0.78) (0.37,0.68) (0.31,0.76)
(0.64,0.87) (0.20,0.91) (0.39,0.74) (0.46,0.80) (0.41,0.68) (0.42 ,O .84) (0.33,0.58) (0.49,0.80) (0.24,0.76) (0.30,0.66) (0.38,0.69) (0.33,0.62) (0.29,0.63) (0.36,0.72) (0.24,0.75) (0.11,0.66) (0.46,0.71) (0.45,1.18) (0.08,0.81) (0.04,0.26) (0.53,0.78) (0.42,0.77)
(-0.17,0.99) ( - 1.20.1.50)
(-0.08,0.18)
~ (0.40,0.65) 114 -0.565- (0.44:0.67)
*N is the number of families. Estimates based on insufficient family numbers are in parenthe- ses. "Traits whose heritabilities were found to differ significantly between the two species [see Paulsen, 19921.