quantitative histology-based classification system for
TRANSCRIPT

© Copyright 2019. Korean Association for the Study of Intestinal Diseases. All rights reserved. This is an Open Access article distributed under the terms of the Creative Commons Attribution Non-Commercial License (http://creativecommons.org/licenses/by-nc/4.0/) which permits unrestricted non-commercial use, distribution, and reproduction in any medium, provided the original work is properly cited.
387
INTRODUCTION
The existing histological classification systems for assessment
of duodenal mucosal changes in celiac disease (CeD) include
original Marsh classification, modified Marsh classification,1,2
Corrazza and Villanacci classification (2005), and Ensari
(2010) classification. Because of the qualitative nature of the
parameters included in all the above classification system,
there are low interobserver agreements amongst pathologists
in most of the parameters except for the intraepithelial lym-
phocyte (IEL) count.3-6 The lowest interobserver agreement
pISSN 1598-9100 • eISSN 2288-1956https://doi.org/10.5217/ir.2018.00167Intest Res 2019;17(3):387-397
Quantitative histology-based classification system for assessment of the intestinal mucosal histological changes in patients with celiac disease
Prasenjit Das1, Gaurav PS Gahlot1, Alka Singh2, Vandana Baloda1, Ramakant Rawat2, Anil K Verma2§, Gaurav Khanna1, Maitrayee Roy1, Archana George1, Ashok Singh1, Aasma Nalwa1, Prashant Ramteke1, Rajni Yadav1, Vineet Ahuja2, Vishnubhatla Sreenivas3, Siddhartha Datta Gupta1, Govind K Makharia2 Departments of 1Pathology, 2Gastroenterology and Human Nutrition, and 3Biostatistics, All India Institute of Medical Sciences, New Delhi, India
Background/Aims: The existing histological classifications for the interpretation of small intestinal biopsies are based on qualitative parameters with high intraobserver and interobserver variations. We have developed and propose a quantitative histological classification system for the assessment of intestinal mucosal biopsies. Methods: We performed a computer-assisted quantitative histological assessment of digital images of duodenal biopsies from 137 controls and 124 patients with celiac disease (CeD) (derivation cohort). From the receiver-operating curve analysis, followed by multivariate and logistic regression analyses, we identified parameters for differentiating control biopsies from those of the patients with CeD. We repeated the quantitative histological analysis in a validation cohort (105 controls and 120 patients with CeD). On the basis of the results, we propose a quantitative histological classification system. The new classification was compared with the existing histological classifications for interobserver and intraobserver agreements by a group of qualified pathologists. Results: Among the histological parameters, intraepithelial lymphocyte count of ≥25/100 epithelial cells, adjusted villous height fold change of ≤0.7, and crypt depth-to-villous height ratio of ≥0.5 showed good discriminative power between the mucosal biopsies from the patients with CeD and those from the controls, with 90.3% sensitivity, 93.5% specificity, and 96.2% area under the curve. Among the existing histological classifications, our quantitative histological classification showed the highest intraobserver (69.7%–85.03%) and interobserver (24.6%–71.5%) agreements. Conclusions: Quantitative assessment increases the reliability of the histological assessment of mucosal biopsies in patients with CeD. Such a classification system may be used for clinical trials in patients with CeD. (Intest Res 2019;17:387-397)
Key Words: Celiac disease; Intestine, small; Morphometry; Image analysis; Histology, quantitative
Received December 18, 2018. Revised March 8, 2019. Accepted March 13, 2019.Correspondence to Prasenjit Das, Department of Pathology, All India Institute of Medical Sciences, Ansari Nagar, New Delhi 110029, India. Tel: +91-11-26594979, Fax: +91-11-26588663, E-mail: [email protected] to Govind K Makharia, Department of Gastroenterology and Human Nutritions, All India Institute of Medical Sciences, Ansari Nagar, New Delhi 110029, India. Tel: +91-11-26564425, Fax: +91-11-26588663, E-mail: [email protected]
ORCID Prasenjit Das (https://orcid.org/0000-0002-2420-8573), Govind K Makharia (https://orcid.org/0000-0002-2474-2194)§Current affiliation: Celiac Disease Research Laboratory, Department of Pediatrics, Università Politecnica delle Marche, Ancona, Italy.
ORIGINAL ARTICLE
Prasenjit Das, et al. • Q-histology in assessment of duodenal biopsies
388 www.irjournal.org
has been observed in differentiating the modified Marsh
grades 3a and 3b with these classification systems.5 Apart
from the visual microscopic assessment techniques, quantita-
tive histological assessment (Q-histology) of intestinal mucosa
has gained acceptance in the recent past.7-10 Although the Q-
histology was introduced in the 1970s, their use, however, re-
mained limited to the research settings only.11 Even with this
limited use, the Q-histology assessment technique evolved
over a period of time and became more straightforward from
older methods of measuring the mucosal surface to volume
ratio, mucosal index (mucosal height to length of muscularis
mucosa) assessment12 and computer card based drawing
technique8 to a more simplified recent protocol of using the
villous height (Vh) to crypt depth (Cd) ratio.9 However, despite
its acceptance and simplification, Q-histology has yet not be-
come the standard for clinical care. One of the reasons being a
lack of a well defined Q-histological classification system
based on quantifiable histology parameters.13
The primary objective of this study was to develop an objec-
tive Q-histological classification system for assessing the mu-
cosal changes in the duodenal biopsies from patients with CeD.
METHODS
1. Ethics StatementAll study procedures were approved by the Institutional Ethi-
cal Committee (IEC/NP-312/2012 & RP-07/2012, dated Octo-
ber 10, 2012) and performed in the study were by the ethical
standards of the institutional research committee and with the
1964 Helsinki declaration and its later amendments or com-
parable ethical standards. Informed consent was obtained
from the subjects included in this study.
2. Derivation CohortDuodenal biopsies from 137 controls including those with
functional dyspepsia (n = 50), subjects undergoing endoscopic
retrograde cholangiopancreatography for common bile duct
stone(s), as well as carriers of HBV infection were included. All
of them underwent appropriate workup for the exclusion of
any organic disease. All of them had negative IgA-anti-tissue
transglutaminase antibody (anti-tTG Ab) titers and had nor-
mal endoscopic findings. Duodenal biopsies from 124 adult
patients with CeD diagnosed as per the European Society of
Pediatric Gastroenterology, Hepatology and Nutrition 2012
criteria, were also included.14 During the execution of this work
as anti-tTG Ab ELISA kits from different manufacturers were
used; for uniformity, we derived anti-tTG antibody fold rise val-
ue, as the (tTG value in a patient÷normal cutoff value for that
particular ELISA kit). During endoscopic examination, 4 to 6
mucosal biopsy fragments were obtained from the post-am-
pulla part of the duodenum.
3. Identifcation of Quantitative Histological Parameters for Diferentiation between Duodenal Biopsies from Controls and Patients with CeD
Digitized images of duodenal biopsies were analyzed by a
pre-calibrated (in micrometer scale) computer assisted image
analysis (CIA) technique based software supplied by the Me-
dia Cybernetics, version 6.1 (Rockville, MD, USA). The follow-
ing parameters were measured in the oriented part of biopsy
fragments: Vh, Cd, epithelial cell height (Eh) at the villous tip,
villous area and number of IELs/100 epithelial cells (ECs) at
the villous tip. The Q-histological assessment was performed
on an average of 4 mucosal biopsy fragments from each sub-
ject, including at least 5 to 15 villi (depending on the biopsy
orientation). CD3 staining of the IELs was done for uniformity
by using the rabbit anti-human CD3 antibody (Spring Biosci-
ences, Pleasanton, CA, US; 1:200) and was detected by a poly-
mer-based secondary detection kit (DAKO, Carpinteria, CA,
USA). The stained IELs were counted by using the manual
tagging tool of the software and expressed as the number of
IELs/100 ECs, after counting at least 2,000 ECs in the upper
one-third of villi. The Vh and Cd were measured by using the
distance measuring tool and the average Cd to Vh ratio was
calculated. The histological parameters which can differenti-
ate a biopsy from patients with CeD and controls were identi-
fied by receiver operating curve (ROC) analysis (Table 1) fol-
lowed by multivariate and logistic regression analyses (Figs. 1,
2). Principal investigators (P.D. and A.S.) performed the CIA-
based analyses in the derivation cohort in a blinded manner.
4. Reprodicibility Assessment of the Quantitative Histological Parameters
We then recruited a new set of validation cohort including bi-
opsies from 120 patients with CeD and 105 controls. The Q-
histological parameters found relevant in the derivation co-
hort were assessed in the validation cohort (Table 2).
5. Formation of a New Quantitative Histological Classification
A new Q-histological classification system for assessment of
duodenal biopsies was derived based on the parameters which

https://doi.org/10.5217/ir.2018.00167 • Intest Res 2019;17(3):387-397
389www.irjournal.org
<doi> • <doi 1>
Tabl
e 1.
Res
ults
of
Quan
titat
ive
Hist
olog
ical
Ass
essm
ent
Perf
orm
ed w
ith A
ll H
istol
ogic
al P
aram
eter
s in
the
Der
ivat
ion
Coho
rt f
or D
iffer
entia
tion
betw
een
Duod
enal
Bio
psie
s fr
om C
ontr
ols
and
Patie
nts
with
CeD
Hist
olog
ical
par
amet
erPa
tient
s w
ith
CeD
(n=1
24)
Cont
rol
(n=1
37)
P-va
lue
AURO
C (%
)O
R Se
nsiti
vity
(%)
Spec
ifici
ty (%
)PP
V (%
)N
PV (%
)
Epith
elia
l cel
l hei
ght (
µm)
37±
6.4
35±
1.9
66.1
(59–
72)
1.00
63.0
(54.
0–71
.4)
60.0
(51.
2–68
.3)
59.7
(50.
9–68
.1)
63.3
(54.
3–71
.6)
≥
35.4
62
.940
.0<
0.00
12.
5 (1
.5–4
.2)
<
35.4
37.0
60
.0<
0.00
1
Villo
us a
rea
(µm
2 )94
3.1
±43
6.2
829.
5±
745.
565
.6 (5
8–72
)1.
0066
.1 (5
7.1–
74.4
)66
.9 (5
8.3–
74.7
)64
.6 (5
5.6–
72.8
) 68
.4 (5
9.8–
76.2
)
≥
750
66.1
33
.10.
007
3.9
(2.3
–6.6
)
<
750
33.8
66.9
<0.
001
IEL
coun
t 45
.9±
19.9
13.4
±8.
193
.7 (9
1–96
)1.
0088
.1 (8
2.6–
92.4
) 87
.0 (8
0.2–
92.1
)90
.1 (8
4.7–
94.0
)84
.5 (7
7.5–
90.0
)
≥
25/1
00 E
Cs88
.113
.0<
0.00
149
.3 (2
5.3–
96.1
)
<
25/1
00 E
Cs11
.886
.9<
0.00
1
Vh (µ
m)
484
±21
22,
108
±81
96.4
(94–
98)
1.00
91.1
(84.
7–95
.5)
90.4
(84.
2–94
.8)
89.7
(83.
0–94
.4)
91.8
(85.
8–95
.8)
<
335
91.1
9.
5<
0.00
197
.1 (4
1.8–
225.
7)
≥
335
8.9
90.4
<0.
001
Cd (µ
m)
238
±86
255
±12
449
.6 (4
2–56
)1.
0051
.6 (4
2.5–
60.7
)51
.5 (4
2.8–
60.1
)49
.2 (4
0.4–
58.1
)53
.8 (4
4.9–
62.6
)
≥
215
51.6
48.3
0.09
01.
13 (0
.6–1
.8)
<
215
48.3
51.4
0.61
0
Cd:V
h ra
tio
1.45
±1.
30.
56±
0.4
88.0
(84–
92)
1.00
81.5
(73.
5–87
.9)
80.0
(72.
3–86
.4)
78.9
(70.
8–85
.6)
82.4
(74.
8–88
.5)
≥
0.66
(1:1
.5)
81.4
20.0
<0.
001
17.5
(9.4
–32.
6)
<
0.66
18.5
80.0
<0.
001
Valu
es a
re p
rese
nted
as
mea
n±
SD o
r per
cent
. Par
enth
eses
sho
w 9
5% C
I.Ce
D, c
elia
c di
seas
e; A
URO
C, a
rea
unde
r the
rece
iver
ope
ratin
g ch
arac
teris
tic; P
PV, p
ositi
ve p
redi
ctiv
e va
lue;
NPV
, neg
ativ
e pr
edic
tive
valu
e; IE
L, in
trae
pith
elia
l lym
phoc
ytes
; ECs
, epi
thel
ial c
ells;
Cd,
cr
ypt d
epth
; Vh,
vill
ous
heig
ht.

Prasenjit Das, et al. • Q-histology in assessment of duodenal biopsies
390 www.irjournal.org
were found significant in both derivation and validation co-
horts in differentiating mucosal biopsies from patients with
CeD and controls (Table 3).
6. Validation of the New Quantitative Histological Classification System
The diagnostic sensitivity and specificity of proposed Q-histol-
ogy classification were examined both in the derivation and
validation cohorts separately, with and without using the anti-
tTG antibody titers.
Intraobserver and interobserver validation: 4 qualified his-
topathologists (G.P.G., M.R., G.K., and A.N.), who were not in-
volved in the derivation process, participated in the validation
process in a blinded manner. A set of randomly selected 50
digitized histological slides of duodenal biopsies, including
both controls and patients with CeD were handed over for Q-
histological reporting using the CIA-based software. The par-
ticipants were allotted different time slots on a single desktop
computer to exclude technical bias. Each observer performed
quantitative analysis twice, keeping a gap of 2 weeks in-be-
tween. Between the 2 cycles, the chronology of the digitized
slides was altered. They were also asked to perform light mi-
croscopic grading of biopsies separately using the modified
Marsh Oberhuber classification, original Marsh classification,
Fig. 1. (A) Showing receiver operating characteristic (ROC) considering pathological cutoff of the IEL count ≥25/100 ECs for differentiat-ing duodenal biopsies from patients with celiac disease and controls, with area under the ROC (AUC) of 93.7% (95% CI, 91.1%–96.1%). (B) ROC considering pathological cutoff of Vh <335 µm, with AUC 96.4% (95% CI, 94.3%–98.5%). (C) ROC considering the pathological cutoff for Cd:Vh ratio ≥0.66, with AUC 88.2% (95% CI, 84.1%–92.3%). (D) ROC considering villous area cutoff at ≥750 µm2, with AUC 65.6% (95% CI, 58.8%–72.4%). IEL, intraepithelial lymphocytes; ECs, epithelial cells; Vh, villous height; Cd, crypt depth.
1.00
0.75
0.50
0.25
0
0 0.25 0.50 0.75 1.00
1-Specificity
Sens
itivi
ty
AUC=0.9370
A1.00
0.75
0.50
0.25
0
0 0.25 0.50 0.75 1.00
1-Specificity
Sens
itivi
ty
AUC=0.9645
B
1.00
0.75
0.50
0.25
0
0 0.25 0.50 0.75 1.00
1-Specificity
Sens
itivi
ty
AUC=0.6566
C
1.00
0.75
0.50
0.25
0
0 0.25 0.50 0.75 1.00
1-Specificity
Sens
itivi
ty
AUC=0.8828
D

https://doi.org/10.5217/ir.2018.00167 • Intest Res 2019;17(3):387-397
391www.irjournal.org
<doi> • <doi 1>
Corrazza and Villanacci classification, and Ensari classifica-
tions in both the occasions. The interobserver and intraob-
server agreements among the observers were estimated and
were compared with those with the existing light microscopic
classifications.
7. Statistical AnalysisA Stata 11 software (StataCorp LP, College Station, TX, USA)
was used. The mean ± SD of all parameters was calculated
separately. For identifying histological parameters with good
discriminative power, 2-sample t-test with equal variances
was used, followed by 2-sample Wilcoxon signed-rank sum
(Mann-Whitney) test. Diagnostic sensitivity and specificities
of each parameter were calculated by ROC analysis, followed
by univariate and multivariate analyses. Logistic regression
analysis was performed with the calculation of OR and 95%
CIs for each parameter. The intraobserver and interobserver
variations were analyzed using McNemar’s test and weighted
kappa analyses. A P-value < 0.05 was taken as statistically sig-
nificant.
RESULTS
1. Characteristics of Subjects Included in the Derivation Cohort
In the derivation cohort, duodenal biopsies from 261 subjects
including 137 adult controls (mean age 32 ± 10.9 years, males
108) and 124 adult patients with CeD (mean age 26.5 ± 13.5
years, males 93) were included. The anti-tTG antibody fold in
the control group and patients with CeD were 0.4 ± 0.6 and
8.5 ± 8, respectively.
2. Quantifiable Histological Parameters Assessed in the Derivation Cohort
1) IEL Counting
The IEL count in duodenal biopsies from patients with CeD
was higher than that in controls (45.9 ± 19.9 vs. 13.4 ± 8.1, P <
0.001). IEL count ≥ 25/100 ECs was found to optimally differ-
entiate between biopsies from patients with CeD and control
with 88% sensitivity and 87% specificity (AUC, 93.7%; 95% CI,
91%–96%) (Table 1, Fig. 1). When the cutoff of IEL increased
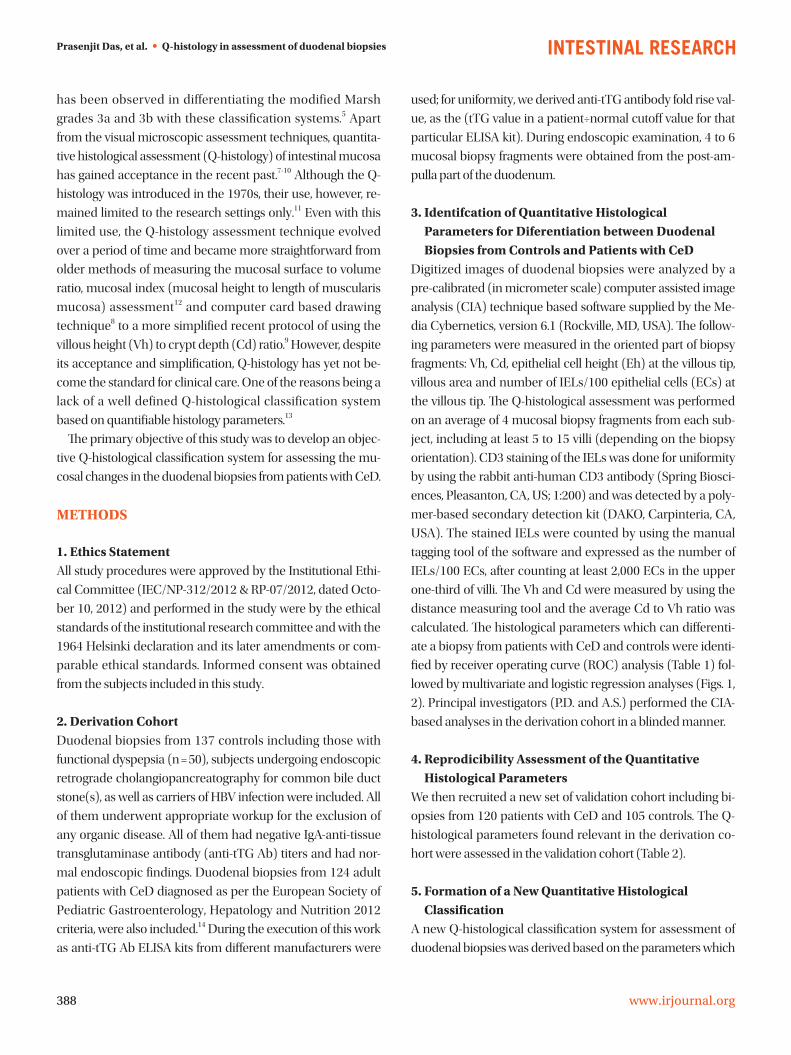
Fig. 2. (A) Photomicrograph shows a villous tip with increased intraepithelial lymphocytes (IELs; arrows) (H&E, ×200). (B) The method of manual tagging of anti-CD3 positive IELs by using the computer assisted image analysis-based software mentioned (immunostaining, ×100). (C) The method of measuring the mucosal epithelial heights at the villous tips (H&E, ×400). (D) Method of measuring the Cd:Vh and the villous areas (H&E, ×10). (E) A duodenal biopsy with increased IELs and Cd:Vh >0.5, hence, categorized as type 2 changes (H&E, ×100). (F) IEL count ≥25/100 ECs, Vh fold change ≤0.7 and Cd:Vh ratio ≥0.5, hence, categorized as type 3 changes (H&E, ×100). The black lines in the D-F are representing the imaginary shoulder of these biopsy fragments. Cd, crypt depth; Vh, villous height; ECs, epithelial cells.
A B C
D E F

Prasenjit Das, et al. • Q-histology in assessment of duodenal biopsies
392 www.irjournal.org
to ≥ 30/100 ECs (as per the Marsh classification), the sensitivi-
ty reduced to 83%, and specificity increased to 94%. When the
IEL cutoff was considered as ≥ 40/100 ECs, the sensitivity
dropped to only 56%, but specificity increased to 99%. The
odds of a suspected case being CeD was 49.3 (P < 0.001) if the
IEL count was ≥ 25 IEL/100 ECs (Table 1, Fig. 1).
2) Villous Height
Vh was significantly lower in patients with CeD, than in con-
trol biopsies (484 ± 212 µm [170–1,520 µm] vs. 2,108 ± 81 µm
[366–3,880 µm], P < 0.001). As determined by the ROC analy-
sis, Vh cutoff < 335 µm was found to have good discriminative
power between the duodenal biopsies of patients with CeD
and controls (sensitivity and specificity of 91% each [AUC
96.4%]) (Fig. 1). The odds of a suspected case to have CeD
was 97.1 (95% CI, 41.8–225.7; P < 0.001), if Vh was < 335 µm
(Table 1).
3) Crypt Depth
There was no significant difference in the Cd in the mucosal
biopsies obtained from controls and patients with CeD (255 ±
124 µm [range, 108–865 µm] vs. 238 ± 86 µm [range, 75–490 µm],
P = 0.09) (Table 1).
4) Cd to Vh Ratio
The mean Cd to Vh ratio in controls was 0.56 ± 0.45 (range,
0.25–5.08) in comparison to 1.45 ± 1.3 (range, 0.32–12.1) in pa-
tients with CeD (P < 0.001). Using the Cd:Vh ratio cutoff > 0.5
(1:2), the biopsies from controls and patients were classified Tabl
e 2.
Res
ults
of Q
uant
itativ
e H
istol
ogic
al A
sses
smen
t Per
form
ed w
ith A
ll H
istol
ogic
al P
aram
eter
s in
the
Valid
atio
n Co
hort
for D
iffer
entia
tion
betw
een
Duod
enal
Bio
psie
s fr
om
Cont
rols
and
Patie
nts
with
CeD
Hist
olog
ical
par
amet
erPa
tient
s w
ith
CeD
(n=1
20)
Cont
rol
(n=1
05)
P-va
lue
AURO
C (%
)O
RSe
nsiti
vity
(%)
Spec
ifici
ty (%
)PP
V (%
)N
PV (%
)
Epith
elia
l cel
l hei
ght
≥29
μm
34.7
±4.
624
.6±
2.9
<0.
001
95.7
(93.
0–98
.0)
45.9
(21.
2–10
0.2)
87.6
(80.
4–92
.9)
86.7
(78.
6–92
.5)
88.3
(81.
2–93
.5)
85.8
(77.
7–91
.9)
Villo
us a
rea
<1,
330
μm2
1,19
8.7
±26
7.9
1,39
5.9
±29
3.7
<0.
300
46.0
(38.
0–54
.0)
1.1
(0.6
–1.8
7)51
.2 (4
2–60
.4)
51.4
(41.
5–61
.3)
54.9
(45.
2–64
.2)
47.8
(38.
3–57
.4)
IEL
coun
t ≥
25/1
00 E
Cs36
.1±
20.2
7.9
±3.
5<
0.00
199
.9 (9
9.0–
100.
0)51
.2 (2
4.8–
99.1
)97
.5 (9
2.9–
99.5
) 10
0.0
(96.
5–10
0.0)
100.
0 (9
6.9–
100.
0)
97.2
(92.
1–99
.4)
Vh <
365
μm37
9.1
±11
6.7
508.
3±
130.
9 <
0.00
186
.2 (4
1.8–
225.
7)39
.4 (1
8.4–
84.1
)86
.8 (7
9.4–
92.2
) 85
.7 (7
7.5–
91.8
)87
.5 (8
0.2–
92.8
) 84
.9 (7
6.6–
91.1
)
Cd:V
h ra
tio ≥
0.66
(1:1
.5)
0.96
±0.
70.
34±
0.3
<0.
001
98.7
(97.
0–10
0.0)
1,49
2.0
(285
.0–7
,539
.0)
96.7
(91.
8–99
.1)
98.1
(93.
2–99
.8)
98.3
(94.
1–99
.8)
96.2
(90.
6–99
.0)
Valu
es a
re p
rese
nted
as
mea
n±
SD. P
aren
thes
es s
how
95%
CI.
CeD,
cel
iac
dise
ase;
AU
ROC,
are
a un
der
the
rece
iver
ope
ratin
g ch
arac
teris
tic; P
PV, p
ositi
ve p
redi
ctiv
e va
lue;
NPV
, neg
ativ
e pr
edic
tive
valu
e; IE
L, in
trae
pith
elia
l lym
phoc
ytes
; ECs
, epi
thel
ial c
ells;
Cd,
cr
ypt d
epth
; Vh,
vill
ous
heig
ht.
Table 3. The Proposed Quantitative Histological Classification for Assessment of Duodenal Mucosal Biopsies
Class Computer image analysis based criteria
Type 0 IEL count <25/100 ECs
Type 1 IEL count ≥25/100 ECs+Vh fold change >0.7+Cd:Vh <0.5
Type 2 IEL count ≥25/100 ECs+Vh fold change ≤0.7 'OR' Cd:Vh ratio ≥0.5
Type 3 IEL count ≥25/100 ECs+Vh fold change ≤0.7+Cd:Vh ratio ≥0.5
IEL, intraepithelial lymphocytes; EC, epithelial cells; Cd, crypt depth; Vh, villous height. Notes: (1) Villous height fold change: calculated by dividing the villous height in a case÷mean villous height in the control population. (2) Type 1 Q histology refers to–early enteropathy changes; type 2–intermediate enteropathy changes; type 3–advanced enteropathy changes. (3) A duodenal biopsy showing IEL count <25/100 ECs irrespective of normal Vh fold change and Cd to Vh ratio or any abnormality of the latter 2 histological parameters should be assigned Q-histology type 0.

https://doi.org/10.5217/ir.2018.00167 • Intest Res 2019;17(3):387-397
393www.irjournal.org
<doi> • <doi 1>
correctly with a sensitivity of 95.1% and specificity of 53.3%. A
Cd:Vh ratio cutoff ≥ 0.66 (1:1.5) identified from the ROC analy-
sis showed the highest sensitivity of 81% and specificity of 80%
(AUC 88%) (Fig. 1). As the lowest estimated Cd:Vh in the con-
trol group of biopsies was 0.25, we then examined the discrim-
inative power of Cd:Vh > 0.25 (1:4); while the sensitivity
reached to 100%, specificity became nil. Our next objective
was to examine the discriminative power of Cd:Vh > 0.33 (1:3),
as was described in the Marsh classification. With this cutoff,
biopsies from patients with CeD and controls were classified
with 99% sensitivity, but specificity was only 11%. Hence, the
highest discriminative sensitivity and specificity was noticed
when the pathological cutoff of Cd:Vh considered ≥ 0.5 (1:2)
(Fig. 1).
5) Surface Eh
Mucosal Eh was 37 ± 6.4 µm (range, 18–58 µm) in biopsies
from patients with CeD and 35 ± 1.9 µm (range, 17–177 µm)
in controls (P < 0.001). On ROC analysis, Eh of ≥ 35.4 µm was
found to have a low discriminative power in differentiating bi-
opsies from controls and that of patients with CeD (sensitivity,
63%; specificity, 60%; AUC, 66.1% [95% CI, 59%–72%]; OR, 2.55)
(Table 1).
6) Villous Area
Duodenal biopsies from patients with CeD were found to
have short and stubby villi with a higher overall villous area
(943.15 ± 436.2 µm2), in comparison to the biopsies from con-
trols (829.5 ± 745.5 µm2) (P = 0.007). Villous area ≥ 750 µm2
was found to discriminate biopsies from patients with CeD
and controls with a sensitivity and specificity of 66% each,
AUC 65.6%, and odds of a suspected case having CeD was
3.94 (P < 0.001) (Table 1, Fig. 1).
3. Assessment of Quantifiable Histological Parameters in a Validation Cohort
The CIA-based Q-histological analyses were repeated in a vali-
dation cohort including duodenal biopsies from 225 subjects
including 105 controls (mean age, 33.8 ± 9.6 years) and 120
patients with CeD (mean age, 28.5 ± 12 years) to re-check the
reproducibility of the histological parameters (Tables 1, 2).
While, the pathological cutoffs for the Eh and villous area dif-
fered widely (cutoff of Eh and cutoff of villous area in deriva-
tion cohort were ≥ 35.4 µm and ≥ 750 µm2; cutoff of Eh and
cutoff of villous area in validation cohort were ≥ 29 µm and
< 1,330 µm2, respectively), rest of the histological parameters,
as Vh, Cd, Cd:Vd correlated well between these cohorts (Ta-
bles 1, 2).
4. Univariate and Multivariate Analysis of the Q-Histological Parameters
Based on univariate analysis of the results of the derivation co-
hort parameters such as IEL count ≥ 25/100 ECs, Vh < 335
µm, Cd:Vh ratio ≥ 0.66, villous area ≥ 750 µm2 and mucosal Eh
of ≥ 35.4 µm were found to be significant in the differentiation
of duodenal mucosal biopsies from controls and patients with
CeD with sensitivity and specificity of 62.9% and 90.4%, re-
spectively (Table 1). Of these, only 3 parameters, namely Vh
< 335 µm, IEL count ≥ 25/100 ECs, and Cd:Vh ratio ≥ 0.66,
were found statistically significant on multivariable analysis.
Finally, these 3 histological parameters were chosen for inclu-
sion in the Q-histology based classification.
5. Logistic Regression Analysis of the Q-Histological Parameters
Based on the coefficients of logistic regression analysis, a his-
tological scoring system was formulated to check their utility
for differentiationg duodenal biopsies from patients with CeD
and controls. The scoring system was as follows:
( IEL count ≥ 25/100 ECs × 3.9)+(Vh < 335 µm × 4.8)+(Cd:Vh
ratio ≥ 0.66 × 2.9)
Total score varied from 0 to 11. This scoring system was then
re-applied on the raw data of derivation cohort including duo-
denal biopsies from 261 subjects. A score of ≥ 6, was found to
discriminate the duodenal biopsies from patients with CeD
and controls with a sensitivity of 90.3% (83.7%–94.9%), speci-
ficity of 93.5% (87.7%–97.2%), positive predictive value (PPV)
93.3% (87.3%–97.1%), negative predictive value 90.6% (84.2%–
95.1%) and AUC 96.2%. In controls, the score was < 6 (P <
0.001). These 3 Q-histological parameters together showed an
area under ROC of 97.4% for discriminating between duode-
nal mucosal biopsies from patients with CeD and controls.
6. Modification of Histological Parameters to Exclude Technical Confounding Factors
While measuring the length between 2 points with the CIA-
based software takes into account pixel density per inch, the
pixel resolution of the camera sensor or the computer screen
used for image analyses can alter the outcome. Hence, we de-
cided to use a single camera for digitization and one computer
terminal for CIA-based analysis. However, as these factors can
vary among different set-ups, we modified the absolute cutoff

Prasenjit Das, et al. • Q-histology in assessment of duodenal biopsies
394 www.irjournal.org
value for Vh to Vh fold change by dividing the mean Vh in du-
odenal biopsies from patients by the average Vh in control bi-
opsies. The IEL counting was based on manual tagging tool of
the software, and the Cd:Vh ratio required no further adjust-
ment. Hence, finally, the following modified histological pa-
rameters were incorporated in the proposed Q-histological
classification system: IEL count ≥ 25/100 ECs, adjusted Vh
fold change ≤ 0.7, Cd:Vh ratio ≥ 0.5.
7. Proposition of a Q-Histological Classification SystemBased on the above mentioned adjusted parameters, we pro-
pose a new Q-histological classification system for classifying
the changes in duodenal biopsies. We classified the biopsies
to be normal (type 0) if IELs count is < 25/100 ECs. We classi-
fied abnormalities in the biopsies as follows: type 1 or early
enteropathic changes: IEL count ≥ 25/100 ECs with normal
Vh fold change > 0.7 and Cd:Vh ratio < 0.5; type 2 or interme-
diate enteropathic changes: IEL count ≥ 25/100 ECs along
with abnormality of any one of the other 2 Q-histology param-
eters, such as the Vh fold change ≤ 0.7 ‘OR’ the Cd:Vh ratio
≥ 0.5; type 3 or advanced enteropathic changes: IEL count
≥ 25/100 ECs along with Vh fold change ≤ 0.7, as well as the
Cd:Vh ratio ≥ 0.5 (Table 3, Fig. 2).
8. Validation of the Newly Proposed Q-histological Classification System
The newly proposed Q-histological classification was reap-
plied on the raw data files of the derivation and validation co-
horts separately. Based on the defined criteria, of 323 duode-
nal biopsies in the derivation cohort, 142 (43.9%) were classi-
fied as Q-histology type 0 (including 120 controls and 22 from
patients with CeD), 11 (3.4%) as Q-histology type 1 (including
7 controls and 4 from patients with CeD), 131 (40.5%) as Q-
histology type 2 (including 10 controls and 121 from patients
with CeD) and 39 (12.07%) as Q-histology type 3 (including 1
control and 38 from patients with CeD). The sensitivity and
specificities of the Q-histology type 1, type 2 and type 3 chang-
es were as follows: type 1: 15.4% and 94.5%, which when com-
bined with the anti-tTG Ab data became 16.7% and 99.2%;
type 2: 84.6% and 92.3%, which when combined with tTG fold
rise value became 82.1% and 99.2%; type 3: 63.3% and 99.2%,
which when combined with tTG value became 64.3% and
100%, respectively. When both the serum tTG titre was high
(both anti-tTG fold rise value > 1 and > 10 times above normal
were considered separately) and either type 1, type 2 or type 3
Q-histological changes, none of the biopsies from patients
with CeD was wrongly classified as biopsies from controls.
Of duodenal biopsies from 225 patients in the validation co-
hort (105 controls and 120 CeD), 108 biopsies (47.7%) were
classified as Q-histology type 0 (all were from controls), 6
(2.6%) as Q-histology type 1 (all 6 were biopsies from patients
with CeD), 33 (14.6%) as Q-histology type 2 (all from patients
with CeD), and 78 biopsies (34.9%) as Q-histology type 3 (all
from patients with CeD). When both Q-histology and serum
tTG titres (both anti-tTG fold rise values > 1 and > 10 were
considered) were abnormal, none of the disease biopsies
were classified as controls in the validation cohort. When both
serum anti-tTG titre was normal and Q-histology was 0, none
of the biopsies were classified as biopsies from CeD. In 3 biop-
sies from patients with CeD, despite being serum anti-tTG ti-
tre high, Q-histology type was 0. Similarly, in 18 control duo-
denal biopsies with normal serum anti-tTG titer Q-histology
analysis showed type 1 changes. Overall sensitivities and
specificities of Q-histology type 1, type 2 and type 3 changes
for diagnosing CeD were 66.7% and 100%; 91.7% and 100%;
96.3%, and 100%, respectively. Adding the tTG fold rise values
did not alter these sensitivities and specificities further. Overall
PPV of Q-histology type 2 changes were 92.6% and 100% in
the derivation, and in validation cohorts respectively. All these
findings show that Q-histological type 2 and 3 changes have
good sensitivities, specificities as well as PPV in identifying ab-
normal intestinal biopsies, which become further specific for
CeD when correlated with serum tTG values.
9. Reproducibility Assessment of the Q-Histology Classification System
The proposed Q-histology classification system showed the
highest intraobserver agreement (69.7%–85.0%) and interob-
server agreement (24.6%–71.5%) in comparison to other exist-
ing histological classification systems (Table 4).
DISCUSSION
After analyzing duodenal biopsies from 486 subjects includ-
ing both controls and patients with CeD, we found that IEL
count ≥ 25/100 ECs, Vh fold change ≤ 0.7, Cd:Vh ratio ≥ 0.5 are
most reliable Q-histological parameters which can differenti-
ate duodenal biopsies from patients with CeD and controls.
The sensitivity, specificity, and PPV of the Q-histological clas-
sification system and better interobserver and intraobserver
agreements suggest that Q-histology based classification is a
better method for the assessment and documentation of duo-

https://doi.org/10.5217/ir.2018.00167 • Intest Res 2019;17(3):387-397
395www.irjournal.org
<doi> • <doi 1>
Table 4. Intraobserver and Interobserver Agreements Using Histological Classification Systems
Intraobserver agreements (based on weighted κ-value)
Interobserver agreements (based on weighted κ-value)
Histological classification systems
Marsh classification2 39.7 to 60.9 12.9 to 48.2
Modified Marsh1 46.6 to 63.7 28.3 to 48.7
Corazza et al.5 54.6 to 84.6 28.04 to 42.9
Ensari6 54.5 to 64.5 28.04 to 42.9
Proposed quantitative histological classification 69.7 to 85.0 24.6 to 71.5
All unit of data is percentage.
denal mucosal biopsies.15-18 We typed the duodenal mucosal
histological changes based on the presence or absence of Q-
histological parameters, as early enteropathy changes (type
1), intermediate enteropathy changes (type 2) and advanced
enteropathy changes (type 3). This typing method of duode-
nal histological changes was however not based on the severi-
ty of Q-histological parameters, as that does not have any im-
pact on patient management and the changes may not follow
a steady pattern in reality. In this Q-histology classification
system, the type 1 change only corresponds to increased IELs
at villous tips; while in type 2 and type 3 changes, there will be
either change in Vh or Vh:Cd or both. This way of graded typ-
ing of the histological changes will increase the likelihood of
identifying the diseases biopsies more confidently, as we have
seen in this study for diagnosing CeD.19-25 Though, we per-
formed CD3 immunostaining for highlighting the IELs (Fig
2B); in routine, it is not essential.25 An experienced pathologist
can identify the IELs and nuclei of ECs differently and can
count easily. The other included parameters as Vh and Cd:Vh
can either be measured by eye-piece reticules or with CIA-
based software, more easily than previously described quanti-
tation methods, as villous tortuosity and villous area,26,27 and
spatiotemporal mucosal changes by in-vivo capsule endosco-
py.3,8,9,28
The Q-histology may prove to be better than the existing
qualitative classification systems because it includes quantifi-
able histological parameters, hence can generate reliable and
comparable data among research groups from different geo-
graphical regions and its ability to provide uniformity in the
interpretation. As a long time is required for visual apprecia-
tion of histological improvement on the qualitative scale, an-
other potential application of the Q-histology based classifica-
tion system is likely to be assessment of even minor changes
in the histology that occur over a shorter period of time espe-
cially during clinical trial of newer drugs such as as latigluten-
ase, zonulin inhibitors, therapeutic vaccines, etc.29 Applicabili-
ty of the modified Marsh classification is not optimum for in-
terpreting follow-up biopsies from patients with CeD on GFD,
because visible changes in Vh or Cd:Vh are slow to take place
and minor changes are difficult to determine visually. Q-his-
tology in such scenario can accurately measure any improve-
ment or deterioration of Vh or Cd:Vh, which can be compared
with baseline biopsy data. The outcome of the Q-histology as-
sessment would depend on the exclusion of the possible con-
founding factors, such as the technical expertise of operators,
adequacy of sampling, biopsy orientation, pixel densities of
the digital camera sensor and the computer screen.29-33 Also,
the Q-histological assessment may be more labor intensive
than the visual light microscopic analysis. While the light mi-
croscopic evaluation with use of eye-piece reticule takes
around 5 minutes, the CIA-based assessment may take ap-
proximately 20 minutes for analyzing a digitized slide. We
took care of the possible confounding factors and tried to jus-
tify why despite being more labor intensive Q-histology can be
valuable.
While there is a merit of this study, there exits a few limita-
tions. Recruitment of entirely healthy subjects for the deriva-
tion of normative histological characteristics was not ethically
justifiable, and hence we recruited subjects with functional
dyspepsia, HBV carriers and patients undergoing endoscopic
retrograde cholangiopancreatography as controls.
In conclusion, this study demonstrates that the Q-histologi-
cal assessment of duodenal biopsy can bring uniformity and
reliability in the histological evaluation of mucosal alterations
in patients with CeD. The Q-histology classification system
has a potential for its use in clinical practice and in assessing
histological response over a short period as required in many
ongoing clinical trials.

Prasenjit Das, et al. • Q-histology in assessment of duodenal biopsies
396 www.irjournal.org
FINANCIAL SUPPORT
The work was supported by the Intramural Research Grant,
All India Institute of Medical Sciences, New Delhi, India (grant
number: A130).
CONFLICT OF INTEREST
No potential conflict of interest relevant to this article was re-
ported.
AUTHOR CONTRIBUTION
Das P conceived idea, received the grant, executed the study &
is the guarantor of the article. Makharia GK managed all pa-
tients and controls, conceived the idea, and performed the
study. Gupta SD designed and executed the study. Ahuja V
supervised the study. Gahlot GP, Singh A, Yadav R, Baloda V,
Rawat R, Verma A recruited the patients, collected data and
work execution. Nalwa A, Roy M, George A, Ashok S, Ramteke
P, Khanna G participated as an observer. Sreenivas V statistical
analyses. Approval of final manuscript: all authors.
ACKNOWLEDGEMENTS
We acknowledge the contribution of staffs of Histopathology
Research Laboratory and Celiac Disease Clinic.
REFERENCES
1. Oberhuber G, Granditsch G, Vogelsang H. The histopathology
of coeliac disease: time for a standardized report scheme for
pathologists. Eur J Gastroenterol Hepatol 1999;11:1185-1194.
2. Marsh MN. Gluten, major histocompatibility complex, and
the small intestine. A molecular and immunobiologic approach
to the spectrum of gluten sensitivity (‘celiac sprue’). Gastroen-
terology 1992;102:330-354.
3. Revised criteria for diagnosis of coeliac disease. Report of
Working Group of European Society of Paediatric Gastroen-
terology and Nutrition. Arch Dis Child 1990;65:909-911.
4. Madan M, Piplani S, Sharma M, Bhasin TS, Manjari M, Kaur
H. Celiac disease: an assessment of subjective variation and
diagnostic reproducibility of the various classification systems.
Glob J Med Res 2015;15(No 1-C):882.
5. Corazza GR, Villanacci V, Zambelli C, et al. Comparison of the
interobserver reproducibility with different histologic criteria
used in celiac disease. Clin Gastroenterol Hepatol 2007;5:838-
843.
6. Ensari A. Gluten-sensitive enteropathy (celiac disease): con-
troversies in diagnosis and classification. Arch Pathol Lab
Med 2010;134:826-836.
7. Cummins AG, Alexander BG, Chung A, et al. Morphometric
evaluation of duodenal biopsies in celiac disease. Am J Gas-
troenterol 2011;106:145-150.
8. Meinhard EA, Wadbrook DG, Risdon RA. Computer card
morphometry of jejunal biopsies in childhood coeliac dis-
ease. J Clin Pathol 1975;28:85-93.
9. Taavela J, Koskinen O, Huhtala H, et al. Validation of morpho-
metric analyses of small-intestinal biopsy readouts in celiac
disease. PLoS One 2013;8:e76163.
10. Kuitunen P, Kosnai I, Savilahti E. Morphometric study of the
jejunal mucosa in various childhood enteropathies with spe-
cial reference to intraepithelial lymphocytes. J Pediatr Gastro-
enterol Nutr 1982;1:525-531.
11. Ciclitira PJ, Evans DJ, Fagg NL, Lennox ES, Dowling RH. Clini-
cal testing of gliadin fractions in coeliac patients. Clin Sci (Lond)
1984;66:357-364.
12. Tulloh EA, Baylis JM, Challacombe DN. Automated analysis
of morphological change in the duodenal mucosa of children
with coeliac disease. Arch Dis Child 1981;56:860-863.
13. Ghoshal UC, Gwee KA. Post-infectious IBS, tropical sprue and
small intestinal bacterial overgrowth: the missing link. Nat Rev
Gastroenterol Hepatol 2017;14:435-441.
14. Husby S, Koletzko S, Korponay-Szabó IR, et al. European Soci-
ety for Pediatric Gastroenterology, Hepatology, and Nutrition
guidelines for the diagnosis of coeliac disease. J Pediatr Gas-
troenterol Nutr 2012;54:136-160.
15. Adelman DC, Murray J, Wu TT, Mäki M, Green PH, Kelly CP.
Measuring change in small intestinal histology in patients
with celiac disease. Am J Gastroenterol 2018;113:339-347.
16. Elli L, Branchi F, Sidhu R, et al. Small bowel villous atrophy:
celiac disease and beyond. Expert Rev Gastroenterol Hepatol
2017;11:125-138.
17. Singh P, Kurray L, Agnihotri A, et al. Titers of anti-tissue trans-
glutaminase antibody correlate well with severity of villous
abnormalities in celiac disease. J Clin Gastroenterol 2015;49:
212-217.
18. Rahmati A, Shakeri R, Sohrabi M, et al. Correlation of tissue
transglutaminase antibody with duodenal histologic marsh
grading. Middle East J Dig Dis 2014;6:131-136.
19. Hammer ST, Greenson JK. The clinical significance of duode-
nal lymphocytosis with normal villus architecture. Arch Pathol

https://doi.org/10.5217/ir.2018.00167 • Intest Res 2019;17(3):387-397
397www.irjournal.org
<doi> • <doi 1>
Lab Med 2013;137:1216-1219.
20. Trejdosiewicz LK. What is the role of human intestinal intraep-
ithelial lymphocytes? Clin Exp Immunol 1993;94:395-397.
21. Veress B, Franzén L, Bodin L, Borch K. Duodenal intraepithe-
lial lymphocyte-count revisited. Scand J Gastroenterol 2004;
39:138-144.
22. Järvinen TT, Collin P, Rasmussen M, et al. Villous tip intraepi-
thelial lymphocytes as markers of early-stage coeliac disease.
Scand J Gastroenterol 2004;39:428-433.
23. Shalimar DM, Das P, Sreenivas V, Gupta SD, Panda SK, Makhar-
ia GK. Mechanism of villous atrophy in celiac disease: role of
apoptosis and epithelial regeneration. Arch Pathol Lab Med
2013;137:1262-1269.
24. Ghosal UC, Das P. Diagnosis of celiac disease. In: Makharia
GK, ed. Handbook of celiac disease. 1st ed. New Delhi: Kon-
tentworx Publications, 2015:63-85.
25. Švajdler M, Daum O, Rychlý B. Diagnosing celiac disease: role
of the pathologists. Int J Celiac Dis 2014;2:70-75.
26. Rosekrans PC, Meijer CJ, Polanco I, Mearin ML, van der Wal
AM, Lindeman J. Long-term morphological and immunohis-
tochemical observations on biopsy specimens of small intes-
tine from children with gluten-sensitive enteropathy. J Clin
Pathol 1981;34:138-144.
27. Boruah D, Bhatia JK, Kamal KD, Malik A. Morphometric chang-
es in jejunal mucosa in HIV positive patients presenting with
enteropathy: an Indian study. Ann Pathol Lab Med 2017;4:
A379-A387.
28. Hegenbart S, Uhl A, Vécsei A. Survey on computer aided deci-
sion support for diagnosis of celiac disease. Comput Biol Med
2015;65:348-358.
29. Hagendorn E, Whitney-Miller C, Huber A, Potts SJ. Develop-
ment of a tissue image analysis algorithm for celiac drug de-
velopment. In: Potts SJ, Eberhard DA, Wharton KA, eds. Meth-
ods in pharmacology and toxicology. New York: Springer, 2015:
141-152.
30. Vécsei A, Amann G, Hegenbart S, Liedlgruber M, Uhl A. Auto-
mated Marsh-like classification of celiac disease in children
using local texture operators. Comput Biol Med 2011;41:313-
325.
31. Ciaccio EJ, Tennyson CA, Lewis SK, Krishnareddy S, Bhagat
G, Green PH. Distinguishing patients with celiac disease by
quantitative analysis of videocapsule endoscopy images.
Comput Methods Programs Biomed 2010;100:39-48.
32. Gottlieb K, Dawson J, Hussain F, Murray JA. Development of
drugs for celiac disease: review of endpoints for Phase 2 and 3
trials. Gastroenterol Rep (Oxf) 2015;3:91-102.
33. Murray JA, Kelly CP, Green PH, et al. No difference between
latiglutenase and placebo in reducing villous atrophy or im-
proving symptoms in patients with symptomatic celiac dis-
ease. Gastroenterology 2017;152:787-798.